Spatiotemporally precise optogenetic activation of sensory neurons in freely walking Drosophila
- Interdepartmental Neuroscience Program, Yale University, United States
- Department of Physics, Yale University, United States
- Department of Molecular, Cellular and Developmental Biology, Yale University, United States
- Department of Neuroscience, Yale University, United States
Figures
Figure 1 with 1 supplement
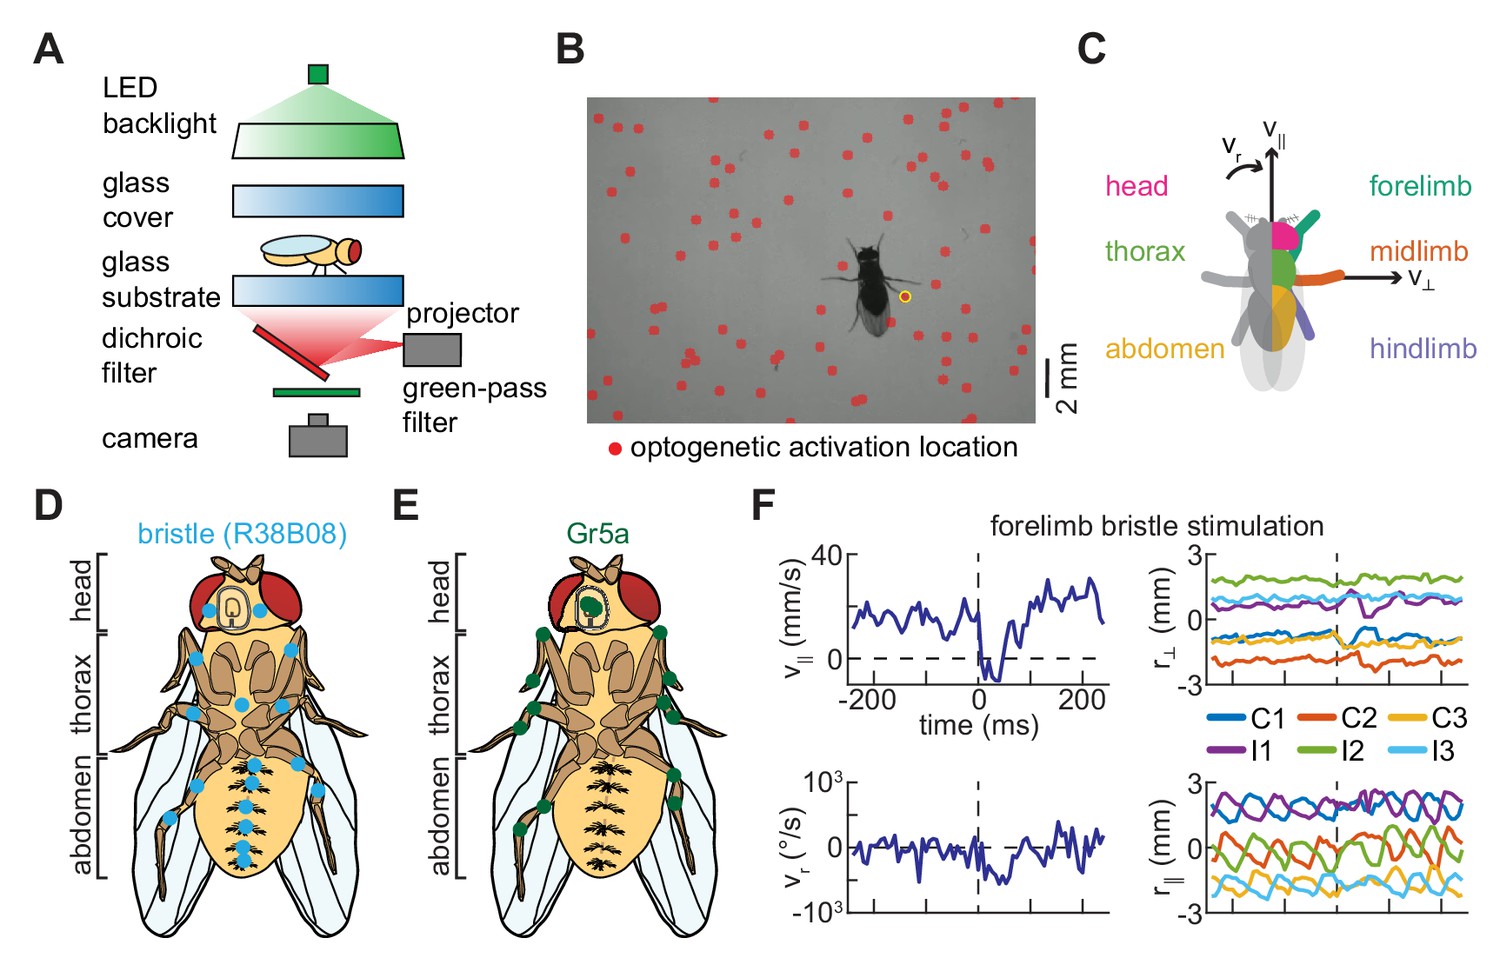
A simple method for spatiotemporally precise optogenetic manipulation in freely walking Drosophila.
(A) Schematic of experimental setup for spatiotemporally precise optogenetic activation (see Materials and methods for details). Flies walk in a circular arena while illuminated from above and tracked from below using a high-speed camera. Localized optogenetic activations are generated using a digital light projector mounted below the arena. (B) Sample video frame showing optogenetic activation localized to a single limb. The spatially patterned stimulus is shown as a red overlay on the image, and the detected activation is circled in yellow. (C) Diagram of grouping of activations, showing the fly from above. Activations on the left and right sides of the body are symmetrized such that all appear on the right. Activations on the body are grouped by whether they hit the head (magenta), thorax (green), or abdomen (yellow) of the fly, while activations on the limbs are grouped by whether they hit the forelimb (teal), midlimb (orange), or hindlimb (purple). Black arrows indicate the three components of body movement: forward walking velocity (), lateral walking velocity (), and heading angular velocity (). (D) Schematic depiction of the distribution of bristle neurons across the limbs and ventral surface of the fly (see Figure 1—figure supplement 1; Tuthill and Wilson, 2016a). (E) Schematic depiction of the distribution of Gr5a-expressing (sweet-sensing) neurons across the limbs and ventral surface of the fly (Dahanukar et al., 2007; Kwon et al., 2014). (F) An example of turning evoked by optogenetic stimulation of forelimb bristles in freely walking flies. The top left panel shows the fly’s forward walking speed as a function of time, the bottom left panel its yaw velocity, the top right panel the positions of its limbs in the direction perpendicular to its body axis, and the bottom right panel the positions of its limbs in the direction parallel to its body axis. In the right panels, C1, C2, and C3 indicate the fore-, mid-, and hind-limbs on the side of the body contralateral to the hit, while I1, I2, and I3 indicate the limbs on the ipsilateral side. See also Figure 1—figure supplement 1.
Figure 1—figure supplement 1
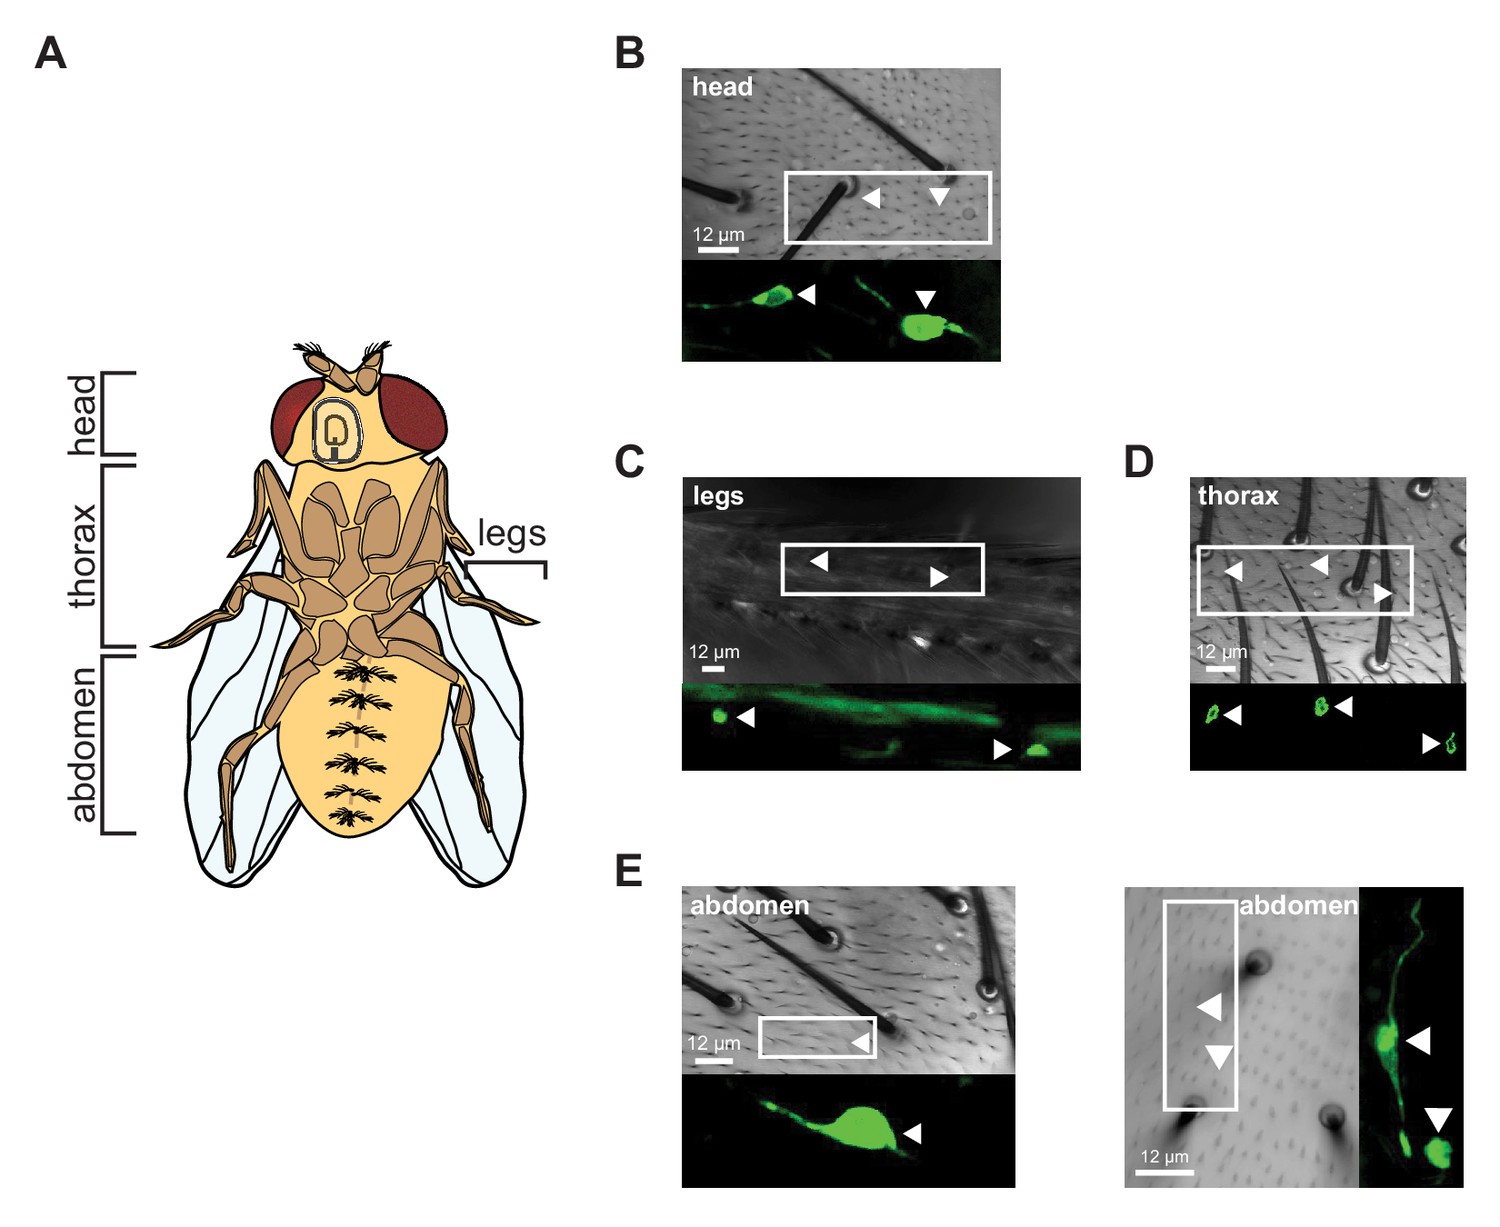
Expression patterns of the R38B08-Gal4 driver in bristle neurons.
(A) Diagram of the ventral surfaces of the fly’s body and limbs. (B) Anatomical image of cuticle on ventral side of fly head, paired with confocal image showing cell bodies (see Materials and methods for details). (C) As in (B), but for a midlimb. (D) As in (B), but for the ventral cuticle on the thorax. (E) As in (B), but for the ventral cuticle on the abdomen.
Figure 2 with 2 supplements
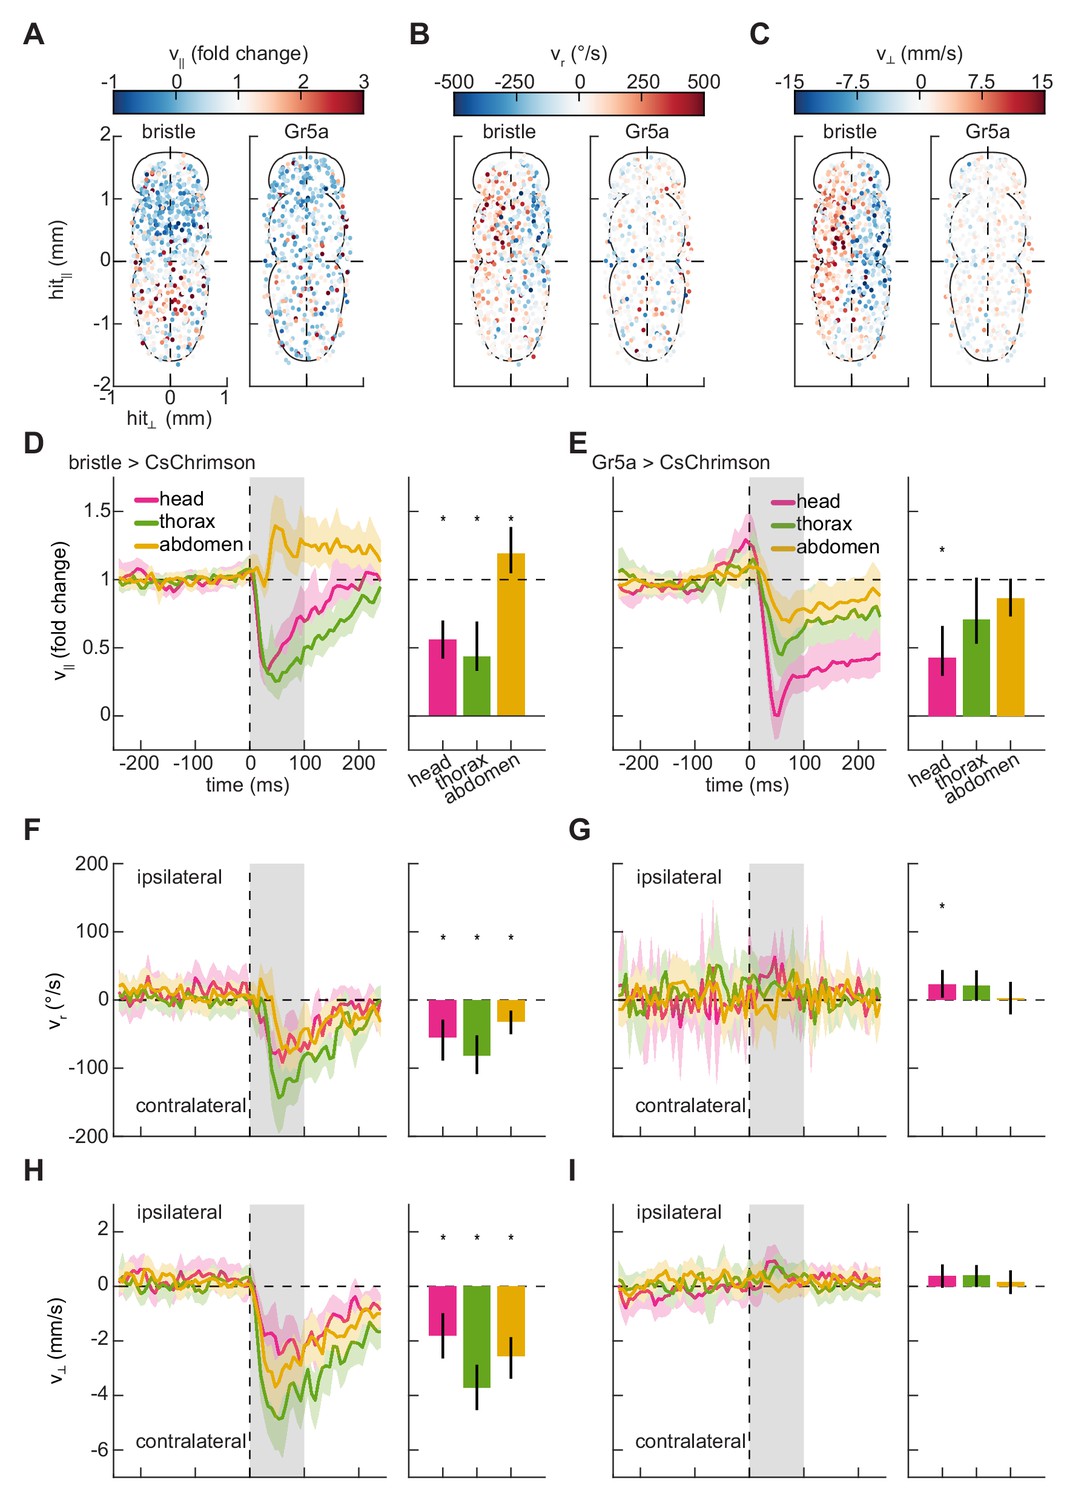
Mapping the responses of freely walking flies to optogenetic stimulation on the body.
(A) Spatial maps of forward velocity responses to localized optogenetic stimulation of flies expressing bristle (left) and Gr5a-neuron (right) drivers at different locations on their bodies. Responses are averaged over the 100 ms following the onset of activation. Positive heading angular velocities and lateral velocities are rightward in this view. N = 785 bristle activations, and N = 568 sweet-sensor activations. (B) As in (A), but for heading angular velocity. (C) As in (A), but for lateral velocity. (D) Fold change in forward velocity as a function of time (left) and averaged over time (right) in response to optogenetic stimulation of bristle neurons on the head, thorax, or abdomen of the fly. At left, the grey patch indicates the window over which responses are averaged to generate the right panel, and error patches show 95% confidence intervals of the mean obtained from bootstrap distributions over activations. At right, black bars show 99% confidence intervals, estimated through bootstrapping, and significance stars show p<0.01 by a bootstrap permutation test against the null hypothesis that average forward velocity after activation is indistinguishable from that before activation. N = 158 head activations, 306 thorax activations, and 321 abdomen activations throughout. (E) As in (D), but for stimulation of flies expressing CsChrimson in Gr5a-neurons. N = 142 head activations, 179 thorax activations, and 247 abdomen activations throughout. (F) As in (D), but for the heading angular velocity of the fly. Positive heading angular velocities are directed towards the side of activation. (G) As in (F), but for stimulation of flies expressing CsChrimson in Gr5a-neurons. (H) As in (D), but for the lateral velocity of the fly. Positive lateral velocities are directed towards the side of activation. (I) As in (H), but for stimulation of flies expressing CsChrimson in Gr5a-neurons. See also Figure 2—figure supplements 1–2.
Figure 2—figure supplement 1
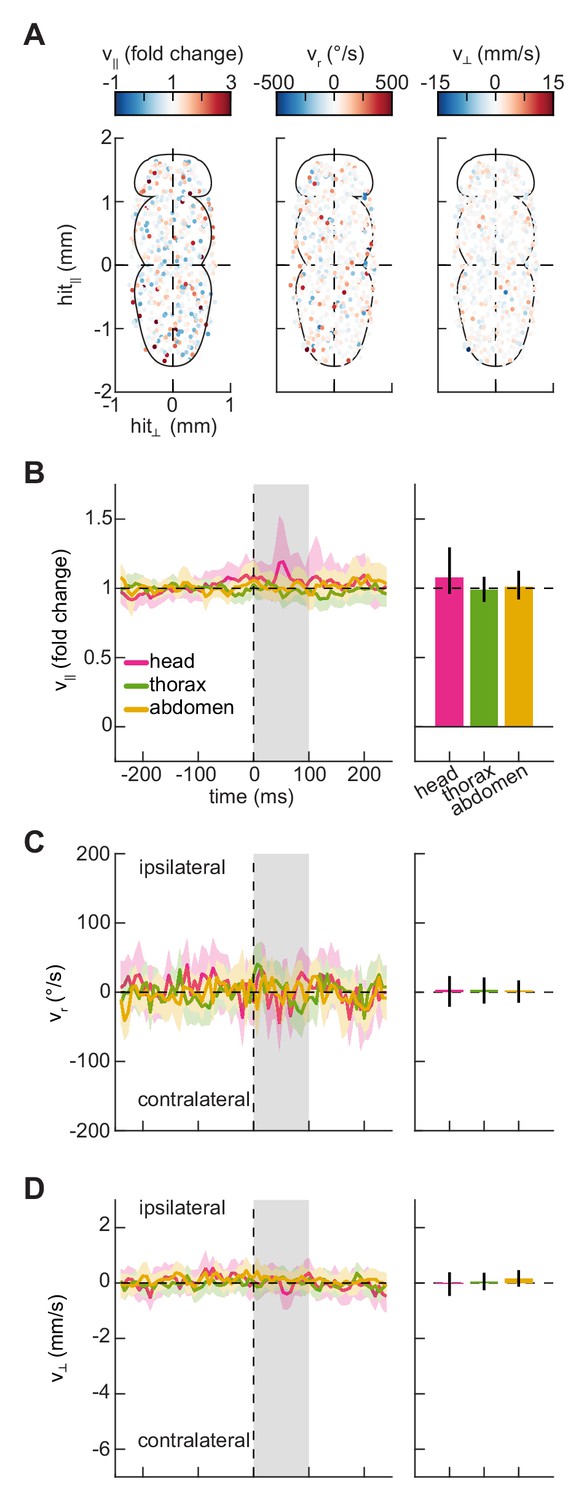
Control flies do not show a significant behavioral response to the optogenetic stimulus.
(A) Spatial maps of forward velocity (left), heading angular velocity (center), and lateral velocity (right) responses to localized optogenetic stimulation at different locations on the bodies of control flies (see Materials and methods). Responses are averaged over the 100 ms following the onset of activation. Positive heading angular velocities and lateral velocities are rightward in this view. N = 634 activations on the fly’s body. (B) Fold change in forward velocity as a function of time (left) and averaged over time (right) in response to optogenetic stimulation on the head, thorax, or abdomen of control flies (see Materials and methods). At left, the grey patch indicates the window over which responses are averaged to generate the right panel, and error patches show 95% confidence intervals of the mean obtained from bootstrap distributions over activations. At right, black bars show 99% confidence intervals, estimated through bootstrapping, and significance stars show p<0.01 by a bootstrap permutation test against the null hypothesis that average forward velocity after activation is indistinguishable from that before activation. N = 130 head activations, 209 thorax activations, and 295 abdomen activations throughout. The small response to head activation may be a weak startle response from directly hitting the fly’s eyes with red light. (C) As in (B), but for the heading angular velocity of the fly. Positive heading angular velocities are directed towards the side of activation. (D) As in (B), but for the lateral velocity of the fly. Positive lateral velocities are directed towards the side of activation.
Figure 2—figure supplement 2
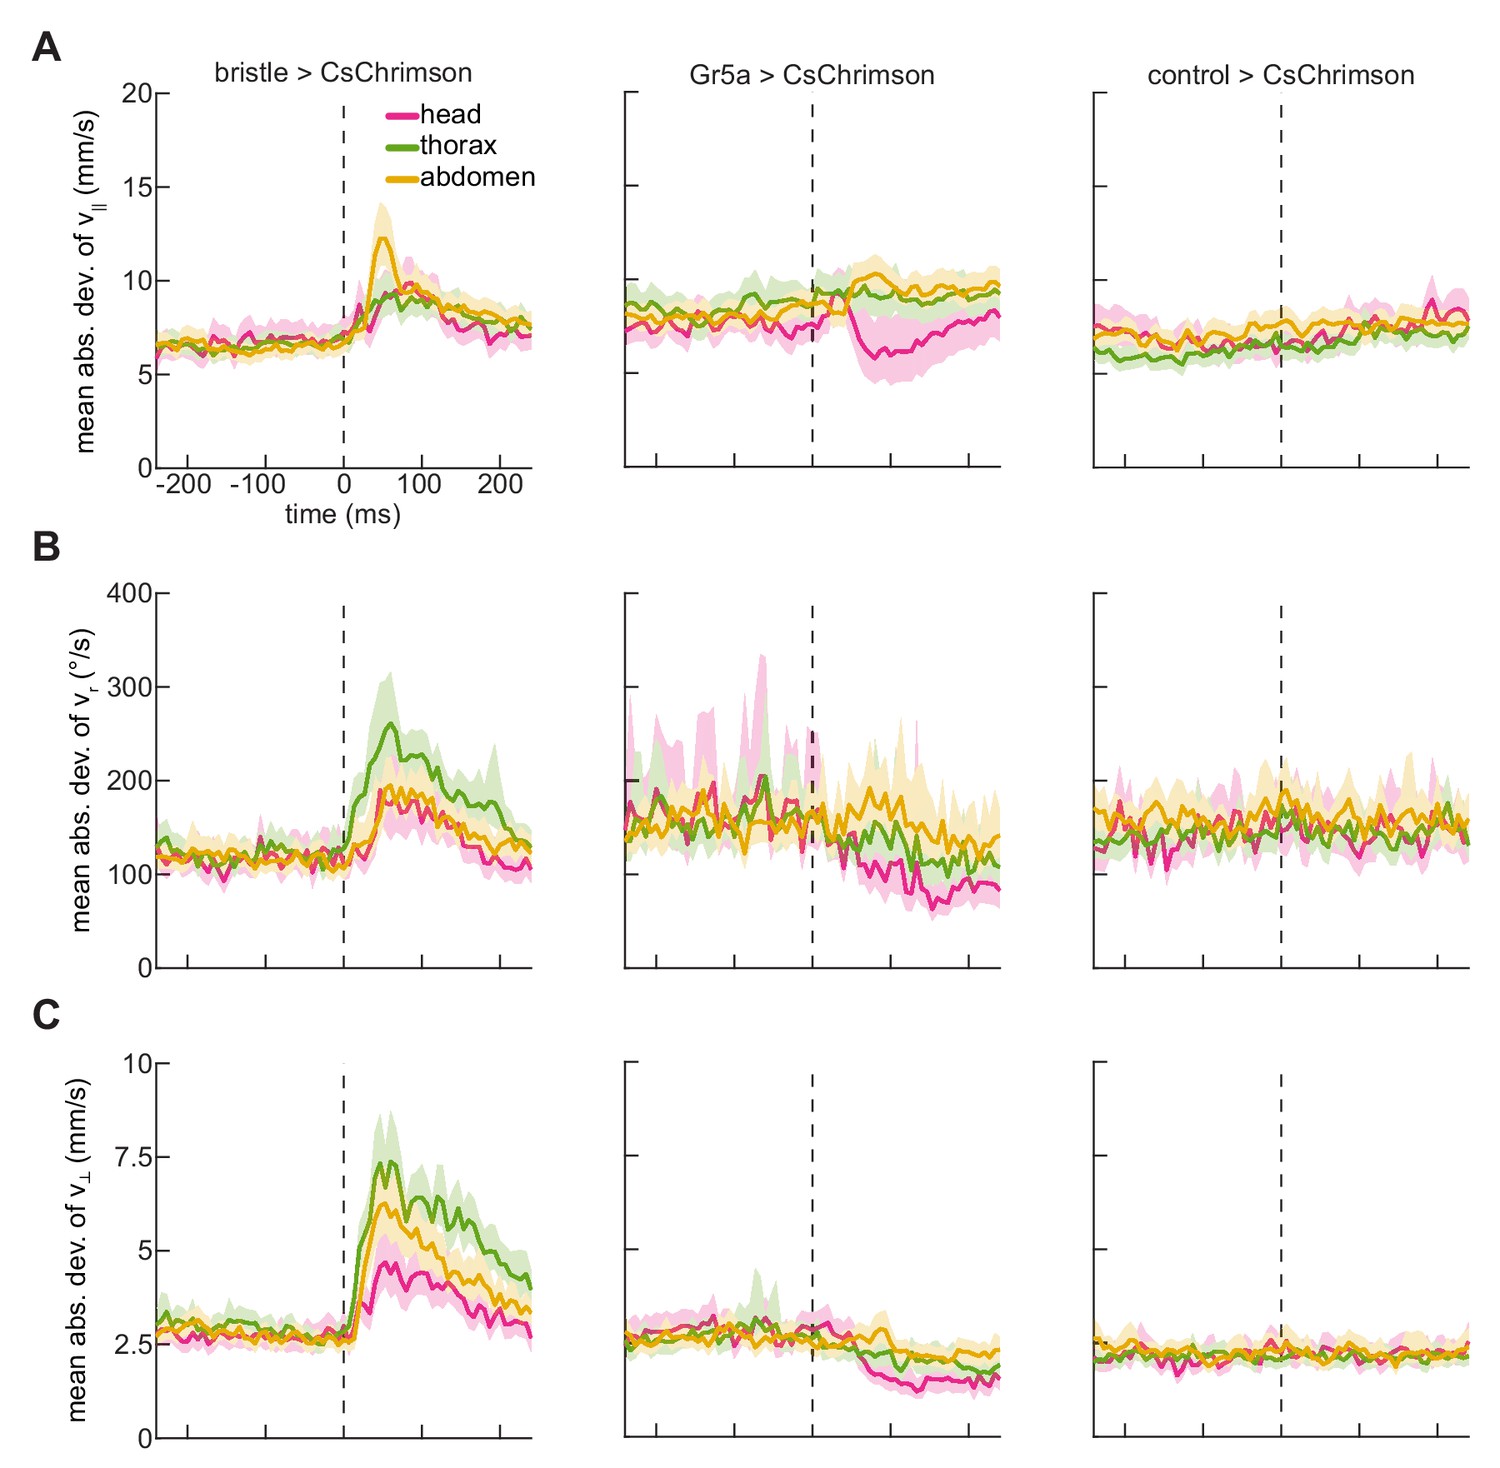
Localized optogenetic stimulation on the body of the fly alters the variability in its walking kinematics.
(A) Timeseries of mean absolute deviation of the forward velocity of bristle neuron (left), sweet-sensing neuron (center), or control (right) flies after stimulation on their head, thorax, or abdomen. Error patches show 95% confidence intervals of the mean absolute deviation obtained from bootstrap distributions over activations. Sample sizes are as in Figure 2 and Figure 2—figure supplement 1. (B) As in (A), but for the heading angular velocity of the fly. (C) As in (A), but for the lateral velocity of the fly.
Figure 3 with 3 supplements
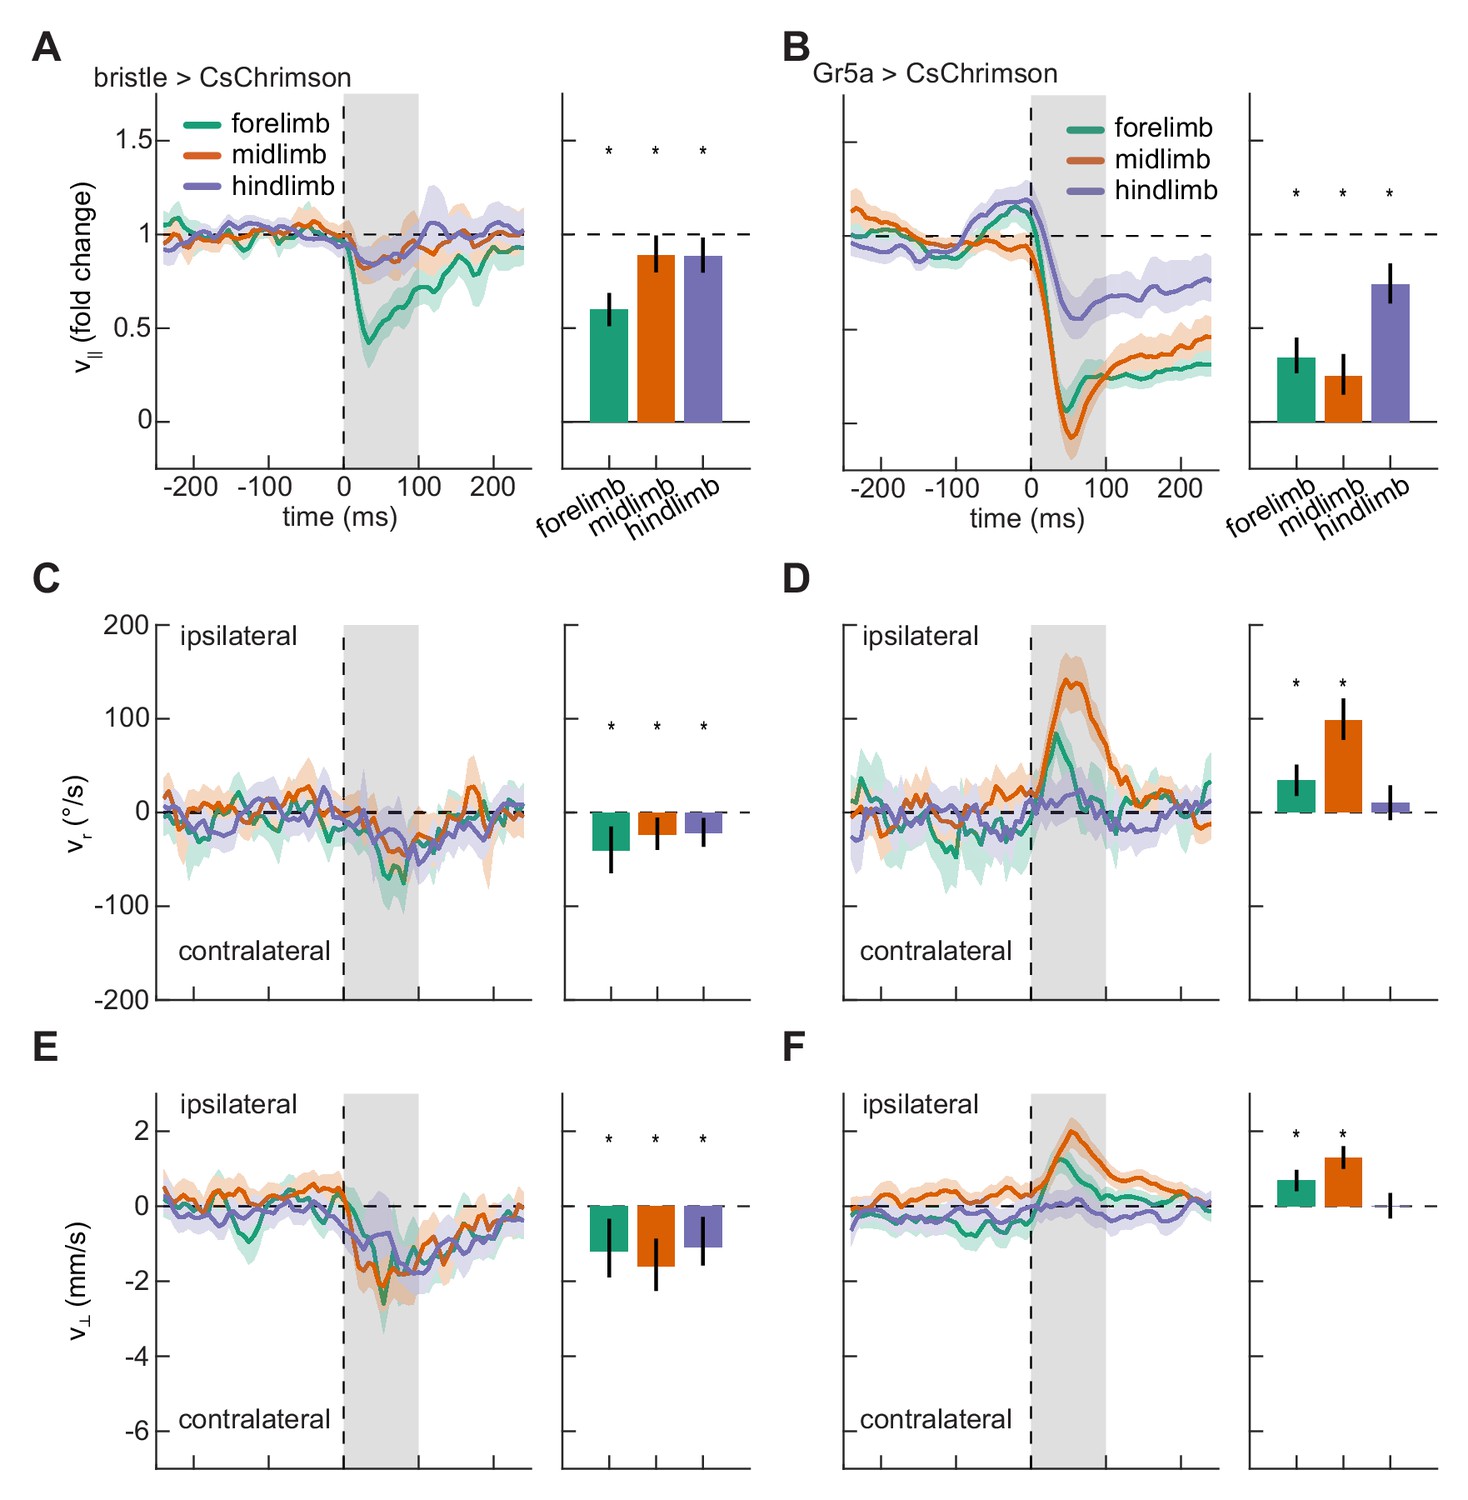
Localized activation of bristle and sweet-sensing neurons evokes opposing limb-specific responses.
(A) Fold change in forward velocity as a function of time (left) and averaged over time (right) in response to optogenetic stimulation of bristle neurons on the forelimb, midlimb, or hindlimb of the fly. At left, the grey patch indicates the window over which responses are averaged to generate the right panel, and error patches show 95% confidence intervals of the mean obtained from bootstrap distributions over activations. At right, black bars show 99% confidence intervals, estimated through bootstrapping, and significance stars show p<0.01 by a bootstrap permutation test against the null hypothesis that average forward velocity after activation is indistinguishable from that before activation. N = 285 forelimb activations, 329 midlimb activations, and 324 hindlimb activations throughout. (B) As in (A), but for stimulation of sweet-sensing neurons. N = 307 forelimb activations, 508 midlimb activations, and 379 hindlimb activations throughout. (C) As in (A), but for the heading angular velocity of the fly. Positive heading angular velocities are directed towards the side of activation. (D) As in (C), but for stimulation of sweet-sensing neurons. (E) As in (A), but for the lateral velocity of the fly. Positive lateral velocities are directed towards the side of activation. (F) As in (E), but for stimulation of sweet-sensing neurons. See also Figure 3—figure supplements 1–3 and Video 1.
Figure 3—figure supplement 1
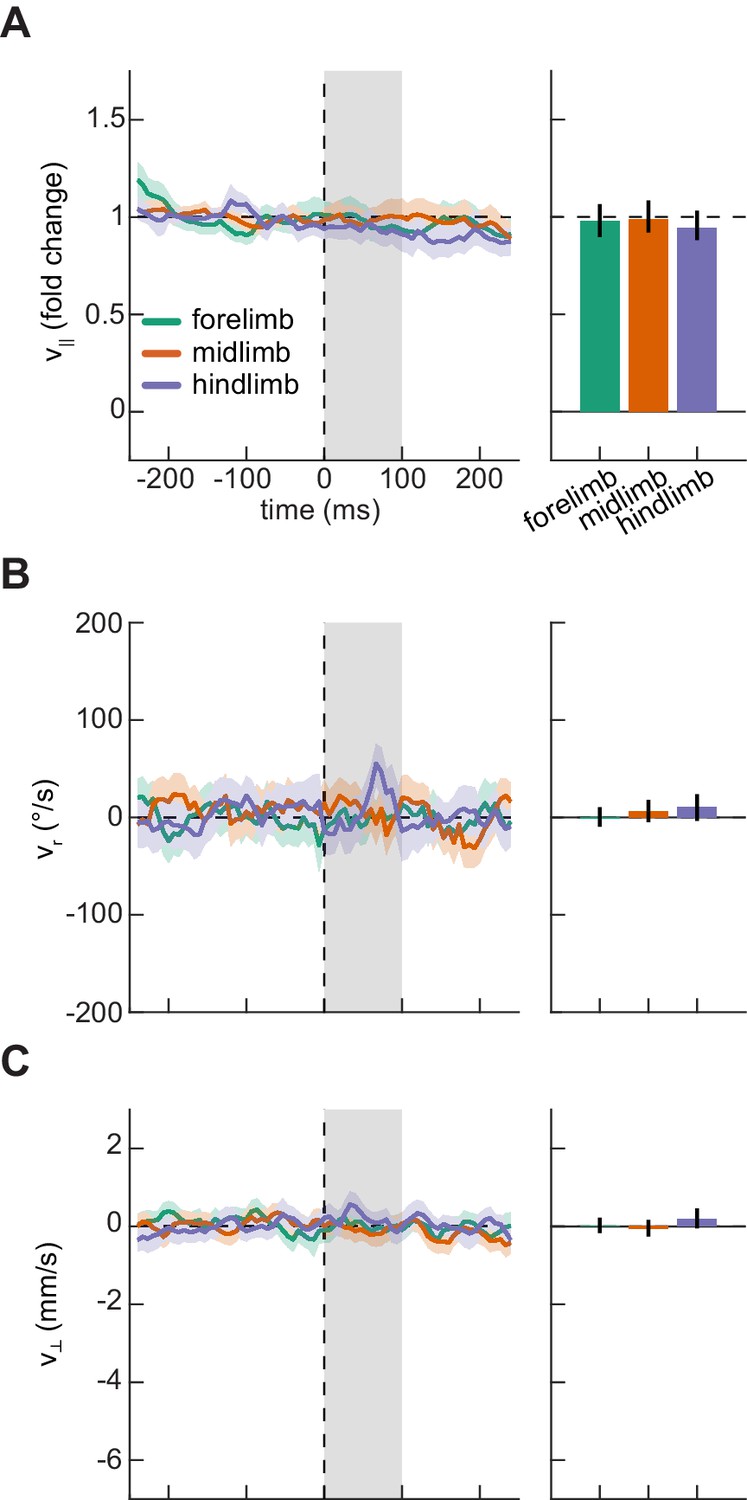
Control flies do not show a significant behavioral response to optogenetic stimulation on their limbs.
(A) Fold change in forward velocity as a function of time (left) and averaged over time (right) in response to optogenetic stimulation on the forelimb, midlimb, or hindlimb of control flies (see Materials and methods). At left, the grey patch indicates the window over which responses are averaged to generate the right panel, and error patches show 95% confidence intervals of the mean obtained from bootstrap distributions over activations. At right, black bars show 99% confidence intervals, estimated through bootstrapping, and significance stars show p<0.01 by a bootstrap permutation test against the null hypothesis that average forward velocity after activation is indistinguishable from that before activation. N = 389 forelimb activations, 462 midlimb activations, and 446 hindlimb activations throughout. (B) As in (A), but for the heading angular velocity of the fly. Positive heading angular velocities are directed towards the side of activation. (C) As in (A), but for the lateral velocity of the fly. Positive lateral velocities are directed towards the side of activation.
Figure 3—figure supplement 2
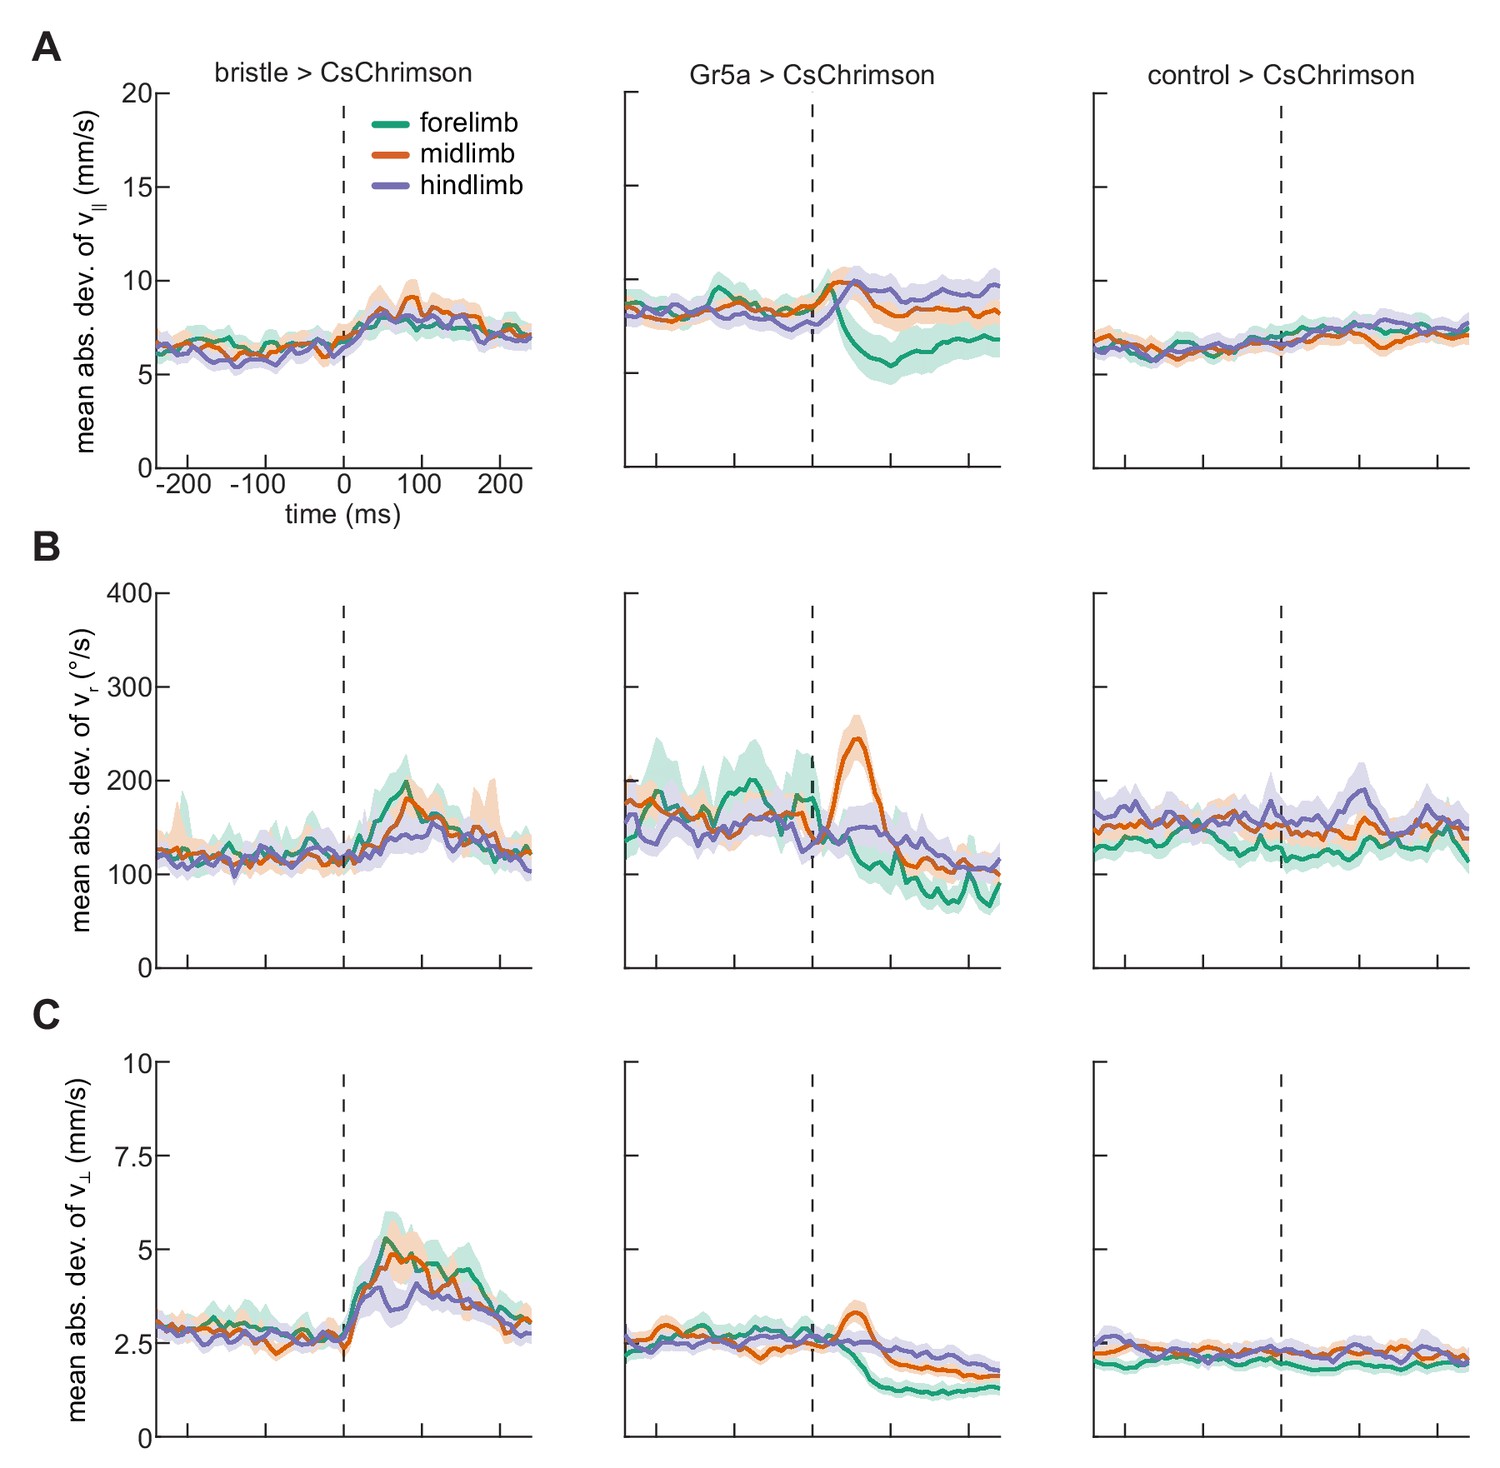
Localized optogenetic stimulation on the limbs of the fly alters the variability in its walking kinematics.
(A) Timeseries of mean absolute deviation of the forward velocity of bristle neuron (left), sweet-sensing neuron (center), or control (right) flies after stimulation on their forelimb, midlimb, or hindlimb. Error patches show 95% confidence intervals of the mean absolute deviation obtained from bootstrap distributions over activations. Sample sizes are as in Figure 3 and Figure 3—figure supplement 1. (B) As in (A), but for the heading angular velocity of the fly. (C) As in (A), but for the lateral velocity of the fly.
Figure 3—figure supplement 3
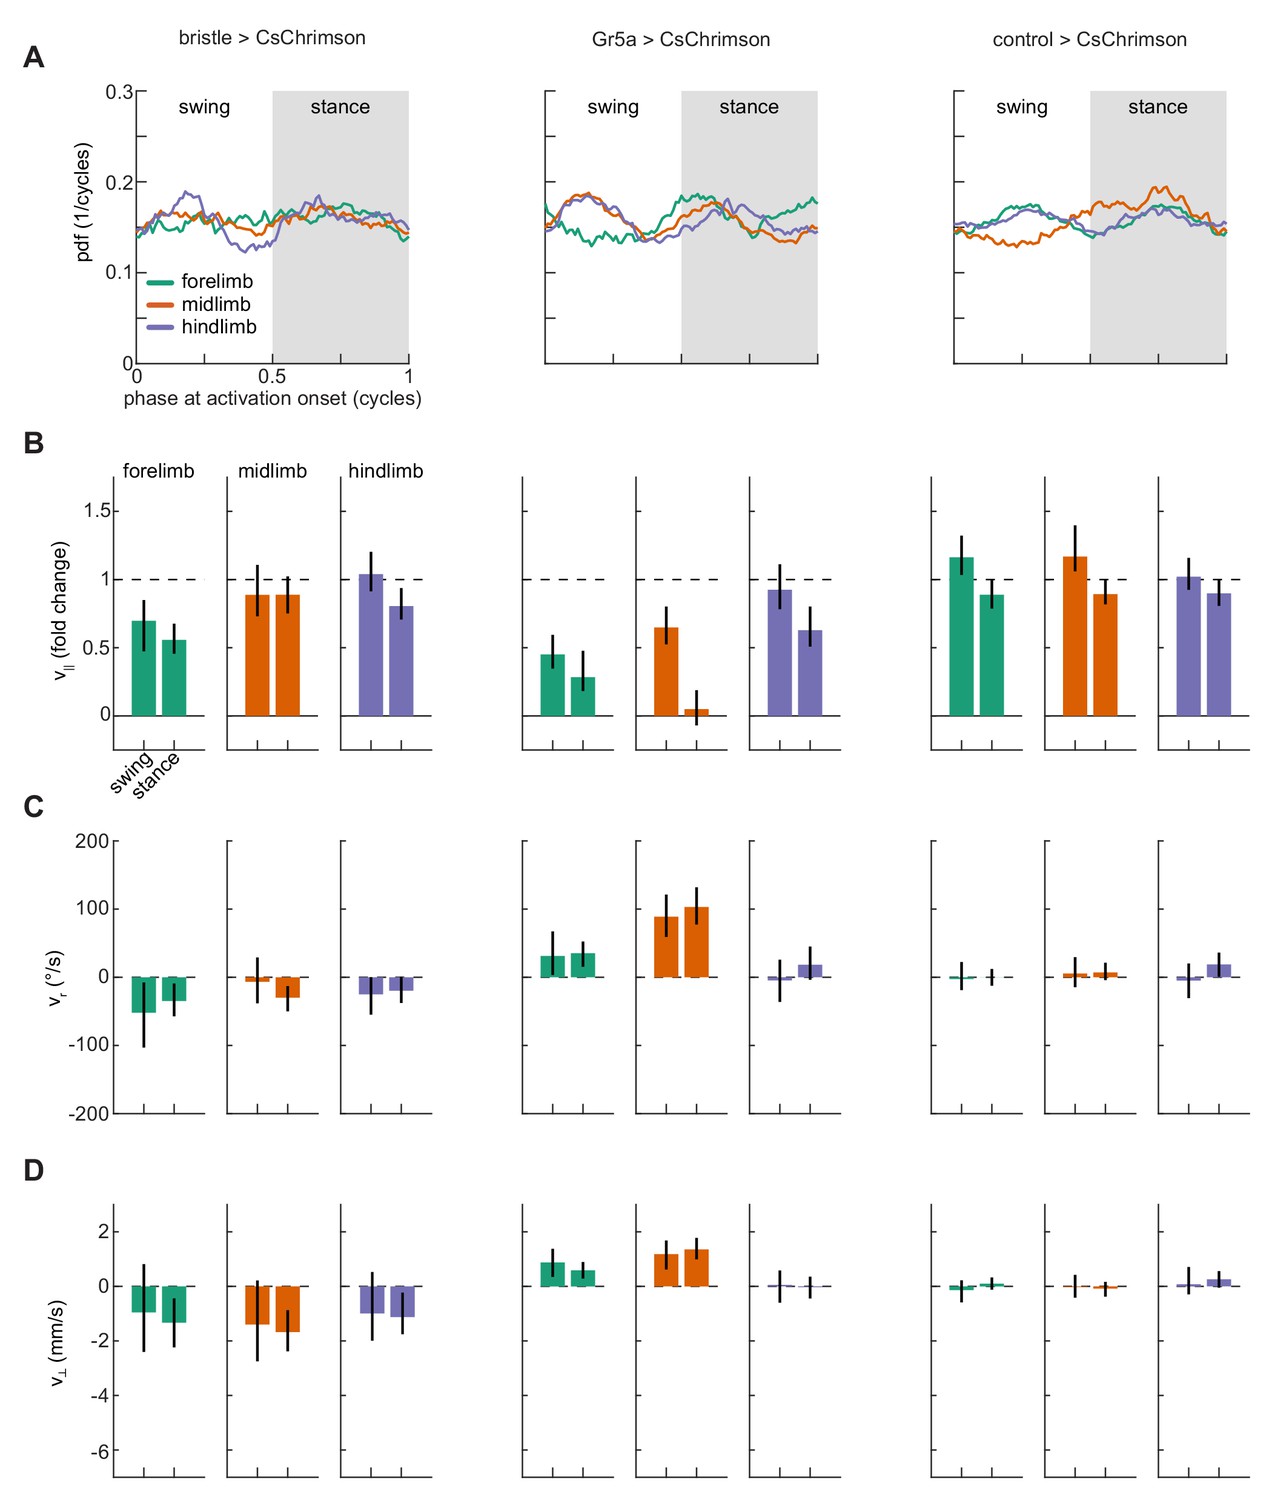
Responses conditioned on whether the stimulated limb was in swing or stance phase.
(A) Distributions of instantaneous phase at the onset of stimulation of forelimbs, midlimbs, or hindlimbs in bristle neuron (left), sweet-sensing neuron (center), or control (right) flies. The shaded grey area indicates the interval of instantaneous phases corresponding to stance phase. Sample sizes are as in Figure 3 and Figure 3—figure supplement 1. (B) Mean fold change in forward velocity after optogenetic stimulation of the forelimbs (green), midlimbs (orange), or hindlimbs (purple), conditioned on whether the stimulated limb was in swing or stance phase at the onset of stimulation. Black bars show 99% confidence intervals, estimated through bootstrapping. For bristle stimulation, N = 90 forelimb hits during swing, N = 195 forelimb hits during stance, N = 94 midlimb hits during swing, N = 235 midlimb hits during stance, N = 109 hindlimb hits during swing, and N = 215 hindlimb hits during stance. For forelimb bristle stimulation, N = 90 and 195 hits during swing and stance, respectively; for midlimb stimulation N = 94 and 235; and for hindlimb stimulation N = 109 and 215. For forelimb sweet-sensor stimulation, N = 109 and 198 hits during swing and stance, respectively; for midlimb stimulation N = 165 and 343; and for hindlimb stimulation N = 130 and 249. For control forelimb stimulation, N = 128 and 261 hits during swing and stance, respectively; for midlimb stimulation N = 157 and 305; and for hindlimb stimulation N = 159 and 287. (C) As in (B), but for the heading angular velocity. (D) As in (B), but for the lateral velocity.
Figure 4 with 2 supplements
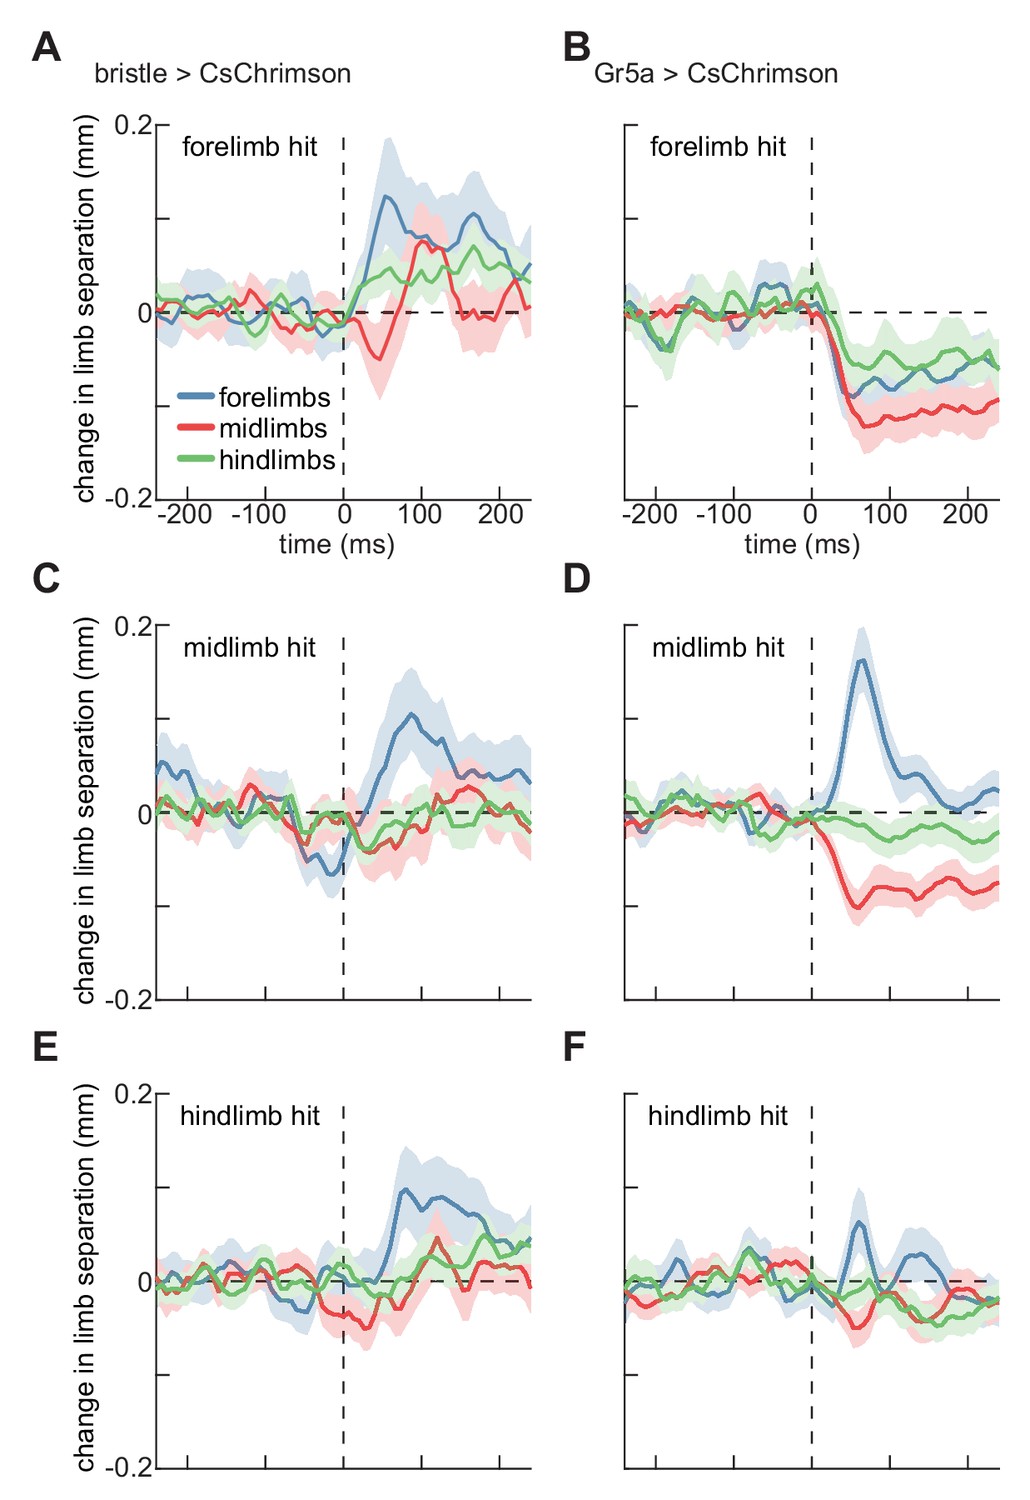
Localized optogenetic stimulation evokes changes in walking geometry.
(A) Timeseries of change in Euclidean distance between contralateral limbs before and after activation of bristle neurons on the forelimb. Error patches show 95% confidence intervals of the mean, estimated through bootstrapping (N = 285 activations). (B) As in (A), but for activation of sweet-sensing neurons (N = 307 activations). (C) As in (A), but for activations on the fly’s midlimb (N = 329 activations). (D) As in (C), but for activation of sweet-sensing neurons (N = 508 activations). (E) As in (A), but for activations on the fly’s hindlimb (N = 324 activations). (F) As in (E), but for activation of sweet-sensing neurons (N = 379 activations). See also Figure 4—figure supplements 1–2.
Figure 4—figure supplement 1
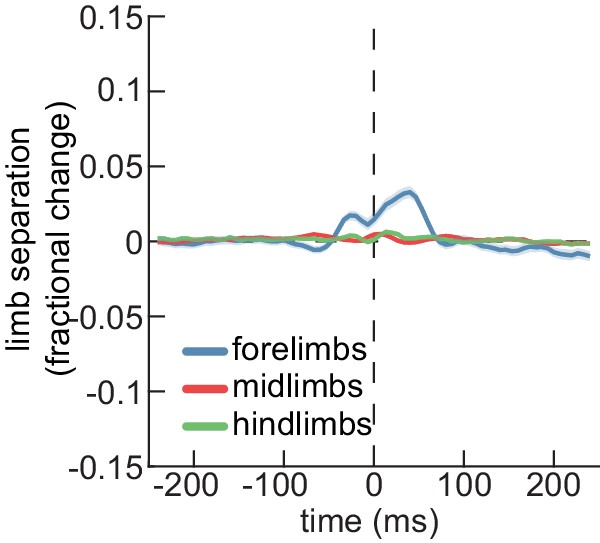
Limb separation changes during spontaneous turning.
Fractional change in separation between contralateral limb pairs as a function of time relative to a spontaneous turn (with peak heading angular velocity at time zero). Forelimb separation is shown in blue, midlimb separation in red, and hindlimb separation in green. Error patches show 95% confidence intervals of the mean obtained from bootstrap distributions over identified turns. N = 11,852 spontaneous turns; data from DeAngelis et al. (2019).
Figure 4—figure supplement 2
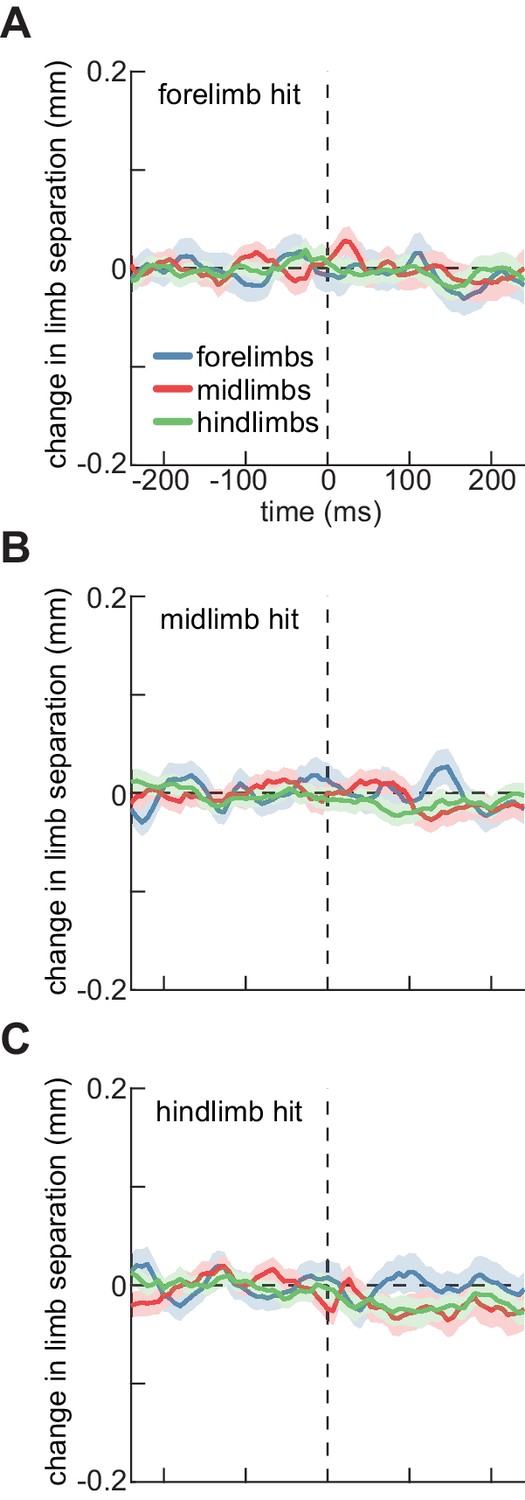
Control flies do not show significant changes in the separation of contralateral limbs.
(A) Timeseries of change in Euclidean distance between contralateral limbs before and after stimulation of control flies on their forelimbs. Error patches show 95% confidence intervals of the mean, estimated through bootstrapping (N = 389 activations). (B) As in (A), but for activations on the fly’s midlimb (N = 462 activations). (C) As in (A), but for activations on the fly’s hindlimb (N = 446 activations).
Videos
Video 1
Movie showing example responses to optogenetic stimulation of bristle neurons on each of the fly’s limbs.
Red circles indicate the location of the activation in space and time.
Tables
Table 1
Experimental strains.
| Description | Genotype | Use | Figures |
|---|---|---|---|
| CsChrimson Control | +; +; UAS-CsChrimson | Control | Figure 2—figure supplements 1, 2, Figure 3—figure supplements 1, 2, 3, Figure 4—figure supplement 2 |
| Bristle > CsChrimson | +; +; R38B08-Gal4/UAS-CsChrimson | Bristle activation | Figures 2, 3, 4 |
| Gr5a > CsChrimson | +; Gr5a-Gal4/ +; UAS-GFP/UAS-CsChrimson | Gr5a activation | Figures 2, 3, 4 |
Table 2
Experimental groups.
| Description | Number of recording sessions | Total fly count | Stimulus duration | Interleave duration |
|---|---|---|---|---|
| CsChrimson Control | 3 | 45 | 30 ms | 0.5 s |
| Bristle > CsChrimson | 5 | 75 | 10 ms | 0.5 s |
| Gr5a > CsChrimson | 5 | 67 | 30 ms | 1 s |
Additional files
Download links
A two-part list of links to download the article, or parts of the article, in various formats.
Downloads (link to download the article as PDF)
Open citations (links to open the citations from this article in various online reference manager services)
Cite this article (links to download the citations from this article in formats compatible with various reference manager tools)
Spatiotemporally precise optogenetic activation of sensory neurons in freely walking Drosophila
eLife 9:e54183.
https://doi.org/10.7554/eLife.54183


