Underground isoleucine biosynthesis pathways in E. coli
- Max Planck Institute of Molecular Plant Physiology, Germany
- Max Planck Institute for Terrestrial Microbiology, Germany
- LOEWE Research Center for Synthetic Microbiology (SYNMIKRO), Germany
Figures
Figure 1

Metabolic routes for 2-ketobutyrate biosynthesis.
A wide variety of pathways support the production of 2-ketobutyrate, an essential intermediate in the production of isoleucine. Outlined are five known, physiologically relevant 2-ketobutyrate synthesis pathways and two additional pathways we identified in this paper (marked in blue). The purple font indicates the key enzymes of the novel 2-ketobutyrate production pathways in vivo. Note, the pathways are represented in shorthand between identifiable intermediates and do not show each metabolic step.
Figure 2
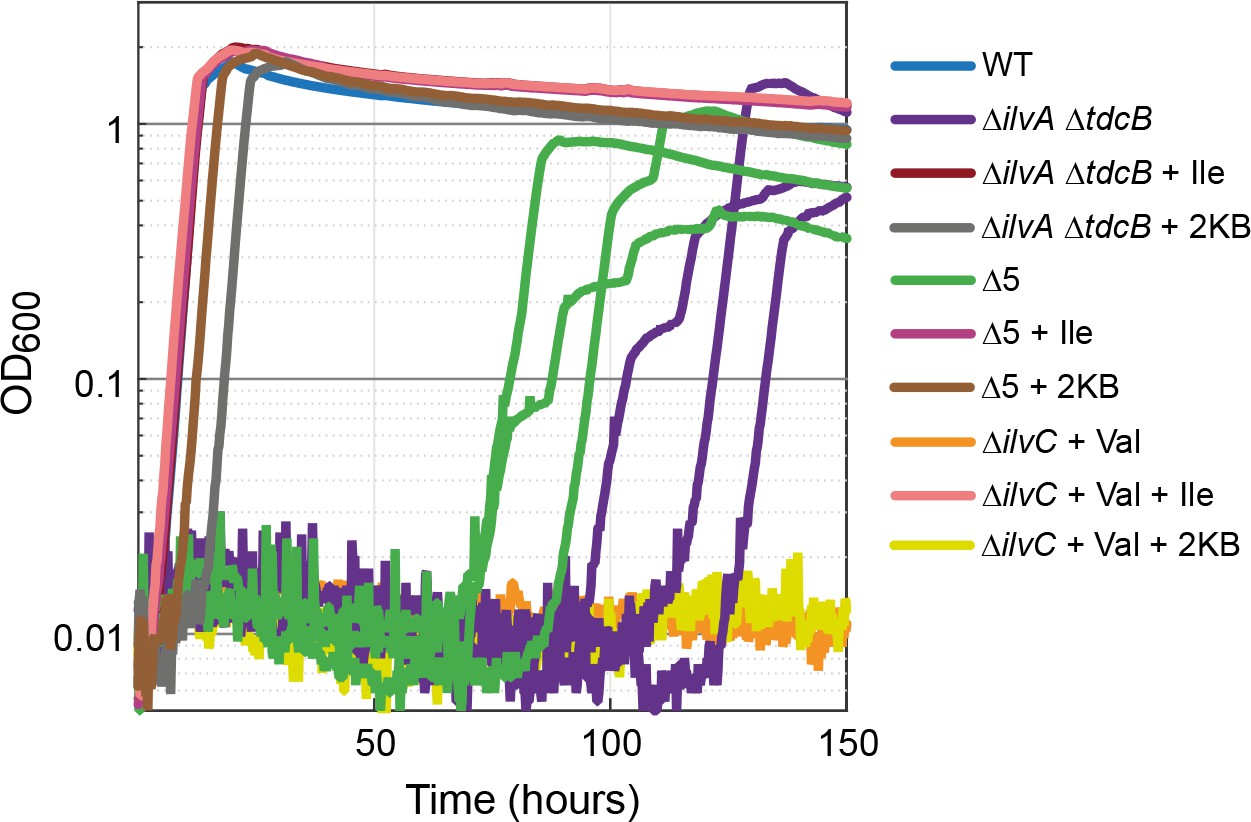
Strains lacking threonine deaminases adapt to generate isoleucine under aerobic conditions.
Strains deleted in threonine deaminases (∆ilvA ∆tdcB) or threonine deaminases and serine deaminases (∆5, i.e. ∆ilvA ∆tdcB ∆sdaA ∆sdaB ∆tdcG) grew on minimal medium with 10 mM glucose after approx. 70 hr. Strains deleted in ketol-acid reductoisomerase (∆ilvC, an enzyme downstream of 2 KB in isoleucine biosynthesis) could not grow (valine supplied to relieve a second auxotrophy), indicating a metabolic leak at the level of 2 KB. All experiments were performed in technical triplicates in a 96-well plate reader. For the ∆ilvA ∆tdcB and ∆5 strains, cultivated without isoleucine (purple and green lines), replicates are shown individually. In all other cases, replicates showed an identical growth profile (±5%) and hence are represented by a single curve. Experiments were repeated on three separate occasions for all growth experiments shown. Isoleucine, 2-ketobutyrate, and valine were added at 2 mM where indicated.
Figure 3
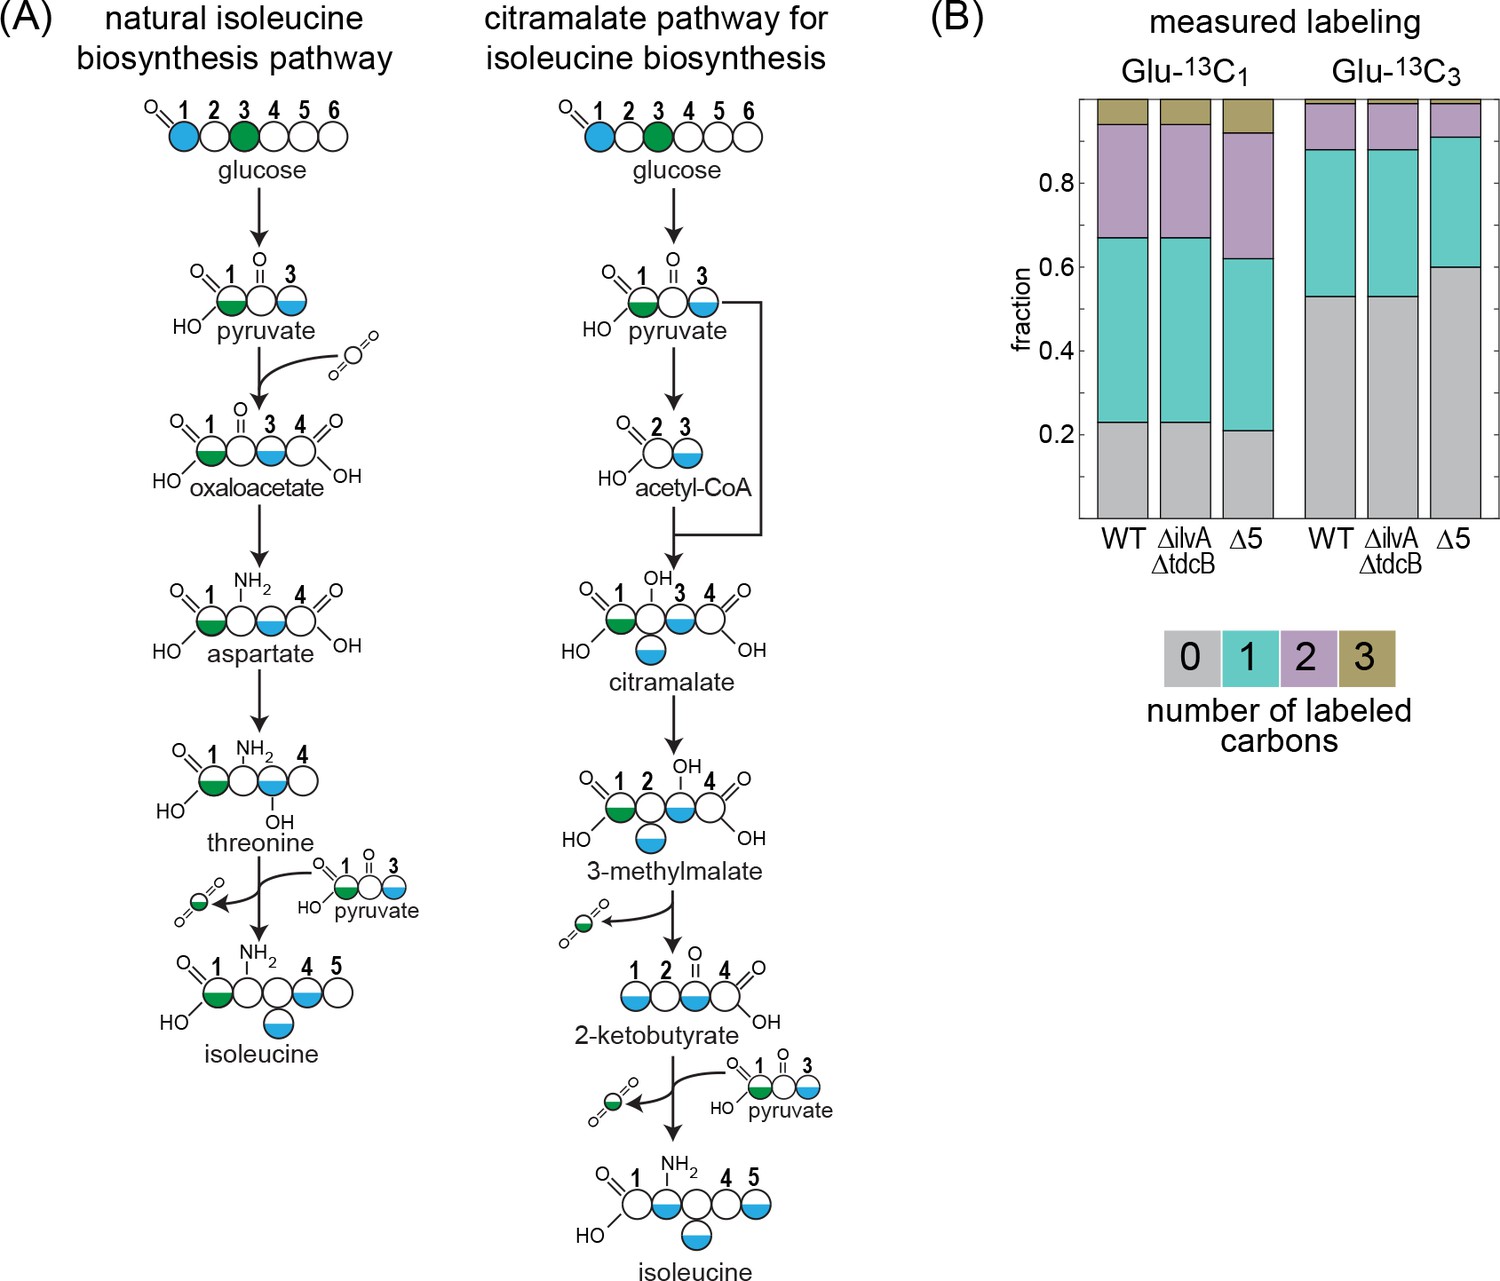
13C-labeling of isoleucine rules out the citramalate pathway.
Labeling of proteinogenic amino acids was analyzed after the growth of E. coli on labeled glucose-1-13C or glucose-3-13C as a sole carbon source. (A) Schematic representation of predicted labeling of isoleucine with the natural isoleucine biosynthesis pathway of E. coli (left) or with the citramalate pathway (right). Blue coloring highlights predicted labeling when grown on glucose-1-13C and green coloring when grown on glucose-3-13C. (B) Observed labeling pattern. There is no difference in the labeling pattern between the mutant strains and the WT strain, ruling out the citramalate pathway for isoleucine biosynthesis. ∆5 represents ∆ilvA ∆tdcB ∆sdaA ∆sdaB ∆tdcG. Labeling experiments were repeated on at least two separate occasions.
-
Figure 3—source data 1
Carbon labeling experiment.
- https://cdn.elifesciences.org/articles/54207/elife-54207-fig3-data1-v2.xlsx
Figure 4
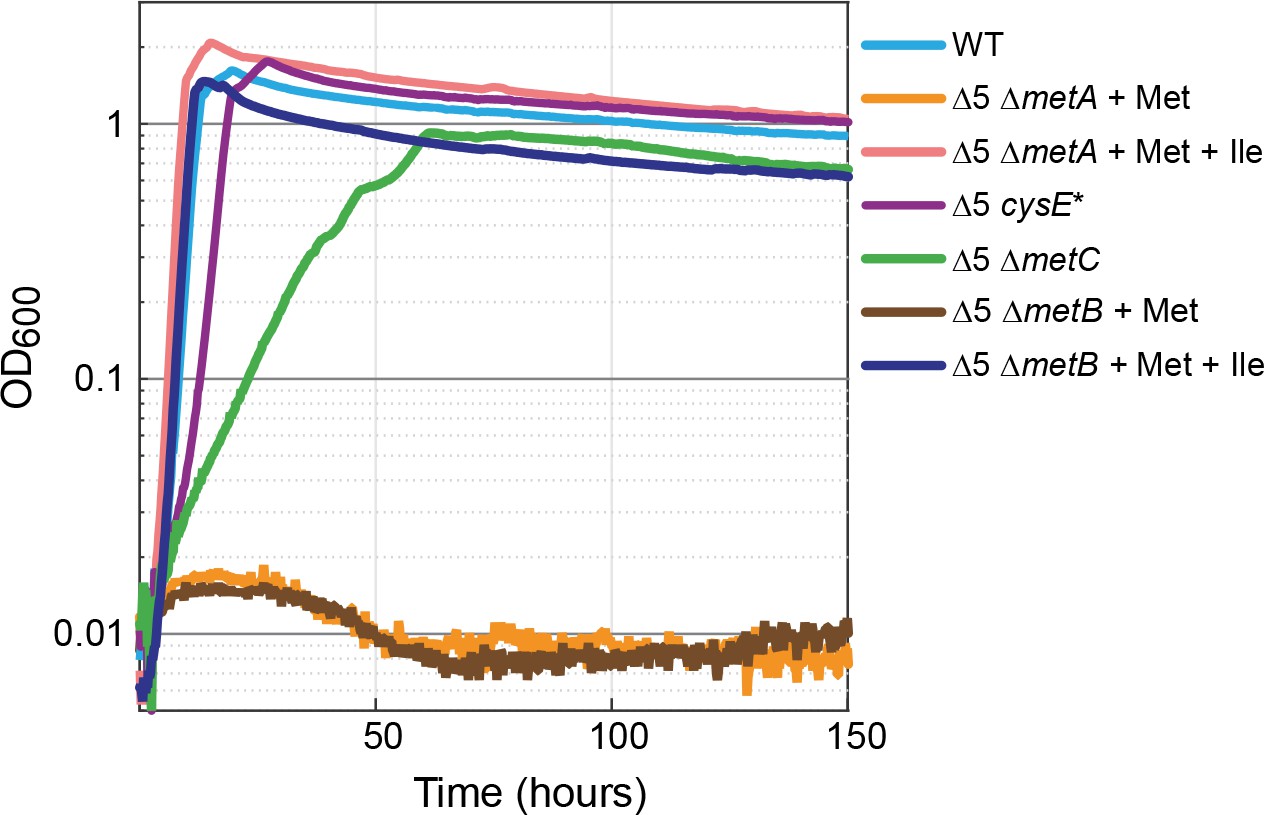
Methionine biosynthesis is implicated in promiscuous 2-ketobutyrate production.
The ∆5 strain further deleted in homoserine O-succinyltransferase (∆5 ∆metA) did not grow when supplemented with 2 mM methionine (orange line) but mutants of the cystathionine β-lyase (∆5 ∆metC) grew rapidly and consistently on 10 mM glucose alone. A mutation in serine acetyltransferase (∆5 cysE*) resulted in near WT growth on glucose (purple line). Both isoleucine (Ile) and methionine (Met) were added at a concentration of 2 mM where indicated. All experiments were performed in replicates in a 96-well plate reader. Replicates showed an identical growth profile (±5%) and hence are represented by a single curve. Experiments were repeated at least three times for all growth experiments shown.
Figure 5 with 3 supplements
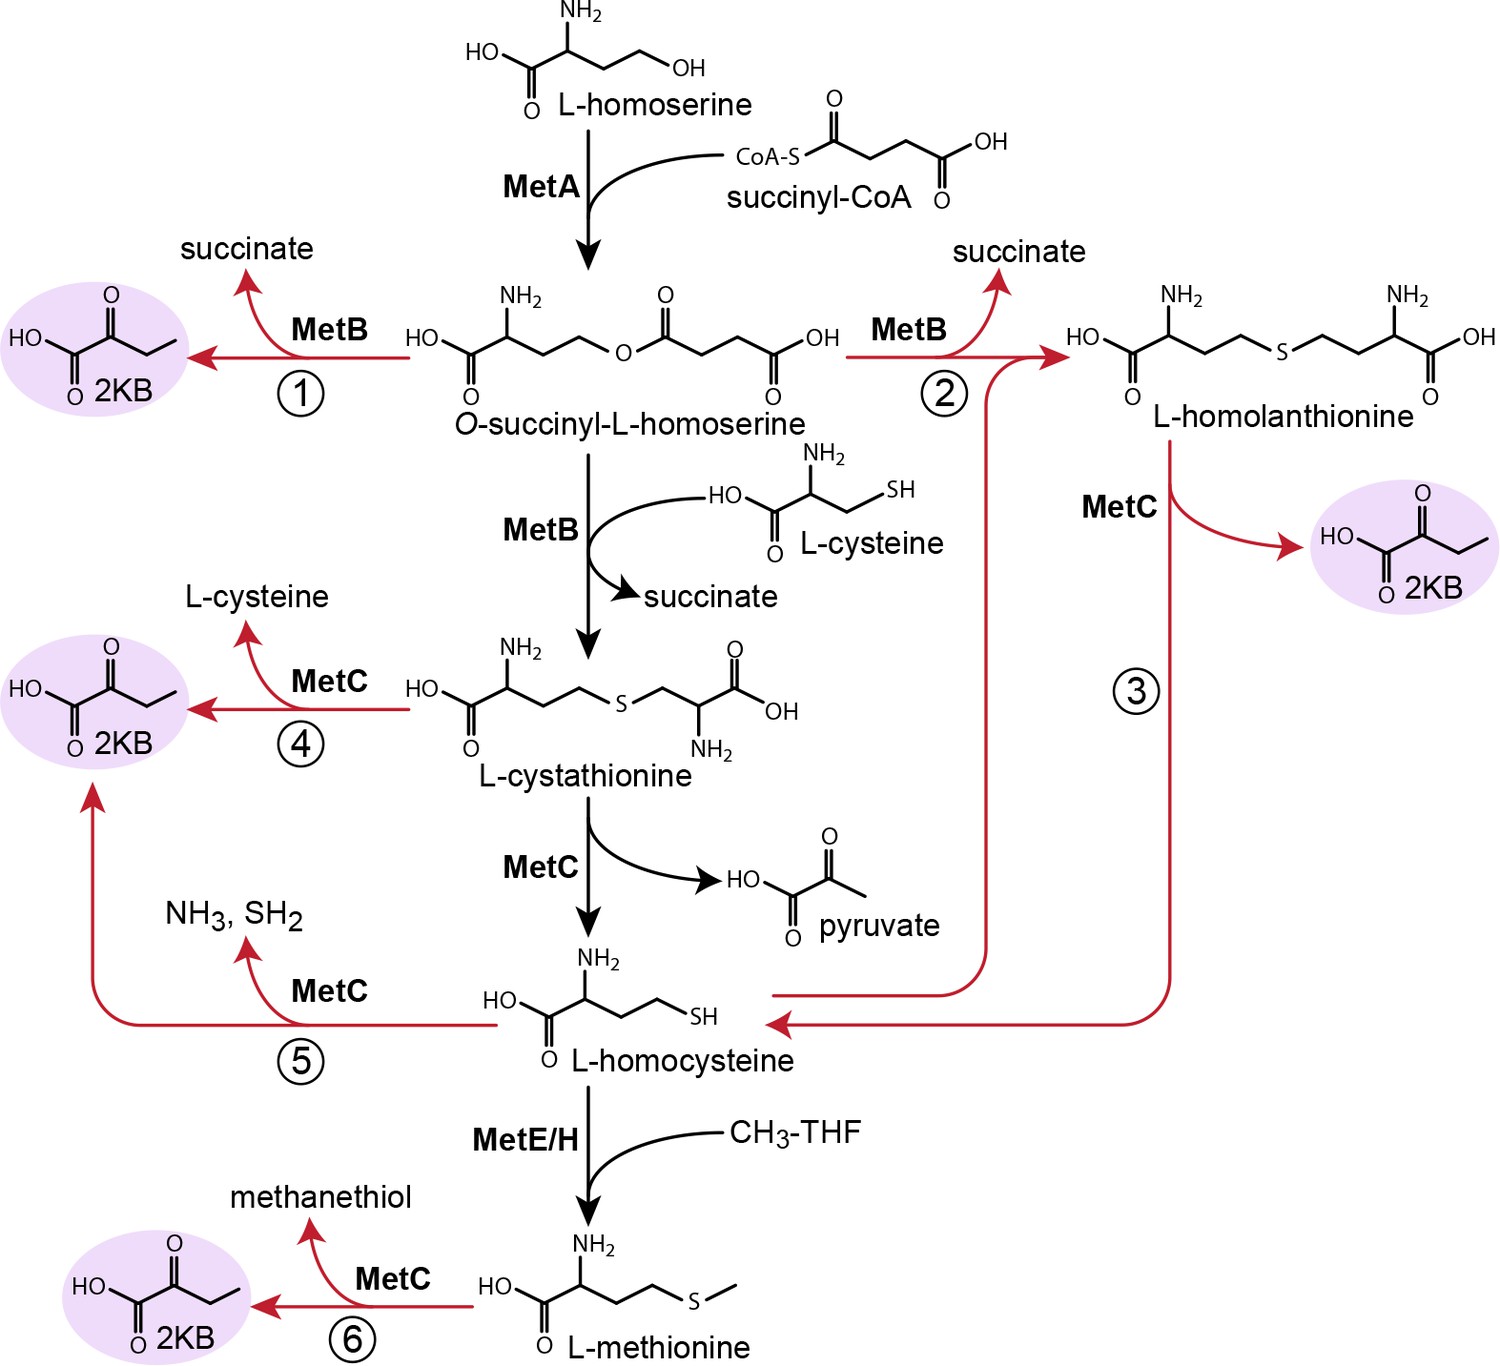
Possible routes to 2-ketobutyrate by methionine biosynthesis enzymes.
Schematic representation of methionine biosynthesis from homoserine as operating in E. coli (black arrows). Promiscuous reactions of cystathionine γ-synthase (MetB) and cystathionine β-synthase (MetC) which have been suggested to produce 2-ketobutyrate in various organisms are shown as red arrows.
Figure 5—figure supplement 1
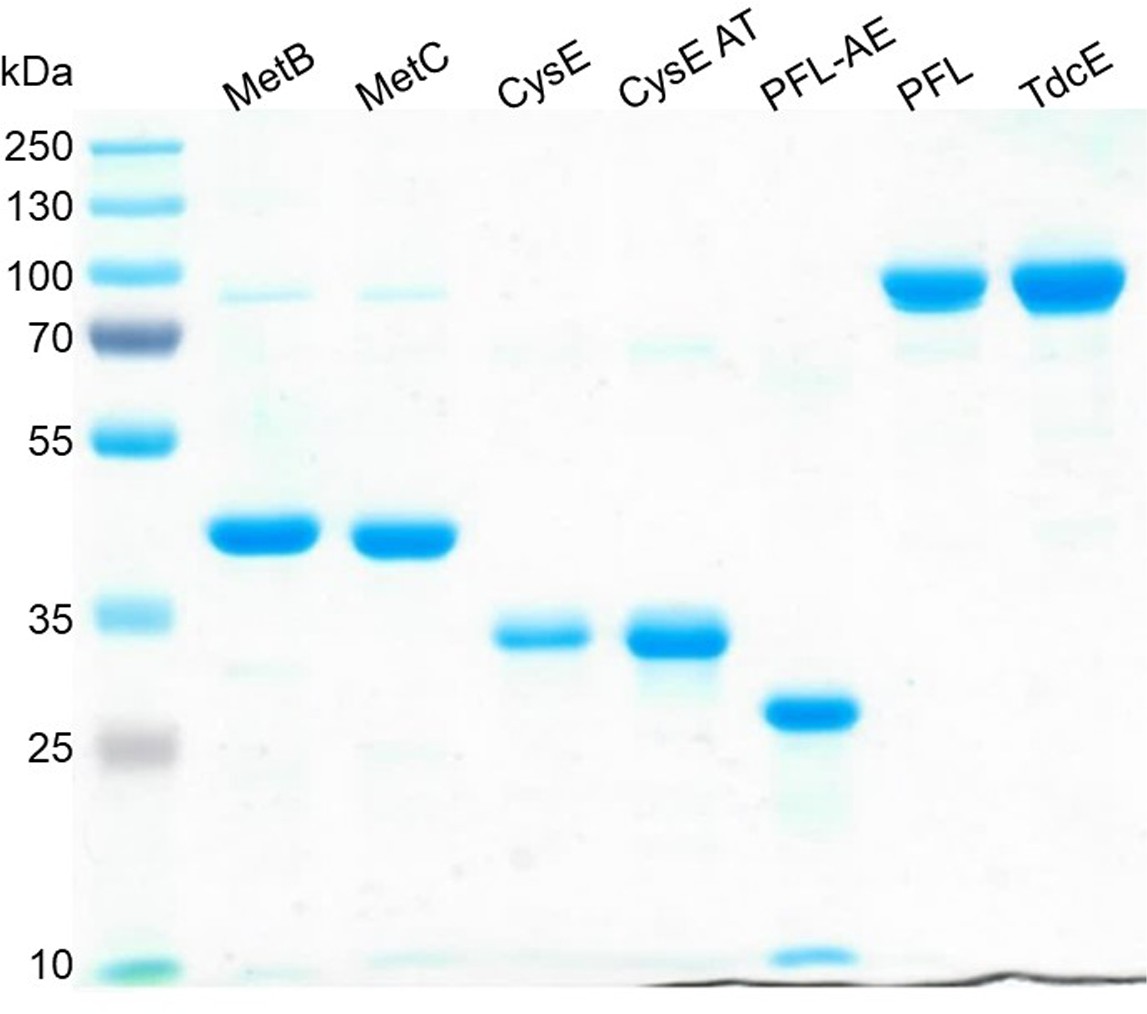
SDS-PAGE of all purified enzymes used in this study.
Expected monomeric molecular masses are: MetB 41.6 kDa, MetC 43.12 kDa, CysE 30.3 kDa, CysE Ala33Thr 30.3 kDa, PFL-AE 30.5 kDa, PFL 87.7 kDa, TdcE 88.3 kDa.
Figure 5—figure supplement 2
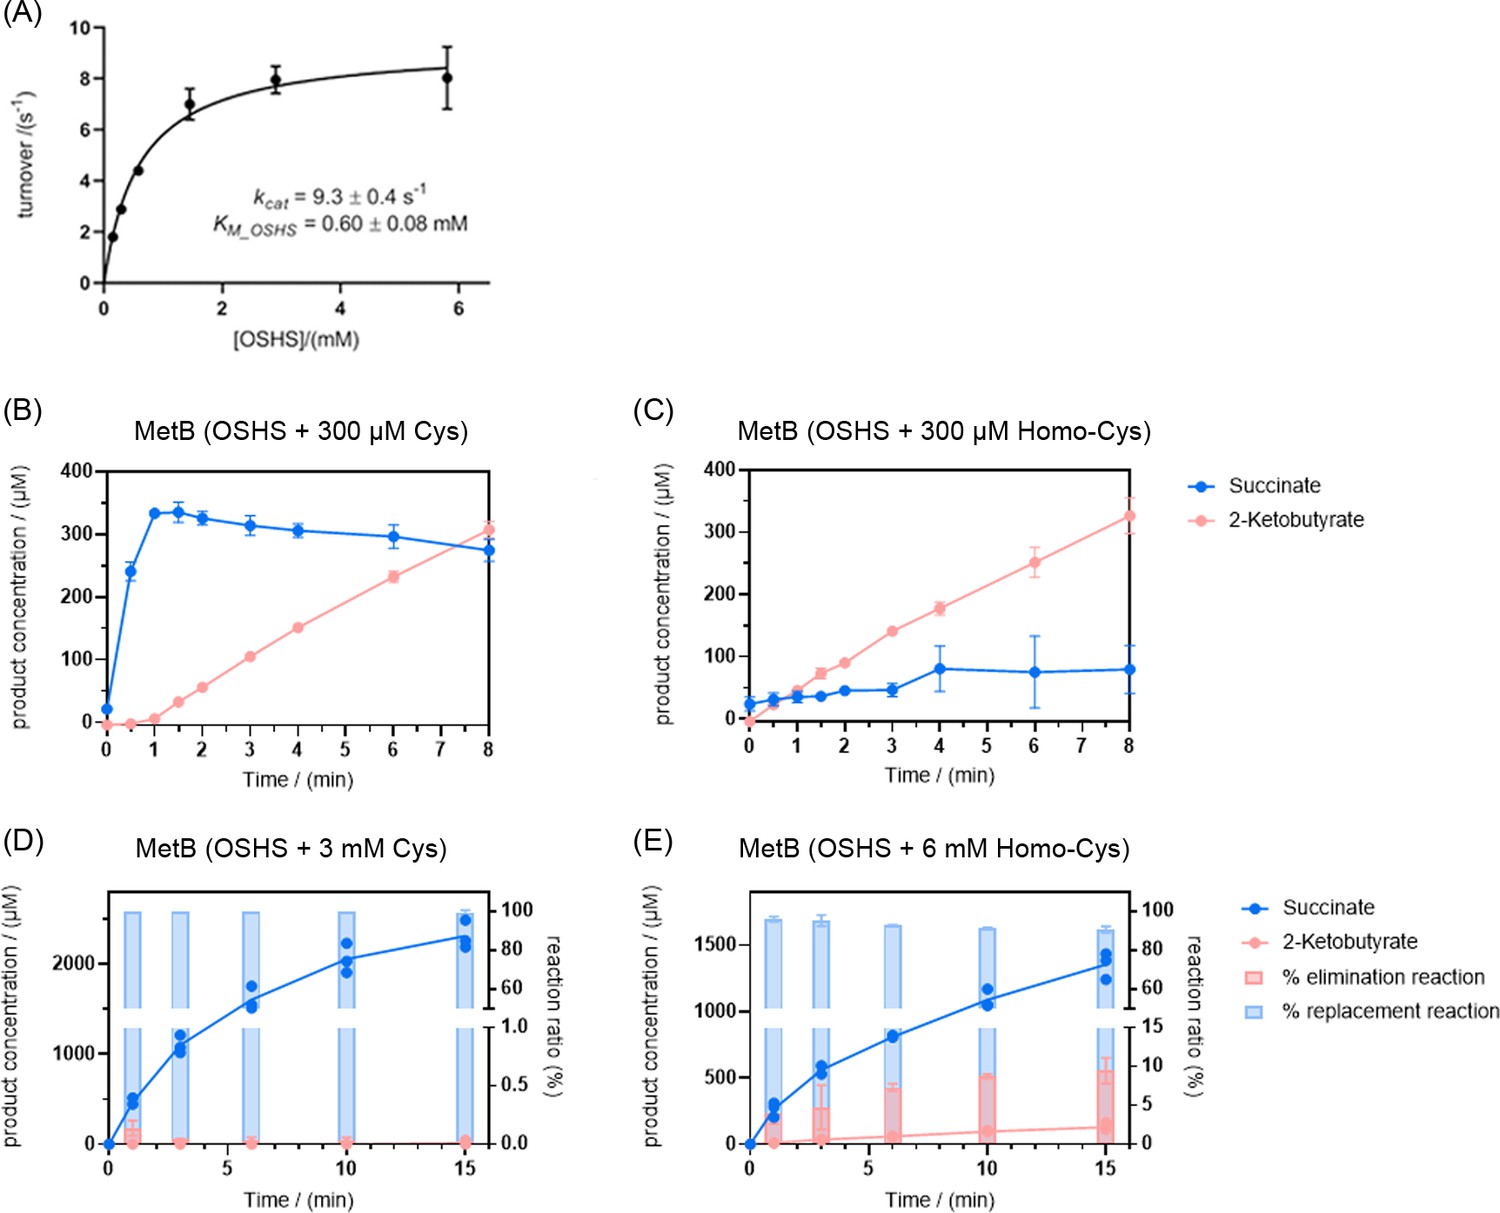
MetB catalyzes O-succinyl-L-homoserine (OSHS) cleavage to generate 2-ketobutyrate (2 KB).
(A) Kinetics of OSHS cleavage by MetB. (B) Formation of 2 KB is suppressed by the addition of cysteine (Cys, 300 µM) and (C) to a much lesser extent by the addition of homocysteine (Homo-Cys, 300 µM). The same phenomenon is observed at much higher concentrations of cysteine (Cys, 3 mM – Panel D) and full homocysteine-dependent repression can be observed at concentrations of this magnitude (Homo-Cys, 6 mM – Panel E). Error bars correspond to standard deviations. Note: MetB can perform two separate replacement reactions: either with cysteine as co-substrate (black arrow, Figure 5) or with homocysteine as co-substrate (reaction 2, Figure 5). To visualize the elimination (reaction one in Figure 5) and replacement reactions, the succinate concentrations shown here account for the succinate generated exclusively from the replacement reaction and are calculated by subtracting the concentration of 2 KB (which is stoichiometrically 1:1 with the concentration of succinate generated by the elimination reaction) from the total concentration of succinate. Effectively, succinate shown in panels B–E is exclusively the product of the replacement reaction 2 in Figure 5. The bar charts in panels D and E represent the extent to which the elimination and replacement reactions contribute to the overall catalytic turnover of MetB.
Figure 5—figure supplement 3
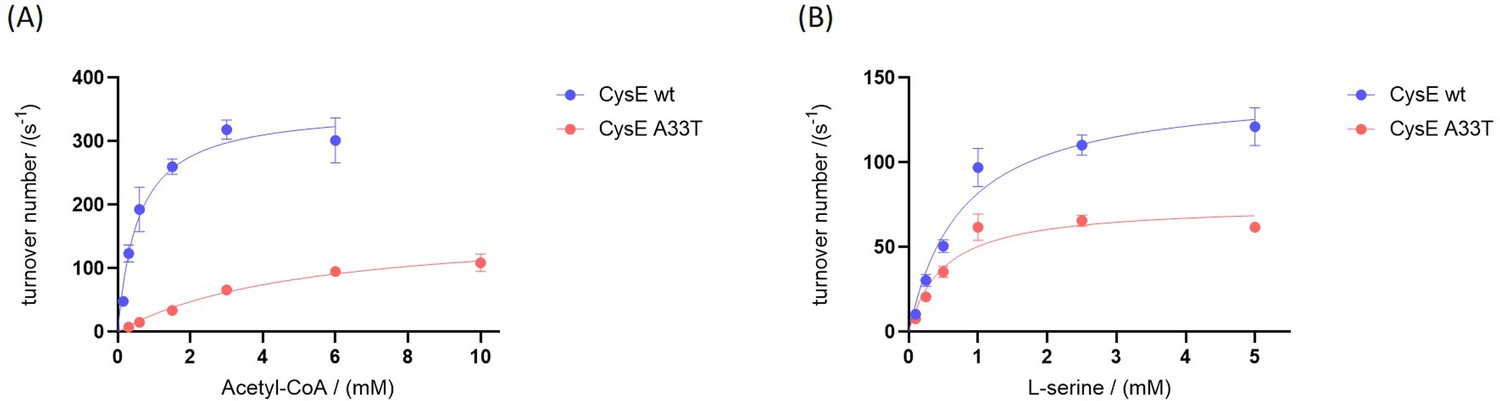
Kinetic characterization of CysE variants.
(A) Michaelis-Menten plots of CysE variants as a function of acetyl-CoA concentration at a saturating L-serine concentration of 20 mM and (B) Michaelis-Menten plots of CysE variants as a function of serine concentration at a non-saturating acetyl-CoA concentration of 0.6 mM. All points were measured in triplicate, showing the mean and standard deviation.
Figure 6
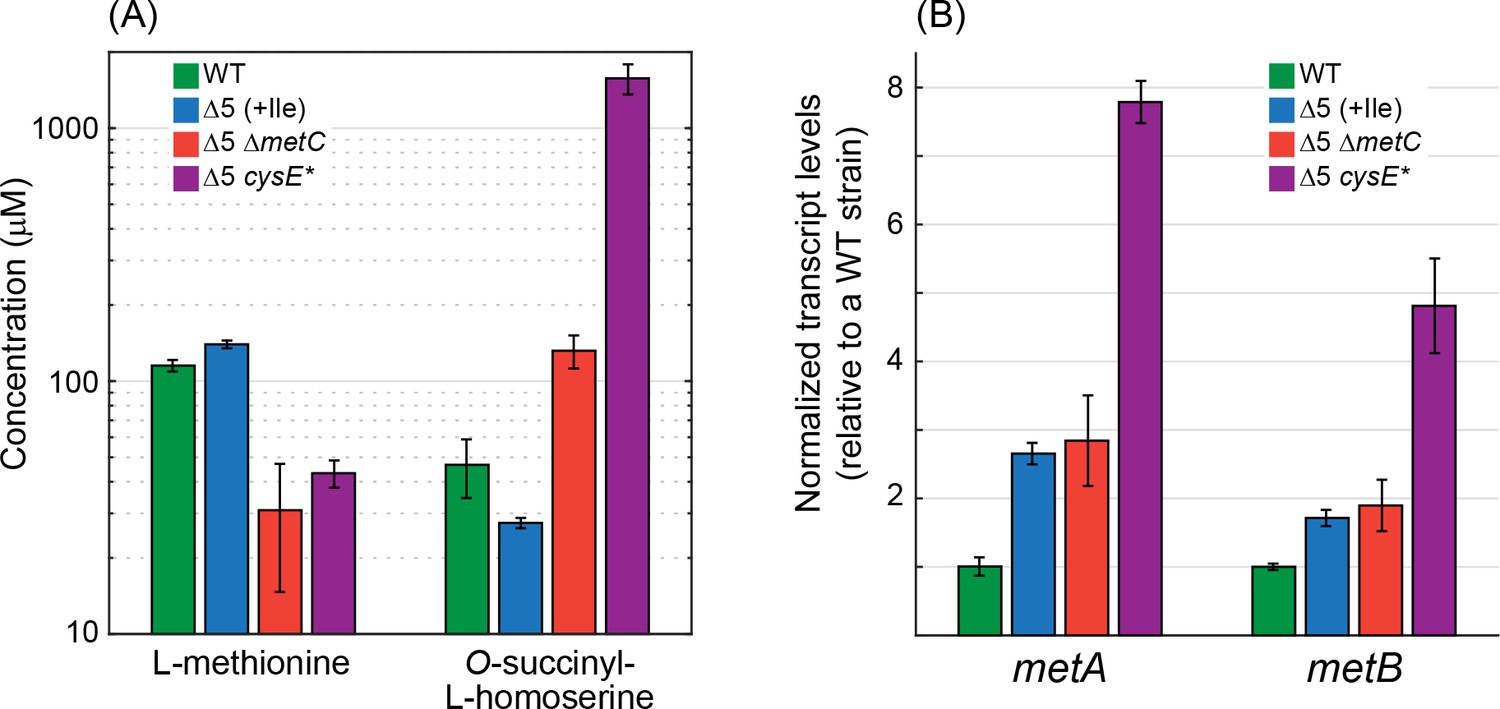
Deletion of metC or mutation in cysE substantially affects metabolite concentrations and gene expression.
(A) Quantitative determination of the concentrations of methionine and O-succinyl-L-homoserine as performed using an HRES-LC-MS. The concentration of methionine in the Δ5 ΔmetC and Δ5 cysE* strains was 2- to 3-fold lower than in the WT strain and the Δ5 strain (p-value <0.05, rank sum test). Isoleucine was added only to the Δ5 strain (as it is required for its growth). Relative to the WT strain and the Δ5 strain, the concentration of O-succinyl-L-homoserine was 2- to 3-fold higher in the Δ5 ΔmetC strain (p-value <0.05, rank sum test) and 30- to 60-fold higher in the Δ5 ΔcysE* strain (p-value <0.05, rank sum test). Error bars correspond to standard deviations. (B) Quantitative determination of transcript levels of metA and metB as measured by reverse transcriptase quantitative PCR. The transcript levels of metA and metB were more than 3-fold higher in the Δ5 cysE* strain than in the WT strain and the Δ5 strain (p-value <0.05, rank sum test). Error bars correspond to standard deviations.
-
Figure 6—source data 1
Measured concentrations of methionine and O-succinyl-L-homoserine.
- https://cdn.elifesciences.org/articles/54207/elife-54207-fig6-data1-v2.xlsx
-
Figure 6—source data 2
Measured transcript levels of metA and metB.
- https://cdn.elifesciences.org/articles/54207/elife-54207-fig6-data2-v2.xlsx
Figure 7
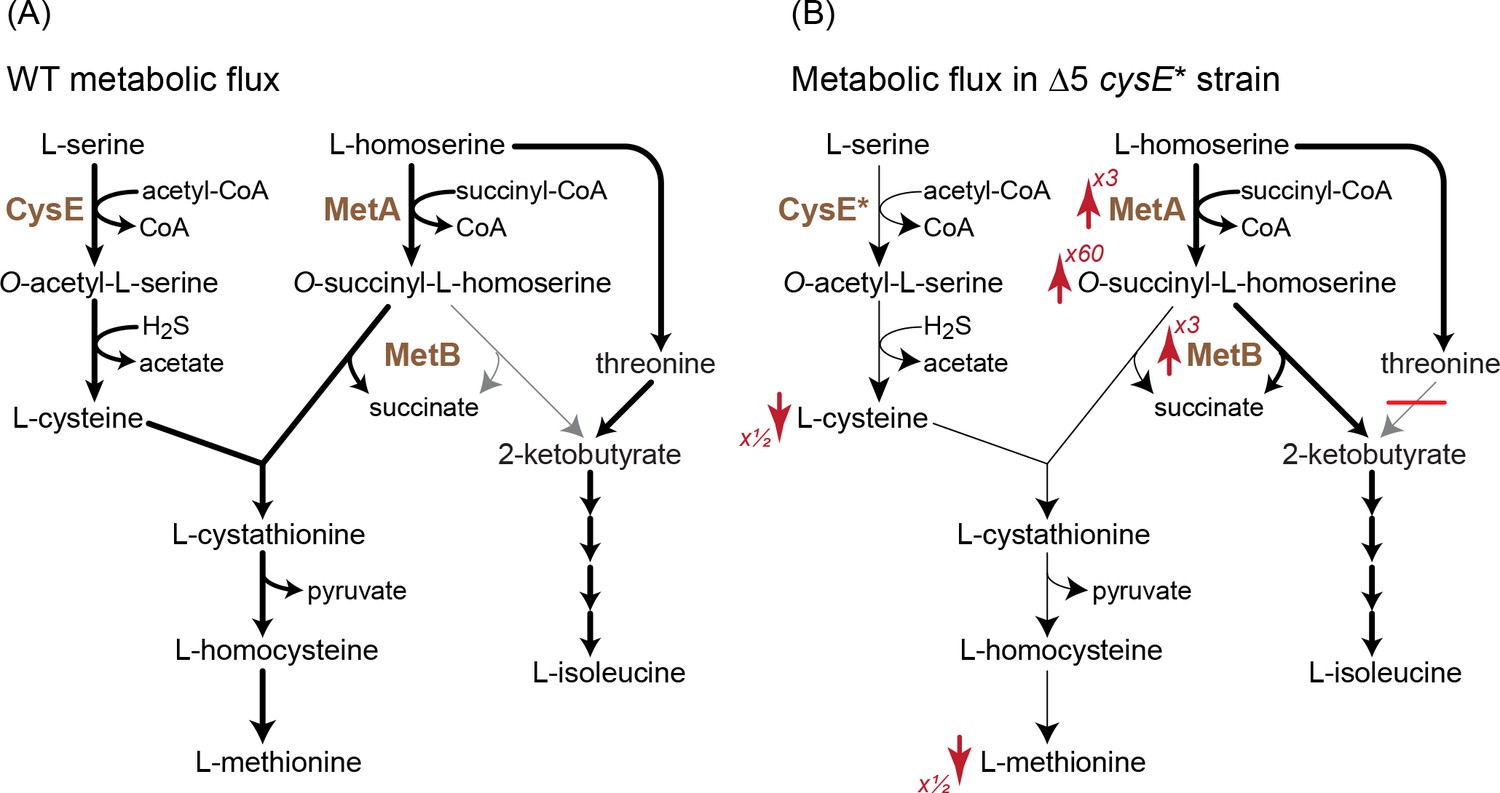
A mutation in serine acetyltransferase (cysE*) enables 2-ketobutyrate production by MetB.
(A) A schematic representation of endogenous cysteine, methionine, and isoleucine biosynthesis in E. coli. Thickness of arrows indicates flux intensity. (B) Schematic representation of cysteine, methionine, and isoleucine biosynthesis when threonine deaminases are deleted and with the cysE* mutation. Thickness of the arrows indicates higher flux via O-succinyl-L-homoserine cleavage to 2-ketobutyrate. As indicated by the red arrows, the transcript levels of metA and metB as well the concentration of O-succinyl-L-homoserine increase, while the concentrations of cysteine and methionine decrease. Numbers next to the arrows correspond to the factor by which the metabolite concentration or transcript level increased or decreased (as derived from Figure 6). Cysteine concentrations in the Δ5 ΔcysE* strain were ≈50% of that in WT and Δ5 strains.
-
Figure 7—source data 1
Relative concentrations of cysteine.
- https://cdn.elifesciences.org/articles/54207/elife-54207-fig7-data1-v2.xlsx
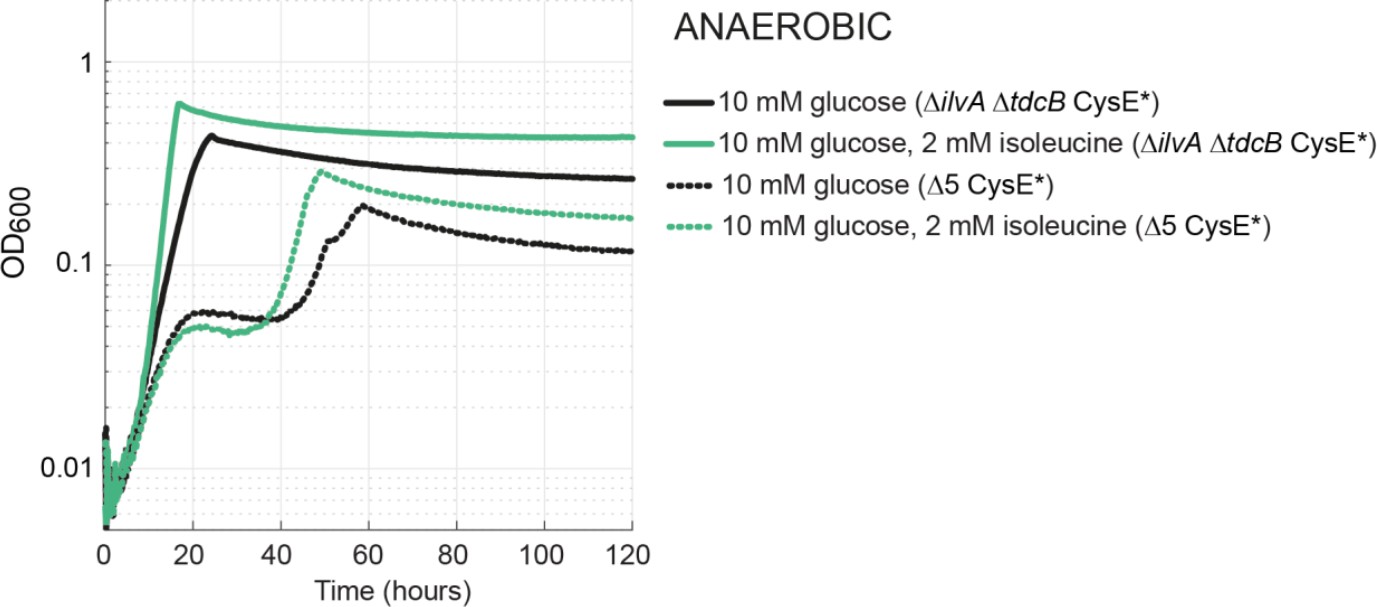
Figure 8 with 3 supplements

Propionate-dependent isoleucine production under anaerobic conditions.
(A) Addition of 5 mM propionate enabled growth of the Δ5 strain under anaerobic conditions. Further addition of 30 mM formate improved growth substantially. (B) A Δ5 ΔpflB strain could not use propionate as precursor of isoleucine. 1 mM of acetate was added for the cultivation of this strain, as the deletion of pflB disrupted the endogenous acetyl-CoA biosynthesis. (C) Overexpression of tdcE in the Δ5 ΔpflB strain enabled growth with propionate as isoleucine precursor. All experiments were performed in replicates in a 96-well plate reader. Replicates showed an identical growth profile (±5%) and hence are represented by a single curve. Experiments were repeated three times for all growth experiments shown.
Figure 8—figure supplement 1
Growth via the MetB-dependent pathway under anaerobic conditions.
Both the isolated ΔilvA ΔtdcB CysE* (solid line) and MAGE-generated Δ5 CysE* (dotted line) strains grew under anaerobic conditions without the medium addition of isoleucine (or propionate). The biphasic growth of the engineered Δ5 CysE* strain is unusual, but we note the same growth is observed for the positive control (green dotted). The timeframe of this growth and the lack of propionate in the media rule out PFL-dependent growth.
Figure 8—figure supplement 2
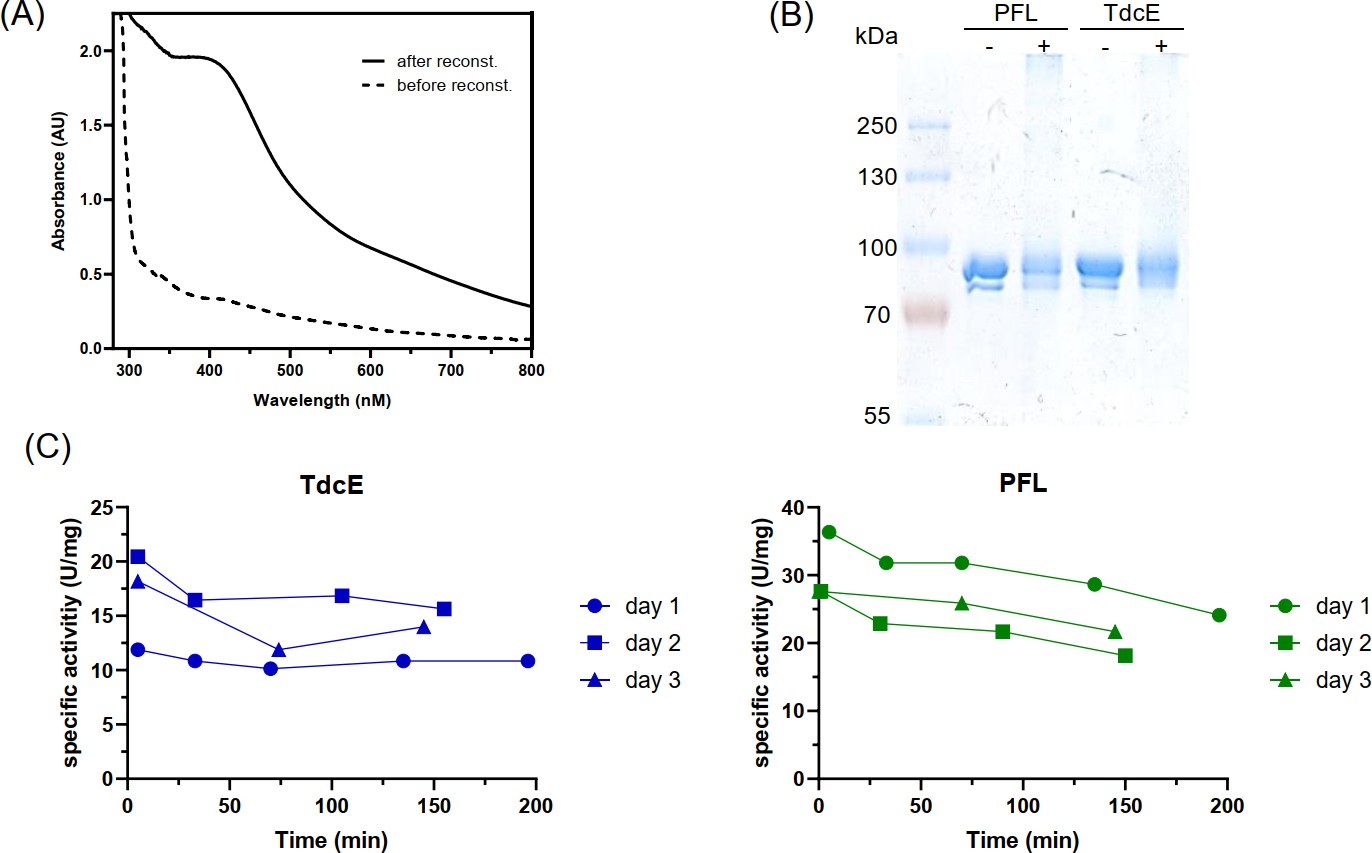
In vitro activation and validation of PFL and TdcE activity (A) UV-Vis absorbance spectrum of 100 µM PFL-AE before and after reconstitution.
The increase in intensity between 400 and 500 nm indicates increased iron-sulfur cluster content (Byer et al., 2018). (B) SDS-PAGE analysis of the activation mix with (+) and without (−) PFL-AE. The activation mix was exposed to oxygen and then SDS loading dye was added. The double band in the control without PFL-AE is probably due to partial glycyl radical activation during overexpression in E. coli. (C) Glycyl radical stability after activation. The activation mix was stored on ice and the activity of PFL and TdcE was measured with the pyruvate cleavage assay at the time points indicated. This experiment was repeated on three different days.
Figure 8—figure supplement 3
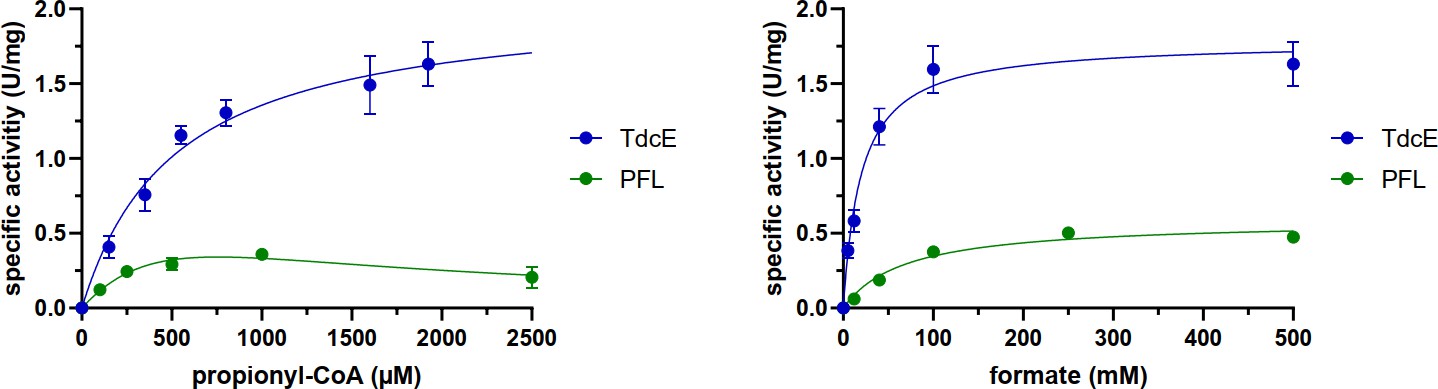
Michaelis-Menten graphs of PFL and TdcE for propionyl-CoA and formate (see Materials and methods section for exact conditions).
Error bars show standard deviation of three replicates. The data was fit to the Michaelis-Menten equation, except for PFL with propionyl-CoA, for which the data was fit to a substrate inhibition equation. The kinetic parameters are listed in Table 1.
Figure 9

13C-labeling of isoleucine reveals the activity of the KBFL route under anaerobic conditions.
(A) Schematic representation of 2-ketobutyrate production via PFL/TdcE-catalyzed reaction. Compounds in gray are added to the medium (external) while those in black represent intracellular metabolites. The red circle indicates the labeled carbon. (B) 5 mM of propionate-1-13C were added to the medium of different strains cultivated on 10 mM glucose. 10 mM acetate, 30 mM formate, and/or 2 mM methionine were added to the media of some strains, as indicated at the bottom of the figure. Alanine and threonine were not labeled in all cases, confirming that the labeling of isoleucine is derived from direct propionate conversion to 2 KB.
-
Figure 9—source data 1
Retention time, relative peak, and m/z for the carbon labeling experiment.
- https://cdn.elifesciences.org/articles/54207/elife-54207-fig9-data1-v2.xlsx
Tables
Table 1
Kinetic parameters of PFL and TdcE for catalyzing the condensation of propionyl-CoA with formate to generate 2-ketobutyrate.
See Materials and methods for assay conditions and Figure 8—figure supplements 2 and 3. Note that the kcat values were calculated assuming that the enzymes are fully activated.
| Enzyme | Propionyl-CoA | Formate | |||||
|---|---|---|---|---|---|---|---|
| Vmax (U/mg) | kcat (s−1) | KM (µM) | Ki (µM) | Vmax (U/mg) | kcat (s−1) | KM (mM) | |
| TdcE | 2.1 ± 0.1 | 3.2 ± 0.2 | 520 ± 81 | - | 1.8 ± 0.07 | 2.7 ± 0.1 | 20 ± 3 |
| PFL (PflB) | 1.1 ± 0.6 | 1.7 ± 0.9 | 830 ± 580 | 690 ± 500 | 0.59 ± 0.03 | 0.9 ± 0.05 | 69 ± 11 |
Key resources table
| Reagent type (species) or resource | Designation | Source or reference | Identifiers | Additional information |
|---|---|---|---|---|
| Strain, strain background (Escherichia coli) | E. coli strains | This study | Table 2 | |
| Sequence-based reagent | This study | PCR primers | Supplementary file 2 | |
| Recombinant DNA reagent | pZASS-tdcE (plasmid) | This study | Overexpression vector of TdcE. | |
| Recombinant DNA reagent | pCA24N-metB (plasmid) | This study | Overexpression vector of MetB. | |
| Recombinant DNA reagent | pCA24N-metC (plasmid) | This study | Overexpression vector of MetC. | |
| Recombinant DNA reagent | pCA24N-cysE (plasmid) | This study | Overexpression vector of CysE. | |
| Recombinant DNA reagent | pCA24N-cysE_A33T (plasmid) | This study | Overexpression vector of CysE with a mutation A33T. | |
| Recombinant DNA reagent | pORTMAGE | Nyerges et al., 2016 | Addgene catalog no. 72680 | |
| Chemical compound, drug | 13C-1-glucose | Sigma Aldrich | ||
| Chemical compound, drug | 13C-3-glucose | Sigma Aldrich | ||
| Chemical compound, drug | Sodium propionate-1-13C | Sigma Aldrich | ||
| Commercial assay or kit | RNeasy Mini Kit | Qiagen | ||
| Commercial assay or kit | qScript cDNA Synthesis Kit | QuantaBio | ||
| Commercial assay or kit | Maxima SYBR Green/ROX qPCR Master Mix | Thermo Fisher Scientific | ||
| Software, algorithm | breseq | Deatherage and Barrick, 2014 | RRID:SCR_010810 |
Table 2
Strains used in this study.
| Strain name | Deletions/Genotype | Description | Source |
|---|---|---|---|
| BL21 (DE3) | E. coli fhuA2 [lon] ompT gal (λ DE3) [dcm] ∆hsdS λ DE3 = λ sBamHIo ∆EcoRI-B int::(lacI::PlacUV5::T7 gene1) i21 ∆nin5 | Strain for protein production | Lab collections |
| SIJ488 | E. coli K-12 MG1655Tn7:: pAra-exo-beta-gam; pRha-FLP; xylSpm-IsceI | MG1655 derivative with genome integrated recombinase and flippase genes | 57 |
| ∆ilvA ∆tdcB | SIJ488 ∆ilvA ∆tdcB::kan | Threonine deaminase deletion strain | This study |
| ∆5 | SIJ488 ∆ilvA ∆tdcB ∆sdaA ∆sdaB ∆tdcG::kan | Threonine deaminase and serine deaminase deletion strain | This study |
| ∆5 ∆metA | SIJ488 ∆ilvA ∆tdcB ∆sdaA ∆sdaB ∆tdcG ∆metA::kan | Threonine deaminase, serine deaminase and homoserine O-succinyltransferase deletion strain | This study |
| ∆5 ∆metC | SIJ488 ∆ilvA ∆tdcB ∆sdaA ∆sdaB ∆tdcG ∆metC::kan | Threonine deaminase, serine deaminase and cystathionine β-lyase deletion strain | This study |
| ∆5 cysE* | SIJ488 ∆ilvA ∆tdcB ∆sdaA ∆sdaB ∆tdcG ∆metC::kan cysE | Threonine deaminase, serine deaminase and homoserineO-succinyltransferase deletion strain with cysE point mutation G97A | This study |
| ∆ilvC | SIJ488 ∆ilvC::cap | Ketol-acid reductoisomerase deletion strain | This study |
| ∆5 ∆pflB ∆tdcE | ∆ilvA ∆tdcB ∆sdaA ∆sdaB ∆tdcG ∆pflB ∆tdcE::cap | Threonine deaminase, serine deaminase, pyruvate formate-lyase and 2-ketobutyrate formate-lyase deletion strain | This study |
| ∆pflB | SIJ488 ∆pflB::kan | Pyruvate formate-lyase deletion strain | This study |
| ∆tdcE | SIJ488 ∆tdcE::cap | 2-Ketobutyrate formate-lyase deletion strain | This study |
Additional files
-
Supplementary file 1
Summary of identified mutations in 16 strains lacking threonine deaminases (∆ilvA ∆tdcB) or threonine and serine deaminases (∆ilvA ∆tdcB ∆sdaA ∆sdaB ∆tdcG) that were evolved to grow on 10 mM glucose after 70 hr without isoleucine or 2 KB.
- https://cdn.elifesciences.org/articles/54207/elife-54207-supp1-v2.xlsx
-
Supplementary file 2
List of all primers used in this study.
- https://cdn.elifesciences.org/articles/54207/elife-54207-supp2-v2.xlsx
-
Transparent reporting form
- https://cdn.elifesciences.org/articles/54207/elife-54207-transrepform-v2.docx
Download links
A two-part list of links to download the article, or parts of the article, in various formats.
Downloads (link to download the article as PDF)
Open citations (links to open the citations from this article in various online reference manager services)
Cite this article (links to download the citations from this article in formats compatible with various reference manager tools)
Underground isoleucine biosynthesis pathways in E. coli
eLife 9:e54207.
https://doi.org/10.7554/eLife.54207


