Agonist-selective recruitment of engineered protein probes and of GRK2 by opioid receptors in living cells
- University of California, San Francisco, United States
- University of Geneva, Switzerland
- Washington University School of Medicine, United States
- St Louis College of Pharmacy, United States
- Medical College of Georgia, Augusta University, United States
Figures
Figure 1
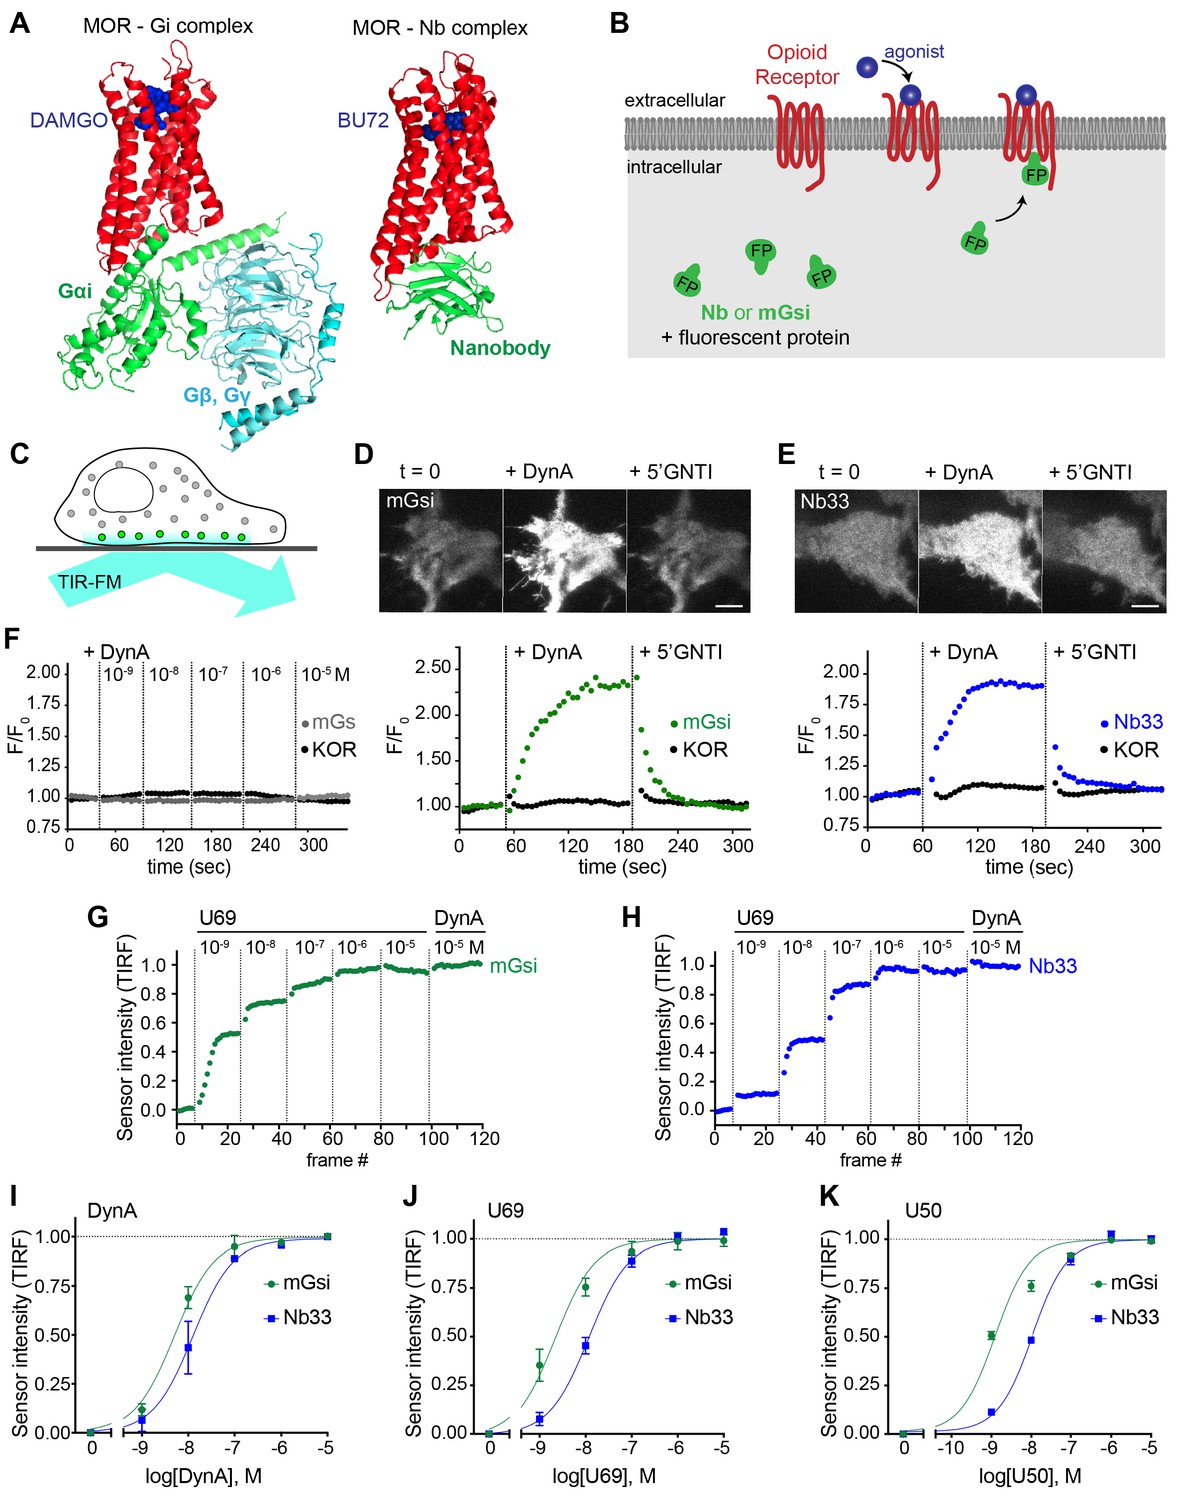
Comparative detection of direct probe recruitment by opioid receptors in living cells.
(A) Crystal structures of the DAMGO-bound MOR (red) - Gi (green/blue) complex (PDB: 6DDF) and the BU27-bound MOR (red) – nanobody (green) complex (PDB: 5C1M). Ligands are shown in blue. (B) Schematic of nanobody (Nb)/miniGsi (mGsi) and OR localization in cells and expected probe re-localization upon agonist addition. (C) Scheme of a cell imaged by total internal reflection fluorescence microscopy (TIR-FM). The evanescent excitation field selectively illuminates fluorophores close to the plasma membrane. (D) TIR-FM images of a time series of a HEK293 cell, expressing Venus-mGsi and FLAG-KOR (not shown). Medium was exchanged to DynA (agonist, 100 nM) and to 5’GNTI (antagonist, 100 μM) by bath application. The scale bar represents 10 μm. Intensity of mGsi and KOR (labeled with anti-FLAG M1-AF647) during the TIR-FM time-lapse. 5 s between frames is shown. F0, average fluorescence intensity before agonist. (E) Same as in (D) but with HEK293 cell expressing EGFP-Nb33 instead of mGsi. Intensity of Nb33 and KOR during TIR-FM time-lapse with 5 s between frames is shown. (F) Intensity of mGs and KOR (labeled with anti-FLAG M1-AF647) during the TIR-FM time-lapse, adding increasing concentrations of DynA (1 nM - 10 μM). 5 s between frames is shown. F0, average fluorescence intensity before agonist. (G) mGsi intensity during TIR-FM time-lapse series of a HEK293 cell, co-expressing Venus-mGsi and KOR, adding increasing concentrations of U69 (1 nM - 10 μM) followed by reference compound DynA (10 μM). 5 s between frames is shown. Intensity is normalized between 0 (no agonist) and 1 (reference compound DynA). (H) Same as in (F) with HEK293 cell expressing EGFP-Nb33 instead of mGsi. (I–K) Concentration-dependent recruitment of mGsi and Nb33 probes to KOR, measured by TIR-FM upon different agonists. Normalization of intensity values is shown (range [0–1]). Regression curves with Hill slope of 1 are shown. (I) DynA concentration response (n = 3; average ± SEM). (J) U69 concentration response, normalized to DynA (n = 3; average ± SEM). (K) U50 concentration response, normalized to DynA (n = 4; average ± SEM).
-
Figure 1—source data 1
Concentration-dependent recruitment of mGsi and Nb33 probes to KOR in response to DynA, U69, and U50 (Figure 1I-K).
- https://cdn.elifesciences.org/articles/54208/elife-54208-fig1-data1-v1.csv
Figure 2
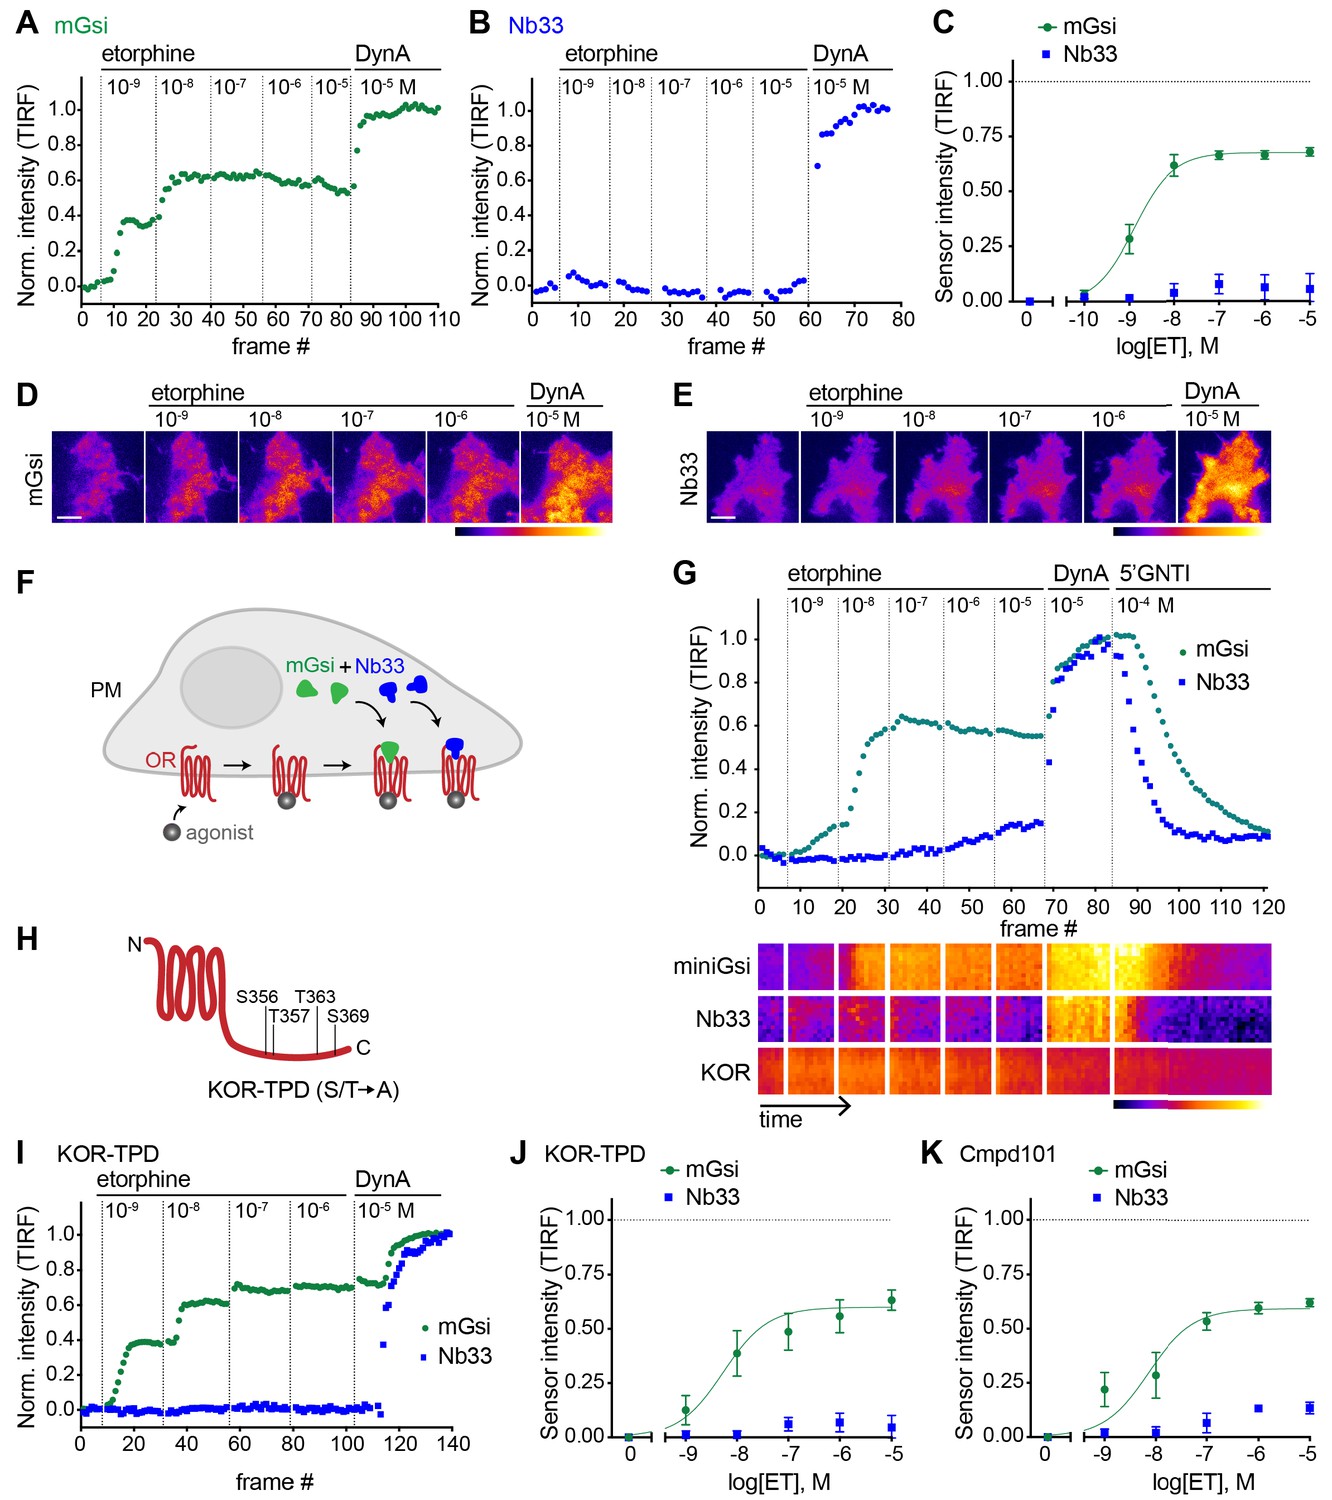
Selective recruitment of protein probes by KOR upon activation by etorphine.
(A) mGsi intensity during TIR-FM time-lapse series of a HEK293 cell, co-expressing Venus-mGsi and KOR, adding increasing concentrations of etorphine (1 nM - 10 μM), followed by reference compound DynA (10 μM). 5 s between frames is shown. Intensity is normalized between 0 (no agonist) and 1 (reference compound DynA). (B) Nb33 intensity during TIR-FM time-lapse series of a HEK293 cell, co-expressing EGFP-Nb33 and KOR, treated, imaged, and normalized as in (A). (C) Concentration-dependent recruitment of mGsi and Nb33 probes to KOR upon etorphine (ET) addition, measured by TIR-FM and using DynA as reference. Normalization of intensity values is shown (range [0–1]). Regression curves with Hill slope of 1 are shown. n = 5; average ± SEM. (D) TIR-FM images of a time series of a HEK293 cell, expressing Venus-mGsi and KOR (not shown). Increasing concentrations of etorphine were added, followed by DynA. Venus-mGsi is pseudocolored, low to high intensity. The scale bar represents 10 μm. (E) Same as in (D) but with HEK293 cell expressing EGFP-Nb33 instead of mGsi. EGFP-Nb33 is pseudocolored, low to high intensity. The scale bar represents 10 μm. (F) Experimental set up for measuring agonist-dependent recruitment of both mGsi and Nb33 to KOR in same cell. (G) mGsi and Nb33 intensity during TIR-FM time-lapse series of a HEK293 cell, co-expressing Venus-mGsi, mCherry-Nb33, and FLAG-KOR. Cell was treated with increasing concentrations of etorphine, followed by DynA, and antagonist 5’GNTI. 5 s between frames is shown. Intensity is normalized between 0 (no agonist) and 1 (reference DynA). Lower panel: 10 min kymograph traced inside the cell, depicting intensities of Venus-mGsi, mCherry-Nb33, and FLAG-KOR (labeled with anti-FLAG M1-AF647), all pseudocolored, low to high intensity. (H) Schematic of the C-tail domain of KOR, indicating the known agonist-dependent phosphorylation sites that are mutated to alanine in KOR-TPD. (I) Same as in (G) but with HEK293 cell, co-expressing Venus-mGsi, mCherry-Nb33, and FLAG-KOR-TPD. (J) Concentration-dependent recruitment of mGsi and Nb33 probes to KOR-TPD upon etorphine addition. Experimental setup and analysis as in (C). n = 5; average ± SEM. (K) Concentration-dependent recruitment of mGsi and Nb33 probes to KOR upon etorphine addition, in cells pre-treated with GRK2/3 inhibitor Cmpd101 (30 μM). Experimental setup and analysis as in (C). n = 3; average ± SEM.
-
Figure 2—source data 1
ET concentration-dependent recruitment of mGsi and Nb33 probes to KOR, or to KOR-TPD, or to KOR in the presence of Cmpd101.
- https://cdn.elifesciences.org/articles/54208/elife-54208-fig2-data1-v1.csv
Figure 3
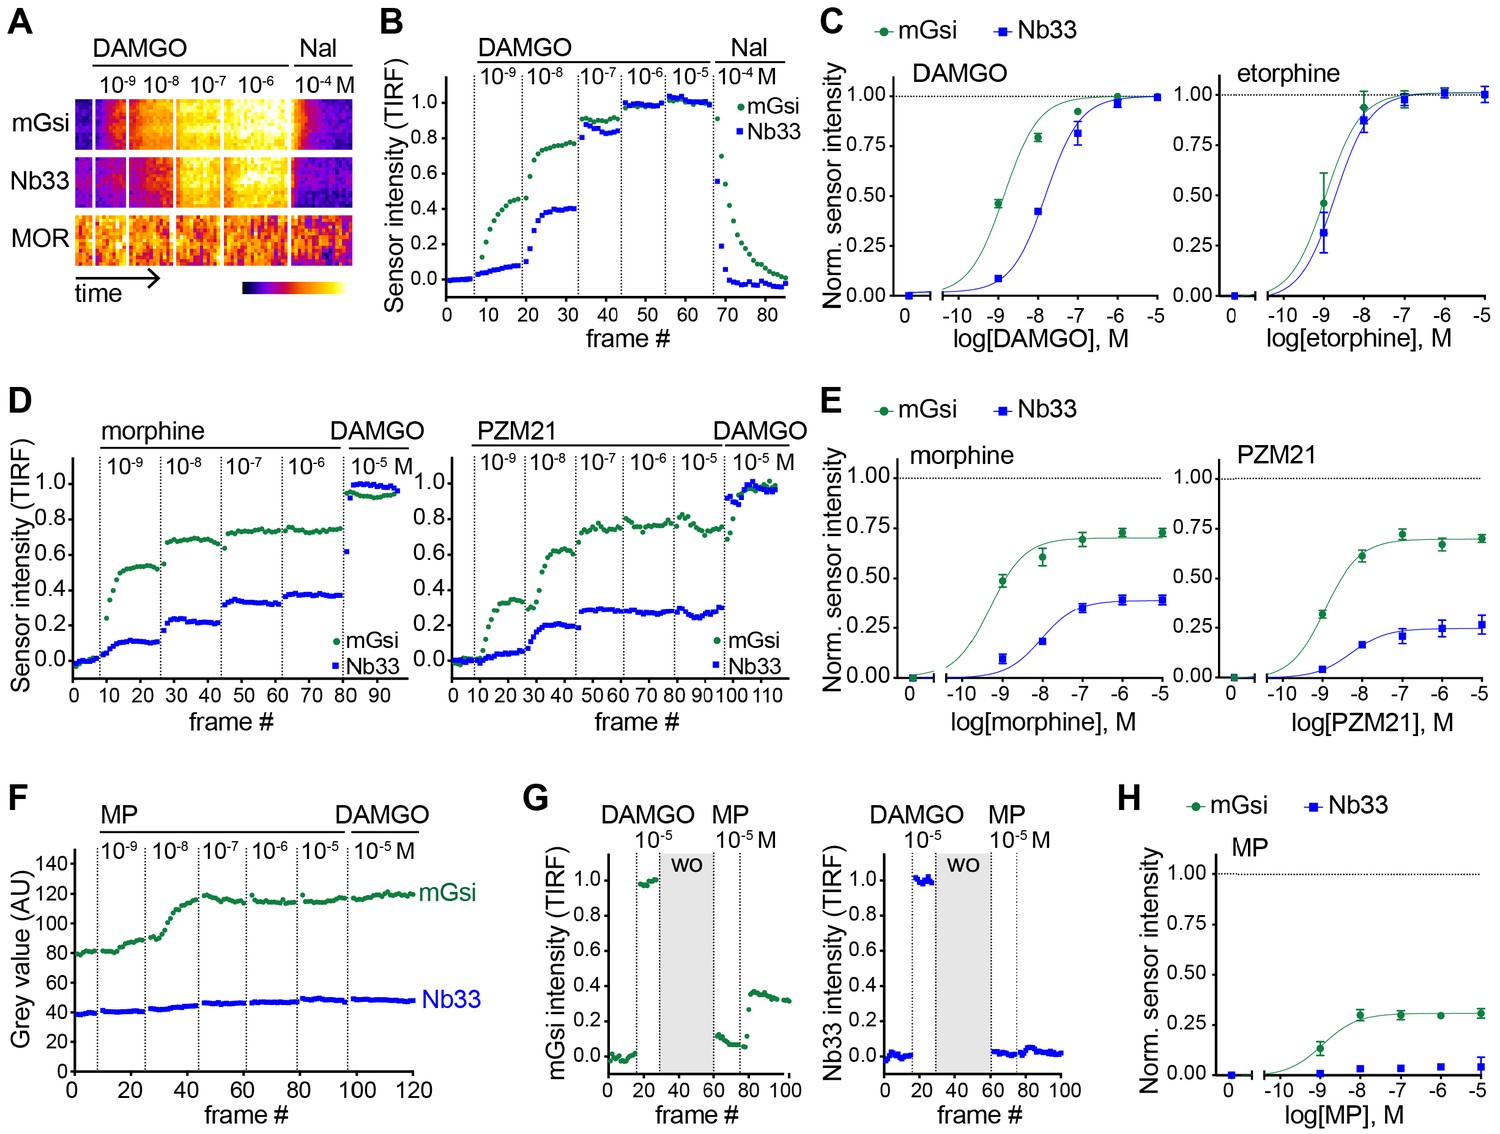
Agonist-selective protein probe recruitment by MOR.
(A) 7 min kymograph traced inside a cell expressing Venus-mGsi, mCherry-Nb33, and FLAG-MOR (labeled with anti-FLAG M1-AF647) and treated with increasing concentrations of DAMGO (agonist), followed by addition of Naloxone (antagonist). Fluorescence intensities are pseudocolored, low to high intensity. (B) mGsi and Nb33 intensity during TIR-FM time-lapse series of a HEK293 cell, co-expressing Venus-mGsi, mCherry-Nb33, and FLAG-MOR, adding increasing concentrations of DAMGO followed by Naloxone. 5 s between frames is shown. Intensity is normalized between 0 (no agonist) and 1 (10 μM DAMGO). (C) Concentration-dependent recruitment of mGsi and Nb33 to MOR upon DAMGO and etorphine addition, measured by TIR-FM. Normalization of intensity values is shown (range [0–1]) with DAMGO as reference. Regression curves with Hill slope of 1 are shown. DAMGO n = 3, etorphine n = 4, average ± SEM. (D) mGsi and Nb33 intensity during TIR-FM time-lapse series of a HEK293 cell, co-expressing Venus-mGsi, mCherry-Nb33, and FLAG-MOR, adding increasing concentrations of morphine or PZM21 followed by reference compound DAMGO (10 μM). 5 s between frames is shown. Intensity is normalized between 0 (no agonist) and 1 (10 μM DAMGO). (E) Concentration-dependent recruitment of mGsi and Nb33 probes to MOR upon morphine or PZM21 treatment, setup and analysis as in (C). morphine n = 5, PZM21 n = 5, average ± SEM. (F) mGsi and Nb33 intensity during TIR-FM time-lapse series of a HEK293 cell, co-expressing Venus-mGsi, mCherry-Nb33, and FLAG-MOR, adding increasing concentrations of mitragynine pseudoindoxyl (MP) followed by DAMGO, using bath application. 5 s between frames is shown. (G) mGsi (left) and Nb33 (right) intensity during TIR-FM time-lapse series of a cell, co-expressing Venus-mGsi, mCherry-Nb33, and FLAG-MOR, adding 10 μM of reference DAMGO, followed by agonist washout using perfusion (‘wo’, highlighted in gray), and addition of 10 μM MP. 5 s between frames is shown. Intensity is normalized between 0 (no agonist) and 1 (10 μM DAMGO). (H) Concentration-dependent recruitment of mGsi and Nb33 to MOR upon MP addition, measured by TIR-FM with DAMGO as reference. n = 4; average ± SEM.
-
Figure 3—source data 1
Concentration-dependent recruitment of mGsi and Nb33 probes to MOR in response to DAMGO, ET, morphine, or PZM21.
- https://cdn.elifesciences.org/articles/54208/elife-54208-fig3-data1-v1.csv
Figure 4

Receptor-proximal probe recruitment across agonists and receptors.
(A) Table summarizing mGsi and Nb33 recruitment efficacies to KOR and MOR upon different agonists. Intrinsic activities (‘I.A.’, maximal response) for both probes and each agonist are given (average ± SEM). DynA serves as reference for KOR, DAMGO as reference for MOR. mGsi/Nb33 = ratios of intrinsic activities. (B) Plot of intrinsic activities (maximal responses) of mGsi recruitment as function of Nb33 recruitment for all KOR and MOR agonists. The diagonal (dotted) line indicates the theoretical trajectory for probe recruitment without bias. MS = morphine, ET = etorphine, MP = mitragynine pseudoindoxyl. (C) Summary of the effects of DynA vs. etorphine on KOR-proximal protein recruitment. The chemically distinct agonists differentially promote recruitment of protein probes mGsi (interaction 1) and Nb33 (interaction 2), revealing biased recruitment of cytoplasmic proteins by opioid receptors.
Figure 5

Agonist-selective modes of GRK2 recruitment to the plasma membrane.
(A) Schematic depicting two modes of GRK2 recruitment from the cytosol to the plasma membrane upon KOR activation: one involves interaction with G beta-gamma subunits exposed upon G protein activation and another with the activated receptor itself. (B) GRK2 intensity during TIR-FM time-lapse series of a HEK293 cell, co-expressing GRK2-EGFP and KOR, adding increasing concentrations of DynA. 5 s between frames is shown. Intensity is normalized between 0 (no agonist) and 1 (10 μM DynA). (C) GRK2 intensity for cells transfected as in (B) but adding increasing concentrations of etorphine (ET), followed by 10 μM DynA as reference. Imaging and normalization as in (B). (D) Concentration-dependent recruitment of GRK2 to the plasma membrane upon DynA or ET addition, measured by TIR-FM. Normalization of intensity values is shown (range [0–1]) with DynA as reference. Regression curve with Hill slope of 1 is shown for DynA, no fit for ET. DynA n = 6, ET n = 7, average ± SEM. (E) Intensity of GRK2 during the TIR-FM time-lapse series of a HEK293 cell, expressing GRK2-EGFP and FLAG-KOR (not shown). Medium was exchanged to ET (100 nM) and then to DynA (1 μM) by bath application. 5 s between frames is shown. F0 is the average fluorescence intensity before agonist. n = 4, average ± SEM. (F) GRK2 intensity time course as in (E), but cells express FLAG-KOR-TPD instead of wild-type. n = 4, average ± SEM. (G) Intensity of GRK2-C-tail during the TIR-FM time-lapse series of a HEK293 cell, expressing GRK2-C-tail-EGFP and FLAG-KOR, imaged and treated as in (E). n = 5, average ± SEM. (H) GRK2 intensity time course as in (E), but cells were pre-treated with pertussis toxin (PTX, 100 ng/ml). n = 3, average ± SEM.
-
Figure 5—source data 1
Concentration-dependent recruitment of GRK2 to the plasma membrane in response to DynA or ET (Figure 5D).
- https://cdn.elifesciences.org/articles/54208/elife-54208-fig5-data1-v1.csv
-
Figure 5—source data 2
Recruitment behavior of GRK2 to the plasma membrane in response to ET and DynA (Figure 5E–H).
- https://cdn.elifesciences.org/articles/54208/elife-54208-fig5-data2-v1.csv
Figure 6
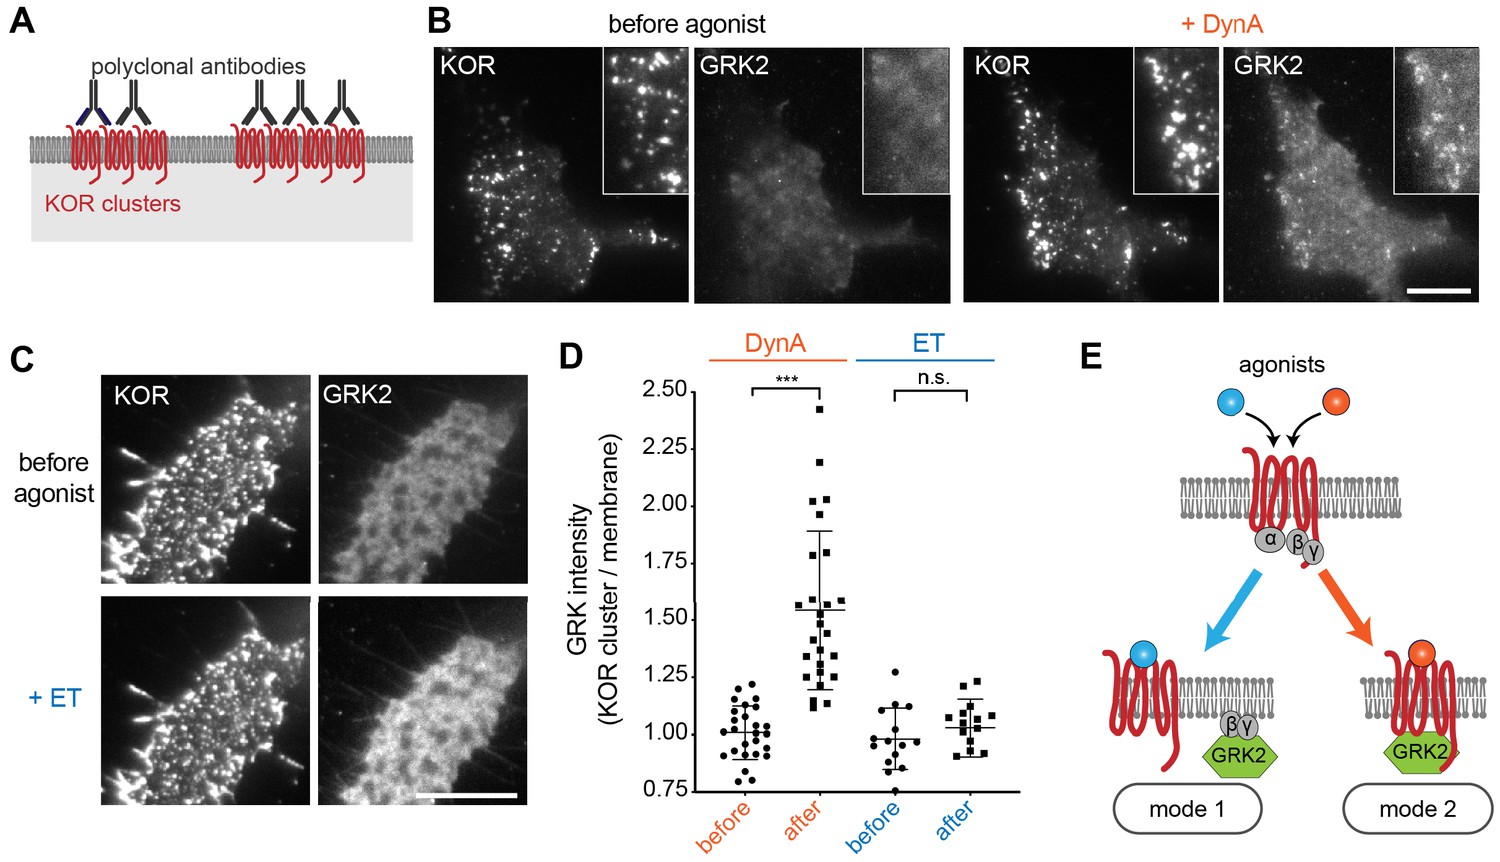
Agonist-selective modes of GRK2 recruitment by KOR.
(A) Schematic of receptor clustering in the plasma membrane using cross-linking by polyclonal antibody. (B) TIR-FM images of a cell expressing GRK2-mCherry and SEP-KOR. KOR was cross-linked with polyclonal antibodies before imaging. Frames were collected immediately before agonist (left panels) and 1 min after application of 1 μM DynA (right panels). The scale bar represents 10 μm. (C) Same as in (B) but cells were treated with etorphine (ET, 1 μM) instead of DynA. The scale bar represents 10 μm. (D) GRK2 intensity in KOR clusters relative to surrounding plasma membrane (see methods). Quantification of images collected before agonist and 2 min after agonist (DynA or ET) application, similar to images shown in (A) and (B). DynA (26 cells) and ET (15 cells) across three independent experiments. Mean with SD is shown. ***p = <0.0001 by paired two-tailed t-test. n.s. = not significant (p=0.30). (E) The two biochemical modes of GRK2 recruitment are selectively promoted by distinct agonists. While etorphine only drives GRK2 binding to G beta-gamma, DynA additionally promotes direct interaction of GRK2 with activated KOR.
-
Figure 6—source data 1
Recruitment of GRK2 to KOR clusters upon DynA or ET treatment (Figure 6D).
- https://cdn.elifesciences.org/articles/54208/elife-54208-fig6-data1-v1.csv
Tables
Key resources table
| Reagent type (species) or resource | Designation | Source or reference | Identifiers | Additional information |
|---|---|---|---|---|
| Cell line (human, female) | HEK293 | ATCC | CRL-1573; RRID: CVCL_0045 | Human embryonic kidney |
| Antibody | Mouse anti-FLAG (M1) | Sigma-Aldrich | F-3040; RRID: AB_439712 | (1:1000) |
| Antibody | Rabbit anti-GFP | Invitrogen | A-11122; RRID: AB_221569 | (1:100) |
| Recombinant DNA reagent | EGFP-Nb33 | (Stoeber et al., 2018) | N/A | EGFP-C1 backbone |
| Recombinant DNA reagent | pmApple-Nb33 | (Stoeber et al., 2018) | N/A | pmApple-C1 backbone |
| Recombinant DNA reagent | NES-Venus-mGsi | (Wan et al., 2018) | N/A | pcDNA3 backbone |
| Recombinant DNA reagent | NES-Venus-mGs | (Wan et al., 2018) | N/A | pcDNA3 backbone |
| Recombinant DNA reagent | signal sequence FLAG (ssf)-MOR, murine | (Stoeber et al., 2018) | N/A | pcDNA3 backbone |
| Recombinant DNA reagent | ssf-KOR, murine | (Chu et al., 1997) | N/A | pcDNA3 backbone |
| Recombinant DNA reagent | ssf-KOR-TPD (S356A, T357A, T363A, S369A) | This study | N/A | pcDNA3 backbone, see Materials and methods |
| Recombinant DNA reagent | Super ecliptic pHluorin (SEP) -KOR, murine | This study | N/A | pCAGGS-SE backbone, see Materials and methods |
| Recombinant DNA reagent | GRK2-EGFP, murine | This study | N/A | pCAGGS-SE backbone, see Materials and methods |
| Recombinant DNA reagent | GRK2-pmApple, murine | This study | N/A | pCAGGS-SE backbone, see Materials and methods |
| Recombinant DNA reagent | GRK2-C-tail- EGFP (aa 546–670) | This study | N/A | pCAGGS-SE backbone, see Materials and methods |
| Peptide, recombinant protein | Dynorphin A (1–17, DynA) | Anaspec | AS-24298 | |
| Peptide, recombinant protein | DAMGO, [D-Ala2, N-Me-Phe4, Gly5-ol]-Enkephalin acetate salt | Sigma-Aldrich | E7384 | |
| Chemical compound, drug | U-69593 (U69) | Cayman Chemical | 13255 | |
| Chemical compound, drug | U-50488 hydrochloride (U50) | Tocris | 0495 | |
| Chemical compound, drug | GNTI dihydrochloride (5’GNTI) | Axon Med Chem | 1226 | |
| Chemical compound, drug | Etorphine-HCl | NIDA | N/A | |
| Chemical compound, drug | Morphine sulfate (MS) | Sigma-Aldrich | 1448005 | |
| Chemical compound, drug | Naloxone hydrochloride dihydrate | Sigma-Aldrich | N7758 | |
| Chemical compound, drug | PZM21 | Enamine | N/A | custom synthesis |
| Chemical compound, drug | mitragynine pseudoindoxyl (MP) | This study | N/A | (Váradi et al., 2016) |
| Chemical compound, drug | Compound101 (Cmpd101) | HelloBio | HB2840 | |
| Chemical compound, drug | Pertussis toxin | Sigma-Aldrich | P7208 | |
| Commercial assay or kit | Alexa Fluor 647 Protein Labeling Kit | Thermo Fisher Scientific | A20173 | |
| Software, algorithm | Prism | GraphPad | 8.1.1 | |
| Software, algorithm | ImageJ | Imagej.net/contributors | 2.0.0-rc-54/1.51 g | |
| Software, algorithm | MATLAB | MathWorks | R2014b | |
| Software, algorithm | PyMOL | Schrödinger | v1.7.4.5 |
Additional files
Download links
A two-part list of links to download the article, or parts of the article, in various formats.
Downloads (link to download the article as PDF)
Open citations (links to open the citations from this article in various online reference manager services)
Cite this article (links to download the citations from this article in formats compatible with various reference manager tools)
Agonist-selective recruitment of engineered protein probes and of GRK2 by opioid receptors in living cells
eLife 9:e54208.
https://doi.org/10.7554/eLife.54208


