The transition state and regulation of γ-TuRC-mediated microtubule nucleation revealed by single molecule microscopy
- Department of Chemical and Biological Engineering, Princeton University, United States
- Department of Molecular Biology, Princeton University, United States
- Department of Cell Biology, New York University School of Medicine, United States
- Department of Mechanical and Aerospace Engineering, Princeton University, United States
- Lewis-Sigler Institute for Integrative Genomics, United States
- Department of Physics, Princeton University, United States
Figures
Figure 1 with 1 supplement

Single molecule microscopy of microtubule nucleation from γ-TuRC.
(A) Schematic for microtubule nucleation from γ-TuRC. Biochemical features of γ-TuRC including the γ-/αβ-tubulin interaction affinity and conformation of γ-TuRC determine to MT nucleation activity and transition state. (B) Purified, biotinylated γ-TuRC molecules were attached, incubated with 14 μM αβ-tubulin and time-lapse of MT nucleation after is shown. MTs already nucleated in the first frame are marked with yellow arrow, while new MT nucleation events between the first and last frame with blue arrows. (C) Three representative kymographs of (left) unlabeled γ-TuRC nucleating MTs colored in grayscale, or (right) fluorescently-labeled γ-TuRC, pseudo-colored in green, nucleating MTs, pseudo-colored in red. Arrows point to nucleation sites. The experiments with unlabeled γ-TuRC were repeated more than 10 times with independent γ-TuRC preparations, while those with fluorescent γ-TuRC repeated were repeated six times with three independent γ-TuRC preparations. See Figure 1—figure supplement 1 and Videos 1–2.
Figure 1—figure supplement 1
Controls for γ-TuRC-mediated microtubule nucleation.
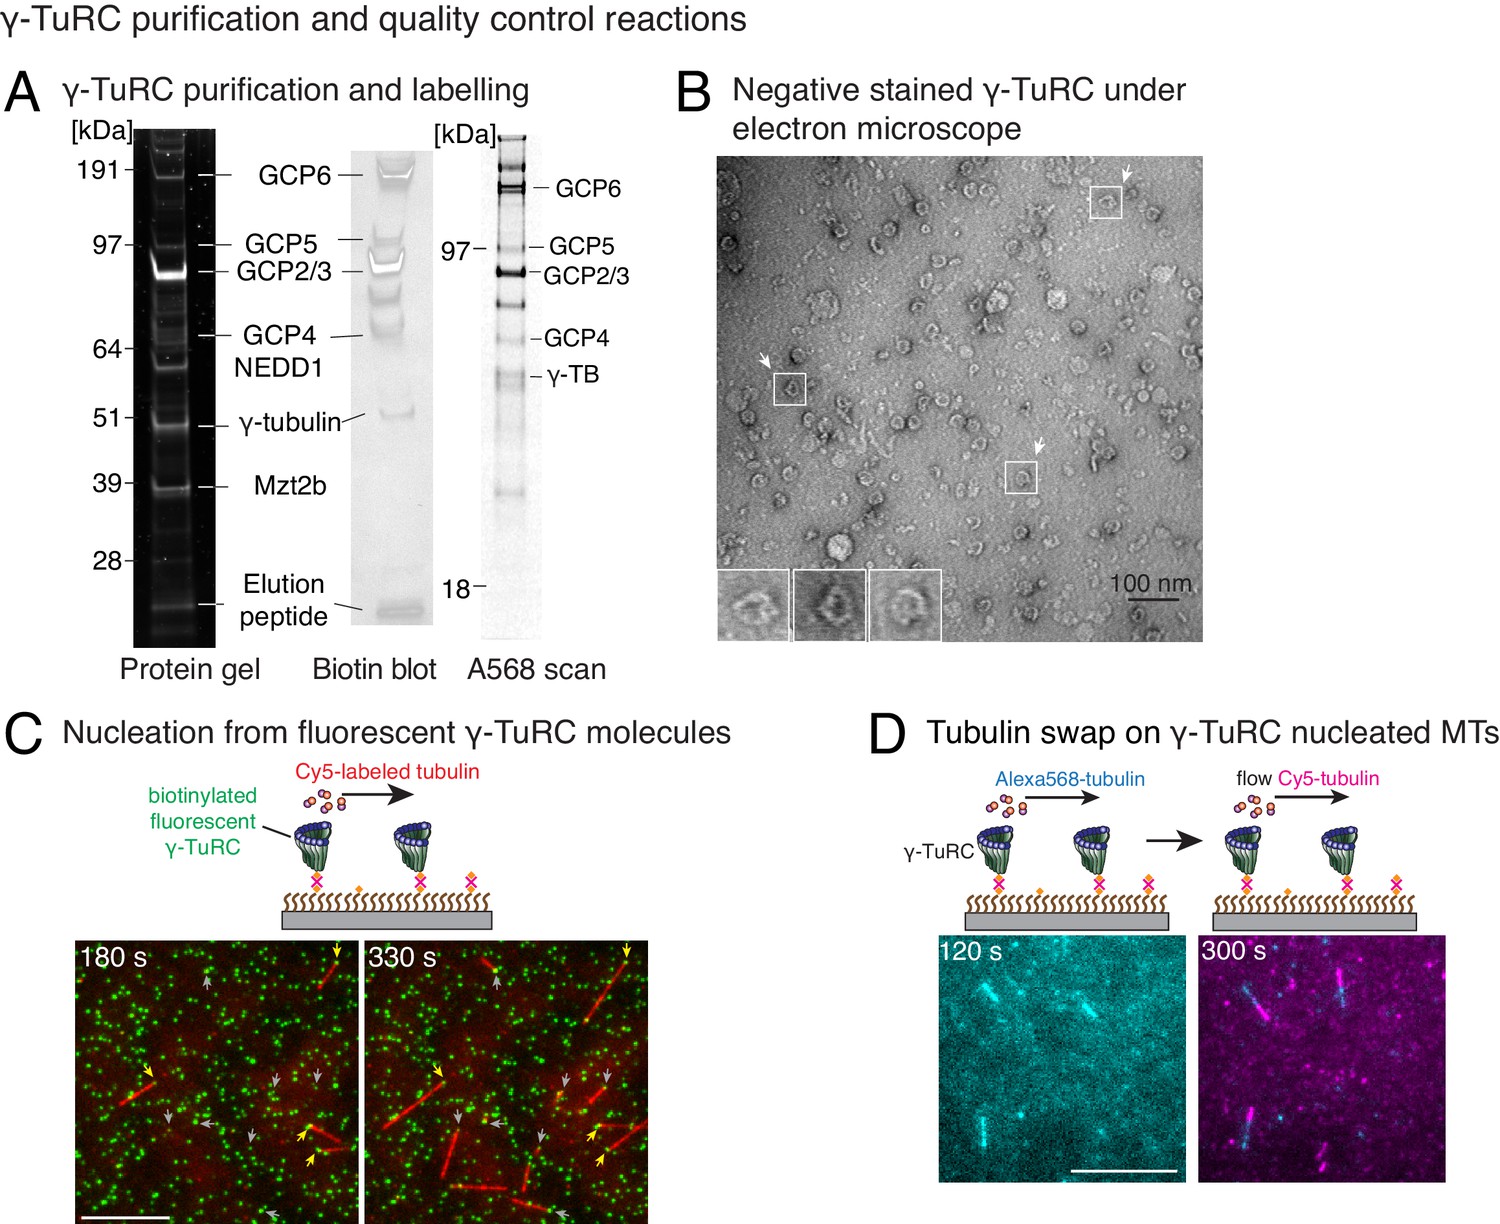
(A) Protein gel of purified γ-TuRC was stained with SYPRO Ruby stain (left). Biotinylated sites on γ-TuRC was visualized with alkaline phosphatase conjugated to avidin (middle), and Alexa-568-labeled subunits of γ-TuRC after additional fluorescent conjugation were visualized on an SDS-PAGE with Typhoon 9500 fluorescence imager (right). Major, known γ-TuRC components were detected in the purified protein and GCP2/3 are heavily biotinylated or Alexa-568 labeled during purification. The experiments were repeated thrice with independent γ-TuRC preparations, with the exception of Alexa-568 scan that was repeated twice. (B) Purified and biotinylated γ-TuRC was stained with uranyl acetate and visualized with transmission electron microscopy. Scale bar, 100 nm. The experiments were repeated over ten times with independent γ-TuRC preparations. (C) Fluorescentlylabeled and biotinylated γ-TuRC molecules (pseudo-colored as green) were attached, incubated with 10.5 μM αβ-tubulin (pseudo-colored as red) and time-lapse of MT nucleation after is shown. γ-TuRCs denoted with yellow arrows have nucleated a MTs before 180 s, while those labeled with gray arrows nucleated MTs between 180 and 330 s visualized in the time-lapse. Scale bar, 10 μm. See Video 2. The experiment was repeated six times with three independent γ-TuRC preparations. (D) MTs were first nucleated from γ-TuRC with Alexa 568-labeled tubulin (pseudo-colored in cyan), followed by introduction of Cy5-labeled tubulin (pseudo-colored in magenta). New tubulin incorporates only on the freely growing, plus-end but not at the nucleated minus-end. Scale bar, 10 μm. The experiment was performed three times with two independent γ-TuRC preparations. See also Figures 1–2 and Videos 1–2.
Figure 2
Molecular composition of transition state in γ-TuRC-mediated nucleation.
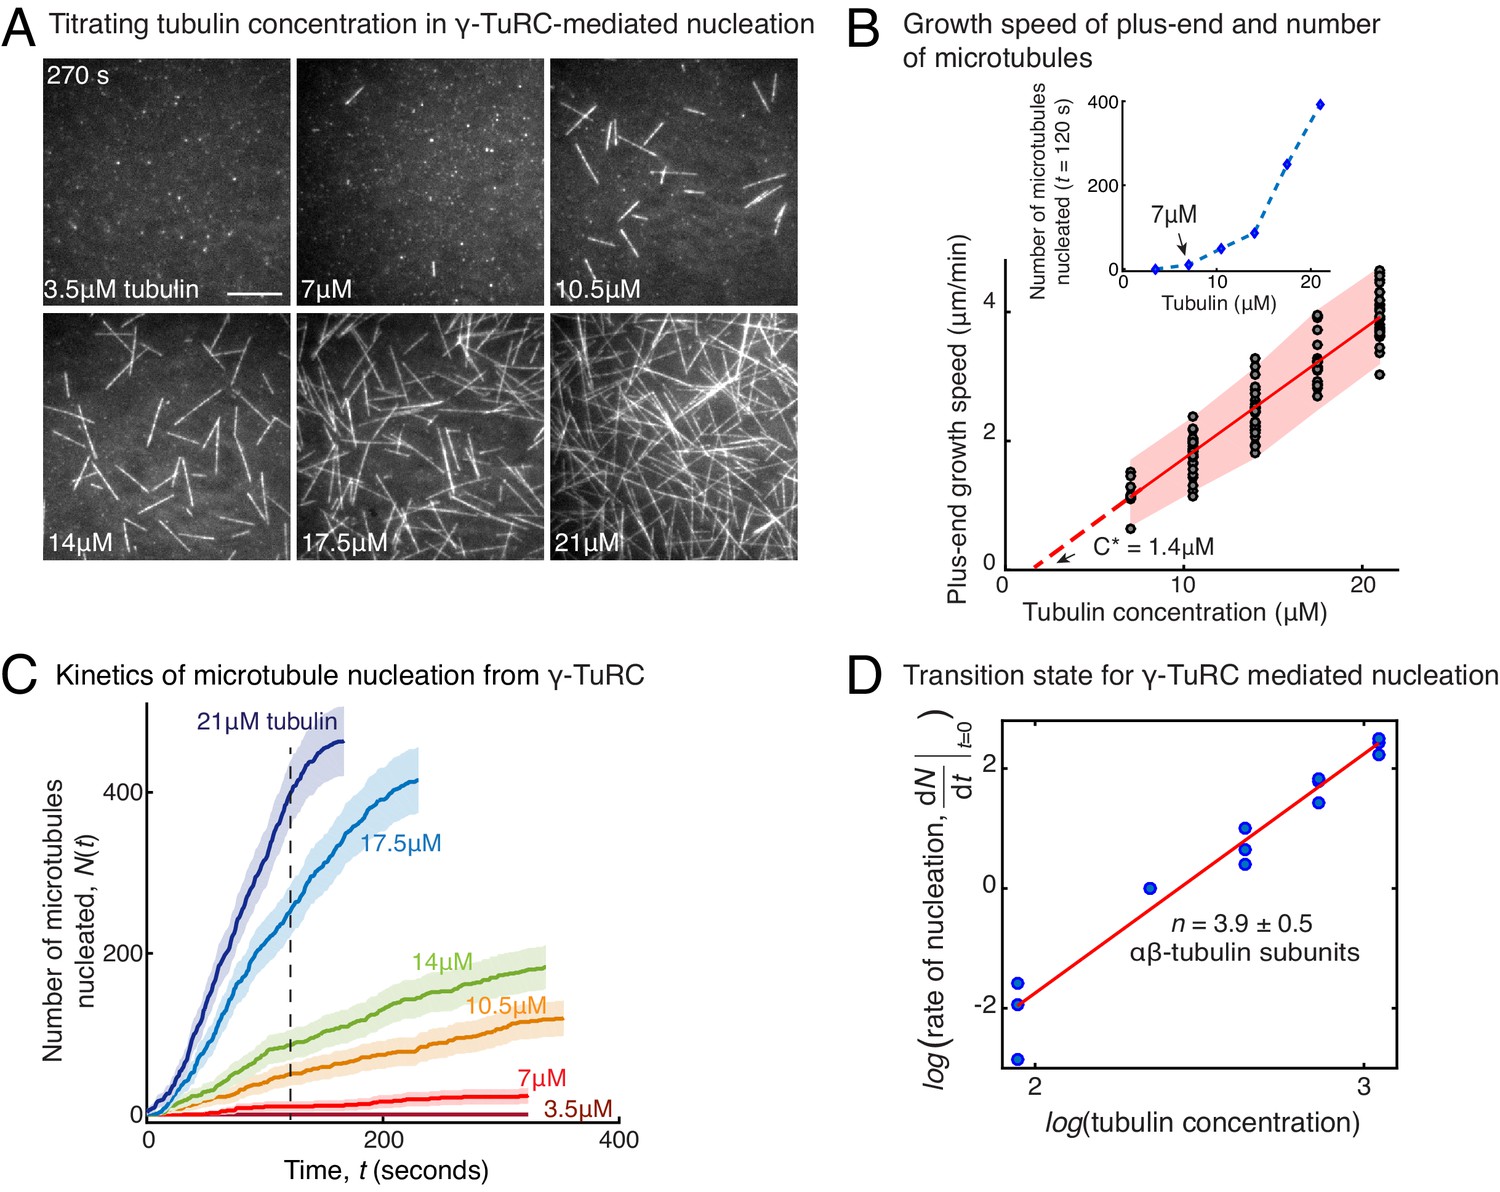
(A) Titrating tubulin concentration with constant the density of γ-TuRC. MT nucleation from γ-TuRC begins at 7μM tubulin. (B) MT plus-end growth speed increases linearly with tubulin concentration. Individual data points are plotted, and linear fit (red line) with shaded mean±2std (95% confidence interval) is displayed. Critical concentration for polymerization as C* = 1.4 μM. Inset: Number of MTs nucleated by γ-TuRCs within 120 s varies non-linearly with tubulin concentration. (C) Number of MTs nucleated (N(t)) over time (t) is plotted for varying tubulin concentration to obtain rate of nucleation as the slope of the initial part of the curves. Shaded regions represent 95% confidence interval in the number of nucleated MTs assuming a Poisson distribution as described in Materials and methods. (D) Number of tubulin dimers (n) in the critical nucleus on γ-TuRC was obtained as 3.9±0.5 from the equation displayed on a log-log axis as detailed in Materials and methods. The rate of nucleation at 10.5 μM was set to 1 to normalize differences in γ-TuRC concentration from individual experiments. The experiments and analyses in (A–D) were repeated identically three times with independent γ-TuRC preparations. MT nucleation data, prior to normalization, from one representative dataset is displayed in (B–C). Analyses from all repeats was pooled and normalized as described above, and data points from 15 nucleation-time curves are plotted in (D). See Video 3.
-
Figure 2—source data 1
Source data for Figure 2B–D.
Each excel sheet is labelled with individual figure panel. For Figure 2C, all three experimental replicates are supplied, and dataset one is plotted.
- https://cdn.elifesciences.org/articles/54253/elife-54253-fig2-data1-v3.xlsx
Figure 3 with 1 supplement

Comparison of γ-TuRC-mediated, spontaneous and seed-templated nucleation.
(A) Spontaneous MT nucleation (schematized) was measured with increasing tubulin concentration and high concentrations. 14 μM tubulin is required. (B) Number of MTs (N(t=τ)) nucleated spontaneously were plotted against tubulin concentration. Power-law curve was fit as on a log-log axis, and linear scale in the inset. Tubulin cooperativity (exponent) of n = 8.1±0.9 was obtained as detailed in Methods. Experiments and analyses in (A–B) were repeated thrice independently, all data were pooled and data points from 11 nucleation curves are plotted in (B). In the inset, data is represented in linear plot, where shaded regions represent 95% confidence interval in the number of nucleated MTs assuming a Poisson distribution as described in Materials and methods. Scale bars, 10μm. (C) Schematic and an example micrograph of blunt, stabilized MT seeds is shown and MT assembly from them was observed (bottom) with varying tubulin concentration. (D) Cumulative probability of MT assembly from seeds (p(t)) over time (t) is plotted and rate of nucleation was obtained as the slope from initial part of the curves. Shaded regions represent 95% confidence interval in the number of MTs assembled from seeds as described in Materials and methods. (E) As described in Methods, the measurements fit well to equation displayed on a log-log plot. n = 1±0.3 was obtained showing nearly non-cooperative assembly of tubulin dimers. The experiments and analyses in (C–E) were repeated three times independently. MT nucleation data, prior to normalization, from one representative dataset is displayed in (C–D). Analyses from all experiments was pooled, and data points from a total of 11 nucleation-time curves are reported in (E). See Figure 3—figure supplement 1 and Videos 4 and 5.
-
Figure 3—source data 1
Source data for Figure 3 panels B, D, E and Figure 3—figure supplement 1C–D.
Each excel sheet is labelled with individual figure panel. For Figure 3D, all three experimental replicates are supplied, and dataset one is plotted.
- https://cdn.elifesciences.org/articles/54253/elife-54253-fig3-data1-v3.xlsx
Figure 3—figure supplement 1

Controls for spontaneous and blunt seed-mediated microtubule nucleation.
(A) Representative kymographs of spontaneously nucleated MT is displayed, demonstrating that MTs grow from both the minus-end (dotted line) and the plus-end (solid line) and can be distinguished from γ-TuRC-mediated nucleation. Scale bar, 10 μm. Tens of kymographs were generated from at least three independent experiments. (B) Comparison of γ-TuRC-mediated with spontaneous MT nucleation and reactions where γ-TuRC was not attached. MTs were nucleated by attaching purified γ-TuRC (left), adding control buffer to allow for spontaneous MT nucleation (middle) or leaving avidin out to test the level of nucleation by non-specifically attached γ-TuRCs (right). Robust MT nucleation only occurs with γ-TuRC attached to coverslips and not in control reactions. Scale bar, 10 μm. (C) MTs nucleation from γ-TuRCs or spontaneously were compared directly at 10.5 μM tubulin concentrations. Shaded regions represent 95% confidence interval in the number of nucleated MTs assuming a Poisson distribution as described in Materials and methods. γ-TuRC nucleates significantly higher number of MTs than spontaneous assembly. The experimental set and analyses in (B–C) were repeated identically two times with independent γ-TuRC preparations. (D) MTs were assembled from blunt seeds. Tubulin concentration was titrated, and growth speed of MT plus-ends was measured from kymographs (blue circles). Critical concentration (C* = 1.4 μM) was determined from the linear fit (blue line) with shaded 95% confidence intervals. The experiment and analyses in were repeated thrice with independent seed preparations. The growth speed of MTs assembled from seeds was overlaid with those nucleated from γ-TuRC (Figure 2B, red circles and line) for comparison. See also Videos 3, 4, 5 and Figures 2, 3.
Figure 4 with 2 supplements
γ-tubulin binds to αβ-tubulin with a high affinity.
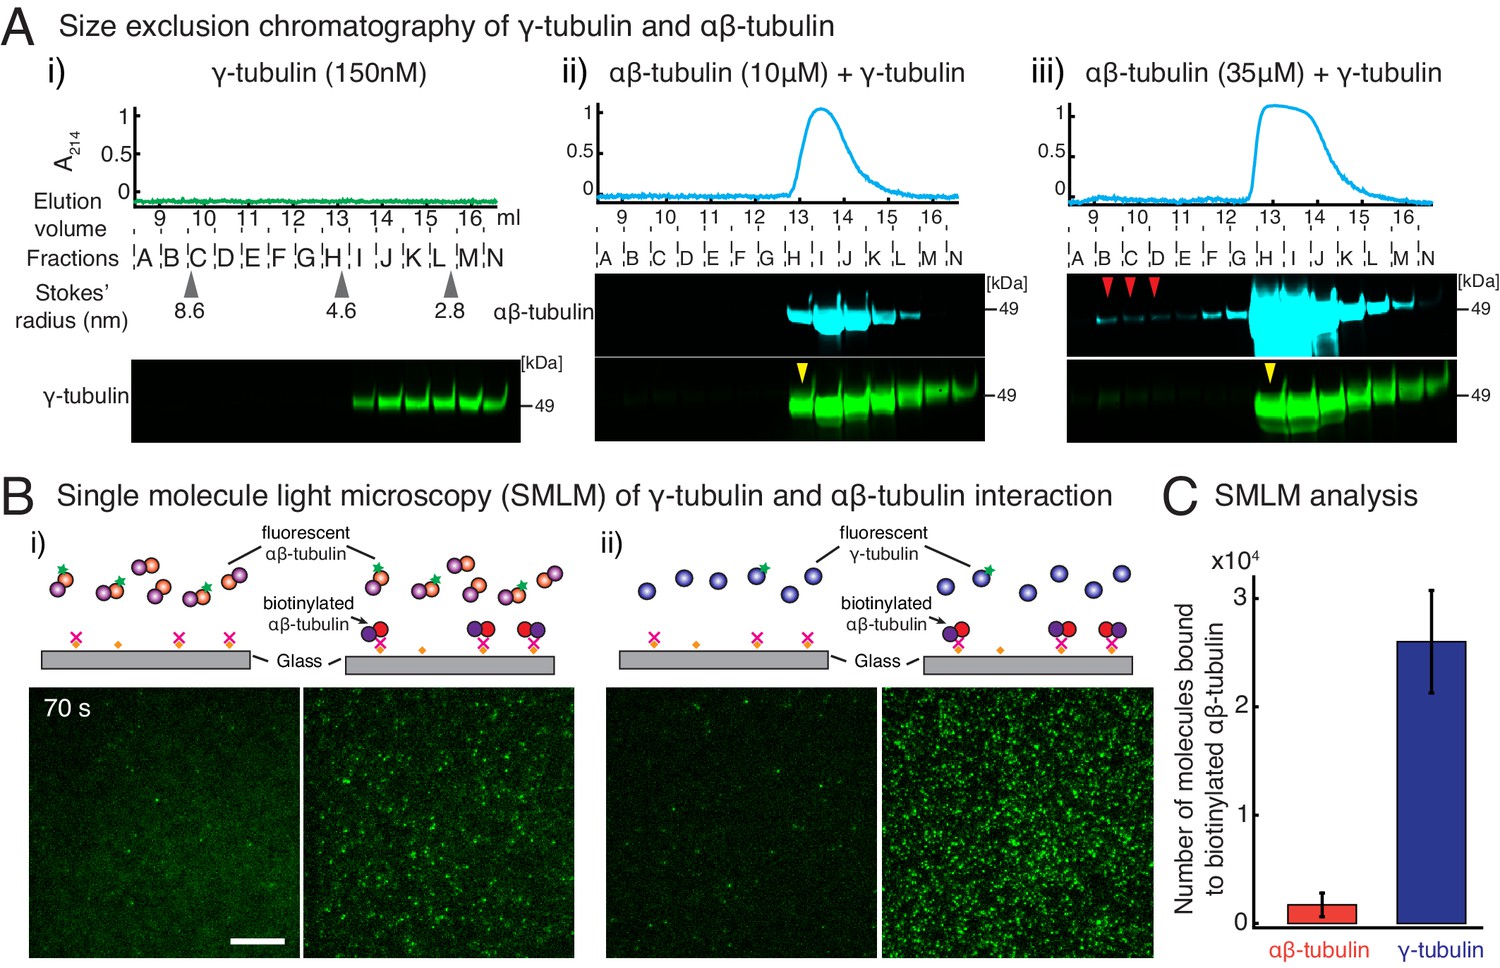
(A) Size-exclusion chromatography was performed with 150 nM of γ-tubulin alone (i) and with 35 μM and 10 μM αβ-tubulin in (ii) and (iii), respectively. Gel filtration fractions were analyzed via SDS–PAGE followed by immunoblot with γ-tubulin and αβ-tubulin antibodies. A shift in the γ-tubulin elution to fraction H was observed with both 35 μM and 10 μM αβ-tubulin, denoting complex formation with αβ-tubulin. See Figure 4—figure supplement 1A. Stokes’ radii of reference proteins: thyroglobulin (8.6 nm), aldolase (4.6 nm) and ovalbumin (2.8 nm), are marked at their elution peak. Size exclusion runs were repeated three times, with the exception of 10 μM αβ-tubulin run that was performed twice. (B) Single molecule microscopy was performed with γ-tubulin and αβ-tubulin. Control buffer (left panels, (i) and (ii)) or biotinylated αβ-tubulin (right panels, (i) and (ii)) was attached to coverslips, incubated with fluorescent αβ-tubulin (i) or γ-tubulin (ii) molecules, set as 0 s, and their binding at 60–90 s. (C) Number of bound molecules were analyzed for the first 15 s of observation described in Materials and methods. Experiments and analyses in (B–C) were repeated identically two times, pooled and reported. n = 56 data points each were displayed as mean ± std in the bar graph in (C). Further confirmed with a third supporting experimental set where the observation began later at 180 s and was therefore, not pooled. See also Figure 4—figure supplements 1–2.
-
Figure 4—source data 1
Source data for Figure 4C.
- https://cdn.elifesciences.org/articles/54253/elife-54253-fig4-data1-v3.xlsx
Figure 4—figure supplement 1
Purified γ-tubulin binds αβ-tubulin with high affinity in vitro.
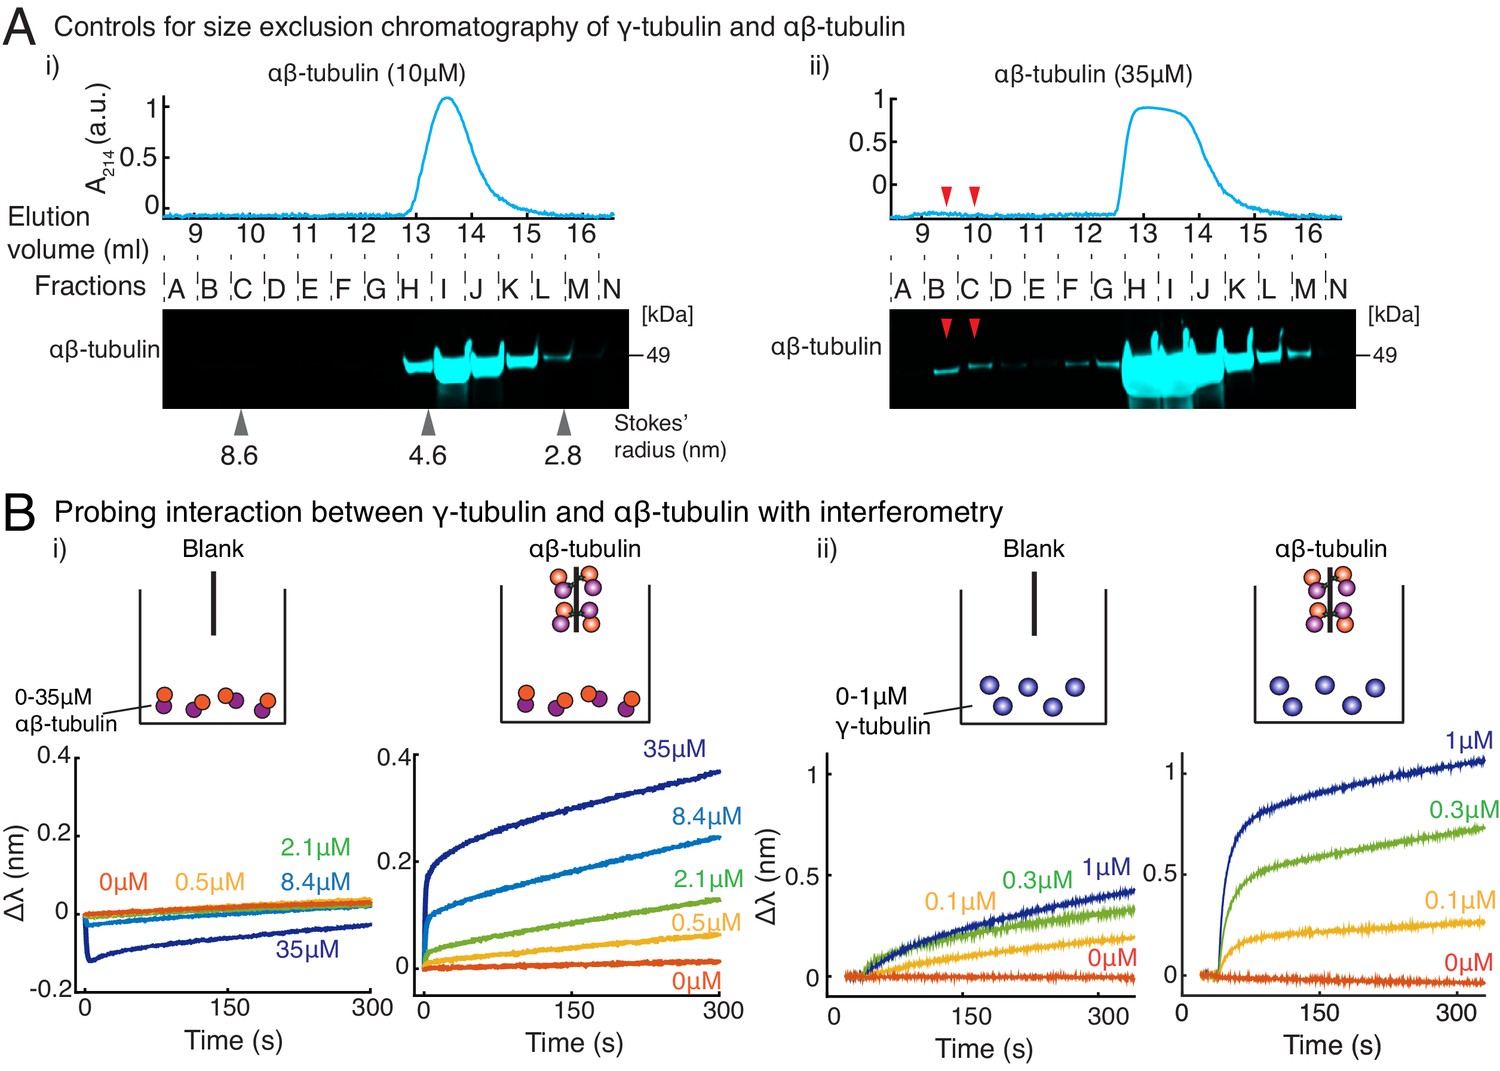
(A) Size-exclusion chromatography was performed with 35μM and 10μM αβ-tubulin alone in (i) and (ii), respectively. Gel filtration fractions were analyzed via SDS–PAGE followed by immunoblot with αβ-tubulin antibodies. At high concentration (35μM), αβ/αβ-tubulin self-interaction occurs, and oligomeric species elutes in fractions B-C, as seen via the immunoblot and absorbance reading. Oligomeric species is not observed at 10 μM αβ-tubulin. Stokes’ radii of reference proteins: thyroglobulin (8.6 nm), aldolase (4.6 nm) and ovalbumin (2.8 nm), are marked at their elution peak. Size exclusion runs was repeated three times for 35 μM αβ-tubulin and twice for 10 μM αβ-tubulin. (B) Molecular interaction between γ/αβ-tubulin was verified with bio-layer interferometry. Buffer ((i) and (ii), left curves) or biotin-tagged αβ-tubulin ((i) and (ii), right curves) was loaded on the probe as bait. Untagged αβ-tubulin (i) at 0-35 μM or γ-tubulin (ii) at 0-1 μM were used as prey. Wavelength shift, (nm) was recorded to estimate the mass of bound protein on the probe. More than 2 μM of αβ-tubulin was needed to observe significant binding to biotin-αβ-tubulin. While γ-tubulin non-specifically associates with the probe to a low extent, significant association with biotin-αβ-tubulin over this non-specific binding was observed at significantly lower concentrations (300 nM). The experiments in (i) and (ii) were repeated two times independently. See also Figure 4.
Figure 4—figure supplement 2
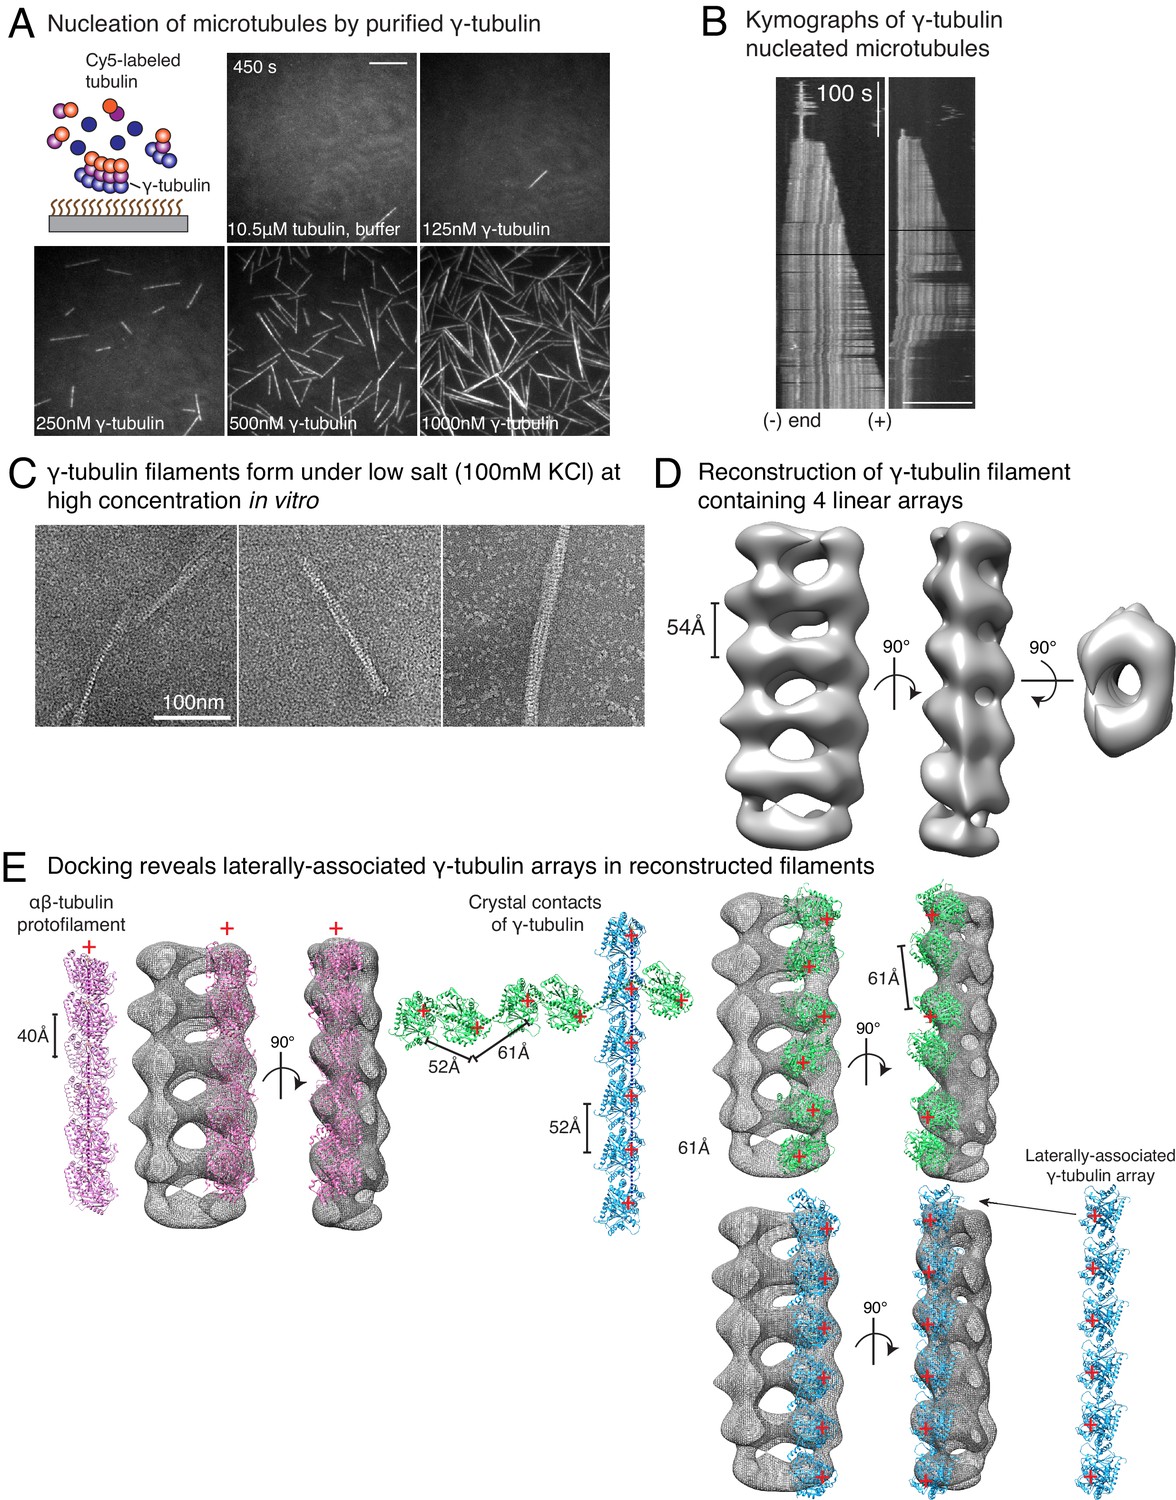
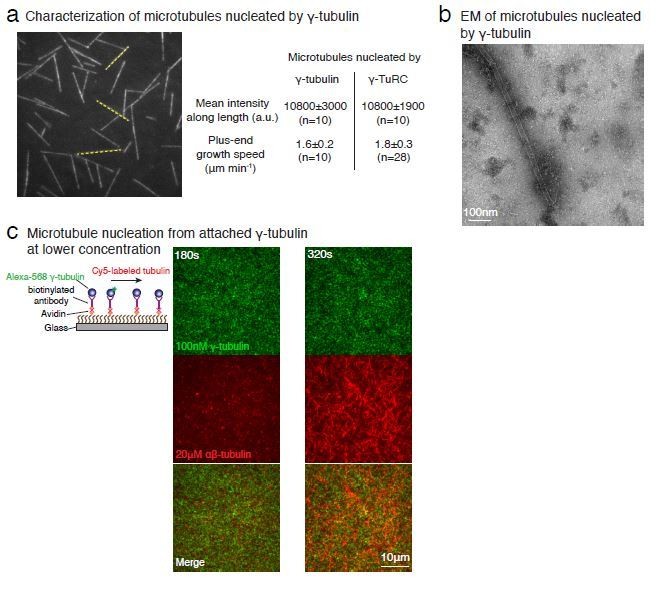
Purified γ-tubulin nucleates microtubules and assembles laterally into filaments.
(A) MTs nucleate from high concentration of purified γ-tubulin efficiently and (B) minus-ends of γ-tubulin-nucleated MTs remain capped while the plus-ends polymerize. The experiments were repeated twice for all concentration points, with one additional supporting experimental set with fewer γ-tubulin concentrations. (C) γ-tubulin self-assembles into filaments of variable widths at high concentration (1–2 μM) and physiological salt (100 mM KCl) as observed with negative-stain, transmission electron microscopy. Scale bar, 100 nm. (D) 3D reconstructions of negatively stained γ-tubulin filaments with thin width shows four linearly arrays of interacting γ-tubulins. Repeat distance of approximately 54 Å was observed between each γ-tubulin within a linear array. (E) Longitudinal arrangement of αβ-tubulins (pink filament), generated by isolating one protofilament from PDB: 6DPU (Zhang et al., 2018; Zhang and Nogales, 2018), docked into map (see Methods). Repeat distance between longitudinally interacting αβ-tubulins (40 Å) does not match the map spacing (54 Å). Lateral arrangement of γ-tubulin array (blue filament) was generated from the crystal contacts observed in the crystal lattice of PDB: 1Z5W (Aldaz et al., 2005a; Aldaz et al., 2005b). An alternate γ-tubulin arrangement was also generated (green filament) was isolated from the other possible filament in this P21 crystal lattice of PDB: 1Z5W. In this arrangement, neither do the neighboring γ-tubulins arrange into straight filaments nor do they show lateral contacts (green filament). Both filaments were docked into the one position in the map. Laterally-associated γ-tubulin array (blue filament) display a good fit where the γ-tubulin spacing closely matches that of the reconstructed filament. In the arrangement displayed in the green filament, not only are the alternate γ-tubulins farther apart (61 Å) and do not make a direct contact, the alternate γ-tubulins also place off-axis and do not form a linear array. This arrangement does not recapitulate the linear γ-tubulin arrangement where all γ-tubulins are 54 Å apart, as observed in the map. Thus, our filaments are composed of laterally-associated, linear γ-tubulin arrays.
Figure 5 with 2 supplements

Monte Carlo simulations of microtubule nucleation from γ-TuRC.
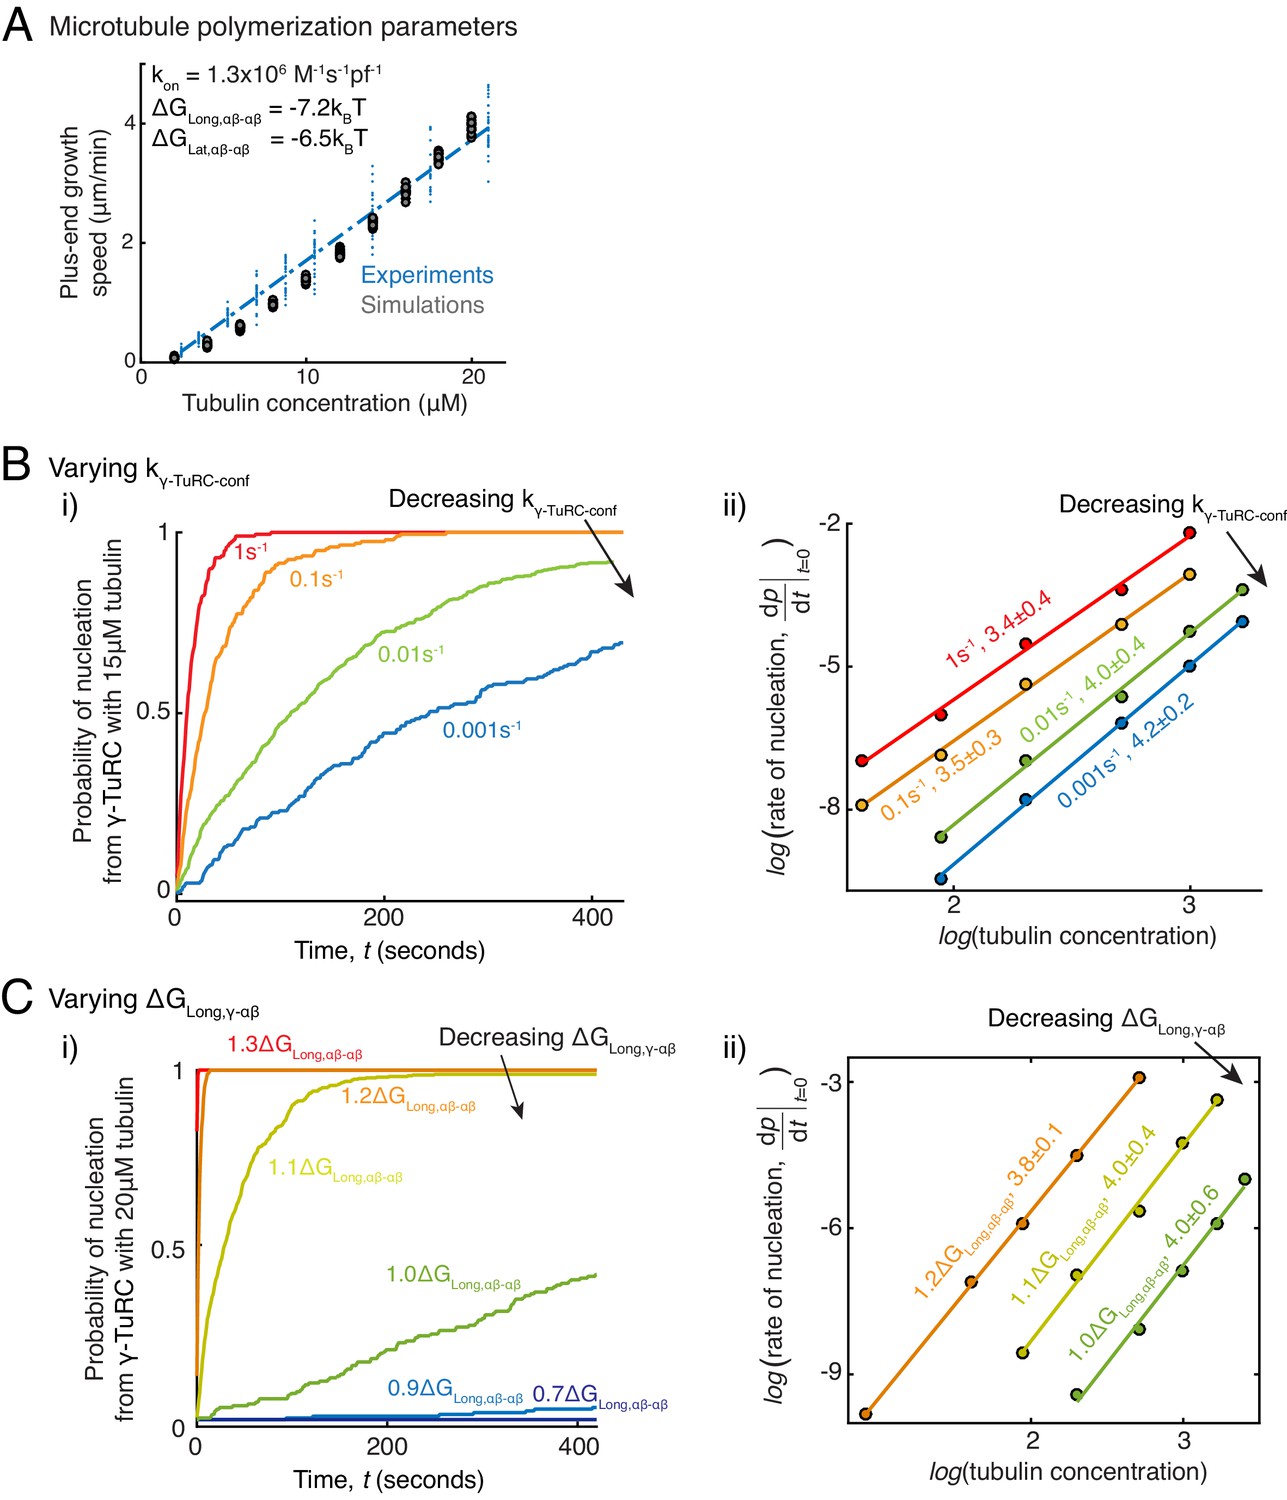
(A) Kinetic Monte Carlo simulations of MT nucleation were performed. Helical MT lattice was simulated with 13 protofilaments and a pitch of 3 tubulin monomers across the seam. Native γ-TuRC was simulated in an open conformation and was allowed transition into a closed conformation with a thermodynamic penalty of . αβ-tubulin dimers form longitudinal bonds with energies, and to γ-tubulin and other αβ-tubulins, respectively, and lateral bond with energy, with neighboring αβ-tubulin dimers. (B) MT length (μm) versus time (seconds) traces of two independent simulations are presented (bottom). MT nucleation occurs are variable time points for each model realization. Zoomed-in insets of the first simulation show the length of the tallest protofilament (nm) and total number of αβ-tubulin dimers assembled in the first 200 ms and 5 s near the transition state of the simulation. (C) Simulations were performed with , , , . was varied from +. Tubulin concentration was varied from 2.5 to 50 μM. 200 simulations were performed for a given tubulin concentration at every parameter set, except for where 500 simulations were performed. From probability of MT nucleation (p(t)) versus time (t) curves, the initial rate of nucleation was measured and plotted against concentration on a log-log axis as detailed in Materials and methods. (D) With the parameters defined above and , the transition state at the time of γ-TuRC’s conformational change was recorded for n=2119 simulations. Normalized histogram of total number of αβ-tubulin dimers is plotted (left). Three-dimensional probability distribution of total number of αβ-tubulin dimers (x) and number of lateral αβ-tubulin interactions (y) is plotted (right). The most populated transition states are denoted with coordinates (x,y) and schematized. See also Figure 5—figure supplements 1, 2.
Figure 5—figure supplement 1
Parameter variation in Monte Carlo simulations of γ-TuRC-mediated nucleation.
(A) MT plus-end assembly was simulated. Parameter values used: , . 20 simulations each were performed at tubulin concentration 2-20 μM. MT growth speed was obtained from each MT length versus time trace and overlaid on experimental data. (B) MT nucleation from γ-TuRC was simulated with input polymerization parameters defined above, and . was varied from . Tubulin concentration was varied from 5 to30μM. 200 simulations were performed for a given tubulin concentration at every value, except for where 500 simulations were performed. Probability of MT nucleation (p(t)) versus time (t) curves at 15 μM tubulin are displayed in (i). The initial rate of nucleation was measured and plotted against concentration on a log-log axis in (ii). The critical nucleus size does not change significantly while the absolute rate of nucleation decreases with decreasing . (C) MT nucleation from γ-TuRC was simulated with input polymerization parameters defined above, and . was varied from . 200 simulations were performed for every value at tubulin concentrations between 2.5 and 30 μM, except for where 500 simulations were performed. Probability of MT nucleation (p(t)) versus time (t) curves at 20 μM tubulin are displayed in (i). The initial rate of nucleation was measured and plotted against concentration on a log-log axis in (ii). For , either few MTs nucleate or nucleation occurs immediately, and critical nucleus size could not be accurately measured. See also Figure 5.
Figure 5—figure supplement 2
Simulations of microtubule nucleation from γ-TuRC and from blunt seeds.
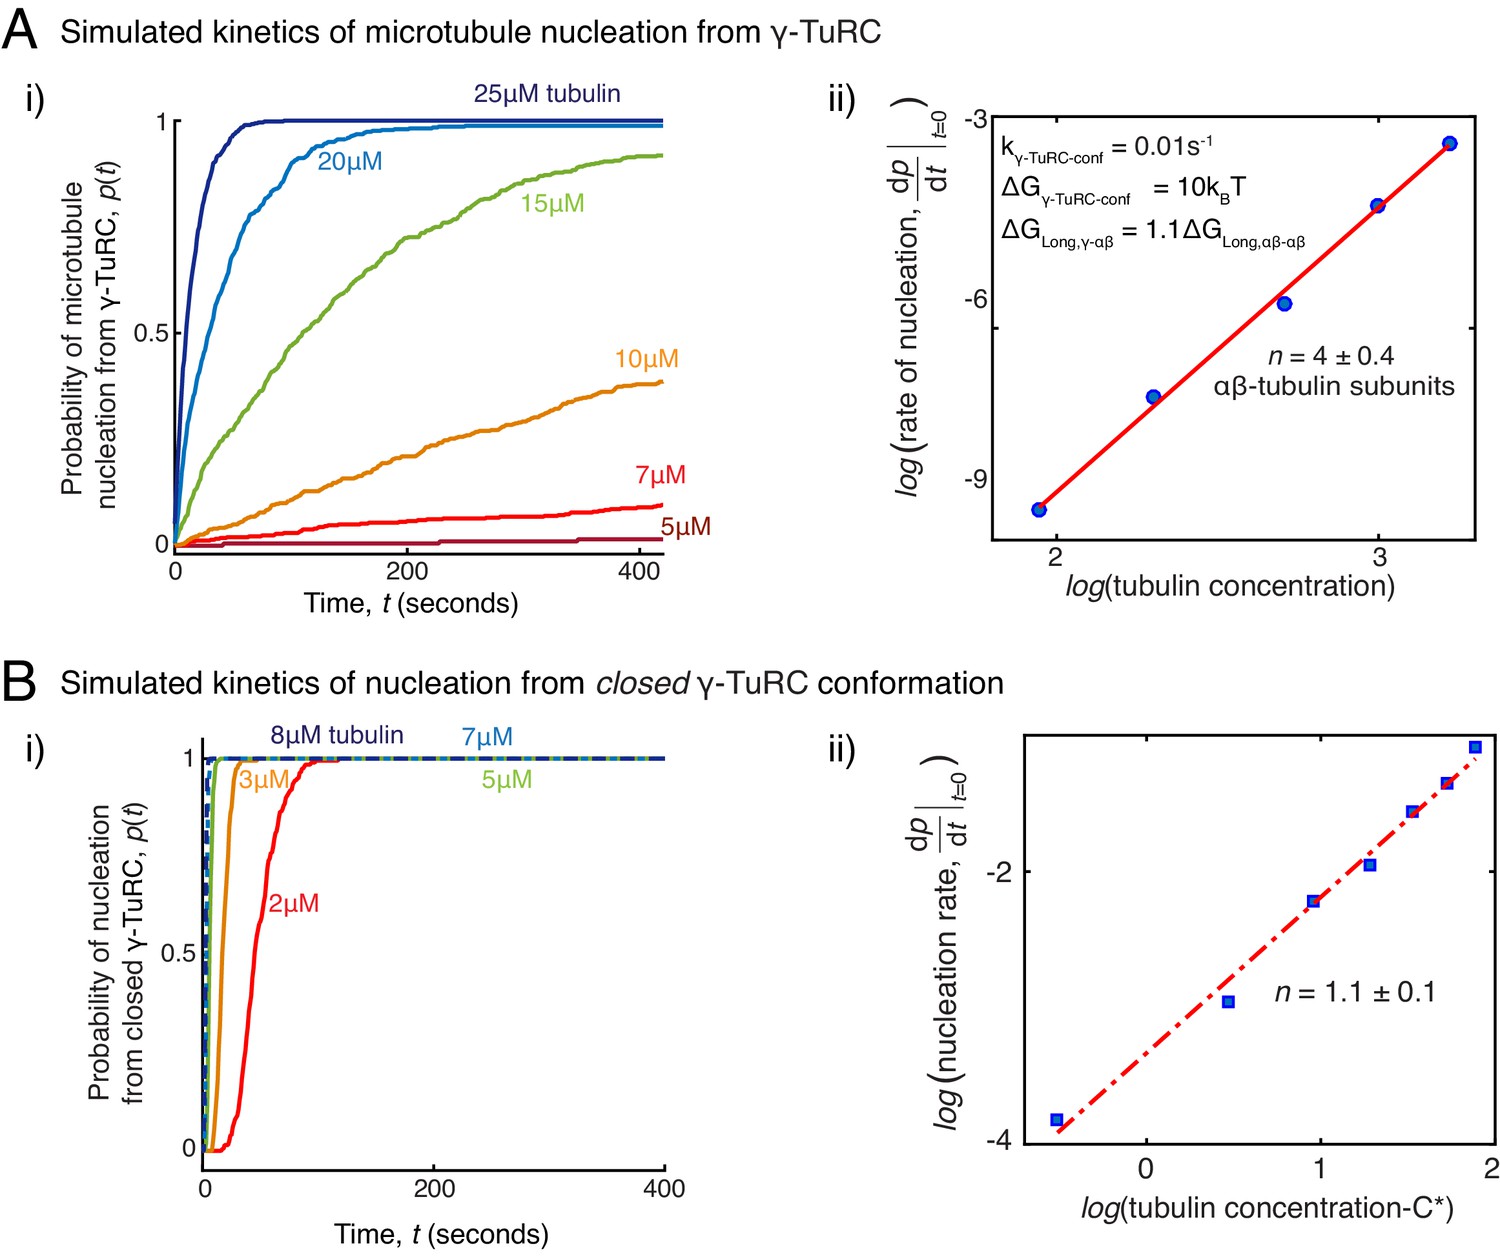
(A) Simulations recapitulated experimental data for γ-TuRC-mediated MT nucleation. Parameter values used: , , , , and . 500 simulations each were performed for a range of tubulin concentration 5 to25 μM. Probability of MT nucleation (p(t)) versus time (t) is displayed in (i). The initial rate of nucleation was measured at each tubulin concentration and plotted against concentration on a log-log axis in (ii). Linear curve was fit for n=5 simulated data points, and critical nucleus of 4 ± 0.4 αβ-tubulins. See Figure 2C-D for comparison with experimental results. (B) MT nucleation dynamics from a closed γ-TuRC were simulated to compare with experimental data for blunt-seed-mediated MT assembly. Parameter values used: , , , . An input for or were not required because γ-TuRC does not undergo an open-to-closed transition. 200 simulations each were performed for a range of tubulin concentration 2-8 μM. For each simulation, time point where over 50nm length of MT has assembled was recorded. Probability of MT nucleation (p(t)) versus time (t) is displayed in (i). The initial rate of nucleation was measured at each tubulin concentration and plotted against concentration, C-C* on a log-log axis in (ii). Critical concentration of polymerization, C*=1.4 μM. Linear curve was fit for n=7 simulated data points, and critical nucleus of 1.1 ± 1 αβ-tubulins. See Figure 3D-E for comparison with experimental results. See also Figure 5.
Figure 6 with 1 supplement
Regulation of γ-TuRC-mediated nucleation by putative activation factors.
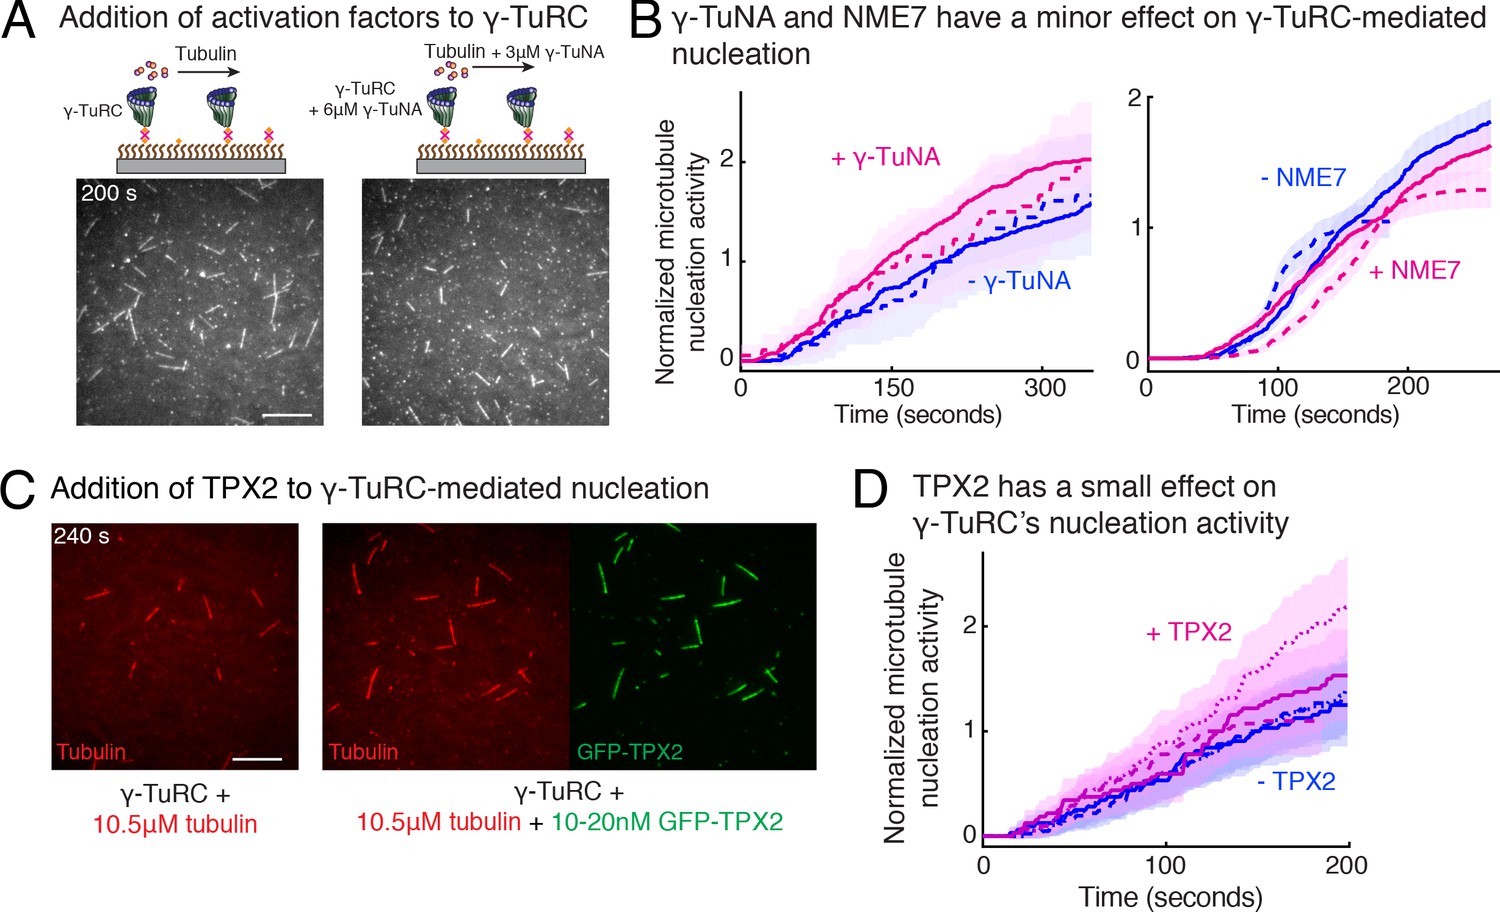
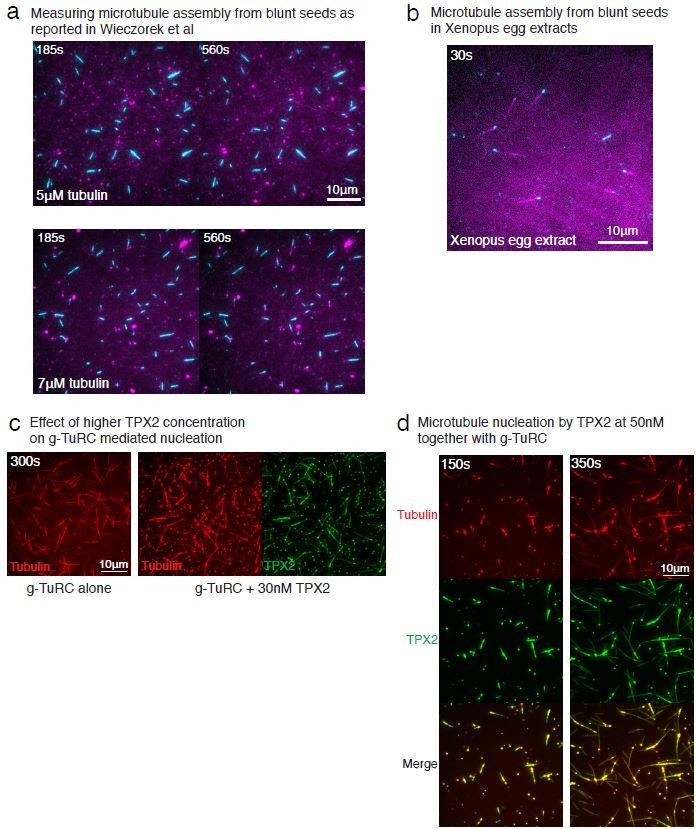
(A) A constant density of γ-TuRC molecules were attached without (left) and with (right) 6μM CDK5RAP2’s γ-TuNA motif and 10.5μM tubulin ± 3μM additional γ-TuNA was added. Scale bar, 10 μm. (B) MTs nucleated from γ-TuRC molecules were analyzed and 3-6 μM CDK5RAP2’s γ-TuNA motif (left) or 1-6 μM NME7 (right). Experiments and analyses in (A–B) were individually repeated twice on different days of experimentation with independent or same γ-TuRC preparations. Number of MTs nucleated in control reactions at 200 s for γ-TuNA, and at 150 s for NME7 was set to 1 to account for variable γ-TuRC concentration across purifications, all data were pooled and reported. Individual datasets with ±γ-TuNA and ±NME7 is represented with solid or dashed curves. Shaded regions represent 95% confidence interval from each dataset in the number of nucleated MTs assuming a Poisson distribution as described in Materials and methods. (C–D) A constant density of γ-TuRC molecules were attached and 10.5 μM tubulin ± 10-20 nM GFP-TPX2 was added. Experiments and analyses were repeated thrice with independent γ-TuRC preparations. To account for the variable γ-TuRC concentration across purifications, the number of MTs nucleated in control reactions at 150 s was set to 1. All data were pooled and reported. Individual dataset with ±TPX2 is represented with solid, dashed or dotted curves. Shaded regions represent 95% confidence interval from each dataset in the number of nucleated MTs assuming a Poisson distribution as described in Methods. See Fiure 6—figure supplement 1 and Video 6.
-
Figure 6—source data 1
Source data for Figure 6 panels B, D.
- https://cdn.elifesciences.org/articles/54253/elife-54253-fig6-data1-v3.xlsx
Figure 6—figure supplement 1
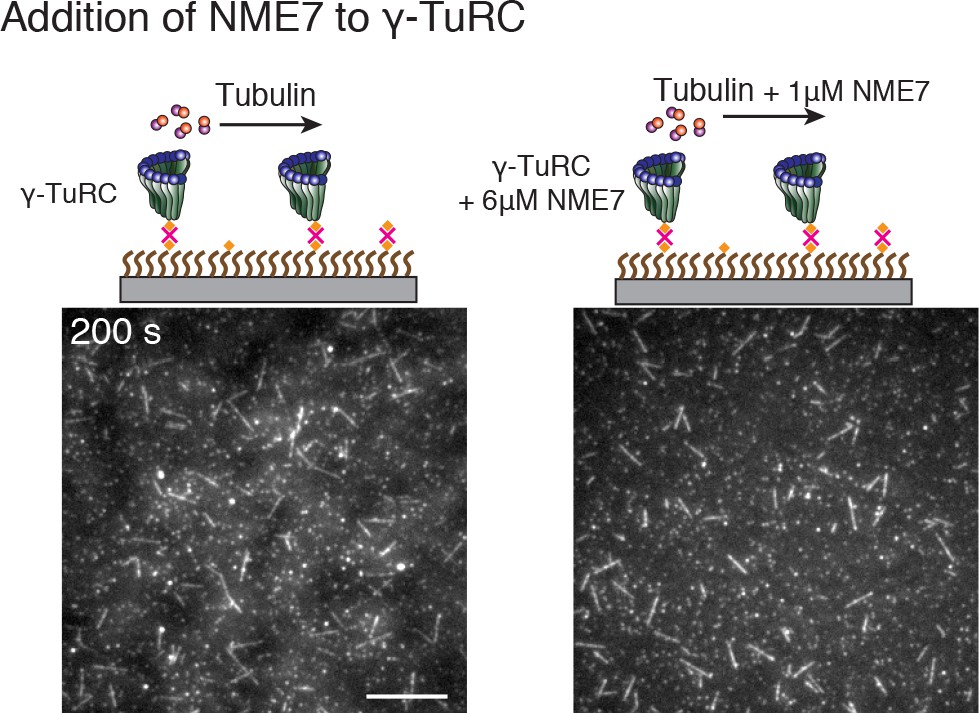
Effect of putative activation factor NME7 on γ-TuRC-mediated nucleation.
Figure 7 with 2 supplements
Role of XMAP215 and microtubule-associated proteins in microtubule nucleation with γ-TuRC.
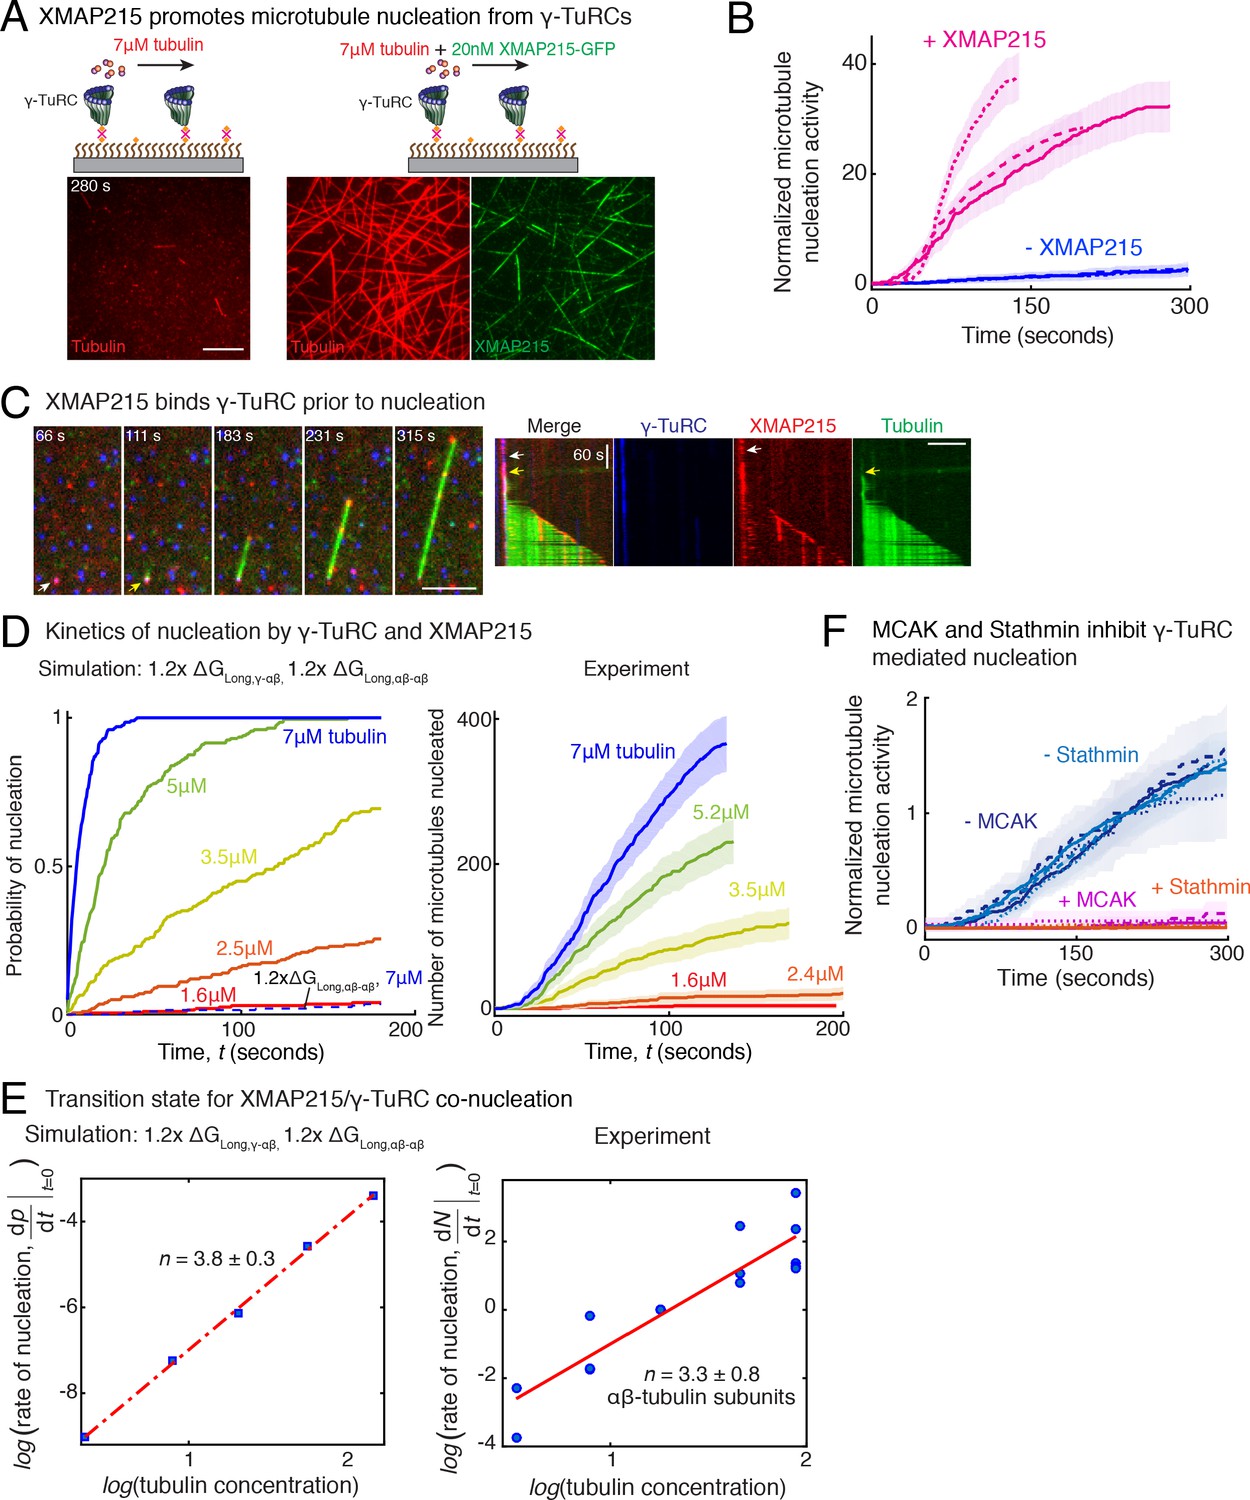
(A) γ-TuRCs were attached and 7μM tubulin (pseudo-colored in red) ± 20nM XMAP215-GFP (pseudo-colored in green) was added. Scale bar, 10 μm. Experiments and analyses in (A–B) were repeated thrice with independent γ-TuRC preparations. (B) Number of MTs nucleated (N(t)) over time (t) was measured and control reactions at 120 s was set to 1 to account for variable γ-TuRC concentration across purifications, all data were pooled and reported. Individual datasets with ±XMAP215 is represented with solid or dashed curves. Shaded regions represent 95% confidence interval from each dataset in the number of nucleated MTs assuming a Poisson distribution as described in Materials and methods. See also Figure 7—figure supplement 1A-B. (C) Sequence of events during cooperative MT nucleation by γ-TuRC and XMAP215 was visualized using labeled γ-TuRC (blue), XMAP215 (red) and tubulin (green) represented in a time sequence and kymograph. γ-TuRC and XMAP215 form a complex prior to MT nucleation. XMAP215 molecules reside on γ-TuRC for before MT nucleation. The experiment was repeated a total of eight times with two independent γ-TuRC preparations and independent XMAP215 purifications. Scale bar, 5μm. (D–E) Number of MTs nucleated (N(t)) over time (t) was measured after titrating tubulin with constant γ-TuRC and XMAP215 concentration. XMAP215/γ-TuRC molecules nucleate MTs from 1.6 μM tubulin. Shaded regions represent 95% confidence interval in the number of nucleated MTs assuming a Poisson distribution as described in Materials and methods. (E) Number of tubulin dimers (n) in the critical nucleus on cooperative nucleation by γ-TuRC/XMAP215 was obtained as 3.3 ± 0.8 from the equation displayed on a log-log axis as detailed in Materials and methods. The rate of nucleation at 3.5μM was set to 1 to normalize differences in γ-TuRC concentration from individual experiments. Experiment and analyses in (D–E) was repeated thrice over the entire concentration range with independent γ-TuRC preparations, and fewer concentration points were repeated another two times. All five datasets were pooled and data points from a total of 18 nucleation-time curves are reported in (E). Simulations were adapted to understand how XMAP215 changes the thermodynamics of γ-TuRC-mediated nucleation. Parameter values used: , , , and . Compared to simulations for γ-TuRC alone (Figure S6A), either was increased 1.2-fold, as proposed previously (VanBuren et al., 2002), or both and were increased 1.2-fold. 200 simulations each were performed for a range of tubulin concentration 1.6-7 μM. Probability of MT nucleation (p(t)) versus time (t) is displayed in (D). The initial rate of nucleation was measured at each tubulin concentration and plotted against concentration on a log-log axis in (E). Linear curve was fit for n=5 simulated data points, and critical nucleus of 3.8 ± 0.3 αβ-tubulins. Increasing all longitudinal bond energies reproduces the effect of XMAP215 on γ-TuRC-mediated nucleation. (F) Number of MTs nucleated was measured to assess the effect of inhibitory MAPs MCAK or Stathmin on γ-TuRC-mediated nucleation. 10.5μM tubulin ± 10nM MCAK, or 7-10.5μM tubulin ± 2-5μM Stathmin was added to attached γ-TuRC- molecules, and MCAK and Stathmin were both found to inhibit γ-TuRC-mediated nucleation. Experiments and analyses for both MAPs were repeated thrice individually with independent γ-TuRC preparations. Number of MTs nucleated in control reactions at 200 seconds was set to 1 to account for variable γ-TuRC concentration across purifications, all data was pooled and reported. Individual dataset with ± MCAK are reported with solid, dashed or dotted curves. For Stathmin, two datasets for 10.5 μM tubulin ± 5 μM Stathmin are reported with solid and dashed lines, and one dataset for 7 μM tubulin ± 2 μM Stathmin in dotted line. Shaded regions represent 95% confidence interval from each dataset in the number of nucleated MTs assuming a Poisson distribution as described in Materials and methods. See Figure 7—figre supplement 1, 2 and Videos 7, 8, 9.
-
Figure 7—source data 1
Source data for Figure 7 panels B, D, E, F and Figure 7—figure supplement 1 panels B, E.
Each excel sheet is labelled with individual figure panel. For Figure 7D, all five experimental replicates are supplied, and dataset one is plotted. Source Code. MATLAB code for Monte Carlo simulations used to model the dynamics of γ-TuRC-mediated nucleation. Materials and methods section details how the simulation was set up and performed. Figure 5—figure supplement 2 provide the parameters used to model our experimental data.
- https://cdn.elifesciences.org/articles/54253/elife-54253-fig7-data1-v3.xlsx
Figure 7—figure supplement 1
Role of XMAP215 on γ-TuRC-mediated microtubule nucleation.
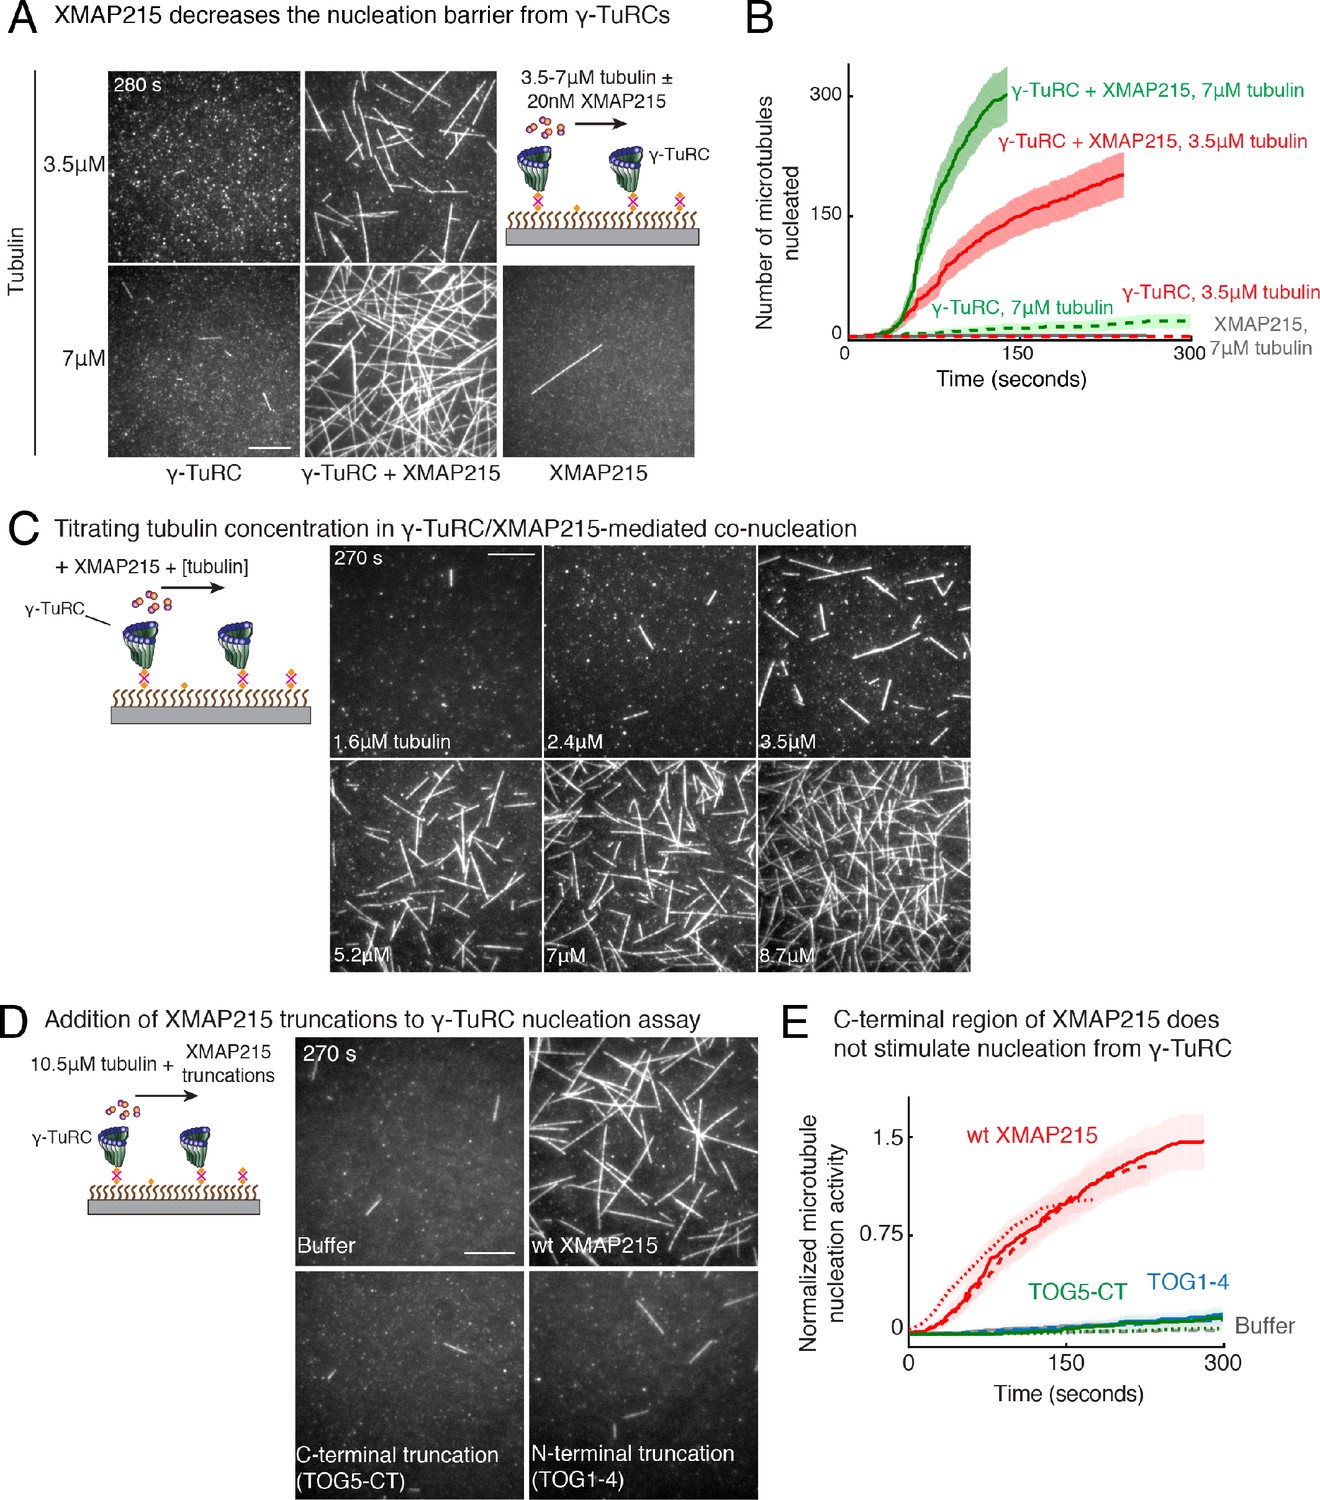
(A) γ-TuRCs were attached and 3.5-7μM tubulin ± 20nM XMAP215-GFP was added. Experiment was repeated identically two times with independent γ-TuRC purifications. One additional replicated was performed with 7μM tubulin. (B) Number of MTs nucleated (N(t)) over time (t) is plotted and shaded regions represent 95% confidence interval in the number of nucleated MTs assuming a Poisson distribution as described in Materials and methods. Analyses were repeated twice with independent γ-TuRC purifications, and representative dataset is reported to highlight the absolute increase in the number of MTs nucleated by XMAP215. One additional supporting replicate was obtained only at 7 μM tubulin. (C) Titrating tubulin with constant γ-TuRC and XMAP215 concentration. XMAP215/γ-TuRC molecules were observed to nucleate MTs at low tubulin concentrations of 1.6-3.5 μM. Experiments were repeated at three times with independent γ-TuRC preparations, and fewer concentration points were repeated another two times. (D) The role of C-terminal region of XMAP215 or N-terminal region was tested in the cooperative nucleation with purified γ-TuRC. MTs nucleated by γ-TuRC alone (top-left panel), γ-TuRC with 20nM full-length XMAP215 (top-right panel), γ-TuRC with 20 nM C-terminal domain containing TOG5 and C-terminus of XMAP215 (bottom-left panel), or γ-TuRC with 20 nM N-terminal domain containing TOG1-4 domains (bottom-right). While the N-terminus is not sufficient for MT nucleation, C-terminal domain of XMAP215, which binds γ-TuRC directly, also does not stimulate MT nucleation from γ-TuRC. (E) MT nucleation was measured, and number of MTs nucleated with wild-type XMAP215 reactions at 150 s was set to 1 to account for variable γ-TuRC concentration across purifications. Individual dataset with ±wt XMAP215, TOG5-CT or TOG1-4 are reported with solid, dashed or dotted curves. The number of times the experiment in (D–E) was repeated independent γ-TuRC preparations is as follows: buffer (3), wild-type XMAP215 (3), TOG1-4 (2), TOG5-CT (2). All data were pooled and reported in (E). Shaded regions represent 95% confidence interval in the number of nucleated MTs assuming a Poisson distribution as described in Materials and methods. Scale bars, 10 μm. See also Figure 7 and Videos 7, 8.
Figure 7—figure supplement 2

MCAK and Stathmin inhibit γ-TuRC-mediated nucleation.
(A) γ-TuRC molecules were attached to coverslips and either 10.5 μM tubulin alone (left panels), 10 μM tubulin + 10 nM MCAK (top-right) or 10 μM tubulin + 5 μM Stathmin (bottom-right) was added to the reaction. Both MCAK and Stathmin were observed to decrease the number of MTs nucleated. For MCAK, the experiment and control were repeated three times with independent γ-TuRC preparations. For Stathmin, the experiment and control were repeated identically two times with independent γ-TuRC preparations and an additional, supporting experiment was performed at a slightly different concentration (7 μM tubulin ± 2 μM Stathmin). See also Figure 7 and Video 9.
Author response image 1
Author response image 2

Author response image 3
Videos
Video 1
Microtubule nucleation from γ-TuRC complexes.
γ-TuRC was attached to functionalized coverslips and MT nucleation was observed upon introducing fluorescent αβ-tubulin (gray). MTs nucleated from individual γ-TuRC molecules from zero length at 14 μM αβ-tubulin and the plus-end of nucleated MTs polymerized, but not its minus-end. Elapsed time is shown in seconds, where time-point zero represents the start of reaction. Scale bar, 10 μm.
Video 2
Microtubule nucleation from fluorescent, single γ-TuRC molecules.
Dual Alexa-568 and biotin-labeled γ-TuRC (green) was attached to functionalized coverslips and MT nucleation was observed upon introducing fluorescent αβ-tubulin (red). MTs nucleated from single γ-TuRC molecules at 10.5 μM αβ-tubulin. Elapsed time is shown in seconds, where time-point zero represents the start of reaction. Scale bar, 10 μm.
Video 3
γ-TuRC molecules nucleate microtubules efficiently.
Constant density of γ-TuRC was attached while concentration of fluorescent αβ-tubulin was titrated (3.5–21 μM) and MT nucleation was observed. γ-TuRC molecules nucleated MTs starting from 7 μM tubulin and MT nucleation increased non-linearly with increasing tubulin concentration. Elapsed time is shown in seconds, where time-point zero represents the start of reaction. Scale bar, 10 μm.
Video 4
Spontaneous microtubule nucleation occurs at high tubulin concentration.
Concentration of fluorescent αβ-tubulin was titrated (7–21 μM) and spontaneous MT nucleation was assayed. MTs nucleated spontaneously starting from high concentration of 14 μM tubulin and MT nucleation increased non-linearly with tubulin concentration. Both plus- and minus-ends of the assembled MTs polymerize. Elapsed time is shown in seconds, where time-point zero represents the start of reaction. Scale bar, 10 μm.
Video 5
Microtubule assembly from blunt plus-ends resembles polymerization.
MTs with blunt ends (seeds, cyan) were generated and attached to functionalized coverslips. Varying concentration of fluorescent αβ-tubulin was added (1.4–8.7 μM, pseudo-colored as magenta) and MT assembly from seeds was assayed. MTs assembled at concentration above 1.4 μM tubulin, which is the minimum concentration needed for polymerization of MT plus-ends (C*). Elapsed time is shown in seconds, where time-point zero represents the start of reaction. Scale bar, 10 μm.
Video 6
γ-TuNA motif from CDK5RAP2, NME7 and TPX2 do not significantly increase γ-TuRC-mediated microtubule nucleation.
Top panels: γ-TuRC was immobilized on coverslips with control buffer (left) or with 6 μM γ-TuNA motif from CDK5RAP2 (right) and MT nucleation was observed upon introducing fluorescent 10.5 μM αβ-tubulin (gray) without or with 3 μM γ-TuNA, respectively. Middle panels: γ-TuRC was immobilized on coverslips with control buffer (left) or with 6 μM NME7 (right) and MT nucleation was observed upon introducing fluorescent 10.5 μM αβ-tubulin (gray) without or with 1 μM NME7, respectively. Bottom panels: γ-TuRC was immobilized on coverslips and MT nucleation was observed upon introducing fluorescent 10.5 μM αβ-tubulin (pseudo-colored as red) without or with 10 nM GFP-TPX2 (right, labeled as green). TPX2 bound along the nucleated MTs but did not significantly increase the MT nucleation activity of γ-TuRC molecules. Elapsed time is shown in seconds, where time-point zero represents the start of reaction. Scale bar, 10 μm.
Video 7
XMAP215 increases microtubule nucleation activity of γ-TuRC.
γ-TuRC was immobilized on coverslips and MT nucleation was assayed with low concentration of fluorescent αβ-tubulin (3.5 μM and 7 μM) without (top panels) or with 20 nM XMAP215-GFP (bottom panels). XMAP215 induces MT nucleation from γ-TuRC. Elapsed time is shown in seconds, where time-point zero represents the start of reaction. Scale bar, 10 μm.
Video 8
Synergistic microtubule nucleation by γ-TuRC and XMAP215.
Triple-color fluorescence microscopy was performed to observe the molecular sequence of events during MT nucleation from γ-TuRC and XMAP215. γ-TuRC (blue) and XMAP215 (red) formed a complex before MT nucleation occurred (pseudo-colored as green). For 50% of these events, XMAP215 remains on the nucleated minus-end. Elapsed time is shown in seconds, where time-point zero represents the start of reaction. Scale bar, 10 μm.
Video 9
MCAK and Stathmin inhibit γ-TuRC-mediated microtubule nucleation.
Top panels: γ-TuRC was immobilized on coverslips and MT nucleation was observed upon introducing fluorescent 10.5 μM αβ-tubulin without (left) or with 10 nM MCAK (right). Bottom panels: γ-TuRC was immobilized on coverslips and MT nucleation was observed upon introducing fluorescent 10.5 μM αβ-tubulin without (left) or with 5 μM Stathmin (right). Elapsed time is shown in seconds, where time-point zero represents the start of reaction. Scale bar, 10 μm.
Additional files
-
Source code 1
MATLAB code for simulations of γ-TuRC-mediated microtubule nucleation.
- https://cdn.elifesciences.org/articles/54253/elife-54253-code1-v3.zip
-
Transparent reporting form
- https://cdn.elifesciences.org/articles/54253/elife-54253-transrepform-v3.pdf
Download links
A two-part list of links to download the article, or parts of the article, in various formats.
Downloads (link to download the article as PDF)
Open citations (links to open the citations from this article in various online reference manager services)
Cite this article (links to download the citations from this article in formats compatible with various reference manager tools)
The transition state and regulation of γ-TuRC-mediated microtubule nucleation revealed by single molecule microscopy
eLife 9:e54253.
https://doi.org/10.7554/eLife.54253


