Progenitors oppositely polarize WNT activators and inhibitors to orchestrate tissue development
- Robin Chemers Neustein Laboratory of Mammalian Cell Biology and Development, Howard Hughes Medical Institute, The Rockefeller University, United States
- The Francis Crick Institute, Midland Road, United Kingdom
Figures
Figure 1 with 5 supplements
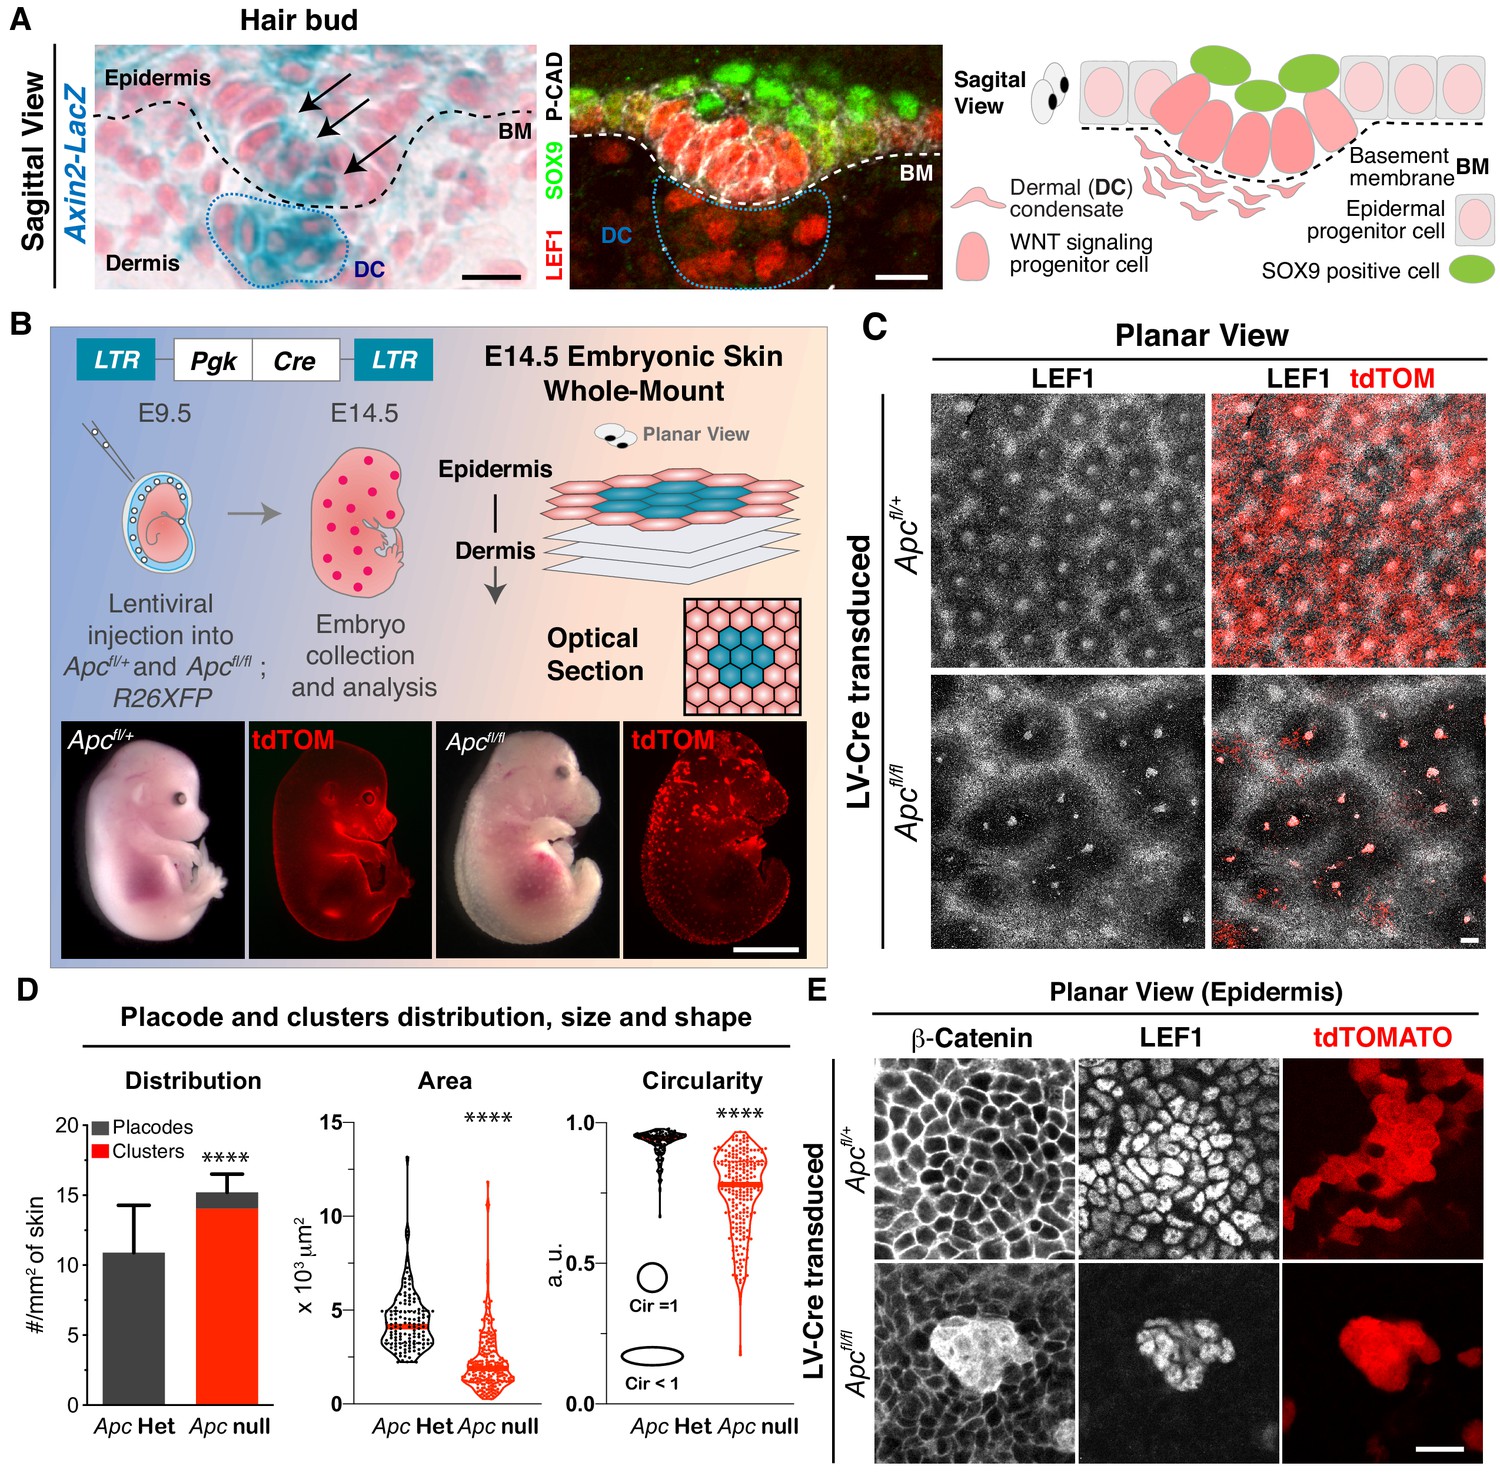
Two-dimensional patterning of hair placodes is severely affected upon sustained autonomous WNT activation.
(A) Sagittal views and schematic of skin section depicting a basal hair bud progenitor and underlying dermal condensate (DC, encased by blue dotted lines). Labeling is for LacZ expression knocked into the Axin2 locus and nuclear LEF1, two faithful proxies of WNT signaling. Additionally, nuclear SOX9 marks the overlying WNTlo bud cells, and P-cadherin marks the basal epithelial progenitors. Dashed lines denote the basement membrane (BM) rich in extracellular matrix (ECM) and growth factors at the epidermal-dermal border. Scale bars, 10 μm. (B) (top left and bottom) In utero lentiviral delivery strategy to generate sparse epidermal patches lacking APC, and therefore super-activating WNT signaling. Visual and epifluorescence imaging of mosaically transduced (R26dtTomato+) E14.5 Apc heterozygous and null embryos. Scale bar, 2 mm. (top right) Schematic of whole mount imaging. (C) Planar views of the skin surface of E14.5 embryos. Scale bar, 100 μm. (D) Quantifications showing Apc null clusters of broader size and shape than Apc heterozygous (het) placodes, which were analogous to wild-type in this assay (Circularity = 1 perfect circle). (Placodes and clusters density plot n > 10 mm2 skin area; ****p<0.0001; Mann-Whitney test; Area and Circularity plots n = 130 placodes and 216 clusters; ****p<0.0001; Mann-Whitney test; All n ≥ 3 embryos.). (E). Whole mount (planar) images showing atypically strong nuclear β-Catenin and LEF1 in Apc-null cell clusters. Scale bar, 20 μm.
-
Figure 1—source data 1
Measurements of placodes and clusters distribution, size and shape, shown in Figure 1D.
- https://cdn.elifesciences.org/articles/54304/elife-54304-fig1-data1-v2.xlsx
Figure 1—figure supplement 1
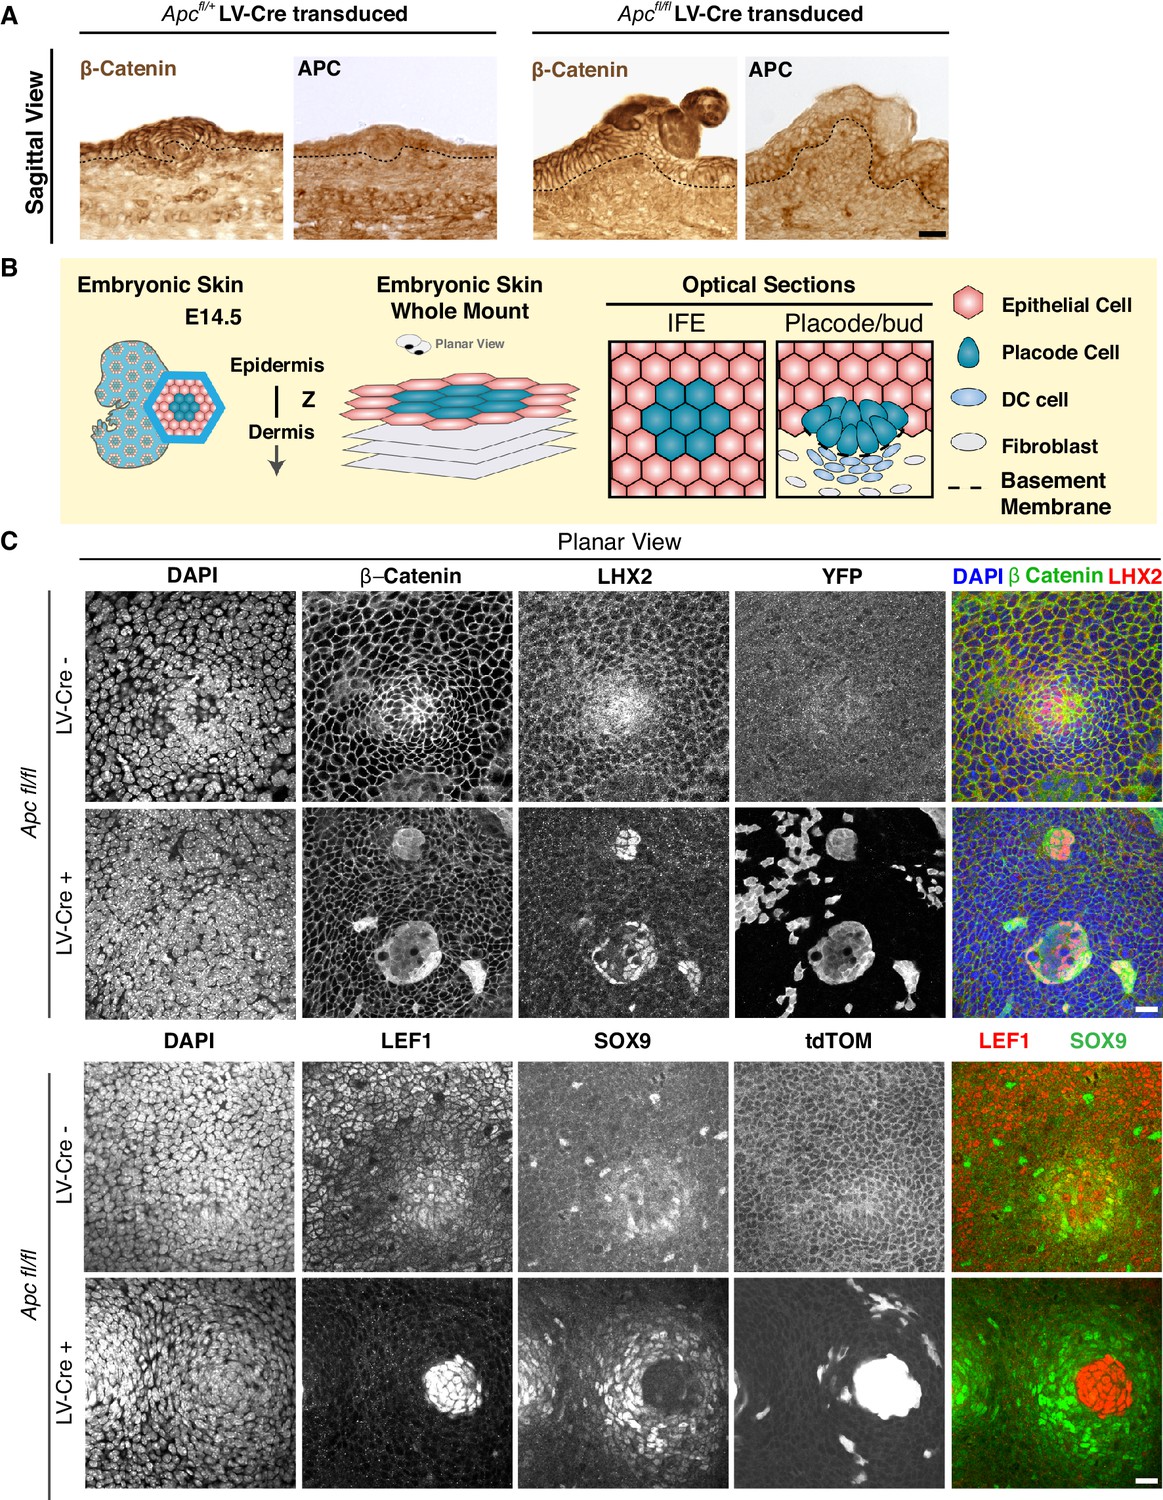
Apc-null clusters show properties of hair follicles arrested at the placode stage.
(A) Sagittal sections of embryonic skin subjected to immunohistochemistry with antibodies against β-Catenin and APC. Note that reduced APC immunostaining coincides with broadened elevated β-Catenin, reflective of enhanced WNT signaling throughout the cluster. (B) Schematic of whole-mount analysis from embryonic skin with two examples of sampling of optical sections. (C) Apcfl/fl and Apcfl/+; Rosa26-lox-stop-lox-YFP or tdTomato embryos were transduced with LV-Cre and subjected to whole-mount immunofluorescence microscopy. Note that when cells form a distinct cluster, they strongly immunolabel for nuclear β-catenin and LEF1, as well as WNThi progenitor marker LHX2, features of hair placodes, but they are negative for WNTlo hair bud marker SOX9. The absence of WNTloSOX9+ cells within the cluster indicates its failure to progress to the hair follicles bud stage. By contrast, the wild-type cells surrounding these clusters were SOX9+, reflective of the impact of WNThiLHX2+ surrounding the clusters. This is most likely due to the high level of WNT-inhibitors expressed by neighboring Apc-null cells as shown in Figure 2. Scale bar, 20 μm for all frames.
Figure 1—figure supplement 2
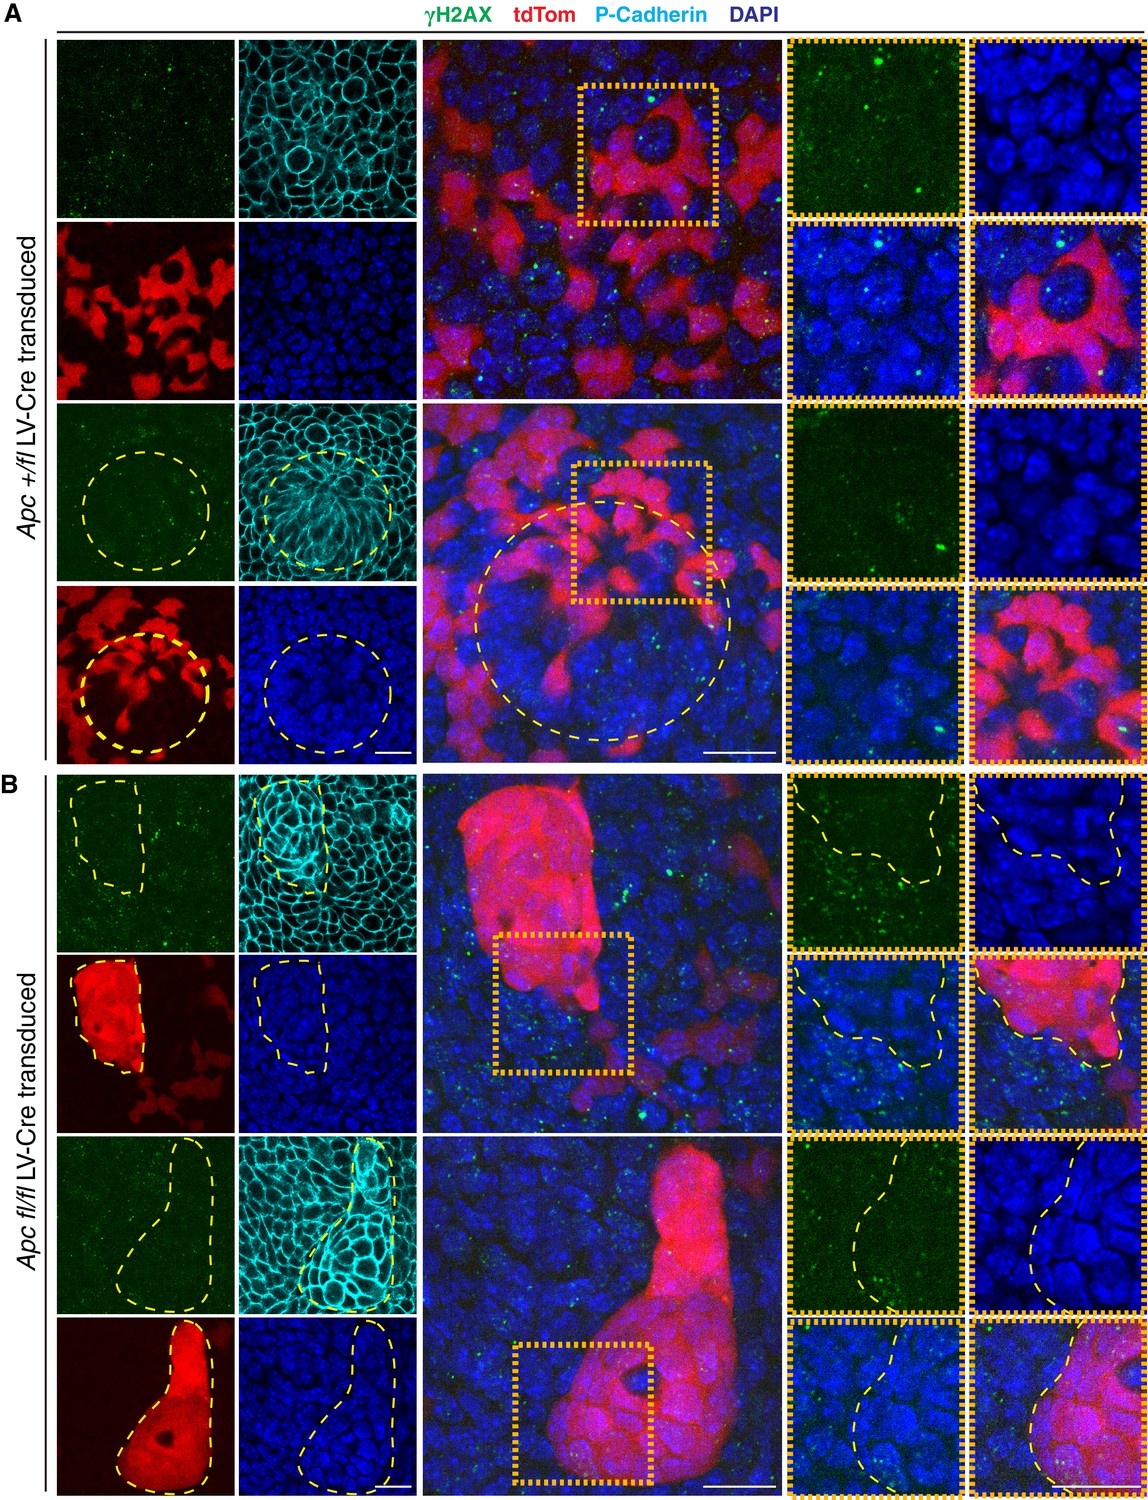
Apc-null clusters do not present signs of DNA double strand breaks.
(A–B) Immunofluorescence detection of γH2AX in developing epidermis of (A) Apc fl/+ and (B) Apc fl/fl Rosa26-lox-stop-lox-tdTOM embryos were transduced at E9.5 with lentivirus harboring a Cre recombinase (Pgk-Cre-mRFP) and analyzed at E14.5. Circular yellow dashed line outlines a placode. Orange insets highlight transduced (tdTOM+) versus non-transduced epithelia. Yellow dashed lines contour Apc-null clusters. Scale bar, 20 μm for all frames.
Figure 1—figure supplement 3
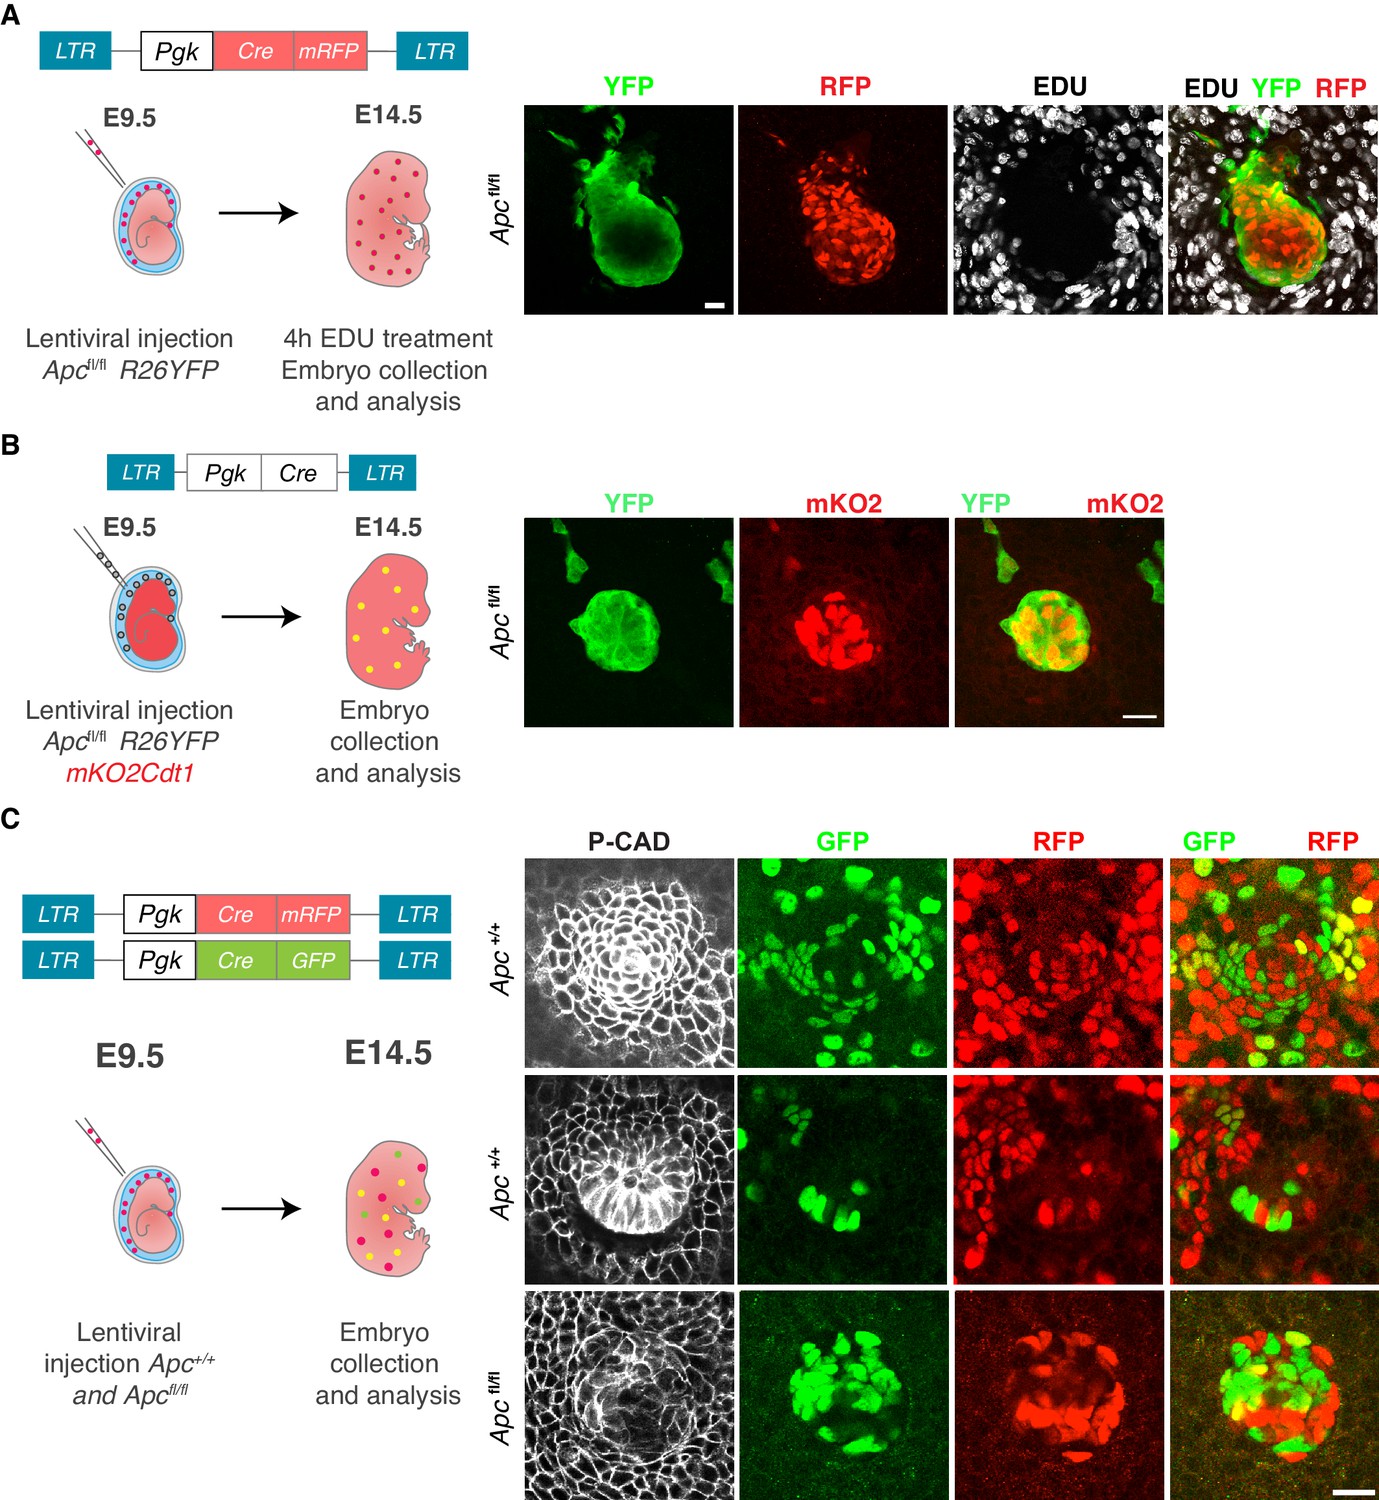
Apc-null cells aggregate into clusters and are non-proliferative.
(A) Experimental design and proliferation analysis. Apcfl/fl; Rosa26-lox-stop-lox-YFP embryos were transduced at E9.5 with LVs harboring a Cre recombinase (Pgk-Cre-mRFP) and analyzed at E14.5. At 4 hr prior to analysis, a pulse of 5-Ethynyl-2'-deoxyuridine (EdU) was administered. Note the absence of EDU-positive cells within the clusters. Scale bar, 10 μm. (B) Apcfl/fl YFPfl/fl mKO2Cdt1 embryos were transduced with Pgk-Cre as shown in the schematic. Representative image of an Apc-null cluster is shown at right. Note that YFP+ cells are simultaneously positive for the G0/G1 sensor mKO2Cdt1, in agreement with the non-proliferative status of these clusters. Scale bar, 20 μm. (C) E9.5 Apcfl/fl embryos were transduced with LVs harboring different fluorescing Cre recombinases and analyzed 5d later. Note that like placodes, clusters are multiclonal, reflected by the presence of both RFP and GFP tagged cells. Scale bars, 20 μm.
Figure 1—figure supplement 4

Apc-null cell clusters lose adherens junction transmembrane protein E-Cadherin.
Representative E14.5 whole-mount immunofluorescence images and respective orthogonal views from (A) Apc-het and (B) Apc-null transduced tdTomato+ embryonic skins showing endogenous E-Cadherin and P-Cadherin immunofluorescence. Note loss of E-Cadherin in Apc-null clusters when compared to the surrounding wild-type skin. Circular yellow dashed line outlines a heterozygous placode while remain dashed lines contour Apc-null cell clusters. White dotted lines demarcate epithelial-mesenchymal boundaries. The XY axis is planar to the epidermis; the XZ axis shows sagittal views perpendicular to the skin surface. Scale bars, 20 μm.
Figure 1—figure supplement 5
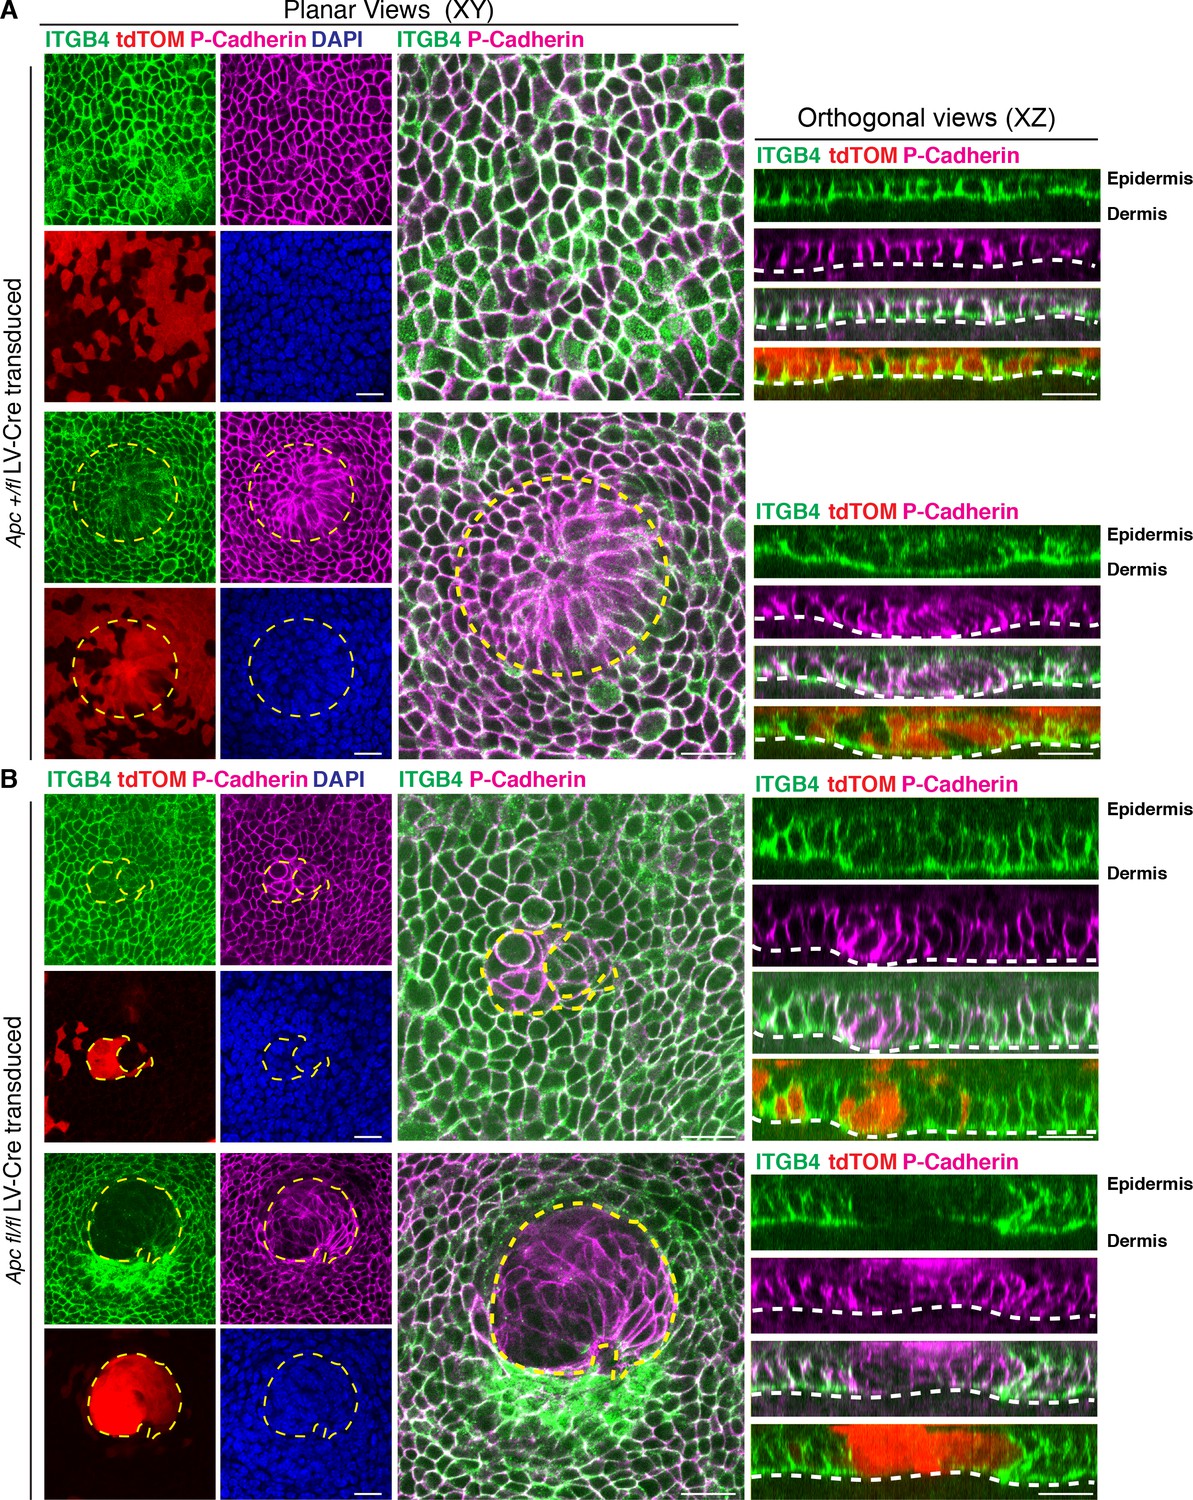
Apc-null cell clusters lose the hemidesmossome integrin beta4 (ITGB4).
Representative E14.5 whole-mount immunofluorescence images and respective orthogonal views from (A) Apc-het and (B) Apc-null transduced tdTomato+ embryonic skins showing endogenous ITGB4 and P-Cadherin staining. Note the loss of ITGB4 in Apc-null clusters when compared to the surrounding wild-type skin. Circular yellow dashed line outlines a heterozygous placode while remain dashed lines contour Apc-null cell clusters. White dashed lines demarcate epithelial-mesenchymal boundaries. The XY axis is planar to the epidermis; the XZ axis shows sagittal views perpendicular to the skin surface. Scale bars, 20 μm.
Figure 2 with 2 supplements

Teasing out a WNT-sensitive molecular signature based upon transcriptome profiling of skin progenitors possessing different WNT signaling levels.
(A) LV construct, epifluorescence imaging and FACS strategy for isolating WNT signaling (GFP+) and WNTlo skin progenitors from LV-transduced E14.5 Apc fl/+ and Apcfl/fl; R26fl-stop-fl-tdTOM embryos. (B) Gene set enrichment analysis (GSEA) of gene sets showing marked differential expression in WNT signaling progenitors from Apc-null vs Apc-het embryos. False discovery rate (FDR) q-values of enrichment are shown for each gene set. (C) Waterfall plot depicting genes markedly influenced (Log2 Fold Change ≥ 1.5, p<0.05) by APC status (color-coding according to B). (D) Volcano plot showing differentially regulated transcripts and WNT-reporter status.
-
Figure 2—source data 1
Source data for the graphs shown in Figure 2D.
- https://cdn.elifesciences.org/articles/54304/elife-54304-fig2-data1-v2.xlsx
Figure 2—figure supplement 1
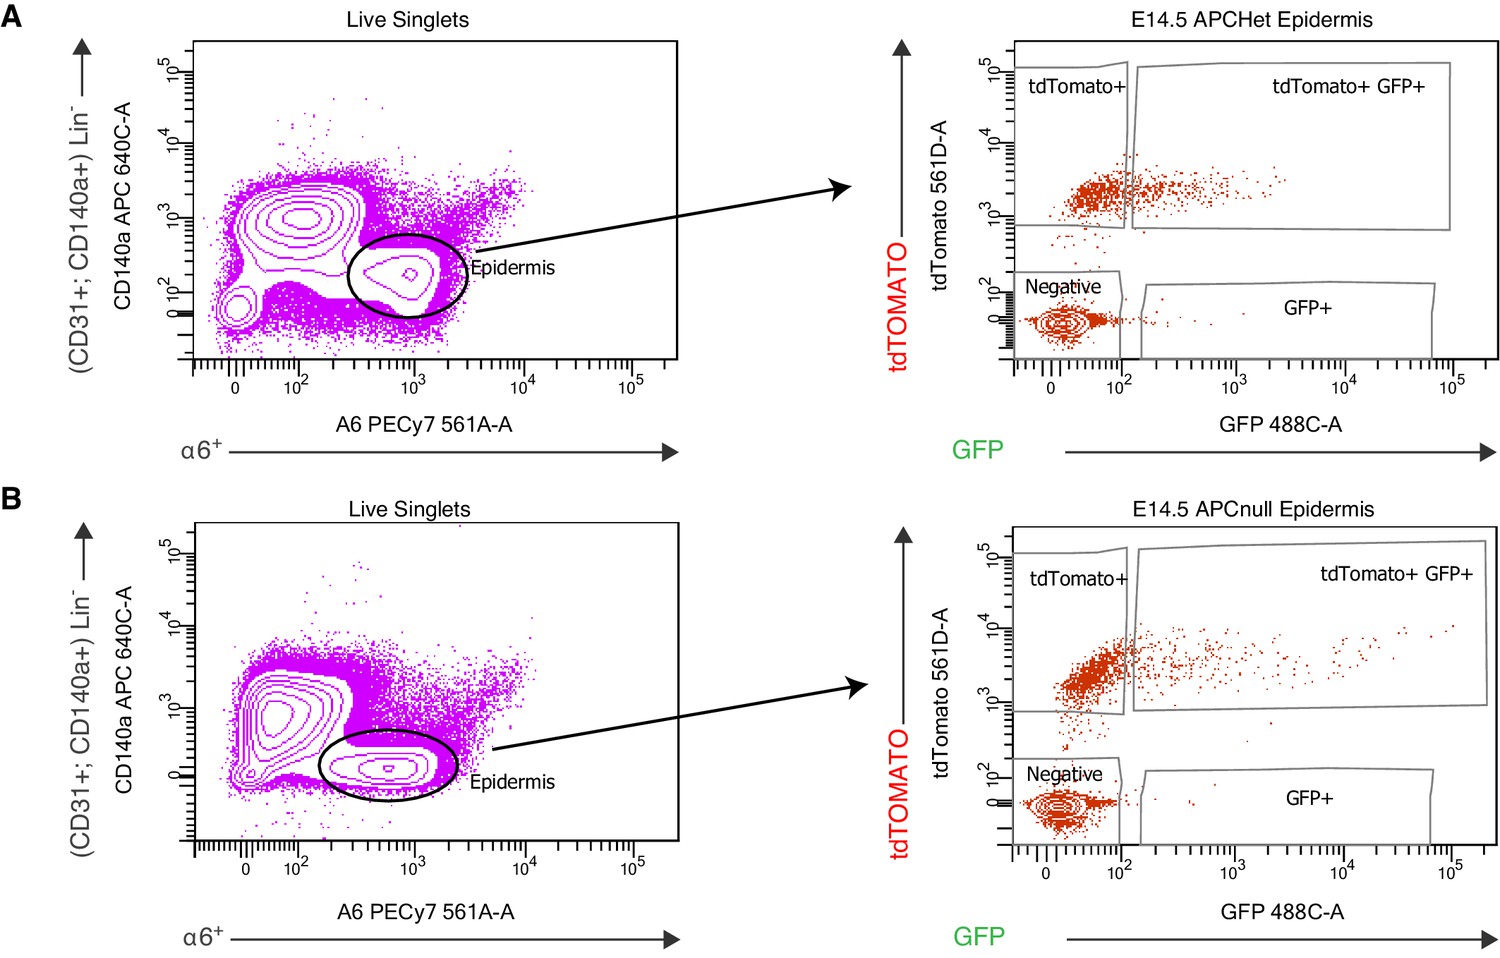
FACS purification strategy to isolate WNThi skin progenitors from Apc embryonic skin.
(A–B) FACS purification of WNThi cells from Apcfl/+; Rosa26-lox-stop-lox-dtTomato embryos (A) and from Apcfl/fl Rosa26-lox-stop-lox-dtTomato embryos (B). Both types of embryos were transduced at E9.5 with an LV harboring a WNT GFP reporter and Pgk-Cre and then harvested at E14.5. WNT-reporterhi (a6+ tdTomato+ GFP+) and WNT-reporterlo (a6+tdTomato+) progenitors were purified, while suprabasal (a6neg tdTomato+ GFPneg) epidermal cells and non-epidermal cells (Lin-: CD131+ and CD140a+) were eliminated.
Figure 2—figure supplement 2
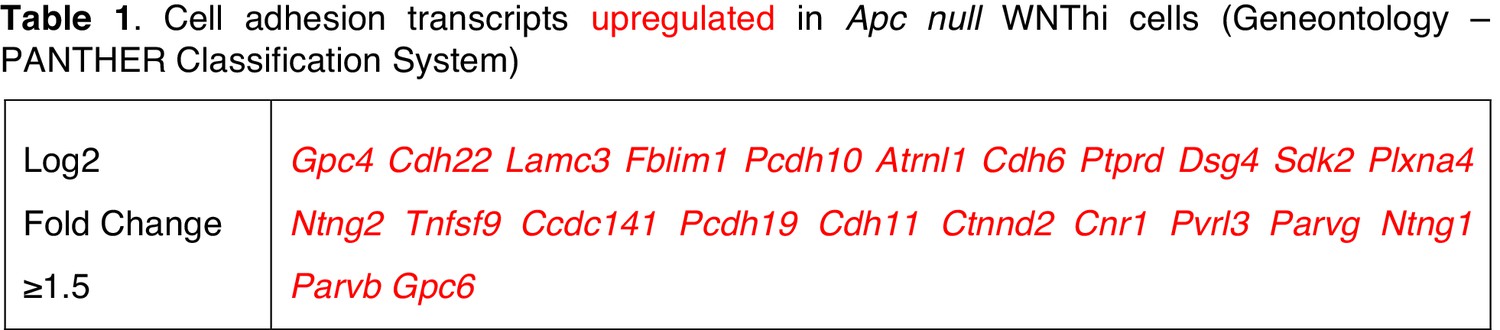
Cell adhesion transcripts upregulated in Apc null WNThi cells (Geneontology – PANTHER Classification System).
-
Figure 2—figure supplement 2—source data 1
Cell adhesion transcripts upregulated in Apc null WNThi cells (Geneontology – PANTHER Classification System).
- https://cdn.elifesciences.org/articles/54304/elife-54304-fig2-figsupp2-data1-v2.docx
Figure 3 with 4 supplements
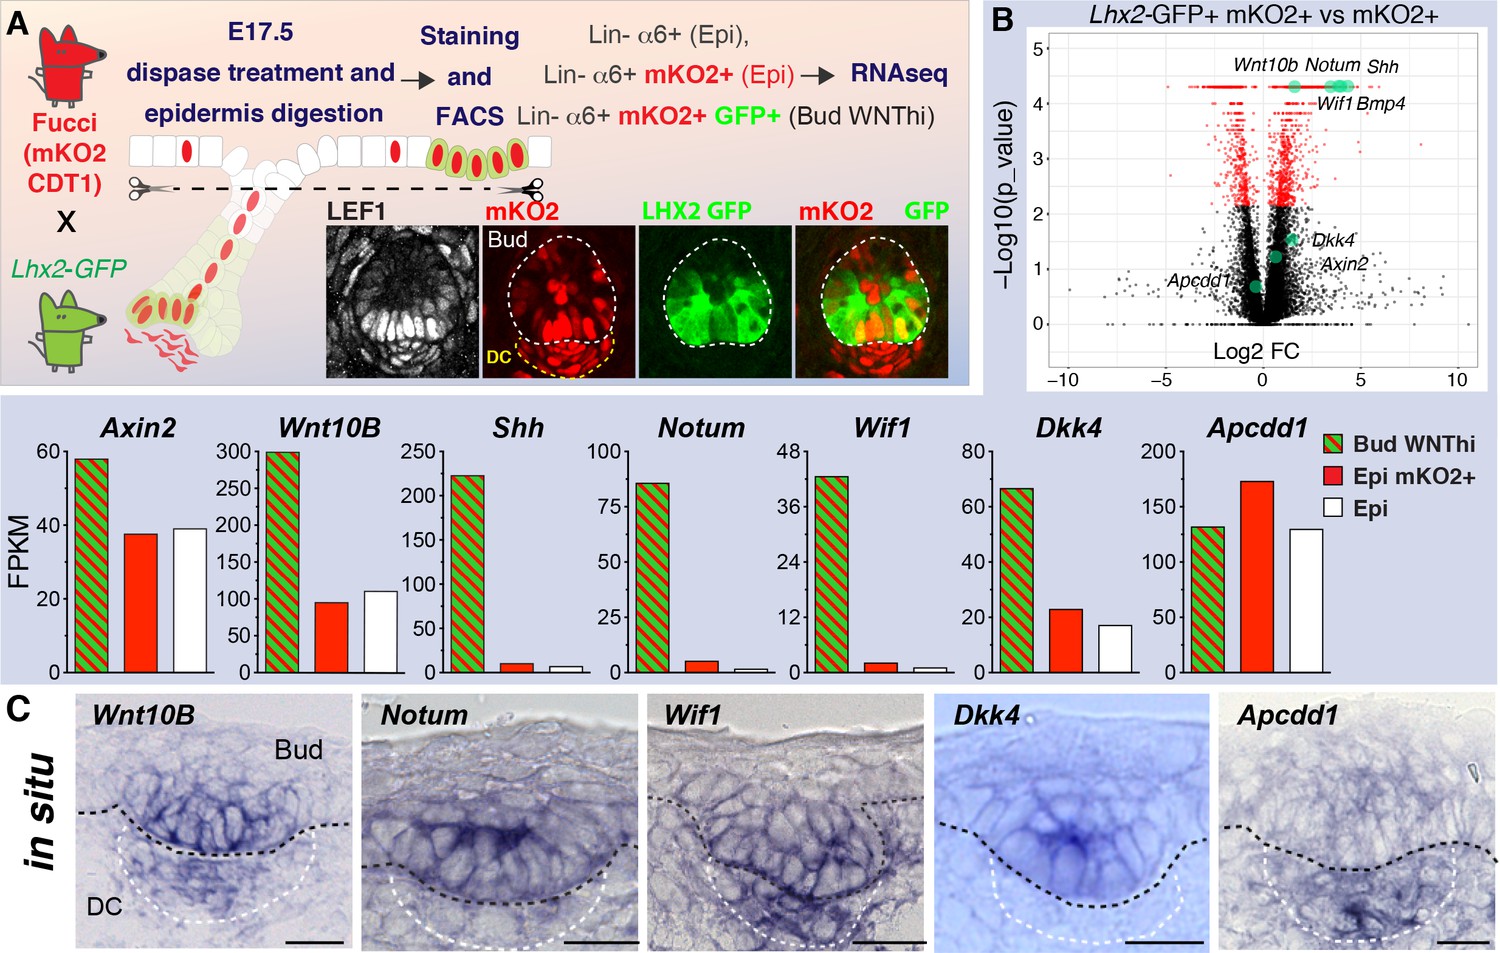
Wild-type WNT signaling progenitor cells express high levels of WNT inhibitors.
(A) Strategy used to isolate and profile slow-cycling basal progenitors from the epidermal fraction of dispase-treated, wild-type E17.5 skin, which contains epidermis and early hair placodes/buds. Note: LEF+ progenitors are simultaneously LHX2GFP+ and mKO2+. (B) Volcano plot and comparative expression profiling reveals that relative to their epidermal counterparts, wild-type basal placode/bud progenitors share strong signature similarities with Apc-null progenitors. Green dots denote previously reported WNT target genes. (C) In situ hybridizations showing that WNT signaling progenitor cells simultaneously express mRNAs for WNT activators and WNT inhibitors. Black dashed lines, epidermal-dermal boundary; white dashed lines demarcate the dermal condensate (DC). Scale bars, 10 μm.
-
Figure 3—source data 1
Source data for the graphs shown in Figure 3B.
- https://cdn.elifesciences.org/articles/54304/elife-54304-fig3-data1-v2.xlsx
Figure 3—figure supplement 1

FACS purification strategy to isolate WNThi placode and WNTlo epidermal progenitors from wild-type embryonic skin.
(A) FACS purification plots of single cell suspensions isolated from the dispase-selected epidermal/hair bud fraction of E17.5 skin. Pups were transgenic for Lhx2-GFP, active in basal hair bud progenitors, and for mKO2Cdt1, active in the slow-cycling basal skin progenitors of both hair buds and interfollicular epidermis. All basal progenitors are marked by α6 integrin. Non-epidermal cells (Lin-: CD131+ and CD140a+) were excluded by FACS. (B) mKO2Cdt1 embryos were exposed to lentivirus at E9.5 and analyzed at E15.5 as depicted in the schematic. The LV harbored a WNT-GFP reporter (12xTCF-TK-EGFP) and Pgk-Cre. Note that the progenitor cells from the developing hair follicle are concomitantly LEF1+, mKO2+ and WNT reporter positive. Scale bar, 20 μm. (C) Venn diagram depicts the overlap between Apc-null WNThi signature genes and wild-type (Lhx2GFP+ mKO2Cdt1+) WNThi signature genes. P values were calculated using the hyper geometric distribution formula via R. Note: While overlap was appreciable, WNThiApc-null transcripts were pure placode signature genes and in addition encoded cell cycle inhibitors, while wild-type WNThi cells included not only placode but also some bud mRNAs, and although slow-cycling, these cells were still proliferative.
Figure 3—figure supplement 2

WNThi signature genes in hair follicle development.
Shown is a list of transcripts that are shared between the Apc null WNThi signature and the wild-type WNThi signature.
-
Figure 3—figure supplement 2—source data 1
WNThi signature genes in hair follicle development.
Shown is a list of transcripts that are shared between the Apc null WNThi signature and the wild-type WNThi signature.
- https://cdn.elifesciences.org/articles/54304/elife-54304-fig3-figsupp2-data1-v2.docx
Figure 3—figure supplement 3
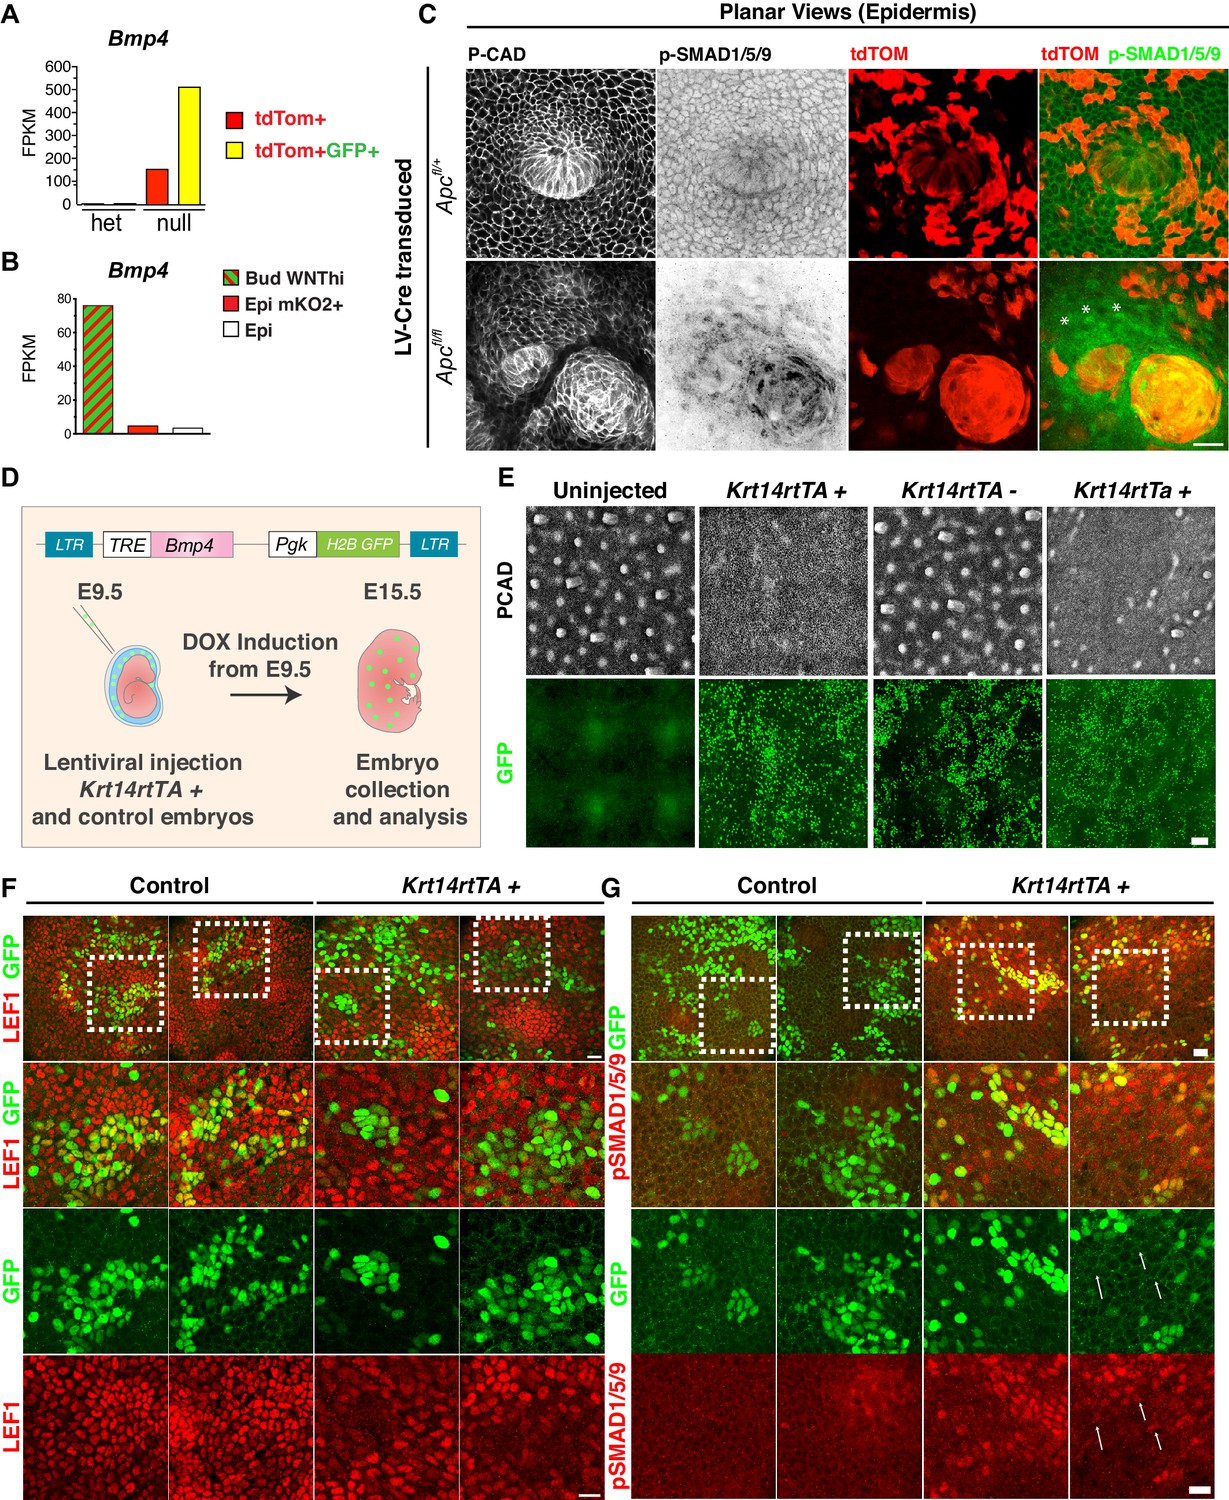
BMP4 acts long range to perturb hair follicle patterning.
(A–B) Strong correlation between WNT signaling and Bmp4 levels in both (A) Apc-null clusters and (B) wild-type hair buds. (C) Whole-mount immunofluorescence of E14.5 mosaic Apc-null and Apc-het embryos. Note a halo (asterisks) of nuclear pSMAD1/5/9+ cells extending well beyond the borders of Apc-null clusters, indicative of long-range BMP signaling. Scale bar, 20 μm. (D) Experimental setup to overexpress BMP4 in skin progenitors. BMP4 is under the regulation of a tetracycline regulatory enhancer (TRE) activated by doxy-induced rtTA transcription factor binding. The lentivirus was introduced at E9.5 into the amniotic cavity of Krt14rtTA+ and Krt14rtTAneg embryos, which were then analyzed at E15.5. (E) Whole-mount images of 1 mm2 E15.5 skins of Doxy-treated Krt14rtTA+ and control (Krt14rtTAneg) littermates. Note the perturbation in patterning of hair follicles (P-Cadherin+). Scale bar, 100 μm. (F–G) Representative regions of transduced and untransduced epidermis in Krt14rtTA negative and positive littermates, (F) Note the reduced LEF1 immunostaining in GFP+ BMPhi-signaling cells. (G) Note the presence of nuclear pSMAD1/5/9 positive cells distant from the BMPhi-signaling cells (white arrows), suggestive of long-range signaling. White boxes delineate the regions that are magnified in the three images beneath each low-magnification panel. Scale bar, 20 μm.
-
Figure 3—figure supplement 3—source data 1
Source data for the graphs shown in Figure 3—figure supplement 3A and B.
- https://cdn.elifesciences.org/articles/54304/elife-54304-fig3-figsupp3-data1-v2.xlsx
Figure 3—figure supplement 4
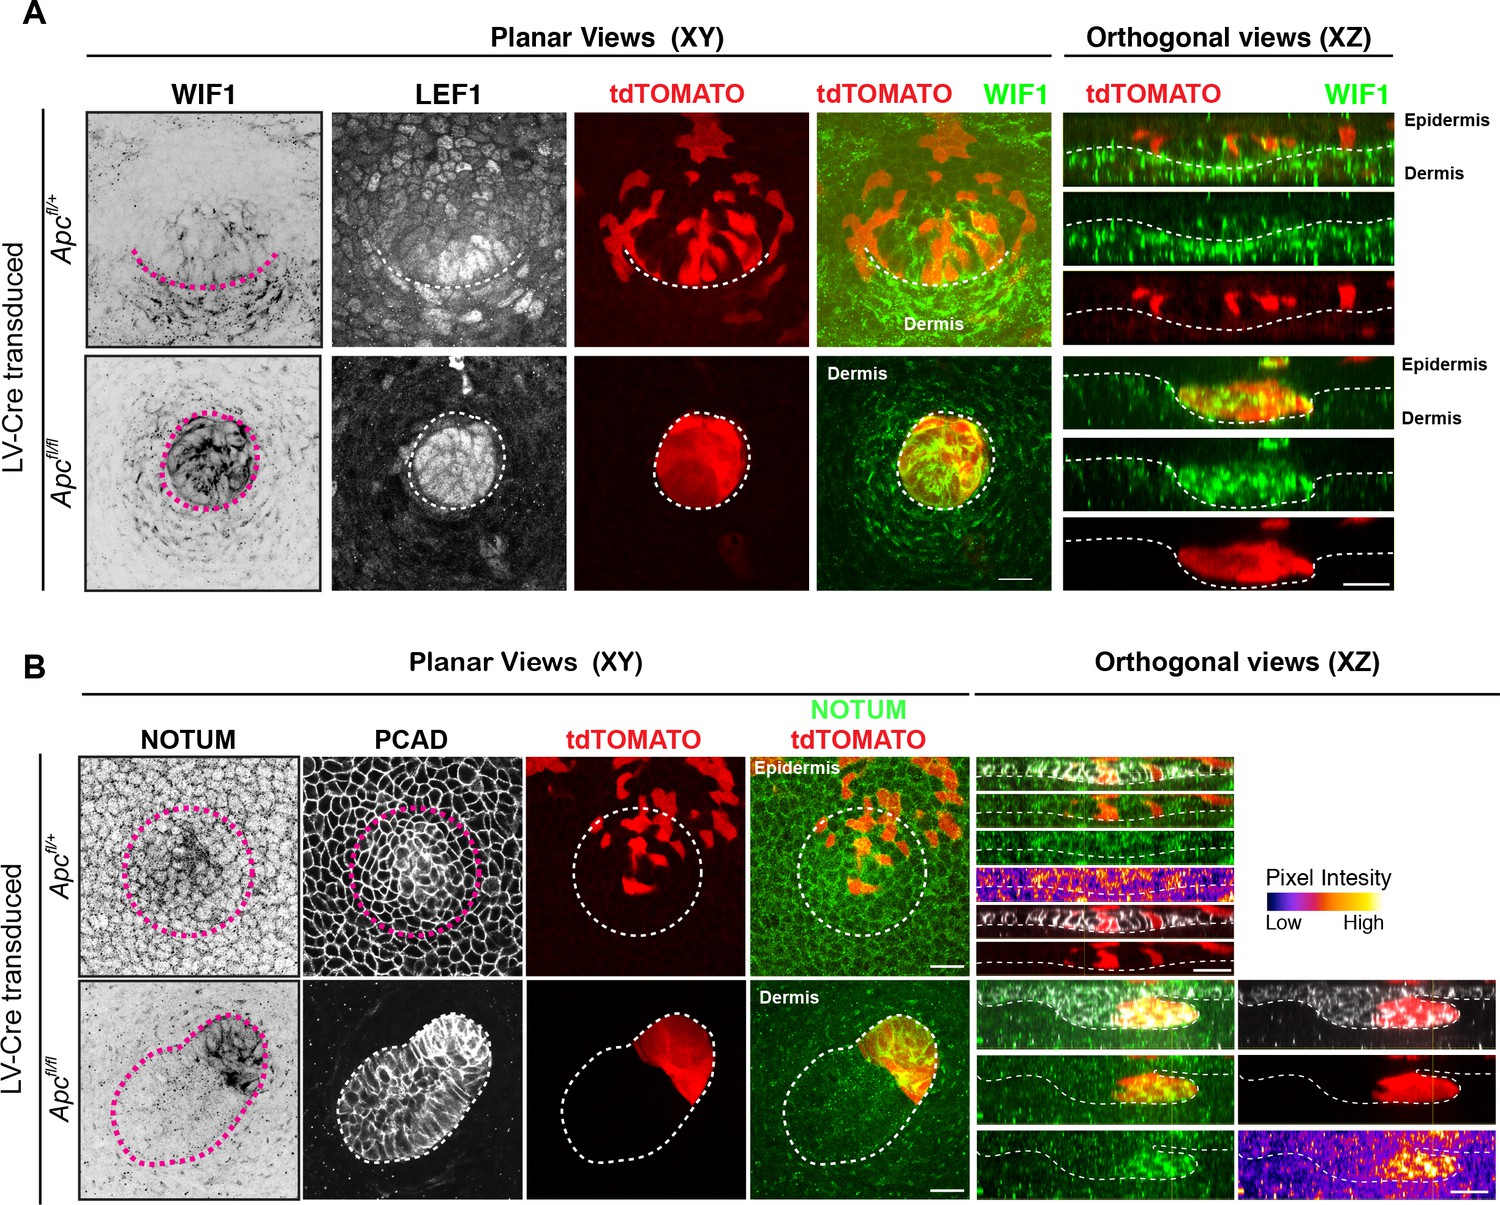
Apc-null cells express high levels of WNT inhibitors.
(A–B) Representative immunofluorescence images and respective orthogonal views from Apc-null and Apc-het transduced tdTomato+ embryonic skins showing endogenous (A) WIF1 and (B) NOTUM patterns. Note strong expression of WNT inhibitors NOTUM and WIF1 in Apc-null clusters, despite presence of nuclear LEF1 and robust WNT signaling. Circular dashed line in Apc-het outlines a placode. Dotted lines demarcate epithelial-mesenchymal boundaries. The XY axis is planar to the epidermis; the XZ axis shows sagittal views perpendicular to the skin surface. Scale bars, 20 μm.
Figure 4 with 1 supplement
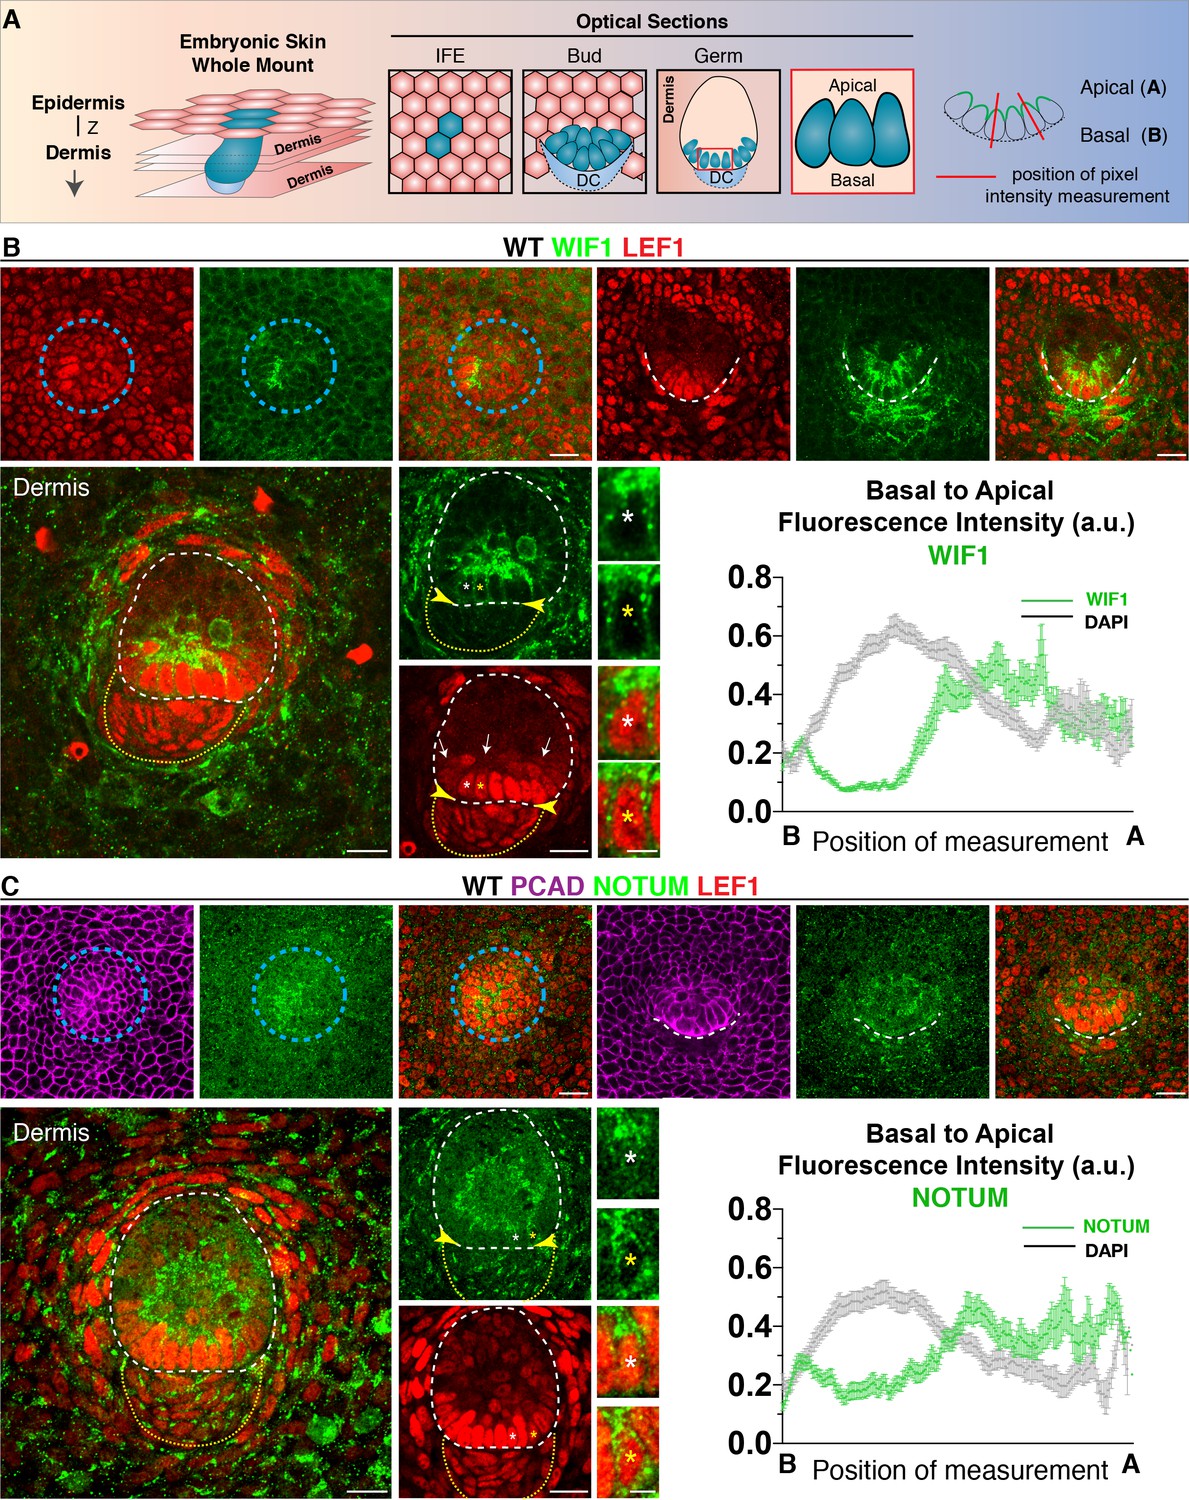
Progenitor cells apically polarize WNT inhibitors.
(A) Schematic of whole-mount analysis from embryonic skin with examples of optical sections showing interfollicular epidermis (IFE), bud and germ; position of pixel intensity measurement. Z, plane of imaging from the Z-stack. (B) Anti-WIF1 and (C) anti-NOTUM immunofluorescence in placode, bud and germs reveal an apical accumulation of WIF1 and NOTUM. Pixel intensity profiles of basal hair bud progenitors (n = ≥40 WNT signaling progenitors; mean ± SEM; a.u., arbitrary units). Note also absence of WNT inhibitors in upper region of the dermal condensate (encased by yellow dotted line) at this stage of morphogenesis, leaving a WNT inhibitor free zone (yellow arrowheads) for nuclear LEF1 and WNT signaling at the epidermal-dermal boundary (white dashed line) and a WNT inhibitor high zone in suprabasal hair bud cells (arrows). Blue circular dashed lines outline placodes. White dotted lines demarcate epithelial-mesenchymal boundaries. *Denotes magnified cells, shown at right of each frame. Scale bars: 5 μm magnified cells; all others, 20 μm.
-
Figure 4—source data 1
Source data for the graphs shown in Figure 4.
- https://cdn.elifesciences.org/articles/54304/elife-54304-fig4-data1-v2.xlsx
Figure 4—figure supplement 1
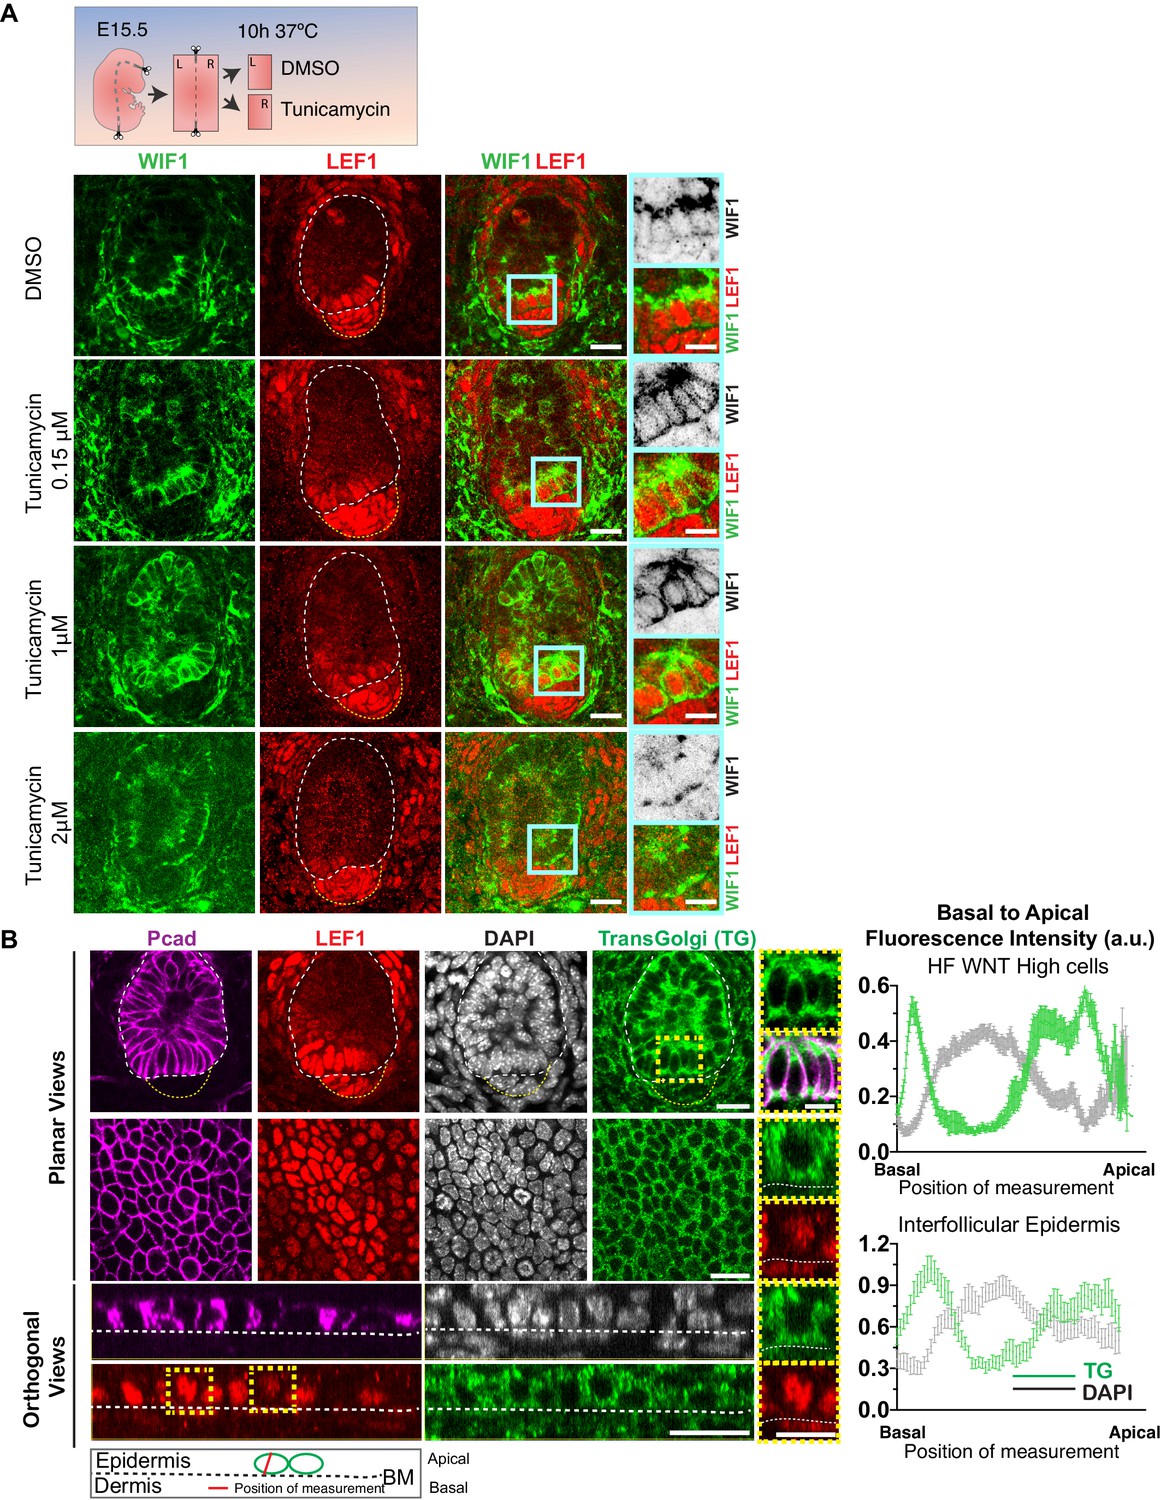
Apical WIF1 localization is dependent on N-Glycosylation.
(A) Strategy to test the importance of N-Glycosylation for WIF1 apical localization. E15.5 wild-type embryonic skin explants were treated with different Tunicamycin concentrations for 10 hr and fixed afterwards for whole-mount immunofluorescence analysis. Note increasingly mis-polarized endogenous WIF1, shifting from apical to basal, as the concentration of Tunicamycin is raised. Insets show higher magnifications of boxed regions. (B) Localization of the endogenous Trans-Golgi network in the developing hair follicles and interfollicular epidermis (IFE) and their respective basal-apical pixel intensity profile measured in 21 WNT-signaling progenitor cells and 31 IFE cells (mean ± SEM. a.u., arbitrary units). Insets show higher magnification of selected regions. Note that Golgi is present both basally and apically within the bud progenitors. Scale bars, 20 μm. Inset scale bars, 10 μm.
-
Figure 4—figure supplement 1—source data 1
Source data for the graphs shown in Figure 4—figure supplement 1B.
- https://cdn.elifesciences.org/articles/54304/elife-54304-fig4-figsupp1-data1-v2.xlsx
Figure 5 with 3 supplements
Evidence of oppositely polarized and short-range action of WNTs and WNT inhibitors in hair bud progenitors that are actively signaling through WNTs.
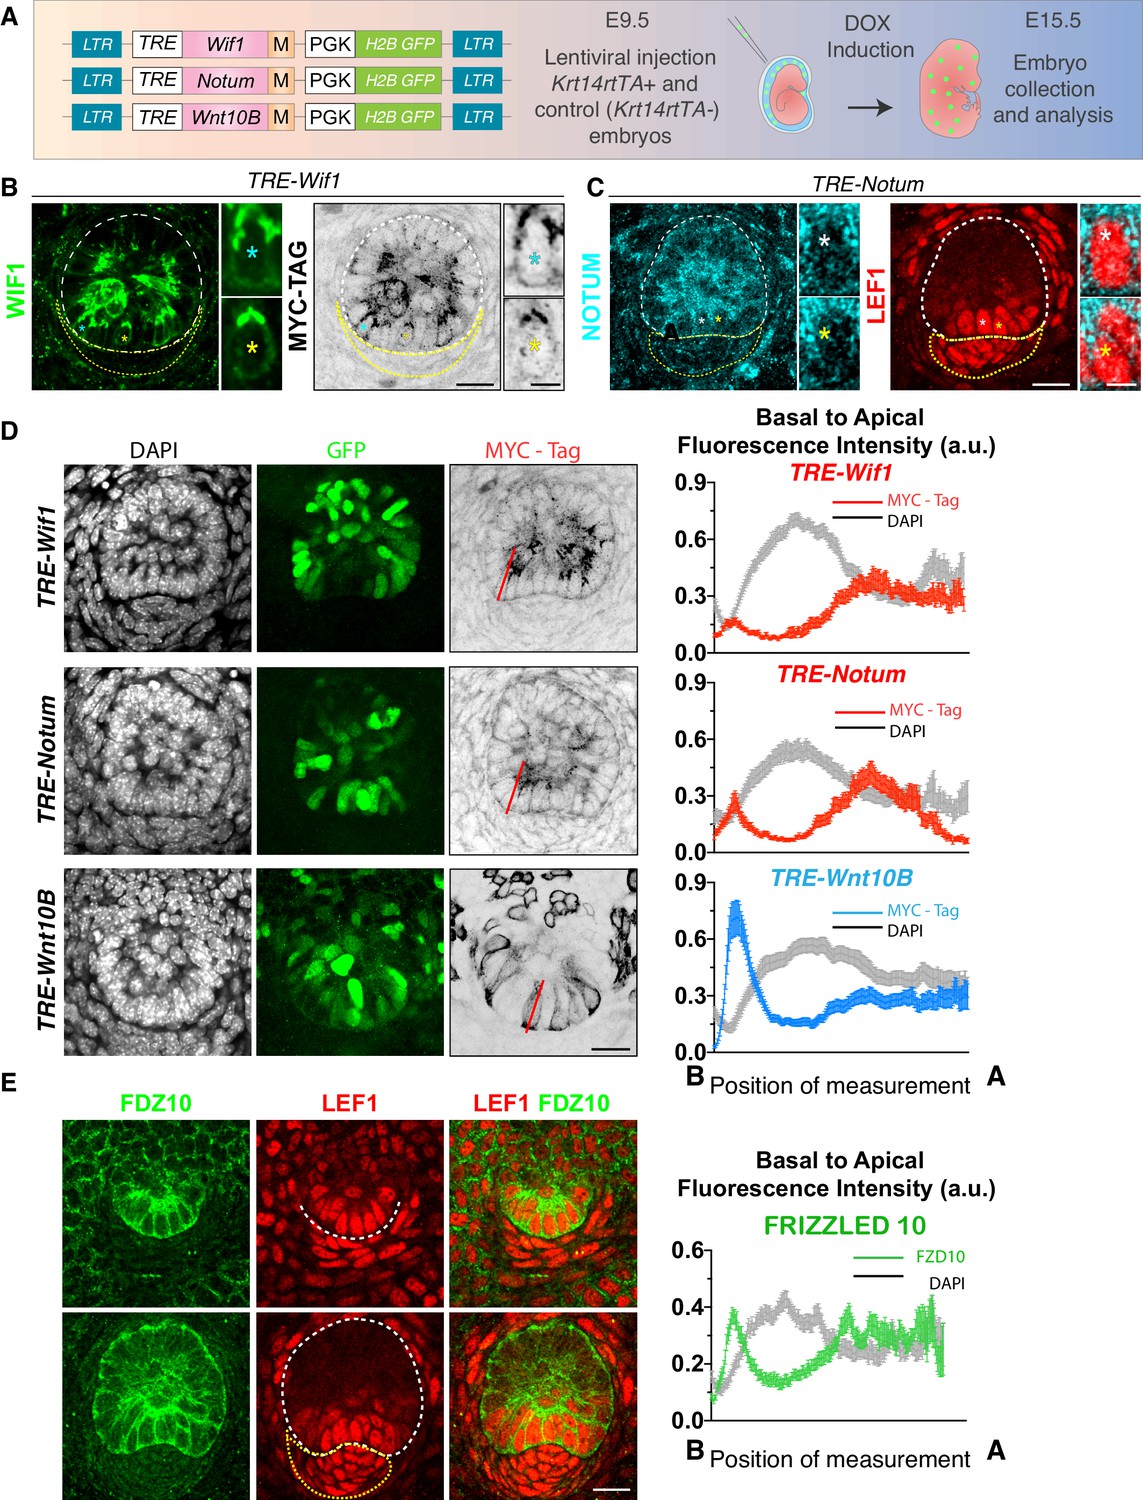
(A) LV-constructs and strategy to monitor WNT inhibitors and WNTs. M, myc-tag. TRE, tetracycline regulatory element. Krt14rtTA is a transgenic mouse line expressing a doxycycline (DOX)-inducible transcriptional activator for TRE. (B, C) Similar to endogenous expression, anti-WIF1 and anti-NOTUM immunofluorescence on MYC-tag transduced skin show apical localization in hair bud progenitors. (D) Anti-MYC-tag immunofluorescence of transduced skins revealing apical polarization of NOTUM and WIF1, but basal polarization of WNT10B. At right are basal-apical MYC-Tag/DAPI pixel intensity profiles of basal hair bud progenitors (n = ≥40 WNT signaling progenitors; mean ± SEM; a.u., arbitrary units). (E) Pixel intensity profile and immunolocalization of endogenous WNT-receptor FRIZZLED 10 shows uniform localization at borders of hair bud and germ WNT signaling cells (n = 37 cells; mean ± SEM; a.u., arbitrary units). *Denotes magnified cells, shown at right of each frame. Scale bars: 5 μm magnified cells; all the others, 20 μm.
-
Figure 5—source data 1
Source data for the graphs shown in Figure 5D and E.
- https://cdn.elifesciences.org/articles/54304/elife-54304-fig5-data1-v2.xlsx
Figure 5—figure supplement 1
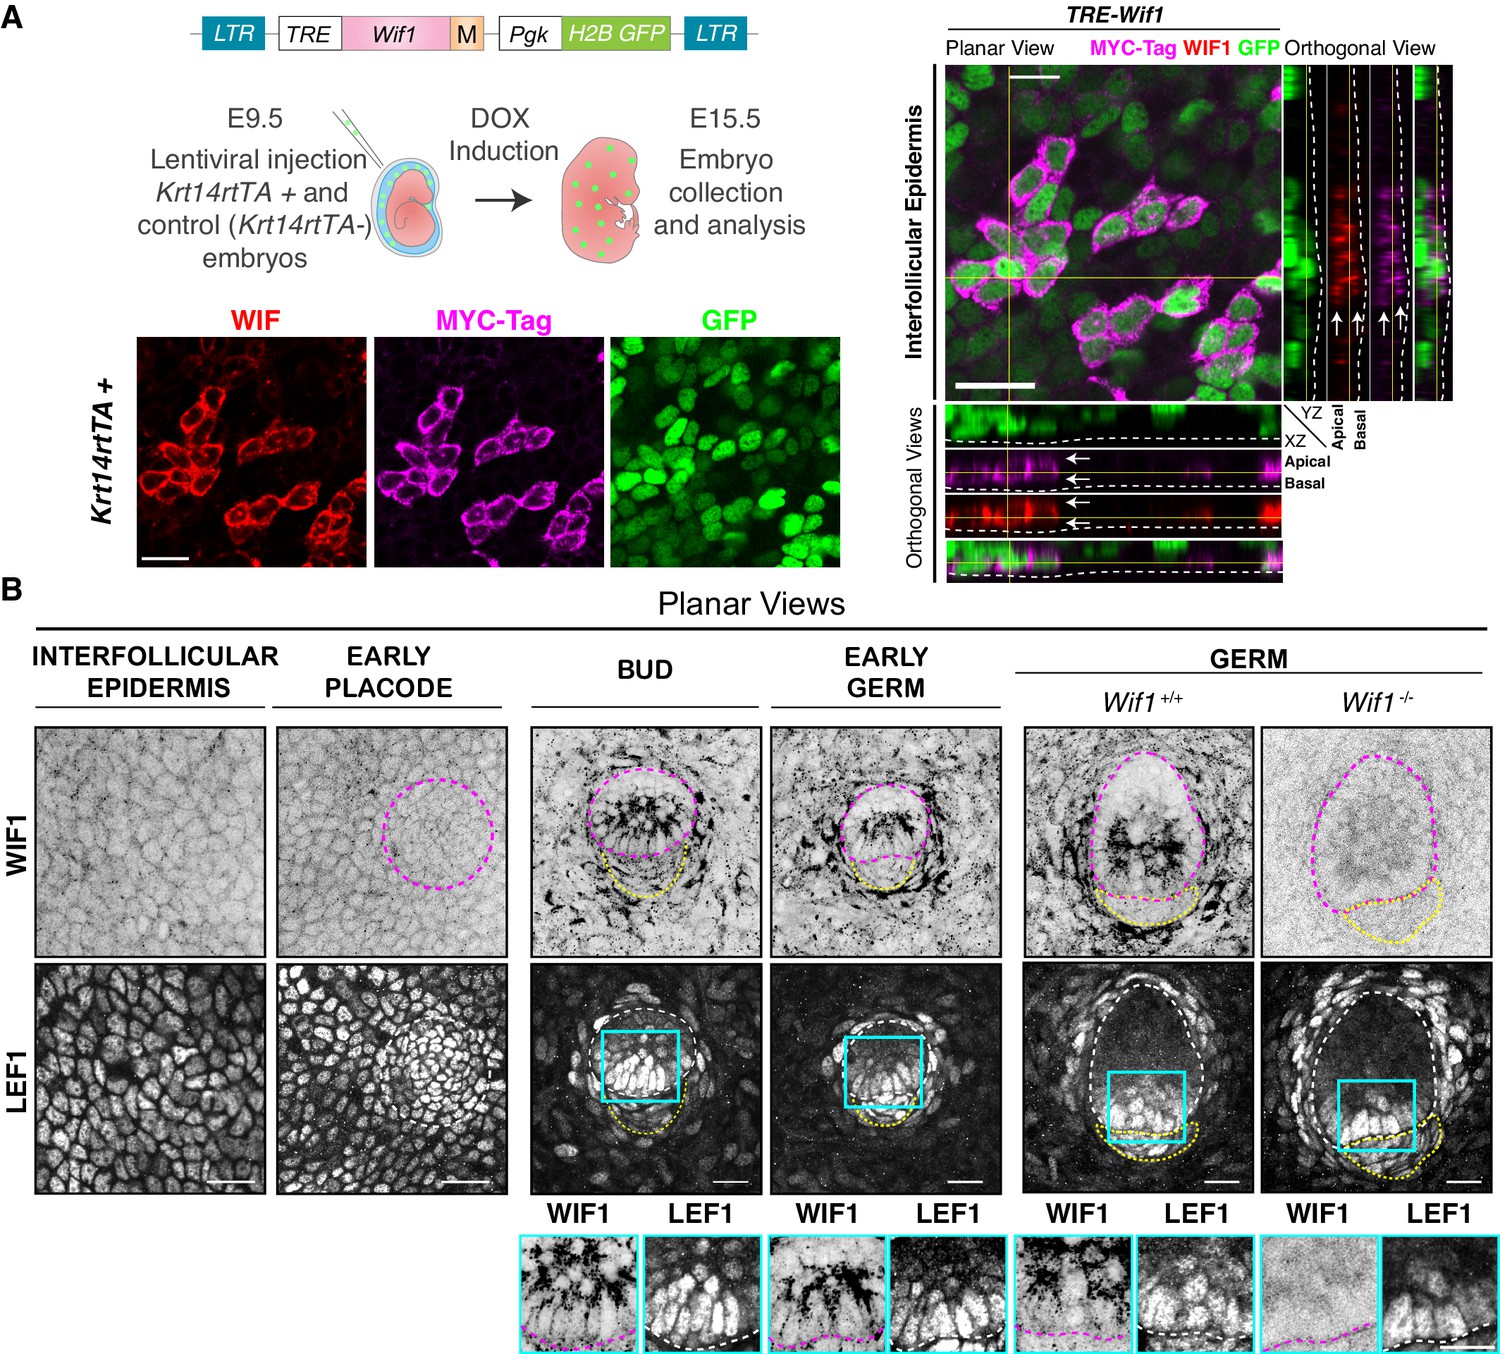
WIF1 expression during early hair follicle development.
(A) Strategy to monitor WIF1 expression by MYC-tagging (M). Depicted LV was introduced into the amniotic cavities of E9.5 Krt14rtTA embryos, and transduced genes were activated by doxycycline (DOX). Representative whole-mount and orthogonal views of WIF1-MYC-tag and WIF1 immunostaining of E15.5 embryos. Note uniform distribution of protein within the plane of the embryonic epidermis (white arrows). Dashed line demarcates the border between epidermis and dermis. Yellow lines represent the corresponding orthogonal views. Scale bar, 20 μm. (B) Endogenous WIF1 localization is shown by whole-mount immunofluorescence of interfollicular epidermis, hair placodes, hair buds and hair germs. Note that WIF1 is increased in the hair bud and germ epidermis but is only expressed at the bud stage in the early dermal condensate (yellow dotted lines). Note also the distinct apical localization of WIF1 in hair buds and germs. Wif1 full KO embryos were used to test the specificity of the antibody, shown here for the hair germ stage. Boxed areas in blue are magnified below each image, with WIF1 and LEF1 immunolabels. Scale bars, 20 μm.
Figure 5—figure supplement 2
NOTUM expression during early hair follicle development.
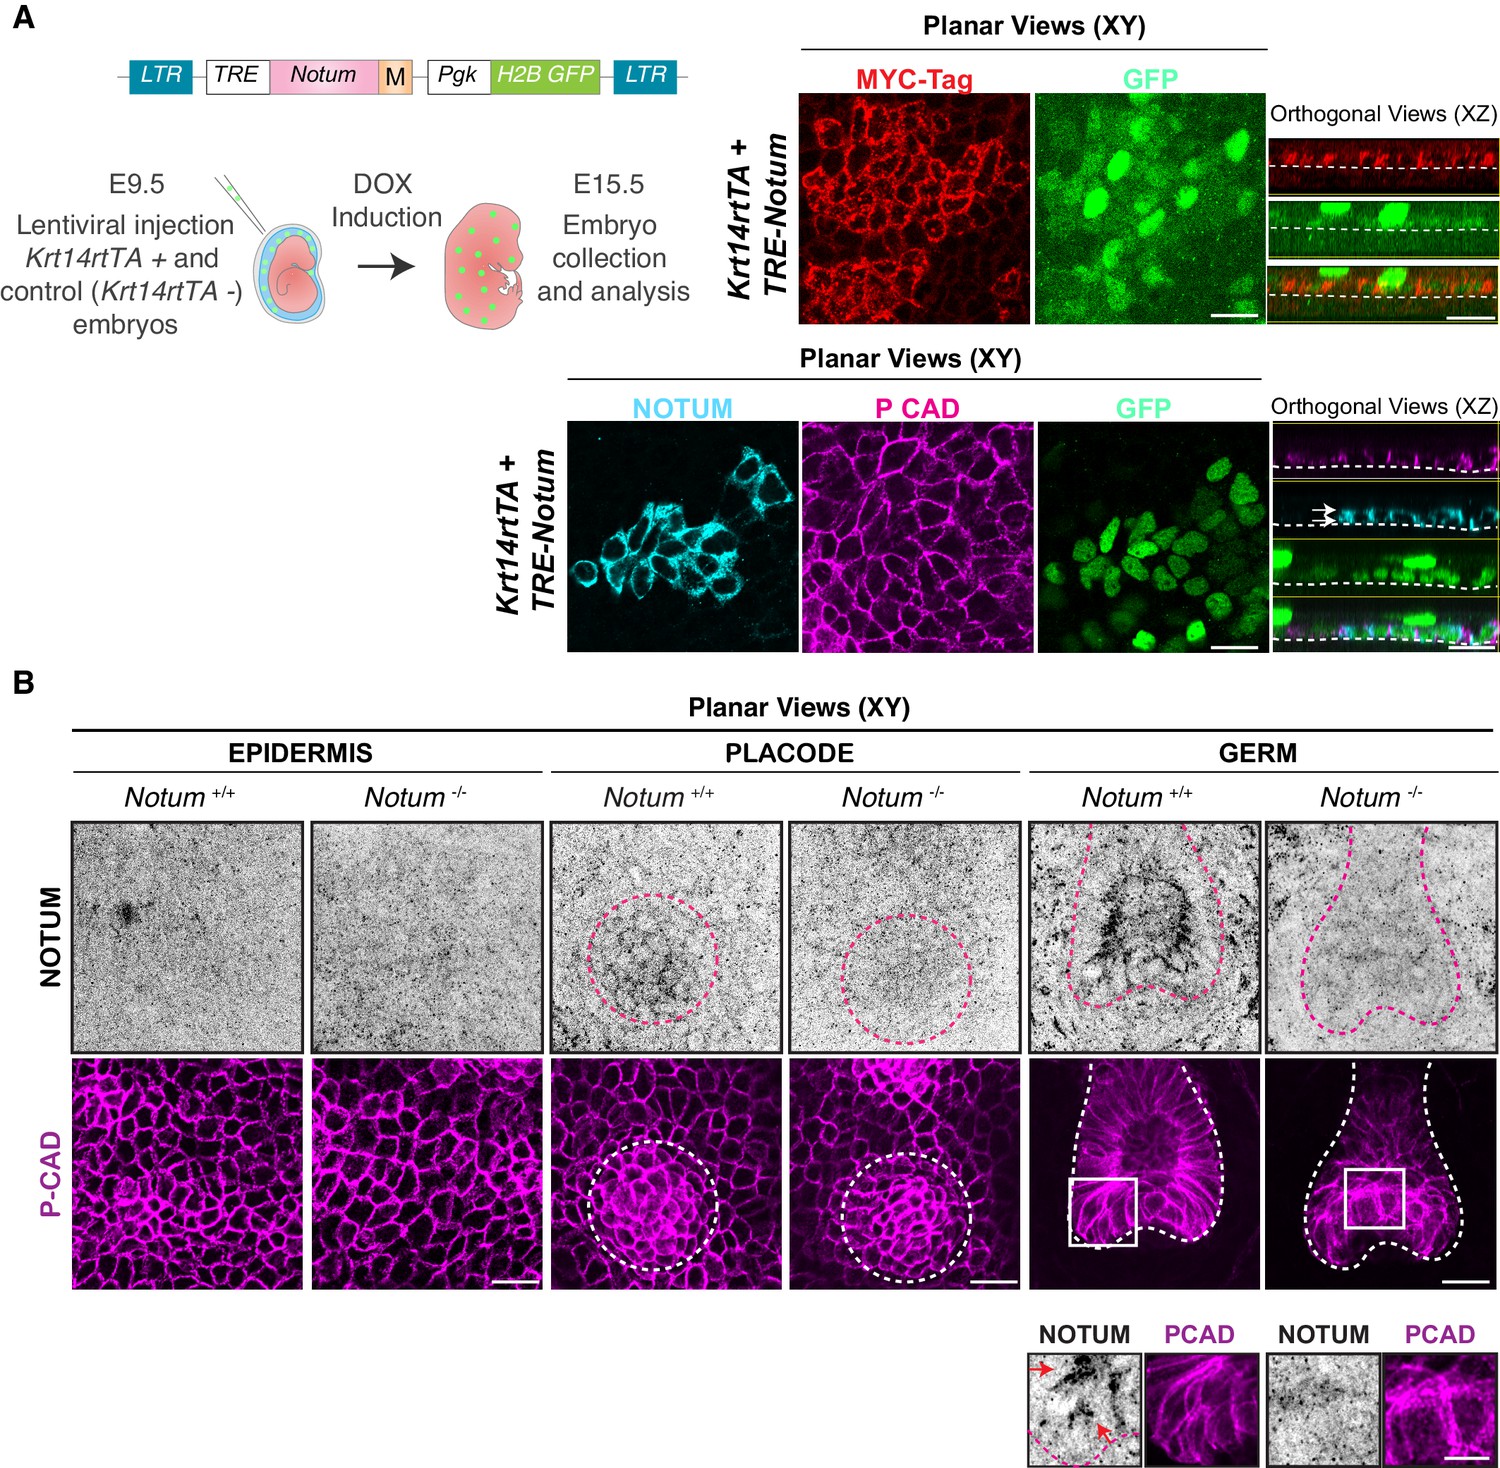
(A) Strategy to monitor NOTUM by MYC-epitope tagging (M). Depicted LV was introduced into the amniotic cavities of E9.5 Krt14rtTA embryos and the transduced Notum gene was activated by doxycycline (DOX). Representative whole-mount planar (XY) and orthogonal (XZ) views of NOTUM-MYC-tag immunostaining. Note that within the plane of embryonic epidermis, NOTUM is uniformly distributed (white arrows). Dashed lines demarcate the border between epidermis and dermis. (B) Endogenous NOTUM immunolocalization in wild-type and Notum-null skin, is shown by whole-mount immunofluorescence of interfollicular epidermis, hair placode and hair germs. P-Cadherin co-immunolabeling was used to mark the skin epithelium. Dotted circles/lines encase the developing hair follicles. Boxed areas are magnified in the boxes below the relevant images. Note little or no NOTUM in interfollicular epidermis. However, NOTUM is expressed in developing hair placodes. At the hair germ stage, it is clear that endogenous NOTUM protein concentrates on the apical side of WNThi epithelial cells (insets, red arrows). Notum-null skin was used as a control to show the specificity of the NOTUM antibody. All scale bars, 20 μm.
Figure 5—figure supplement 3
Differential polarization of WNT inhibitors and activators.
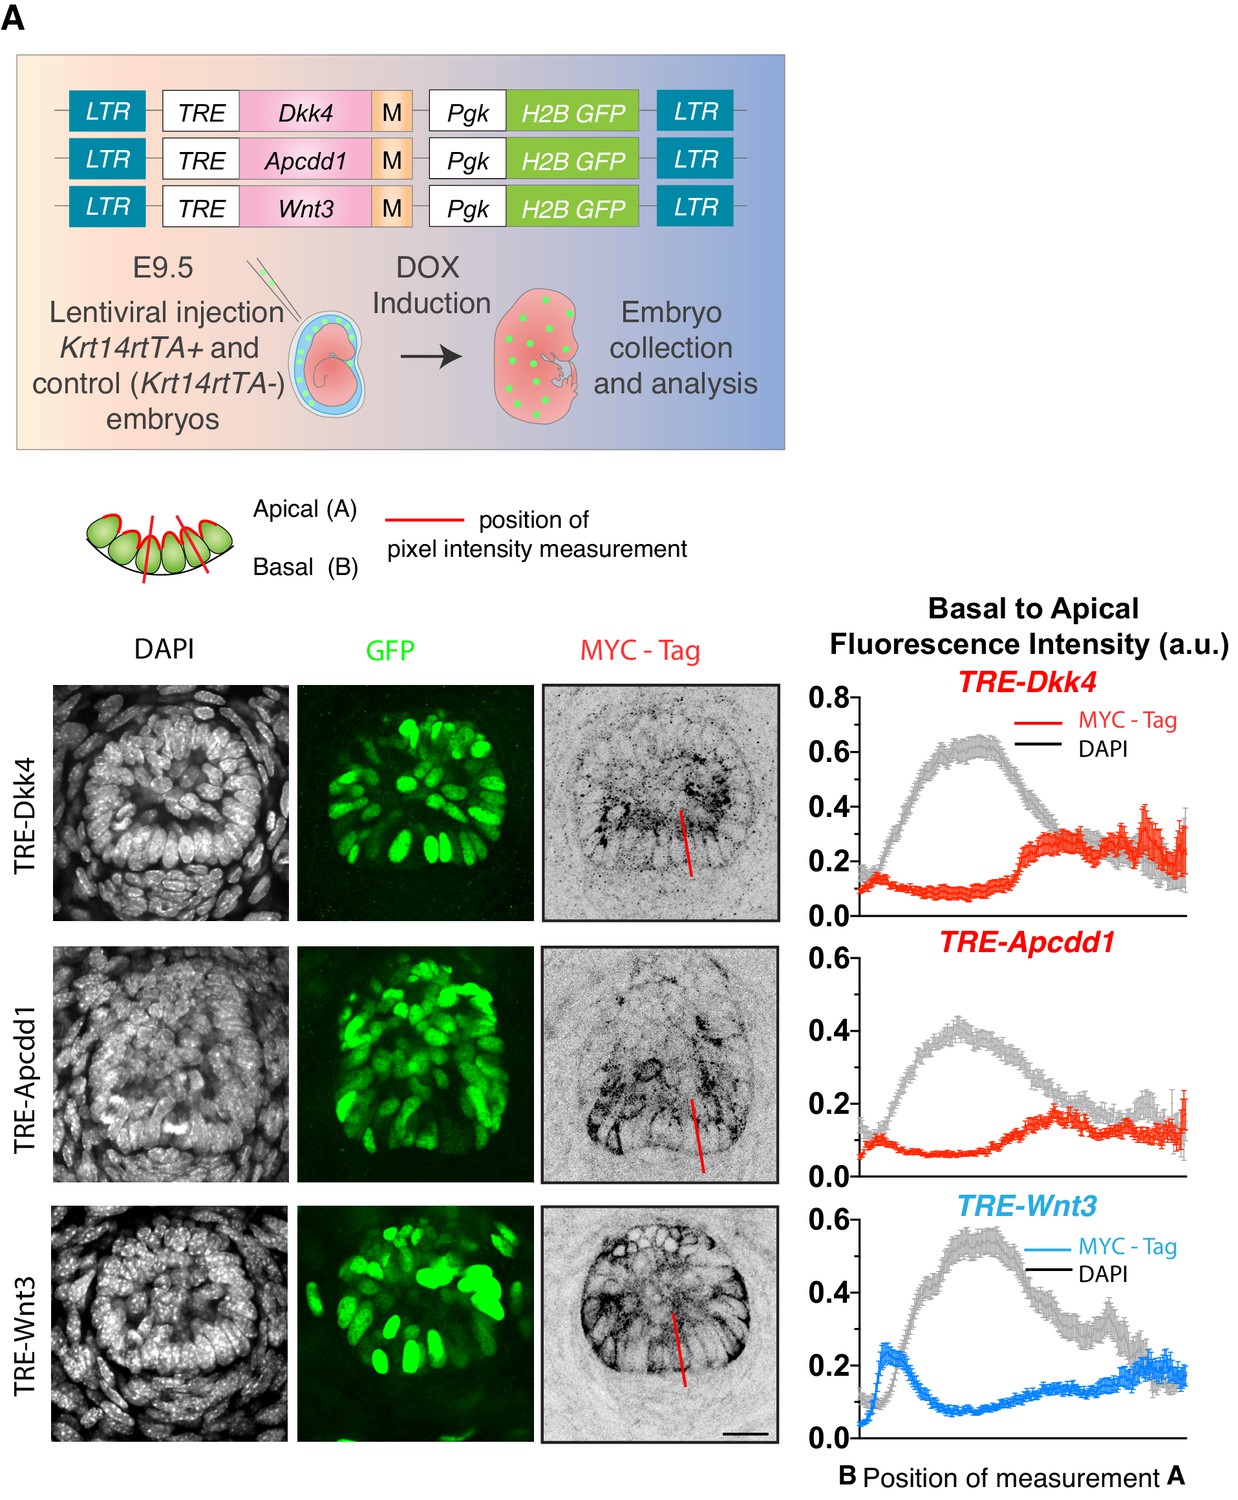
Strategy to monitor WNT inhibitors (DKK4 and APCDD1) and ligands (WNT3) by MYC-epitope tagging (M). LV-constructs were introduced into the amniotic cavities of E9.5 Krt14rtTA embryos, and transduced genes were activated by doxycycline (DOX). Whole-mount immunofluorescence and/or immunohistochemistry of representative images of hair buds are shown below. DAPI to label chromatin; anti-GFP to mark nuclei of transduced cells; Anti-MYC-tag to label the expressed inhibitor/ligand. At right are shown the basal-apical MYC-Tag pixel intensity profiles, which were measured along the lines presented in the overlying schematic of the WNThi progenitor cells of the hair follicle. A minimum of 40 WNT-signaling progenitor cells were analyzed and averaged to develop these profiles. Note the preferential apical enrichment of DKK4 and APCDD1 and opposing basal enrichment of WNT3 signal. Mean ± SEM. a.u., arbitrary units. All scale bars 20 μm.
-
Figure 5—figure supplement 3—source data 1
Source data for the graphs shown in Figure 5—figure supplement 3A.
- https://cdn.elifesciences.org/articles/54304/elife-54304-fig5-figsupp3-data1-v2.xlsx
Figure 6 with 5 supplements
Hair bud progenitors apically polarize WNT inhibitors to protect their own identity and differentially confer WNT signaling to their neighbors.
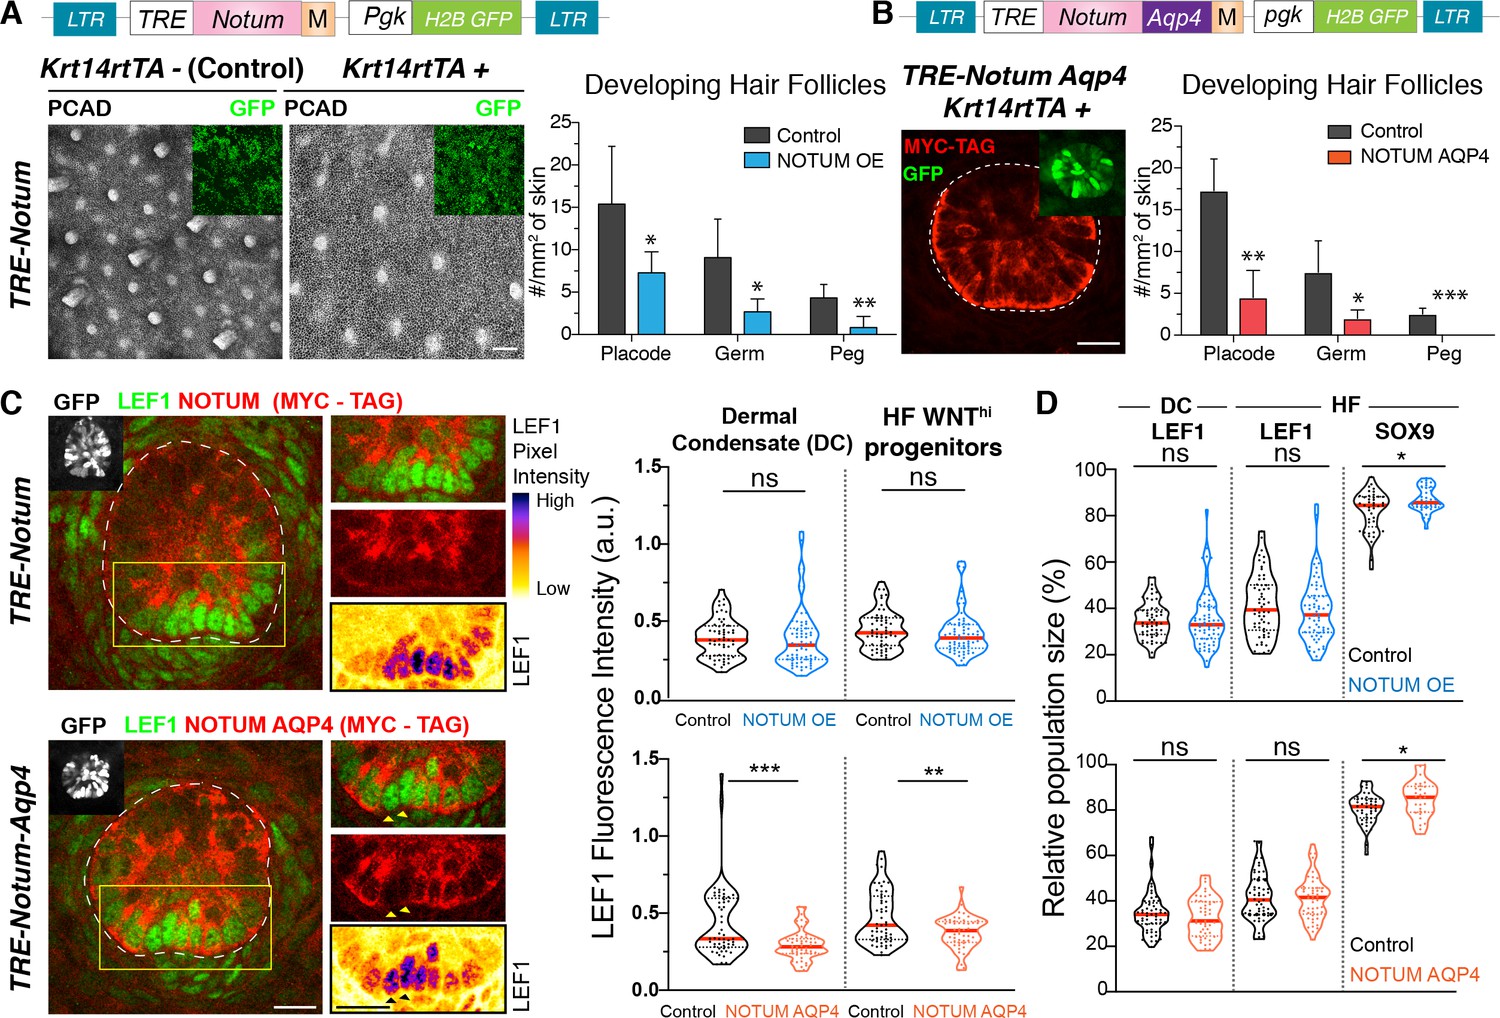
(A) Whole-mount immunofluorescence and quantifications reveal that elevating NOTUM across the epidermal plane results in significantly fewer hair follicles (Mean ± SD; n > 10 mm2 skin analyzed from ≥3 embryos; *p<0.05; **p<0.005; Mann-Whitney test). Scale Bar, 100 μm. OE, overexpression. Insets verify transduced regions. All scale bars for immunofluorescence images are 20 μm. (B) Adding an aquaporin4-tag mispolarizes NOTUM to the basal side of hair bud progenitors. Quantifications reveal that mis-polarizing a WNT inhibitor poses a significant impediment to hair follicle morphogenesis (Mean ± SD; n = 8 mm2 skin analyzed from ≥3 embryos; *p<0.05; **p<0.005; ***p<0.0005; unpaired Student t test). White dotted lines demarcate epithelial-mesenchymal borders throughout. (C) Whole-mount immunofluorescence and quantifications of normalized LEF1 pixel intensities reveals that NOTUM mis-polarization leads to a significant decrease of LEF1 intensity in WNT signaling cells from both the dermal condensate and the hair bud (n ≥ 48 hair follicles from ≥3 embryos each; Mann-Whitney test ***p=0.0002 and unpaired t test **p<0.005; n.s. non-significant; red lines represent the distributions’ median). Yellow boxes show regions magnified at right. Arrowheads show two cells not expressing NOTUM-AQP4-MYC-Tag, which have higher LEF1 signal than their expressing neighbors. (D) Violin Plots show that increasing levels of NOTUM and NOTUM-AQP4 lead to an increase of SOX9 expressing cells (n ≥ 30 developing hair follicle from at least three different embryos; Mann-Whitney test TRE-NOTUM *p=0.0389 and TRE-NOTUM-AQP4 *p=0.0461 n.s. non-significant; red lines represent the distributions’ median).
-
Figure 6—source data 1
Source data for the graphs shown in Figure 6A, B, C, and D.
- https://cdn.elifesciences.org/articles/54304/elife-54304-fig6-data1-v2.xlsx
Figure 6—figure supplement 1
WNT inhibitor overexpression perturbs hair follicle formation.
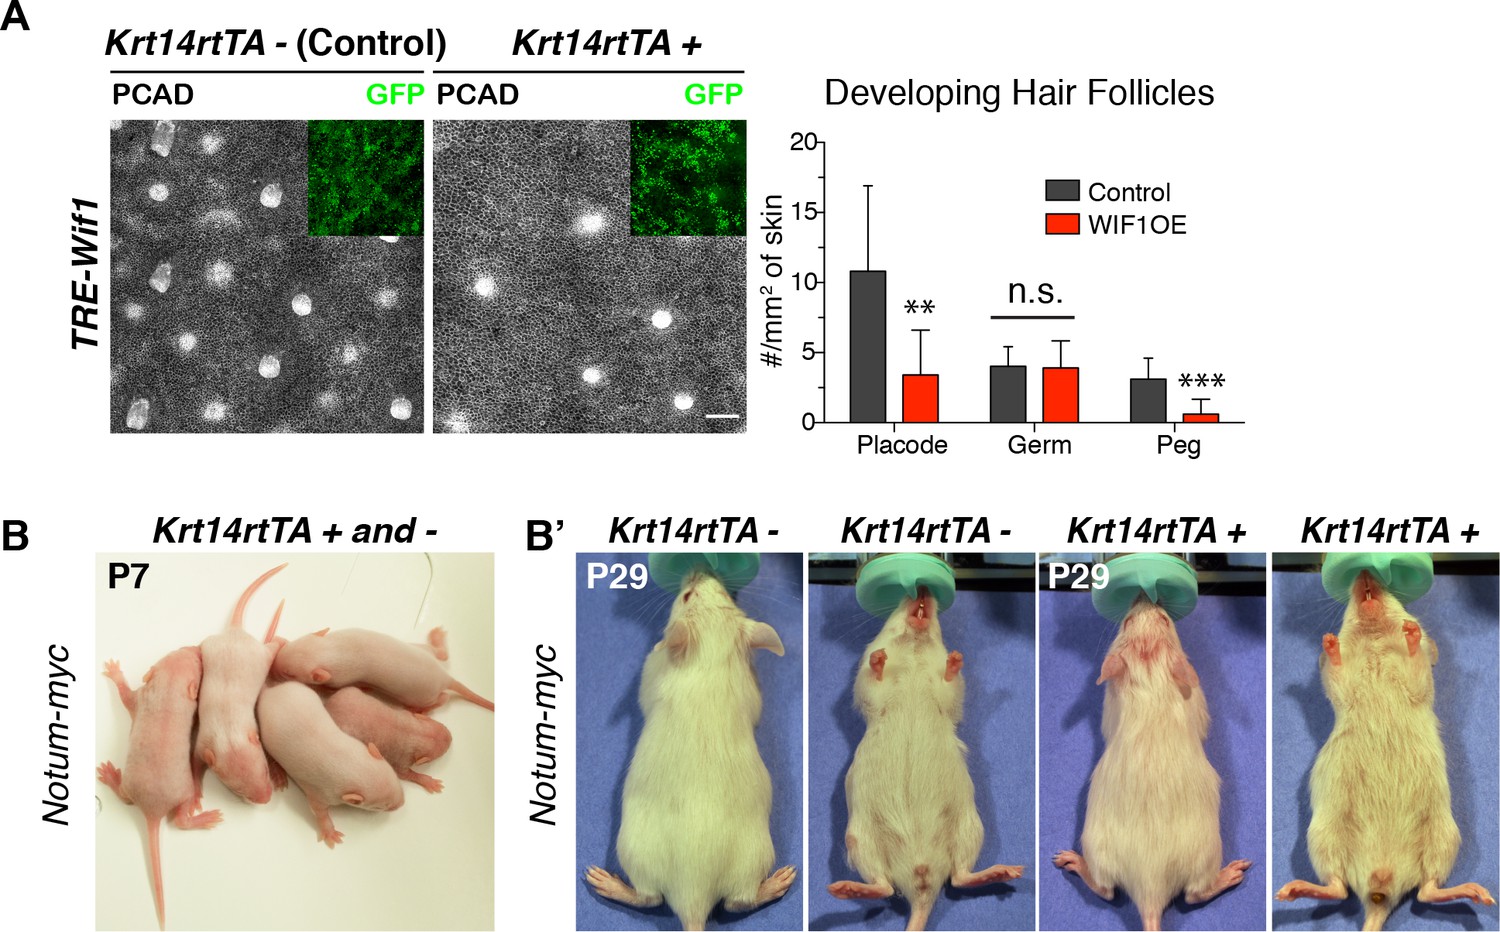
(A) Whole mount immunofluorescence and quantifications reveals that elevating WIF1 across the epidermal plane results in significantly fewer developing hair follicles beginning at the placode stage. Insets verify that the skin regions shown were transduced (GFP+) (Mean ± SD; n > 18 mm2 skin analyzed; **p<0.05; ***p<0.005; n.s. non-significant; unpaired Student t test). Scale Bar, 100 μm. OE, overexpression. (B–B’) Sparser hair coat upon ectopic Notum expression. Example of neonatal litter, some of which overexpress NOTUM and show a sparser hair coat than their control littermates. Note also the sparser hair coat of a representative P29 adult mouse that is positive for Notum overexpression, when compared to its uninduced control littermate.
-
Figure 6—figure supplement 1—source data 1
Source data for the graphs shown in Figure 6—figure supplement 1A.
- https://cdn.elifesciences.org/articles/54304/elife-54304-fig6-figsupp1-data1-v2.xlsx
Figure 6—figure supplement 2
Hair bud progenitors cannot maintain their fate upon WNT inhibition.
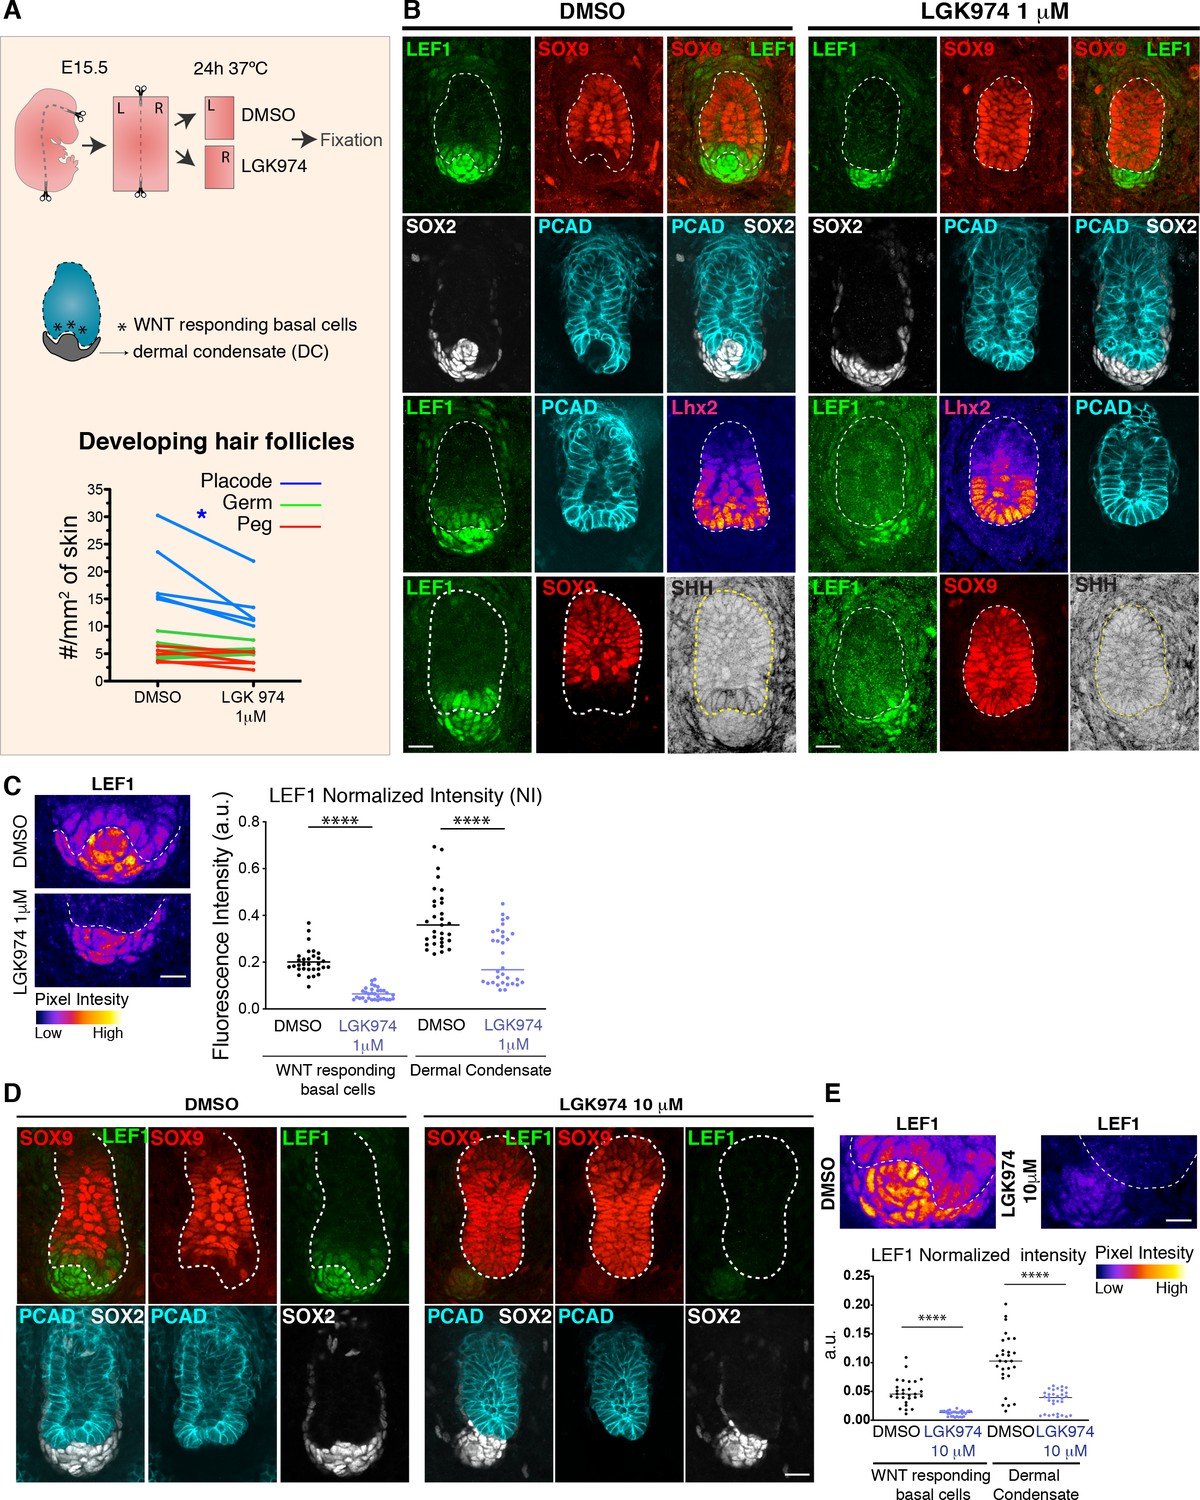
(A) Experimental design and results of pharmacological WNT inhibition in embryonic skin explants exposed to the porcupine inhibitor LGK974. Note that placode/bud numbers were significantly reduced after 24 hr treatment with 1 mM LGK974, a porcupine inhibitor and established blocker of WNT signaling (n = 5 embryos where each line represents the average number of placodes, germs and pegs per skin mm2, on an independent explant. *p<0.05; paired Student t test). (B) Immunofluorescence of explants from experiment in (A). Note that upon 1 mM LGK974 treatment, significant alterations appear in WNT signaling (nuclear LEF1), specifically within the normally WNThi bud progenitors that border the dermal condensate border. Note also that SHH is suppressed in these progenitors while SOX9 (normally restricted to WNTlo hair follicle cells) is induced, reflecting the inability of WNThi bud progenitors to maintain their fate when WNT signaling is inhibited. Note also that developing hair follicles are unable to envelope the dermal condensate. Scale bars, 20 μm. (C) LEF1 immuno-intensity, color-coded according to pixel intensity, reveals an overall reduction in nuclear LEF1 within both hair bud progenitors and dermal condensate cells upon 1 mM LGK974 treatment. Values were normalized to DAPI (DMSO n = 31 and LGK974 = 32 developing hair follicles ****p<0.0001, Mann-Whitney test). Scale bar, 20 μm. (D) Whole-mount immunofluorescence images of representative developing hair follicles from E15.5 explants treated with DMSO and 10 mM LGK974. Note that LEF1 is lost from bud progenitors, which concomitantly gain SOX9 expression, normally restricted to WNTlo hair follicle cells. Note that at these higher concentrations of WNT-inhibitor, the effects described in (B) are now more pronounced. (E) Total LEF1 in the dermal condensate and basal progenitors was measured and normalized to DAPI. Note that basal hair follicle progenitors quantitatively lost nearly all of their LEF1/WNT-signal, while even at this high concentration of porcupine inhibitor, there is still some residual LEF1/WNT-signal in the dermal condensate cells (DMSO n = 28 and LGK974 = 31 developing hair follicles; ****p<0.0001, Mann-Whitney test). White dotted lines demarcate the epithelial-mesenchymal boundary. Scale Bar, 20 μm; a.u. arbitrary units.
-
Figure 6—figure supplement 2—source data 1
Source data for the graphs shown in Figure 6—figure supplement 2A, C, and E.
- https://cdn.elifesciences.org/articles/54304/elife-54304-fig6-figsupp2-data1-v2.xlsx
Figure 6—figure supplement 3
Hair bud progenitors revert their fate after WNT inhibitor washout.
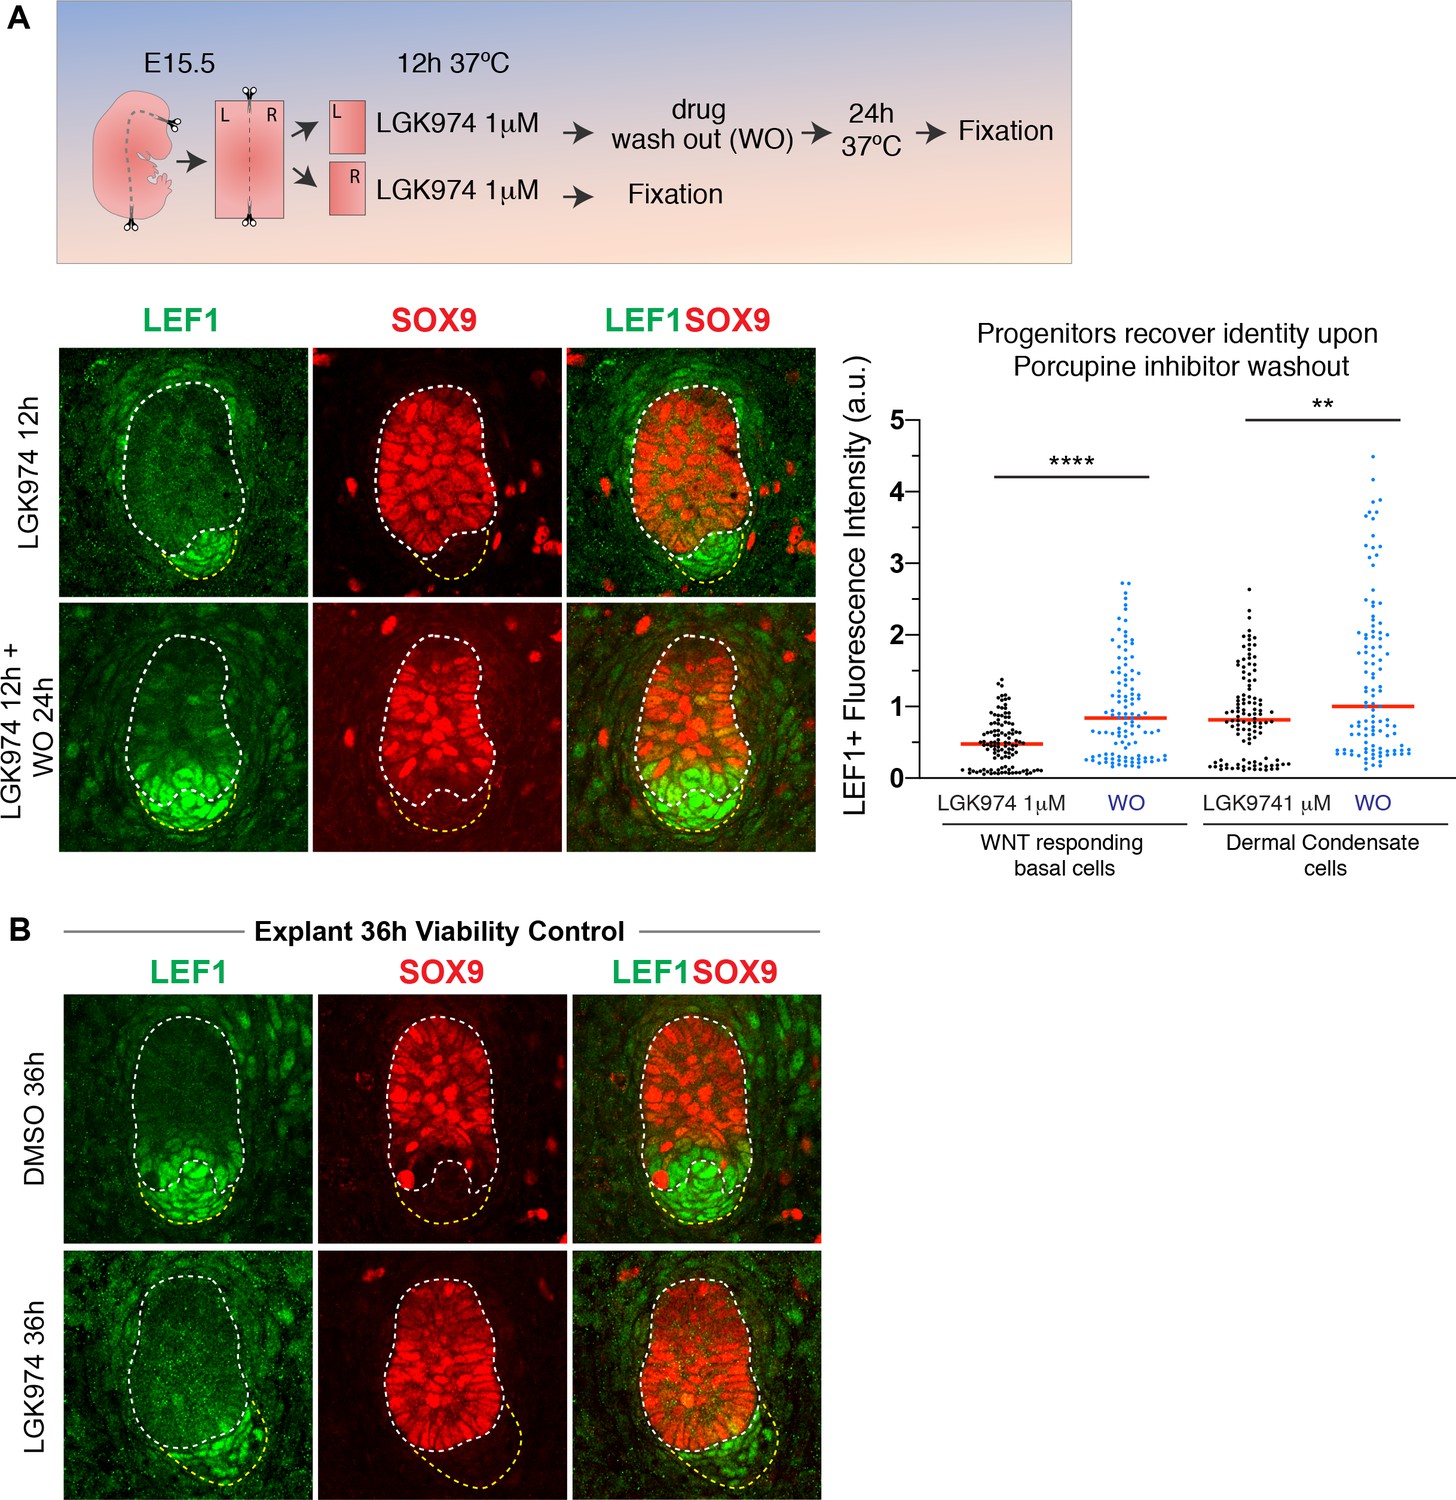
(A) Experimental design and results of pharmacological WNT inhibition and washout in embryonic skin explants exposed to 1 mM porcupine inhibitor LGK974. Immunofluorescence and quantifications of normalized LEF1 pixel intensity. Note basal progenitors and dermal condensate restore LEF1/WNT signaling and WNThi bud cells recover their original (SOX9neg) fate after inhibitor washout (n = 109 developing hair follicles ****p<0.0001; **p=0.0024 Mann-Whitney test). (B) Control experiment showing the viability of E15.5 embryonic skin explants after 36 hr of 1 mM LGK974 and DMSO vehicle treatment. Explants were plated at the bud stage and in the DMSO control, they developed to the hair peg stage by 36 hr. Scale Bar 20 μm.
-
Figure 6—figure supplement 3—source data 1
Source data for the graphs shown in Figure 6—figure supplement 3A.
- https://cdn.elifesciences.org/articles/54304/elife-54304-fig6-figsupp3-data1-v2.xlsx
Figure 6—figure supplement 4
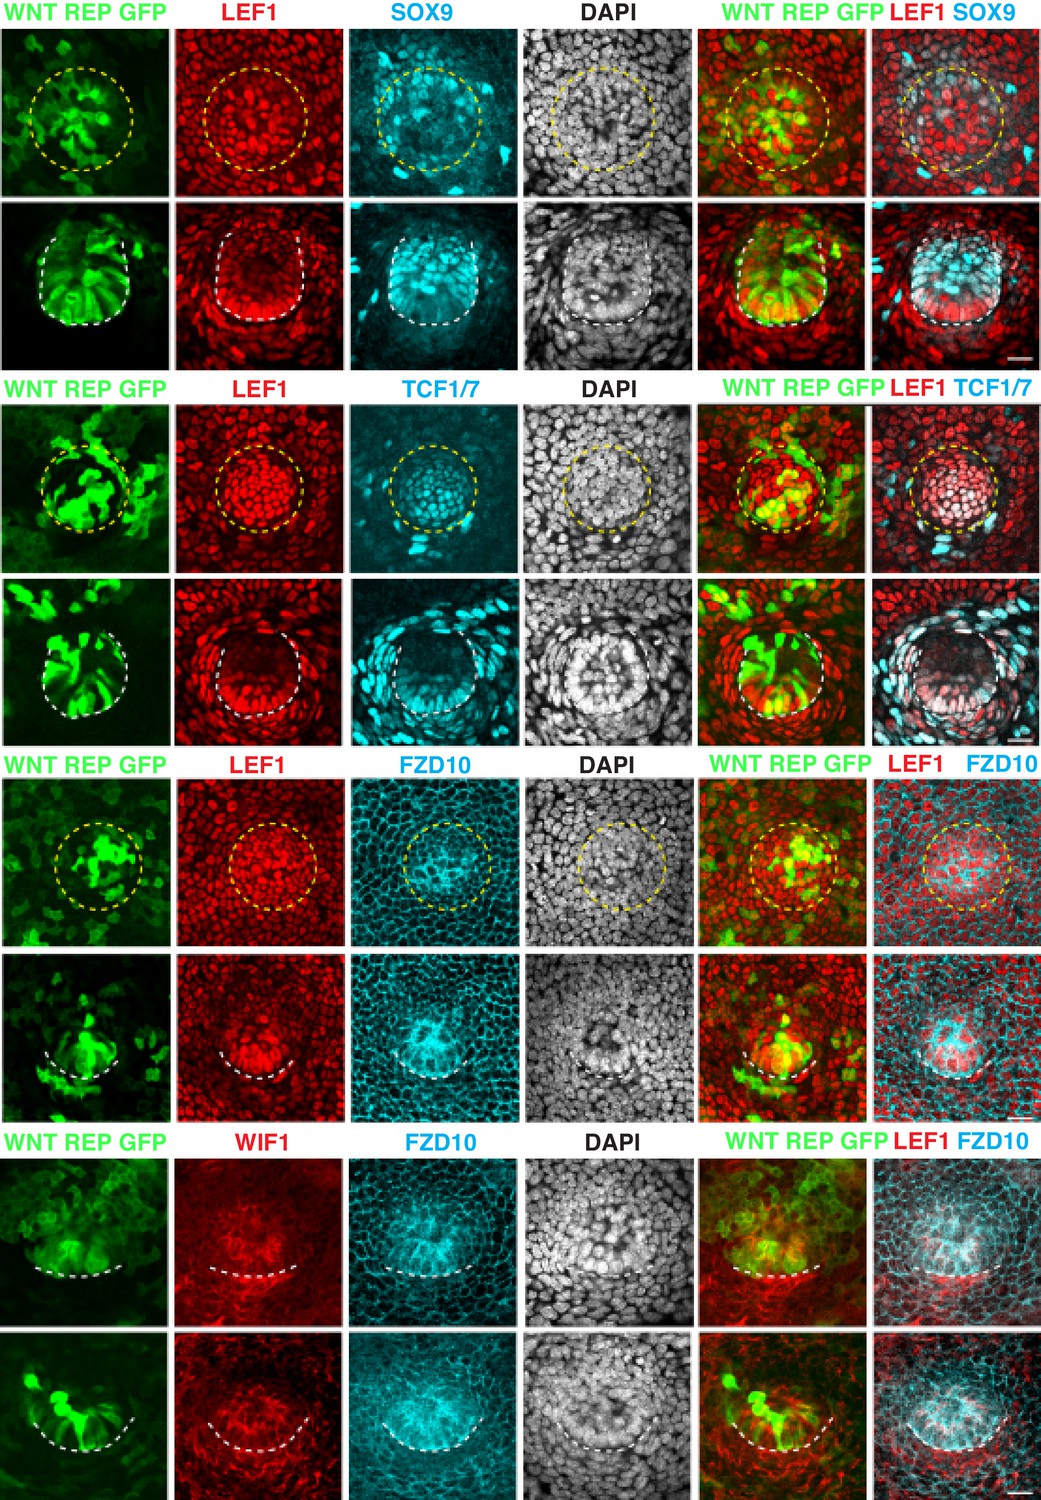
Hair follicle progenitor cells co-express WNT reporter, LEF1, TCF1/7 and WNT target gene products FZD10 and WIF1.
E9.5 skin was transduced with lentivirus harboring the WNT-reporter-GFP (12xTCF-TK-EGFP) and harvested at E15.5. Representative whole-mount immunofluorescence images show WNT reporter GFP positive progenitor cells co-localizing with LEF1. Further strengthening the validity of LEF1 as a bona fide WNT signaling proxy, note that progenitor cells co-express LEF1 and TCF1/7 and express FZD10 and WIF1, products of WNT target genes. Circular yellow dashed lines outline placodes. White dashed lines demarcate epithelial-mesenchymal boundaries. Scale bars, 20 μm.
Figure 6—figure supplement 5
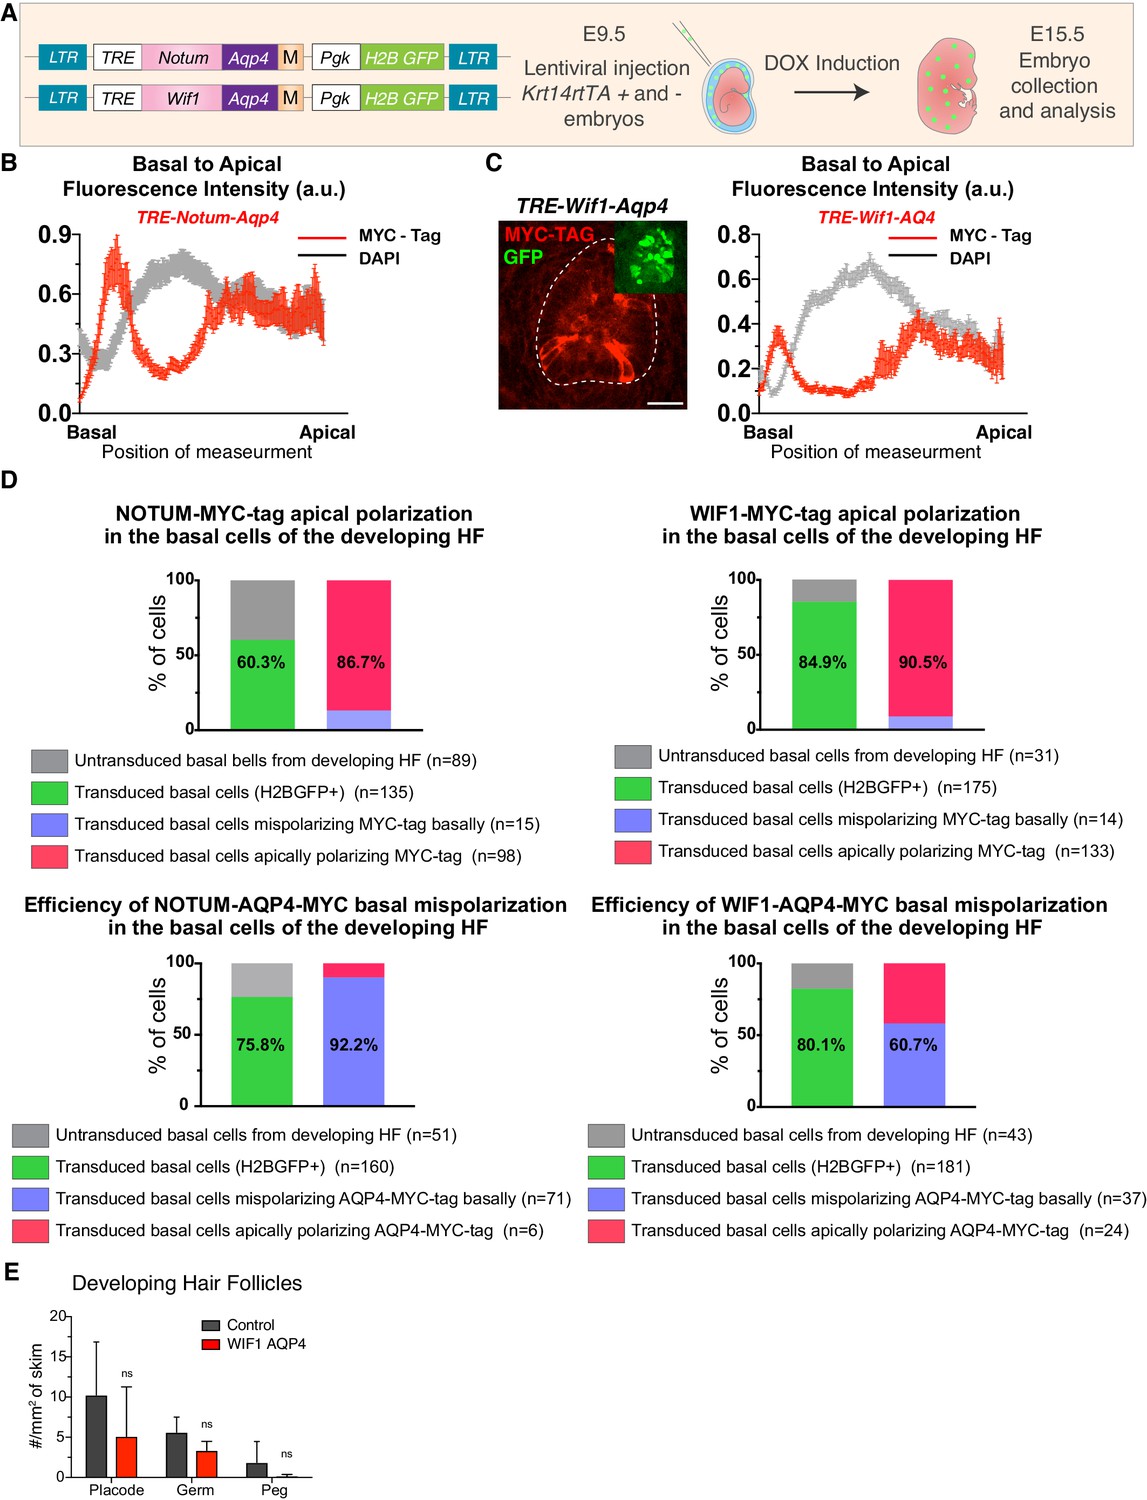
NOTUM and WIF1 mis-localization leads to impaired development of hair follicles.
(A) Experimental setup to induce mis-localization of WNT inhibitors by targeting them to the basal membrane. Transgenes were designed to express NOTUM and WIF1 as proteins tagged with an AQP4 peptide that targets the protein to the basal membrane. The C-terminal MYC tag was added for protein detection by immunofluorescence. LV constructs were transduced into E9.5 Krt14rtTA positive and negative mice. Expression was induced by Doxycycline at E9.5, and embryos were analyzed at E15.5. (B) NOTUM-AQP4 and (C) WIF1-AQP4, basal-apical MYC-Tag pixel intensity profiles denote the enrichment of their basal localization (NOTUM-AQP4 n = 37 cells and WIF1-AQP4 n = 28 Mean± SEM. a.u., arbitrary units). (D) Quantifications to test efficiency of construct transduction (H2BGFP+ cells) and NOTUM and WIF1 ectopic and mis-polarized expression (Myc-tag and AQP4-Myc-tag respectively). Note the shift to basal polarization once the AQP4 tag is added to the construct. n = number of cells from ≥12 hair follicles. (E) Quantifications of WIF1 mis-polarization (n = 8 mm2; n.s. non-significant, Man-Whitney test).
-
Figure 6—figure supplement 5—source data 1
Source data for the graphs shown in Figure 6—figure supplement 5B, C, and E.
- https://cdn.elifesciences.org/articles/54304/elife-54304-fig6-figsupp5-data1-v2.xlsx
Figure 7
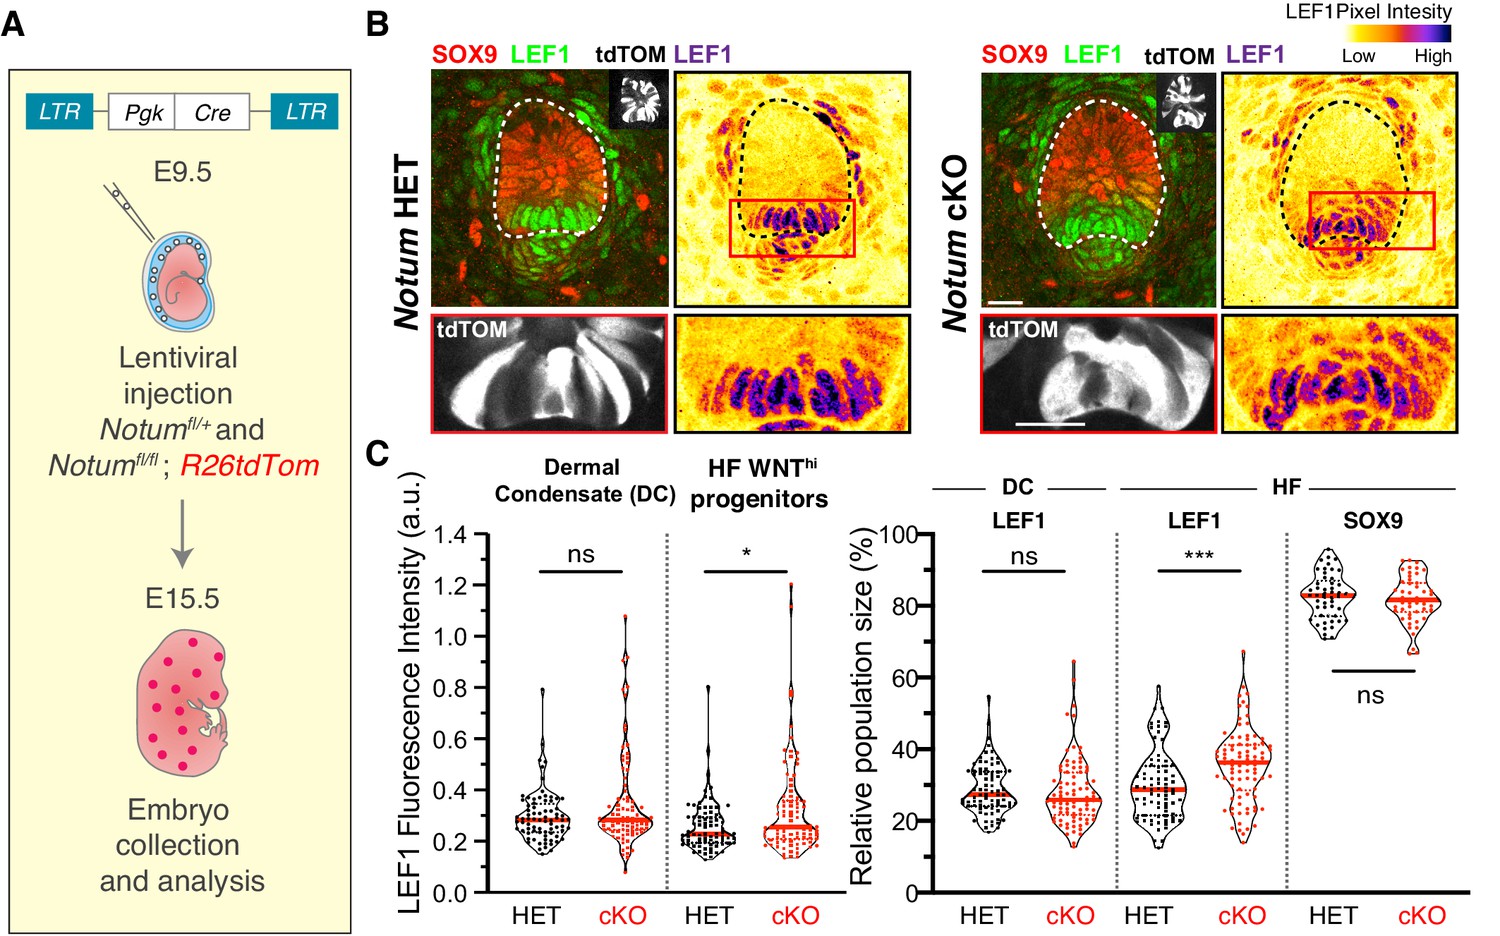
Notum regulates the formation of sharp boundaries between neighboring cell fates.
(A) In utero lentiviral delivery strategy to conditionally ablate Notum in R26dtTomato embryos. (B–C) Representative whole-mount immunofluorescence showing LEF1 intensity profile and population size in Notum -/+ and Notum-/- skin. Red boxes denote regions magnified below each image. Note that Notum ablation (but not heterozygous) leads to an increase in LEF1 signal and LEF1+ cell populations in the WNT signaling progenitor cells (n ≥ 75 hair follicles from ≥3 different litters analyzed; Mann-Whitney test *p=0.0332 and ***p=0.0002; n.s. non-significant; red lines represent the distributions’ median).
-
Figure 7—source data 1
Source data for the graphs shown in Figure 7C.
- https://cdn.elifesciences.org/articles/54304/elife-54304-fig7-data1-v2.xlsx
Figure 8

Summarizing model.
WNT signaling basal progenitors form opposing intracellular morphogen gradients of WNT inhibitors and WNT ligands/activators. In so doing, they preserve their own WNT signaling and identity and directionally permit (dermal condensate) or restrict (suprabasal hair bud cells) WNT signaling in surrounding neighbors.
Additional files
-
Supplementary file 1
Key Resources Table.
- https://cdn.elifesciences.org/articles/54304/elife-54304-supp1-v2.docx
-
Transparent reporting form
- https://cdn.elifesciences.org/articles/54304/elife-54304-transrepform-v2.pdf
Download links
A two-part list of links to download the article, or parts of the article, in various formats.
Downloads (link to download the article as PDF)
Open citations (links to open the citations from this article in various online reference manager services)
Cite this article (links to download the citations from this article in formats compatible with various reference manager tools)
Progenitors oppositely polarize WNT activators and inhibitors to orchestrate tissue development
eLife 9:e54304.
https://doi.org/10.7554/eLife.54304


