Integrase-RNA interactions underscore the critical role of integrase in HIV-1 virion morphogenesis
- Department of Molecular Microbiology, Washington University School of Medicine, United States
- Division of Infectious Diseases, University of Colorado School of Medicine, United States
- Department of Cancer Immunology and Virology, Dana-Farber Cancer Institute, United States
- Department of Medicine, Harvard Medical School, United States
Figures
Figure 1
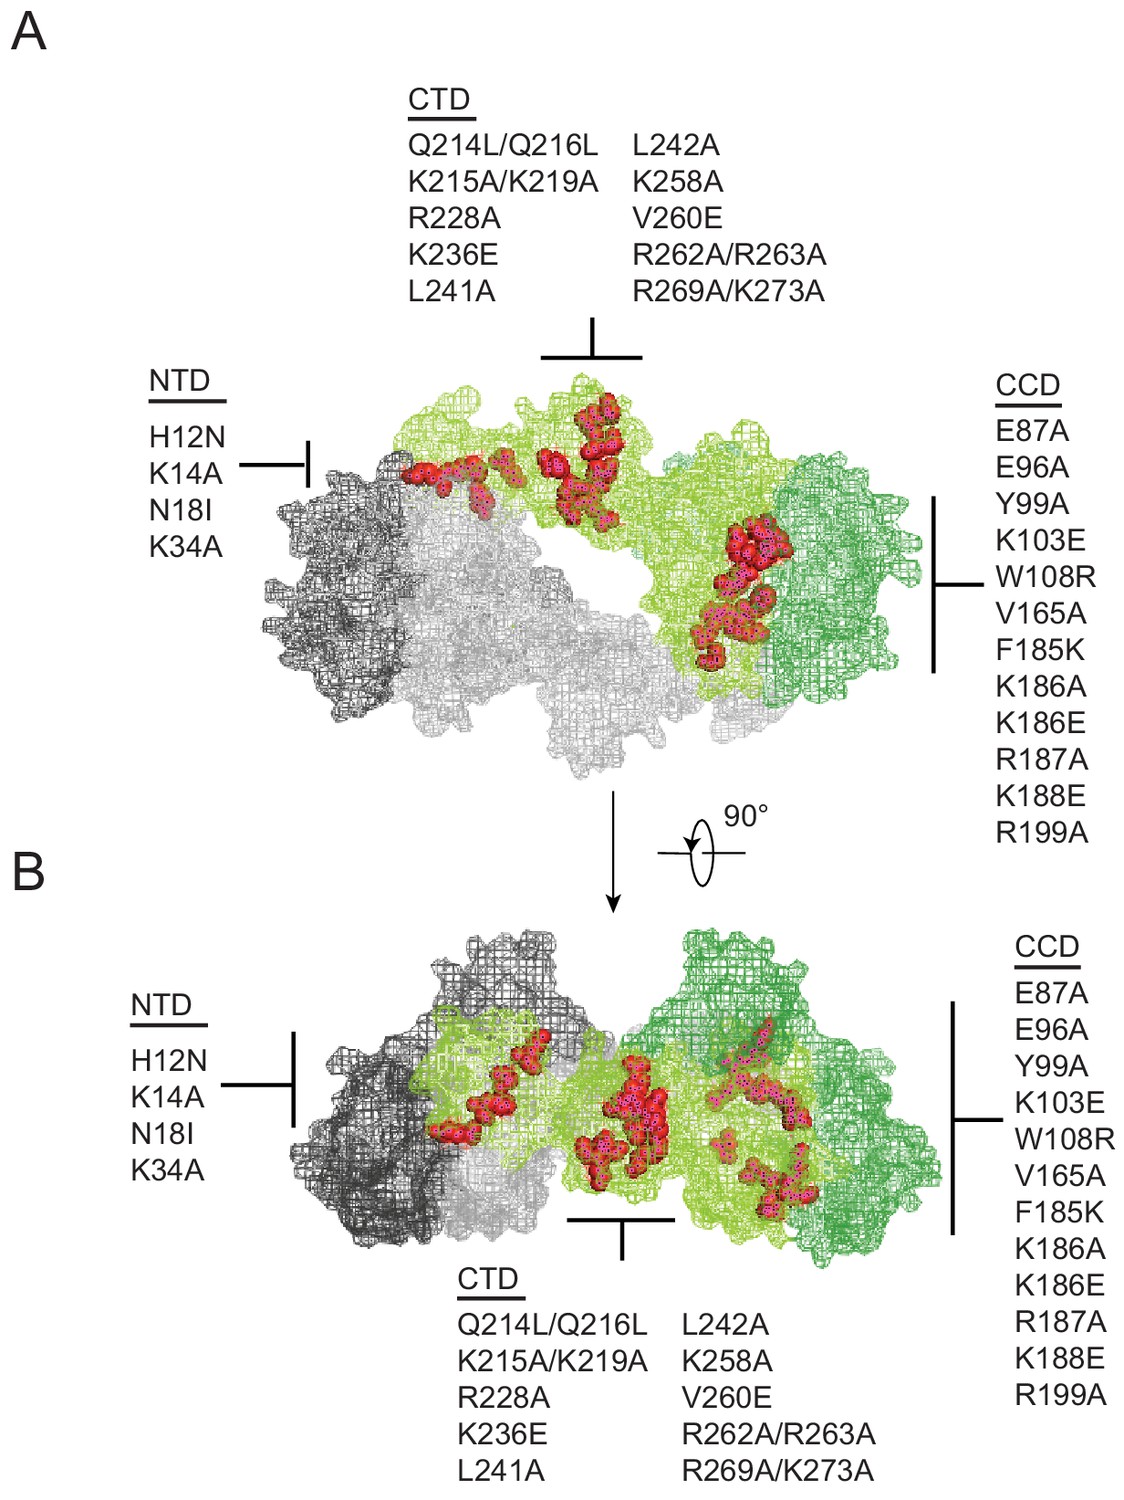
Class II IN substitutions locate throughout IN and cluster at interfaces that mediate IN multimerization.
(A) Location of class II IN substitutions used in this study displayed in red on a single IN monomer within the context of the HIV-1 IN tetramer intasome structure consisting of a dimer of dimers (PDB 5U1C). The two dimers are displayed in either gray or green, with individual monomers within each displayed in different shades. The DNA is omitted for clarity. (B) View of the structure displayed in A rotated 90°.
Figure 2 with 1 supplement
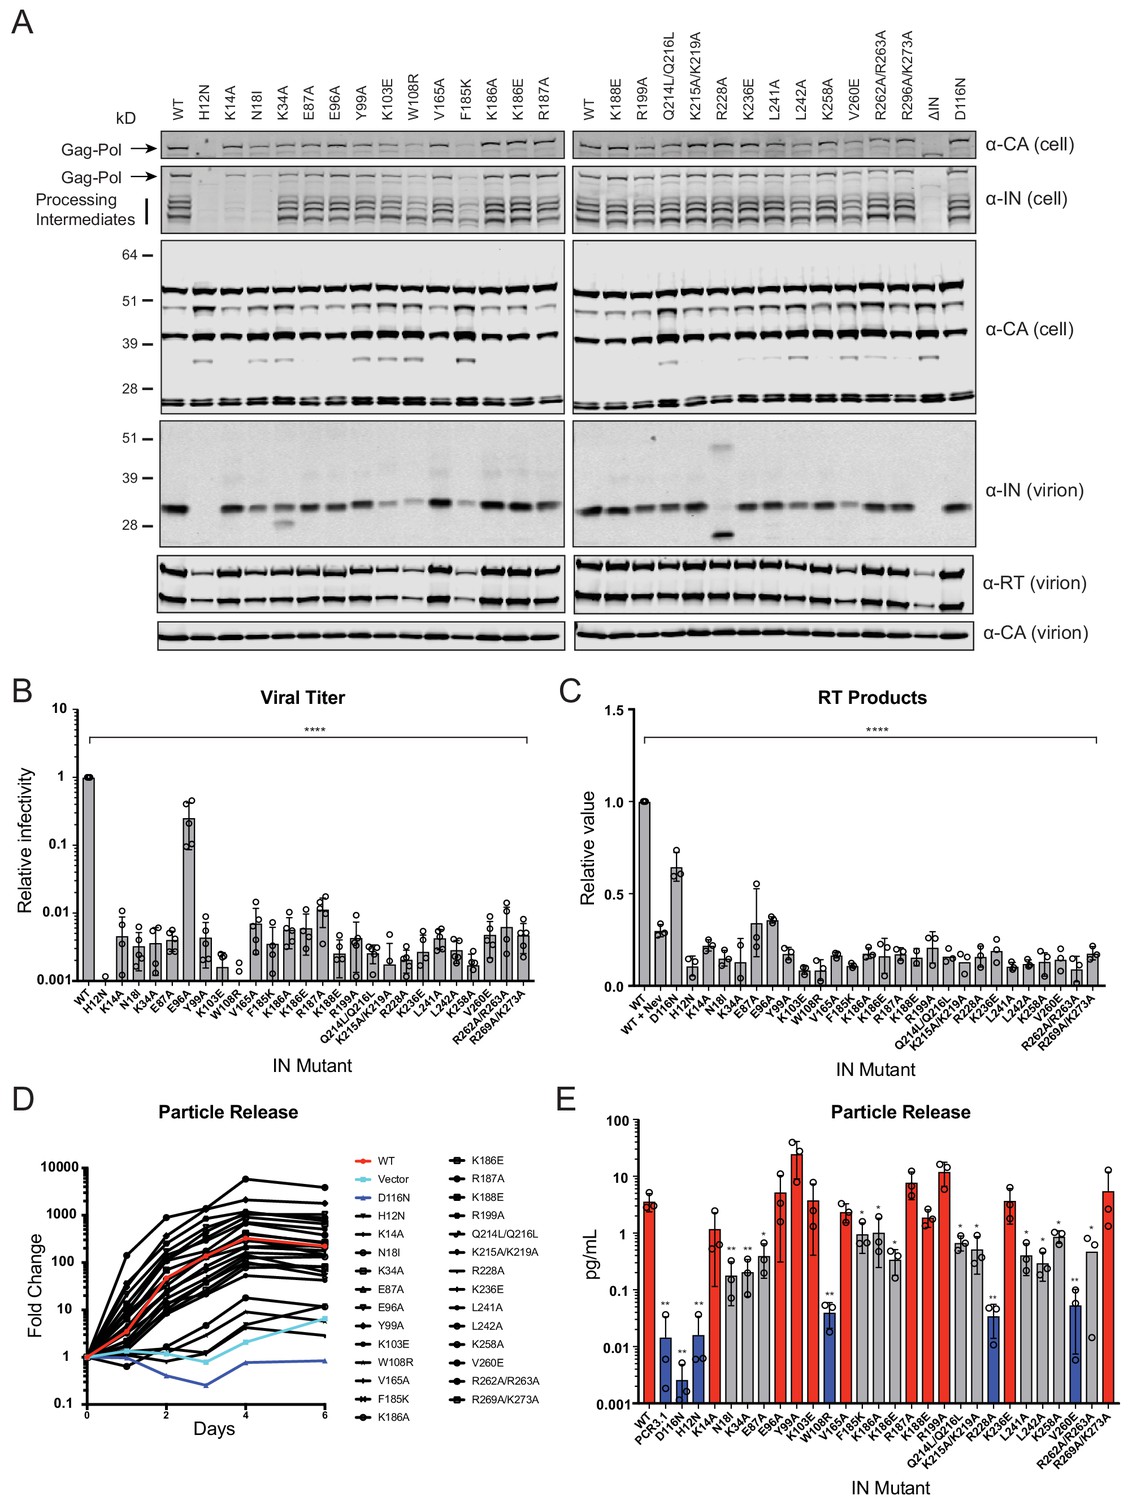
Characterization of the replication defects of class II IN mutant viruses.
(A) Immunoblot analysis of Gag and Gag-Pol products in cell lysates and virions. HEK293T cells were transfected with proviral HIV-1NL4-3 expression plasmids carrying pol mutations encoding for the indicated IN substitutions. Cell lysates and purified virions were harvested 2 d post-transfection and analyzed by immunoblotting for CA, IN, and, in the case of virions, RT. A representative image of one of four independent experiments is shown. (B) Infectious titers of WT or IN mutant HIV-1NL4-3 viruses in cell culture supernatants were determined on TZM-bl indicator cells. Titer values are expressed relative to WT (set to 1). Columns show the average of five independent experiments (open circles) and error bars represent standard deviation (****p<0.0001, by one-way ANOVA with Dunnett’s multiple comparison test). (C) The relative quantity of reverse-transcribed HIV-1 DNA in MT-4 target cells infected with HIV-1NL4-3 at 6 hpi. Quantities of vDNA are expressed relative to WT (set to 1). Columns show the average of three independent experiments (open circles) and error bars represent standard deviation (****p<0.0001, by one-way ANOVA with Dunnett’s multiple comparison test). (D) A representative growth curve of HIV-1NL4-3 IND116N viruses trans-complemented with class II mutant IN proteins in cell culture. Y-axis indicates fold increase in virion yield over day 0 as measured by RT activity in culture supernatants. HIV-1NL4-3 IND116N viruses that were trans-complemented with WT IN, class II mutant INs, IND116N, or an empty vector are denoted as red, black, dark blue, and light blue lines respectively. A representative plot from one of three independent experiments. (E) Fold increase in virions in culture supernatants at 4 dpi, as measured by RT activity in culture supernatants. Trans-complementation of the HIV-1NL4-3 IND116N virus with mutant IN molecules restored particle release to levels comparable to WT IN (red), partially restored particle release (gray) or could not restore particle release (blue). Columns show the average of three independent experiments (open circles) and error bars represent standard deviation (*p<0.05 and **p<0.01, by paired t-test between individual mutants and WT).
Figure 2—figure supplement 1
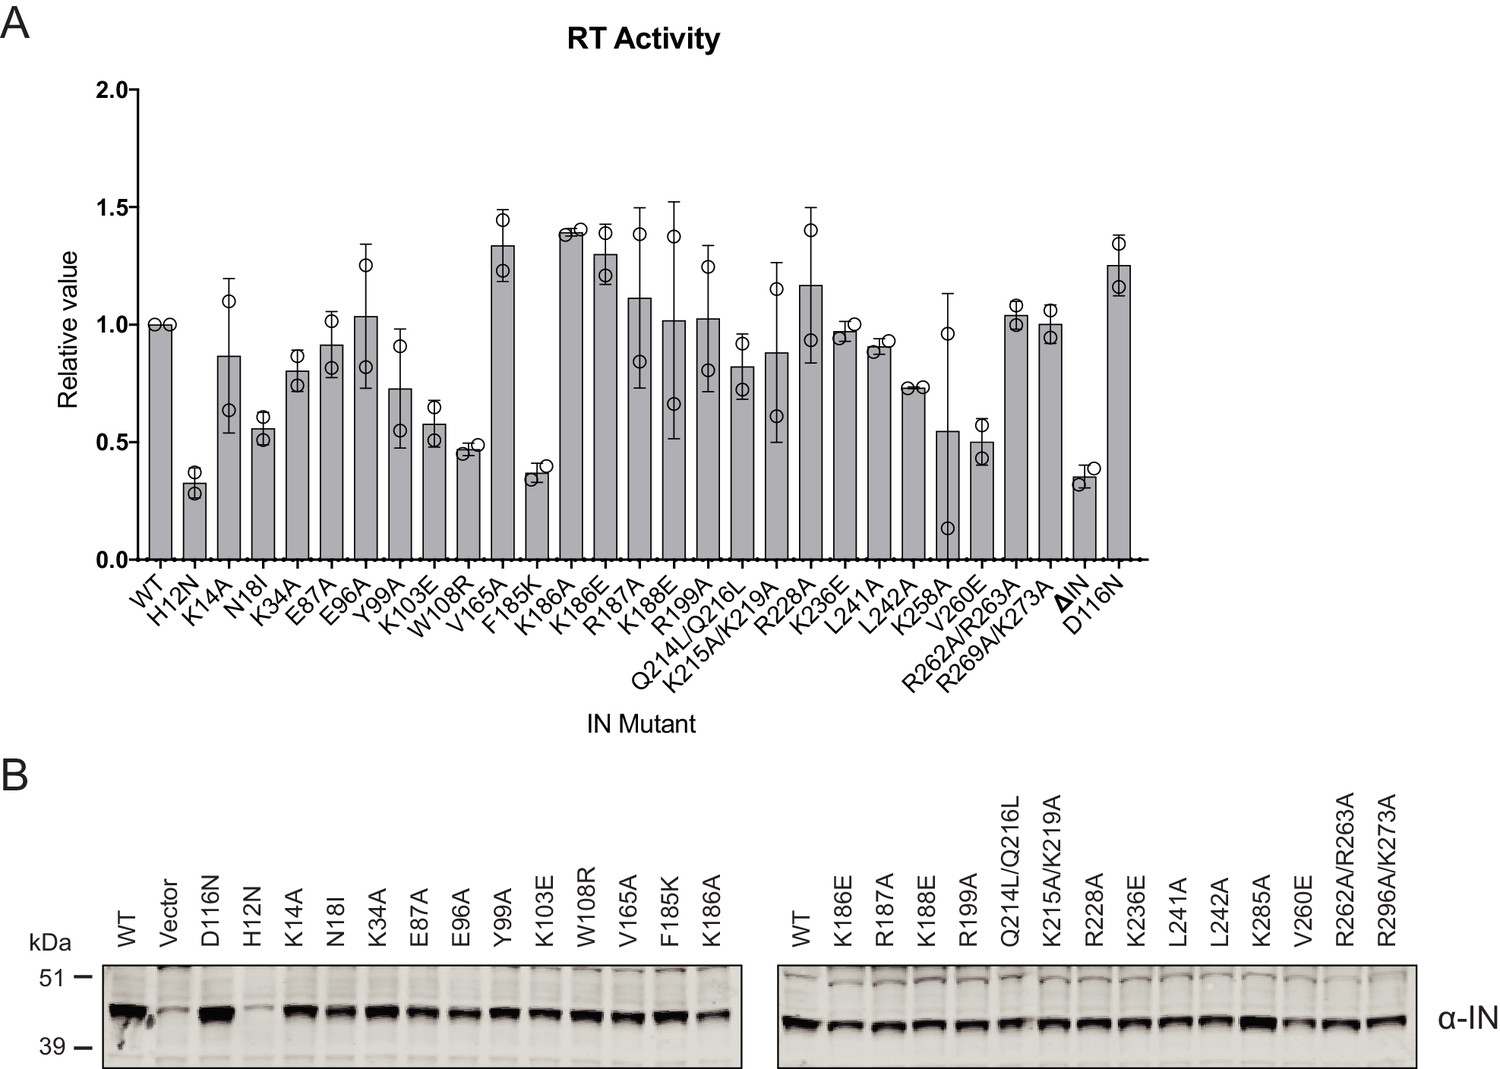
Characterization of the replication defects of class II IN mutant viruses.
(A) Reverse-transcriptase activity measured in HIV-1NL4-3 virion lysates. For each repetition RT activities for the IN mutants are expressed relative to the WT (set to 1). Columns show the average of two independent experiments (open circles) and error bars represent standard deviation (****p<0.0001, ***p<0.001, **p<0.01, and *p<0.05, by unpaired t-test between individual mutants and WT). (B) A representative immunoblot analysis of Vpr-IN fusion constructs in cell lysates. HEK293T cells were co-transfected with the HIV-1NL4-3 IND116N proviral plasmid along with Vpr-IN expression plasmids encoding for the indicated IN substitutions or an empty vector control. The expression of Vpr-IN constructs in cell lysates was detected using an anti-IN antibody.
Figure 3
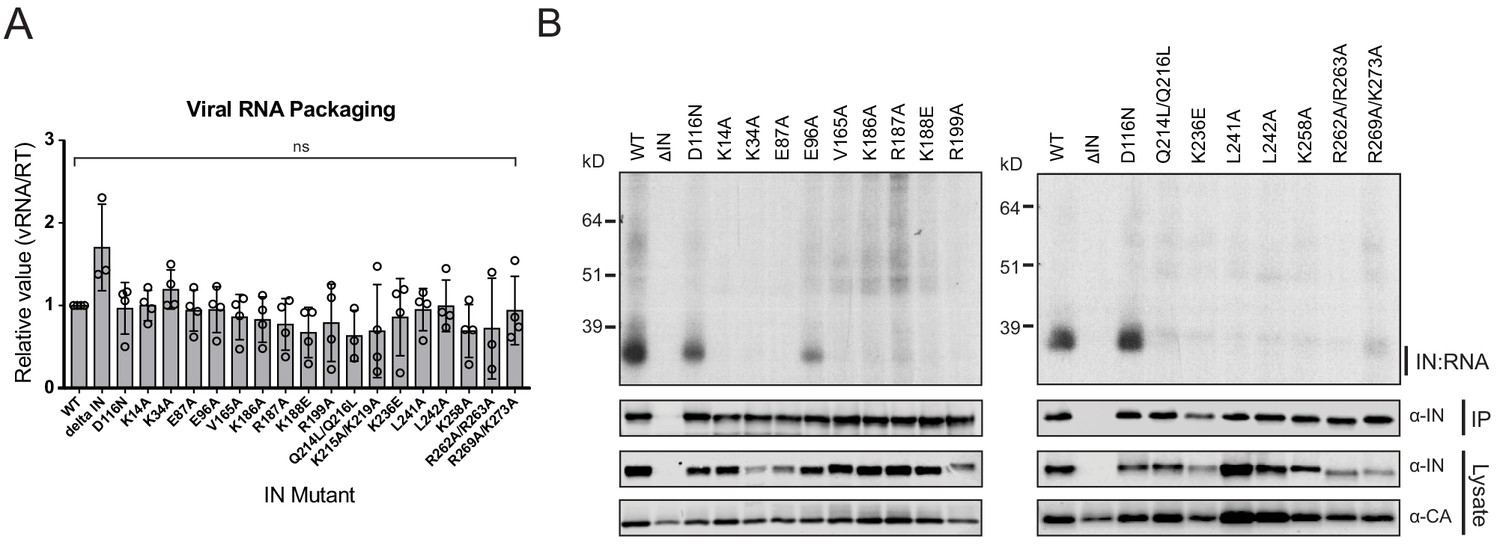
Class II IN substitutions prevent IN binding to the vRNA genome in virions.
(A) Analysis of the levels of packaged viral genomic RNA in WT and IN mutant HIV-1NL4-3 virions. vRNA extracted from purified virions was measured by Q-PCR. Data were normalized to account for differences in particle yield using an RT activity assay. Normalized quantities of vRNA are expressed relative to WT (set to 1). Columns show the average of three-four independent experiments (open circles) and error bars represent standard deviation (ns, not significant, by one-way ANOVA). (B) A representative autoradiogram of IN-RNA adducts immunoprecipitated from WT or IN mutant HIV-1NL4-3 virions. The amount of immunoprecipitated material was normalized such that equivalent levels of WT and mutant IN proteins were loaded on the gel, as also evident in the immunoblots shown below. Levels of IN and CA in input virion lysates is shown in the lower immunoblots. Results are a representative of three independent replicates.
Figure 4 with 1 supplement

Multimerization properties of class II IN mutants in virions and in vitro.
(A) Purified HIV-1 virions were crosslinked with 1 mM EGS and analyzed by immunoblotting as detailed in Materials and Methods. The IN signal at the molecular weights of 32 kDa (monomers), 64 kDa (dimers), and 96 kDa (trimers) was measured and divided by the total signal of the three multimeric species for each virus. Columns show the average of three independent experiments and error bars represent standard error of the mean (**p<0.05 and *p<0.01, by one-way ANOVA with Dunnett’s multiple comparison test). (B) SEC profiles of 10 µM of WT and indicated IN mutants are shown. The X-axis indicates elution volume (mL) and Y-axis indicates the intensity of absorbance (mAU). Tetramers (T), dimers (D), and monomers (M) are indicated. Representative chromatograms from two independent analyses are shown.
Figure 4—figure supplement 1

Multimerization properties of class II IN mutants.
Immunoblot analyses of IN multimers in virions. Purified WT or IN mutant HIV-1NL4-3 virions were treated with 1 mM EGS, and virus lysates analyzed by immunoblotting using antibodies against IN following separation on 6% Tris-acetate gels. The position of monomers (M), dimers (D), and tetramers (T) are indicated by arrows. A representative image of one of three independent experiments is shown.
Figure 5 with 1 supplement
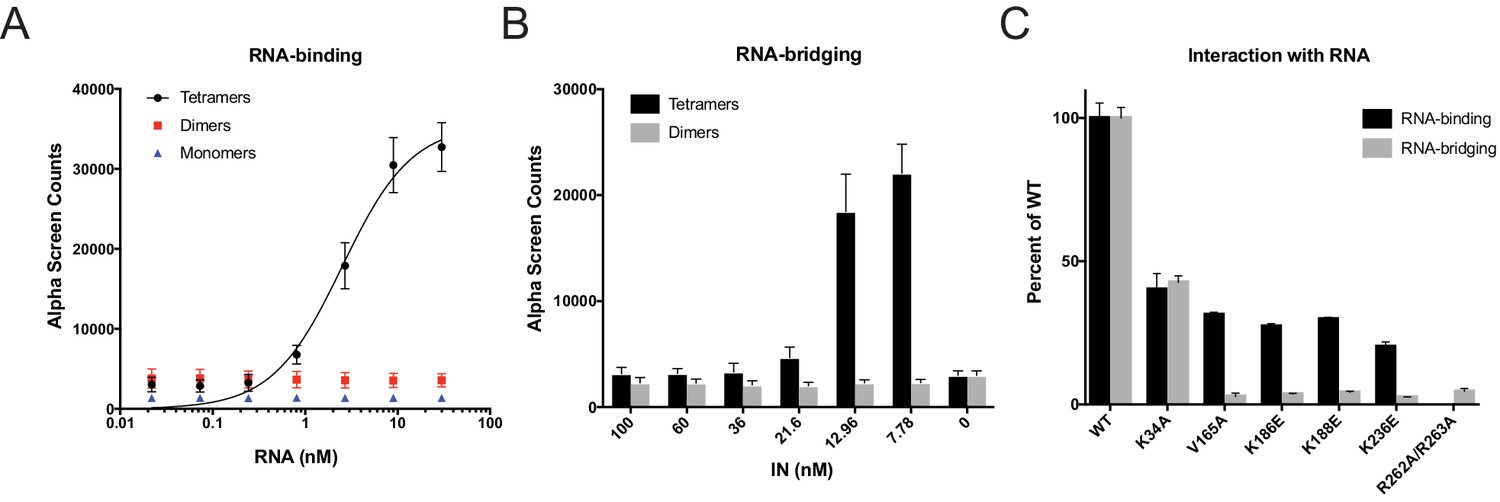
RNA-binding properties of class II IN mutants.
(A) Analysis by AlphaScreen assay of 100 nM WT IN monomers, dimers, and tetramers binding to biotinylated TAR RNA after separation by SEC. Graphed data is the average of three independent experiments and error bars indicate standard deviation. (B) Summary of WT IN dimers and tetramers bridging TAR RNA at different protein concentrations as measured by AlphaScreen assay. Graphed data is the average of four independent experiments and error bars indicate standard deviation. (C) Summary of mutant INs binding to TAR RNA (black bars) and bridging TAR RNA (gray bars) compared to WT IN. Percent binding was calculated for each mutant IN by comparing the calculated Kd value to that of WT IN (normalized to 100%) within an experiment. Percent bridging was calculated by comparing the Alpha Counts at 320 nM for each protein to that of WT (normalized to 100%). Graphed data is the average of three independent experiments and error bars represent standard deviation.
Figure 5—figure supplement 1
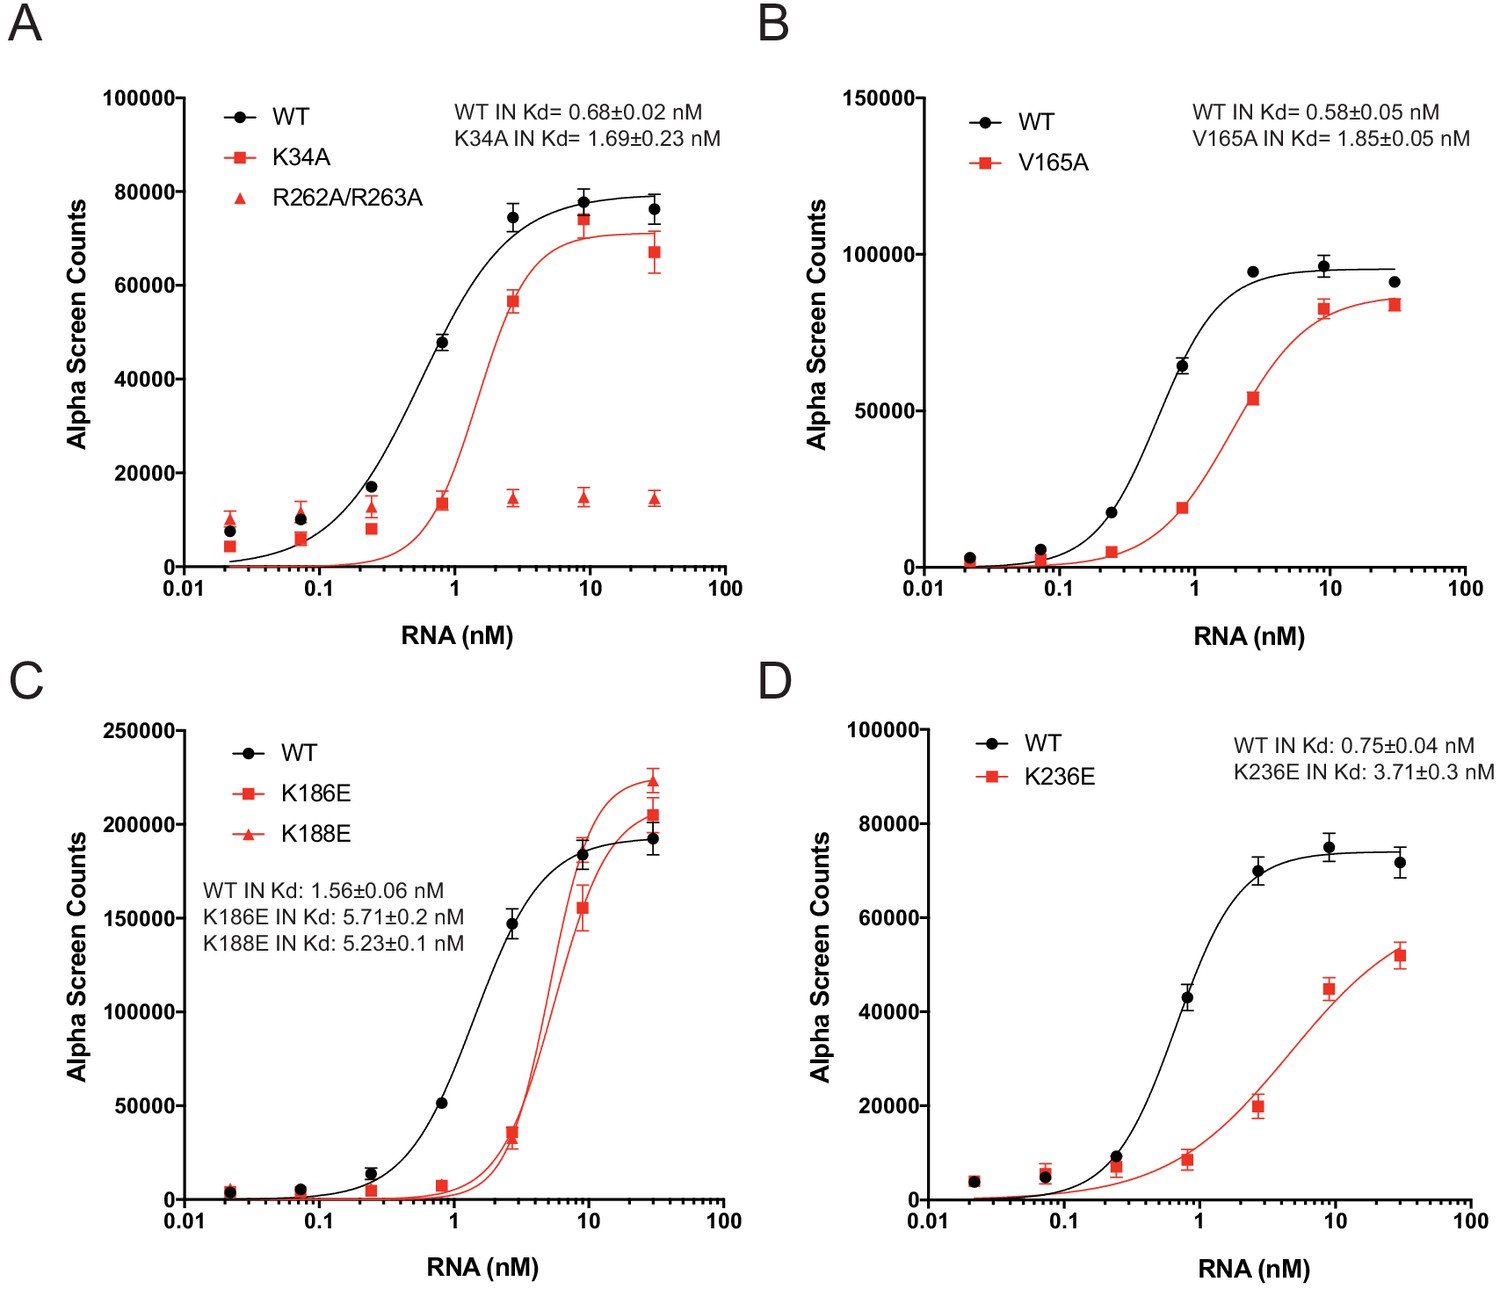
RNA-binding properties of Class II IN mutants in vitro.
(A–D) Analysis of 100 nM WT or mutant INs binding to biotinylated TAR RNA by AlphaScreen assay. Graphed data is the average of three independent experiments and error bars indicate standard deviation.
Figure 6
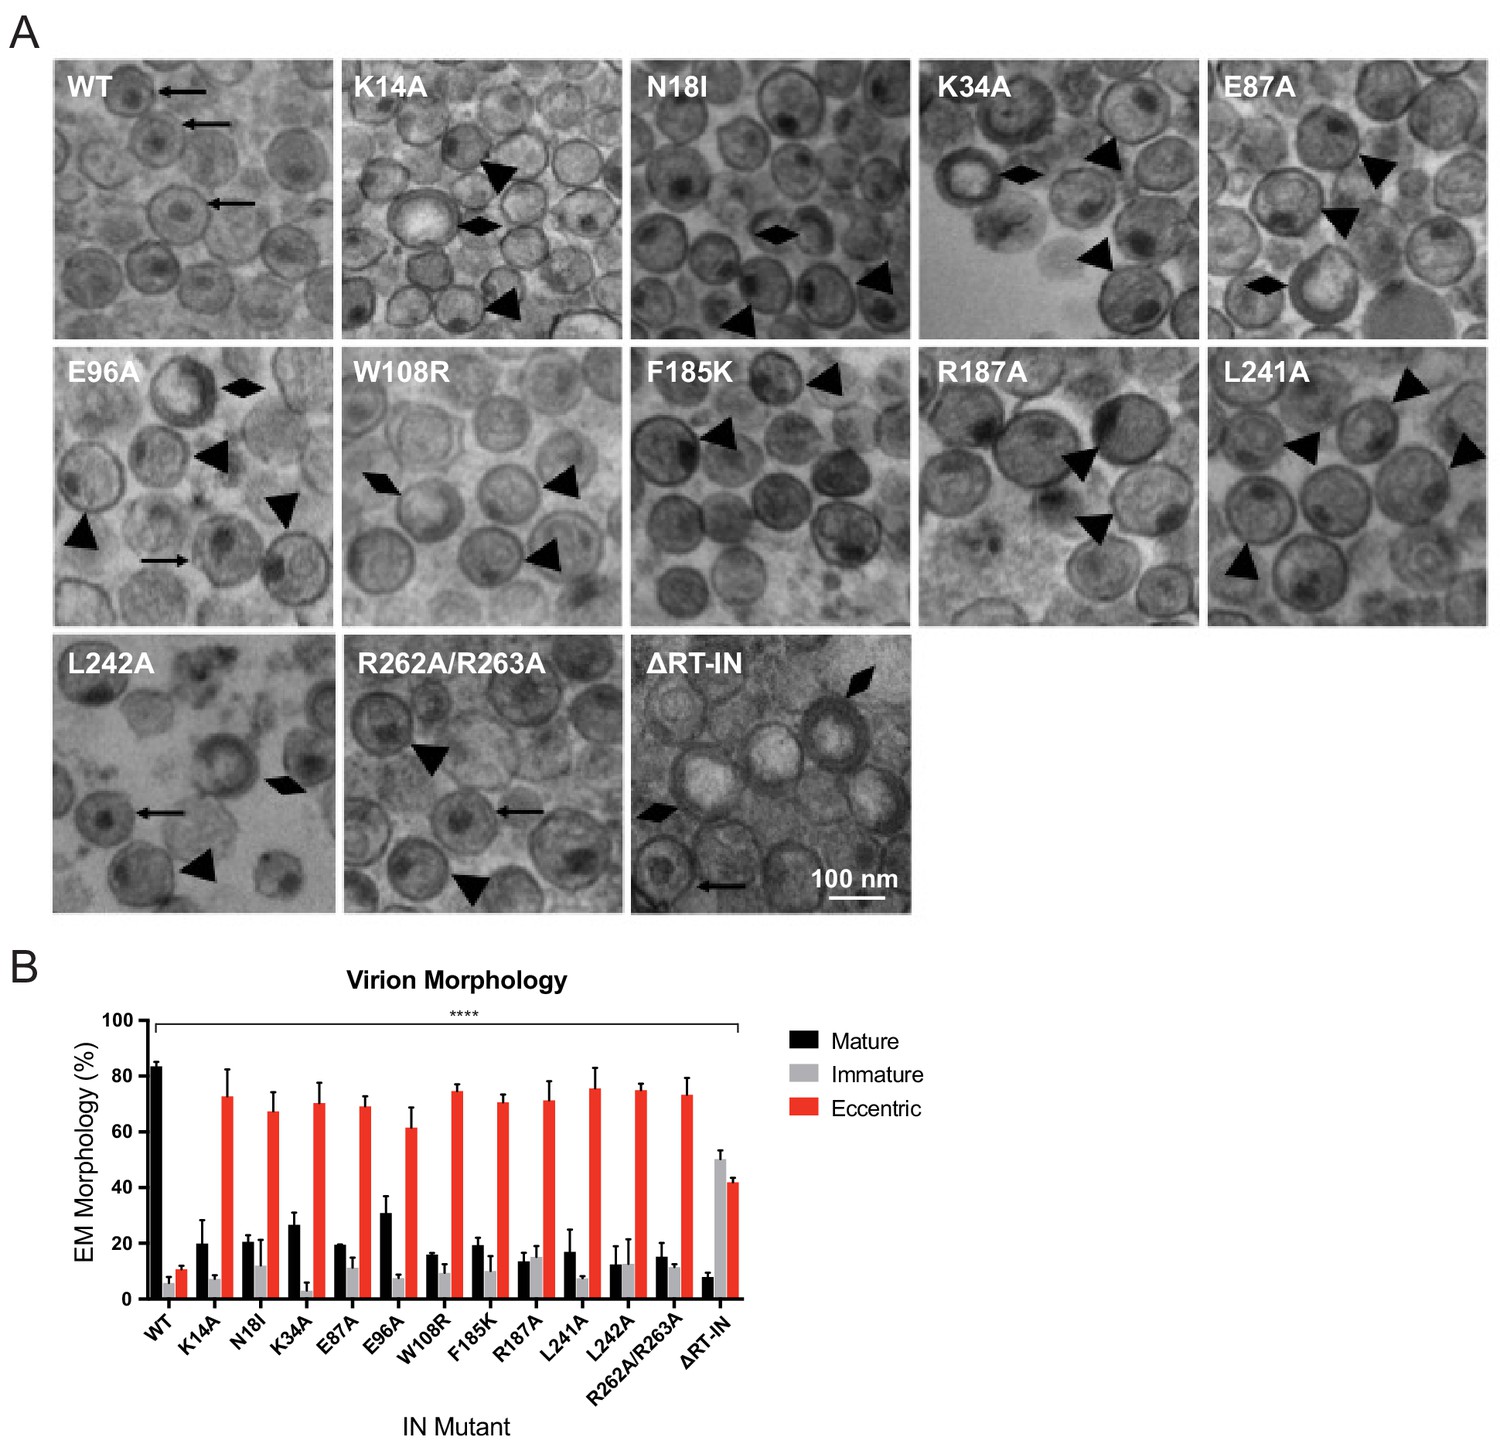
Analysis of class II IN mutant virion morphologies viruses by TEM.
(A) Representative TEM images of WT, K14A, N18I, K34A, E87A, E96A, W108R, F185K, R187A, L241A, L242A, R262A/R263A, and ∆RT-IN HIV-1NL4-3 virions. Magnification is 30,000× (scale bar, 100 nm). Black arrows indicate mature particles containing conical or round cores with associated electron density; triangles indicate eccentric particles with electron-densematerial situated between translucent cores and the viral membrane; diamonds indicate immature particles. (B) Quantification of virion morphologies. Columns show the average of two independent experiments (more than 100 particles counted per experiment) and error bars represent standard deviation (****p<0.0001, by repeated measures one-way ANOVA.).
Figure 7 with 1 supplement
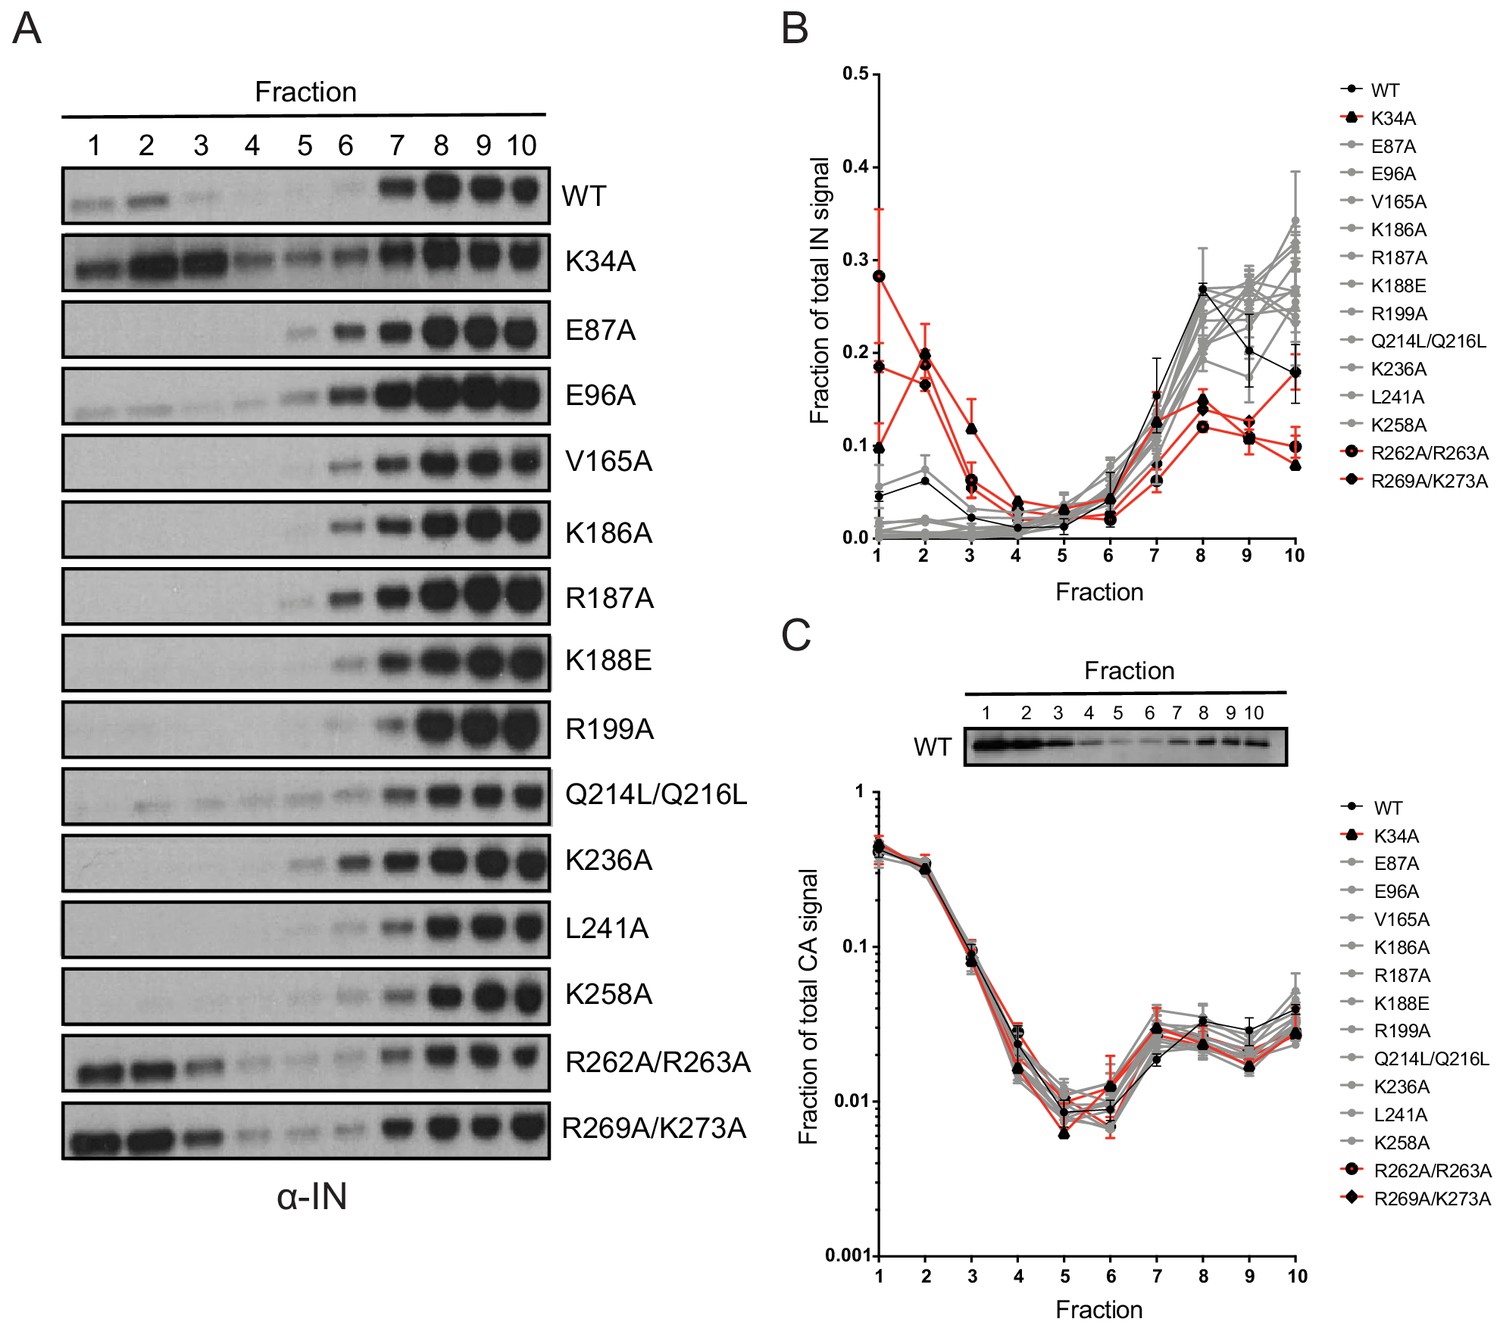
Biochemical analysis of class II IN mutant virus particles.
(A) Immunoblot analysis of sedimentation profiles of IN in WT or IN mutant virions. Purified HIV-1NLGP virions were analyzed by equilibrium density centrifugation as detailed in Materials and Methods. Ten fractions collected from the top of the gradients were analyzed by immunoblotting using antibodies against IN. Representative images from one of four independent experiments are shown. (B) Quantitation of IN signal intensity in immunoblots as in (A) is shown. Profile of WT virions is denoted in black, IN mutants that led to bimodal IN distribution are shown in red and others are shown in gray. Graphed data is the average of two independent experiments and error bars indicate the range. (C) The representative immunoblot analysis of the sedimentation profile of CA in WT virions and quantitation of CA signal intensity in immunoblots are shown. Profile of WT virions is denoted in black, IN mutants that led to bimodal IN distribution are shown in red and others are shown in gray. Graphed data is the average of two independent experiments and error bars indicate the range.
Figure 7—figure supplement 1

Biochemical properties of Class II IN mutants in virions upon CA destabilization and in the absence of NC.
(A) Immunoblot analysis of sedimentation profiles of IN in HIV-1NLGP CAK203A mutant virions. In addition to the CAK203A mutation, class II mutations were introduced in IN. Purified virions were stripped of the viral envelope using 0.5% Triton X-100 and analyzed by equilibrium density centrifugation as detailed in Materials and Methods. Ten fractions collected from the top of the gradients were analyzed by immunoblotting using antibodies against IN or CA. Representative images from one of two independent experiments are shown. (B) Immunoblot analysis of sedimentation profiles of WT versus class II IN mutants from HIV-1NL4-3 bZIP virions. Purified virions were analyzed by equilibrium density centrifugation, 10 fractions were collected from the top of the gradients and subsequently analyzed by immunoblotting using antibodies against IN or CA. Representative images from one of two independent experiments are shown.
Figure 8 with 1 supplement
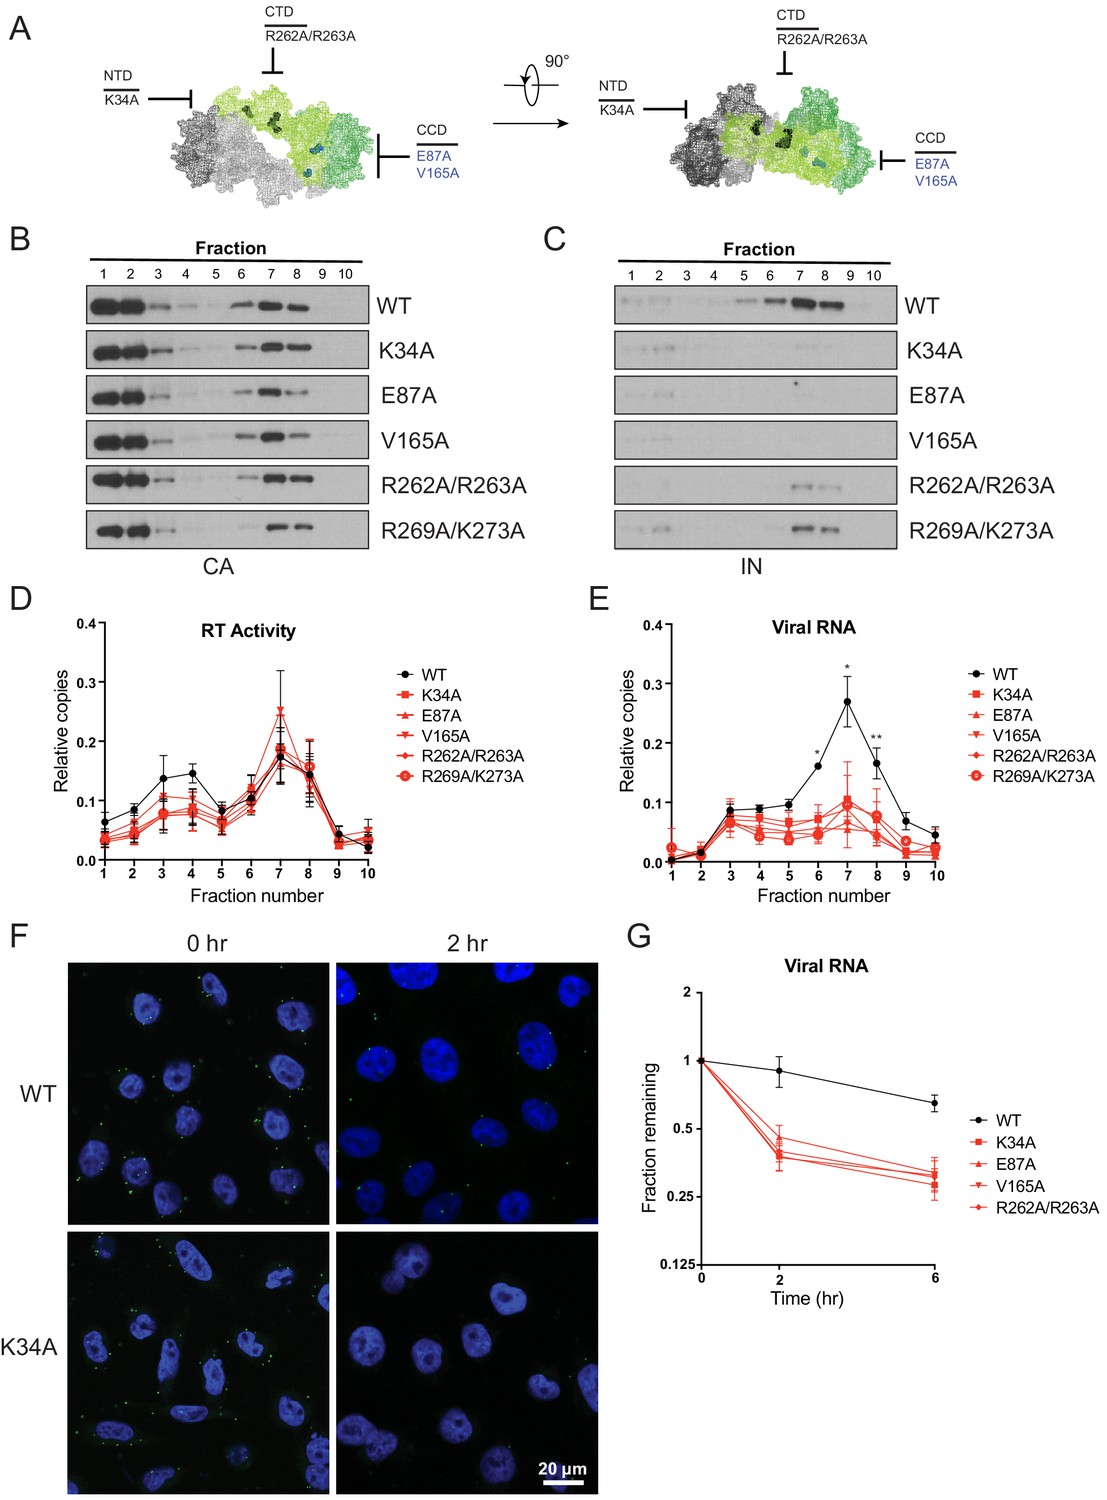
Premature loss of vRNA and IN from class II IN mutant viruses upon infection of target cells.
(A) Locations of the class II IN substitutions K34A, E87A, V165A, and R262A/R263A displayed on a single IN monomer within the context of the HIV-1 IN tetramer intasome structure (PDB 5U1C.) Substitutions are color-coded based on whether they may cause mislocalization of IN in virions (black) or not (blue). (B–E) PgsA-745 cells were infected with WT or IN mutant HIV-1 virions and fates of viral core components were analyzed 2 hpi. Fractions were analyzed for the presence of CA (B) and IN (C) by immunoblotting and for RT activity (D) and vRNA (E) by Q-PCR. Immunoblots are representative of three independent experiments. Graphed data in (D) and (E) is the average of three independent experiments with error bars indicating standard deviation (*p<0.05 and **p<0.01, by repeated measures one-way ANOVA). (F) Representative images of pgsA-745 cells infected with WT or IN mutant HIV-1NL4-3 viruses 0 and 2 hpi. Cells were stained for vRNA (green) and nuclei (blue) as detailed in Materials and Methods. (G) The fraction of viral RNA remaining after 2 and 6 hpi compared to the quantity measured at 0 hpi. MT-4 cells were synchronously infected with VSV-G pseudotyped HIV-1NL4-3 viruses and at each time point samples of infected cultures were taken for analysis. Viral RNA levels in samples were measured by Q-PCR and normalized to the levels of GAPDH mRNA. Data points are the average of five independent experiments with error bars indicating standard error of the mean.
Figure 8—figure supplement 1
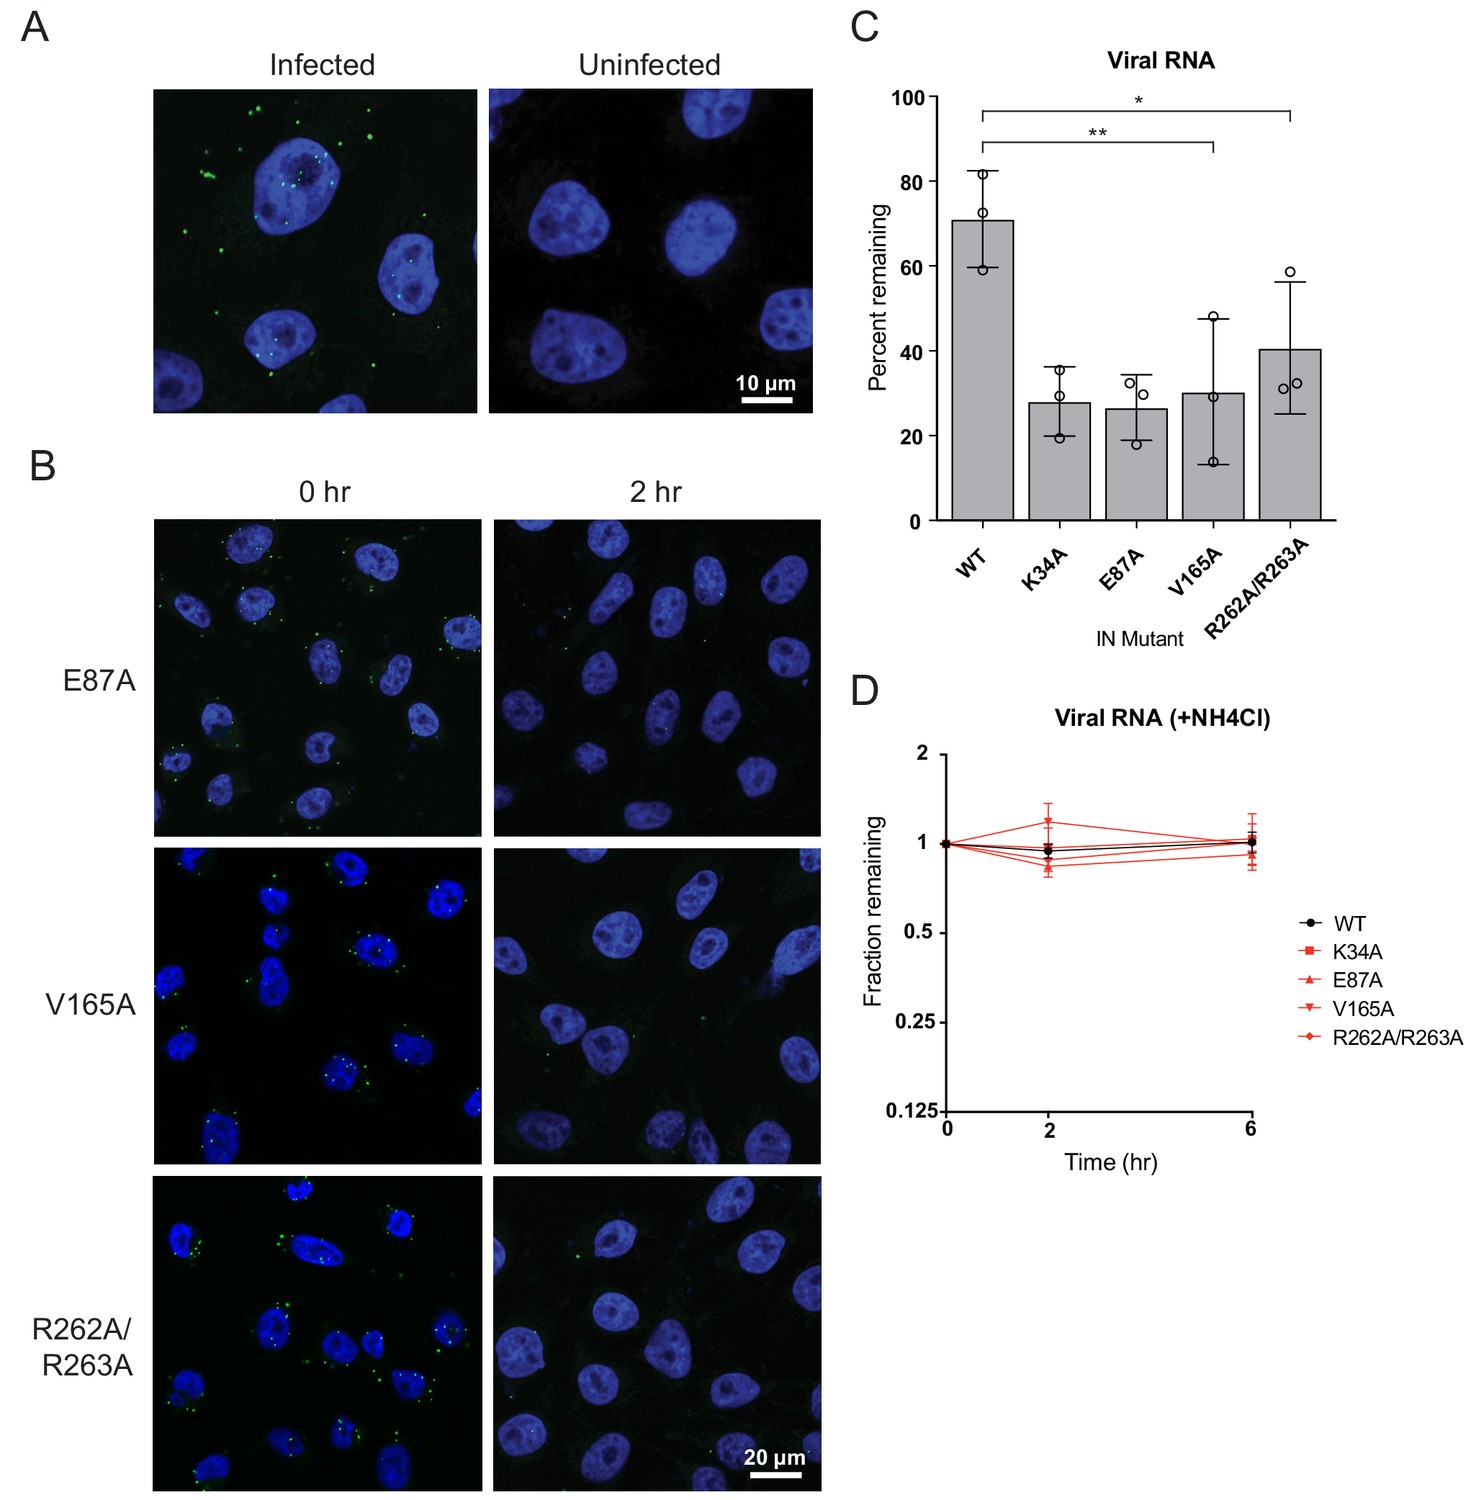
Premature loss of vRNA and IN from class II IN mutant viruses upon infection of target cells.
(A) Representative images of uninfected pgsA-745 cells and cells infected with WT HIV-1NL4-3 viruses at 0 hpi. Cells were fixed and stained for vRNA (green) and nuclei (blue). (B) Representative images of pgsA745 cells infected with IN mutant HIV-1NL4-3 viruses 0 and 2 hpi. Cells were fixed and stained for vRNA (green) and nuclei (blue). (C) Quantification of vRNA remaining in cells infected with WT or IN mutant HIV-1NL4-3 viruses at 2 hpi. Values are the percent of vRNA remaining at 2 hpi compared to at 0 hpi. Columns show average of three independent experiments (open circles) and error bars represent standard deviation (*p<0.05 and **p<0.01, by one-way ANOVA with Dunnett’s multiple comparison test). (D) The fraction of viral RNA remaining after 2 and 6 hpi compared to the quantity measured at 0 hpi. MT-4 cells were synchronously infected with VSV-G pseudotyped HIV-1NL4-3 viruses and incubated in the presence of 50 mM ammonium chloride for 6 hr. At each time point samples of infected cultures were taken for analysis and levels of viral RNA in samples were measured by Q-PCR and normalized to the levels of GAPDH mRNA. Data points are the average of three independent experiments with error bars indicating standard error of the mean.
Figure 9
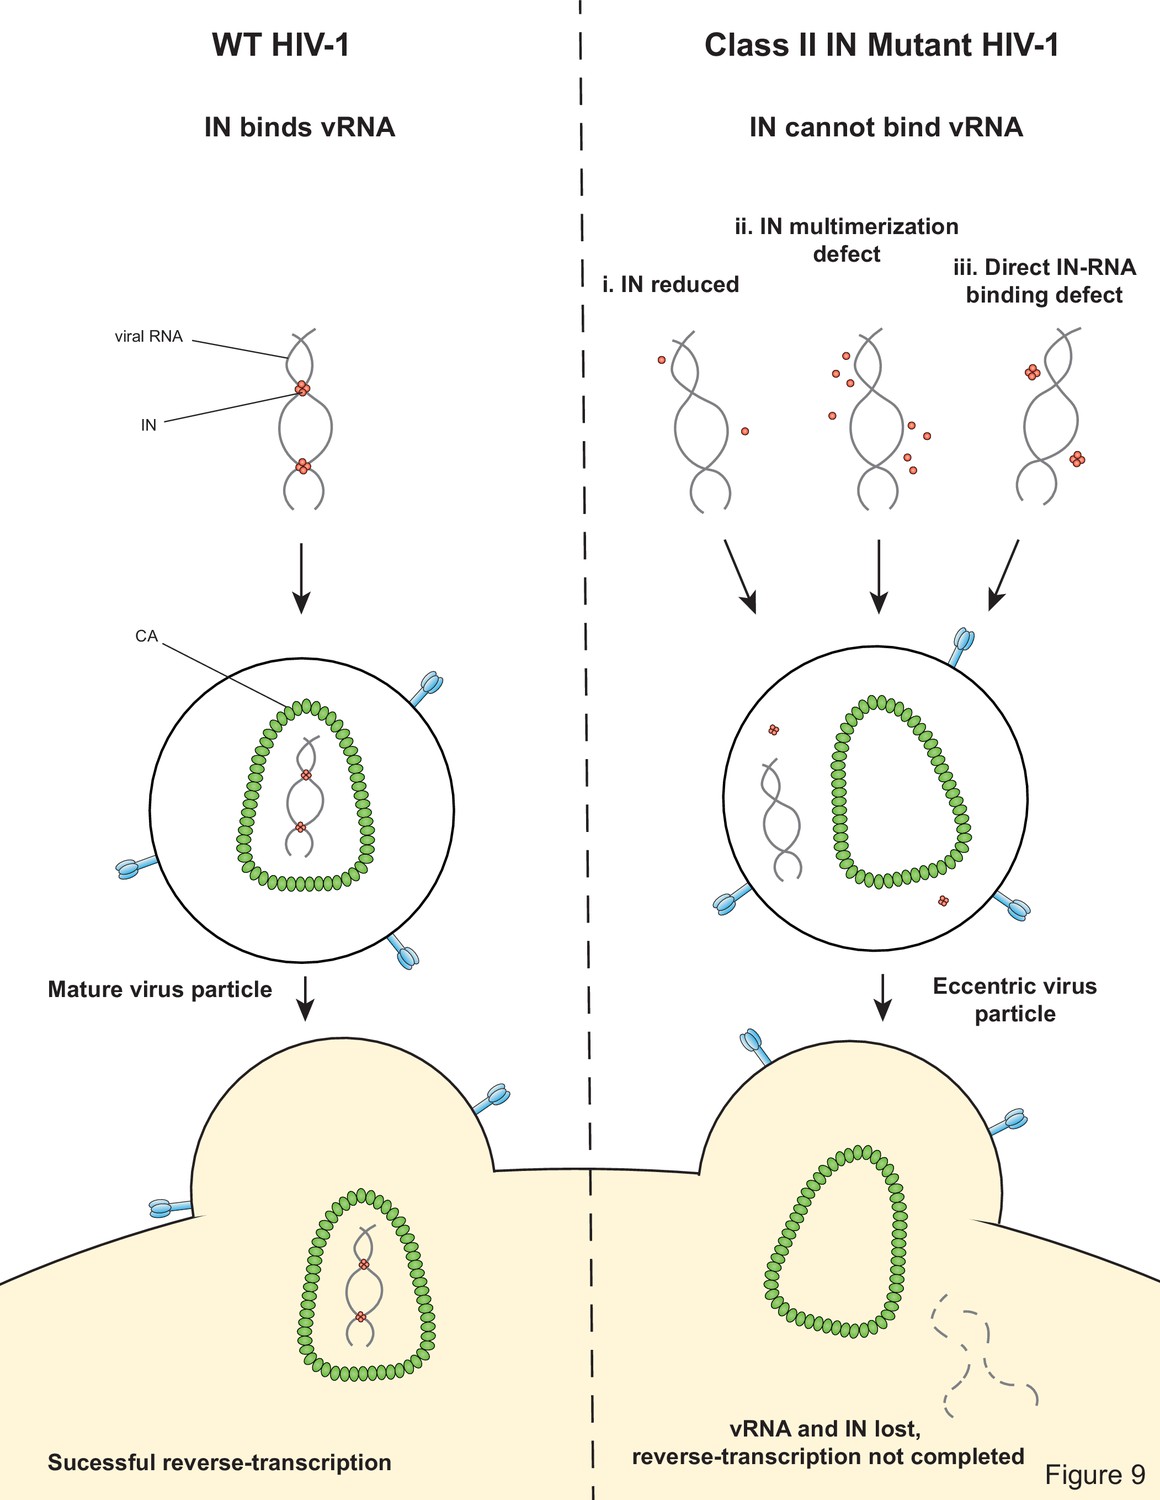
Model depicting how class II IN mutants exert their effects on HIV-1 replication.
Tables
Key resources table
| Reagent type (species) or resource | Designation | Source or reference | Identifiers | Additional information |
|---|---|---|---|---|
| Gene (human immunodeficiency virus type 1) | Integrase (IN) | NCBI (NC_001802.1) | Gene ID: 155348 | |
| Strain, strain background (Escherichia coli) | DH10B | Thermo Fisher Scientific | EC0113 | Competent cells |
| Strain, strain background (Escherichia coli) | BL21 | Thermo Fisher Scientific | C600003 | Competent cells |
| Cell line (Homo sapiens) | HEK293T | ATCC | CRL-11268 | |
| Cell line (Homo sapiens) | TZM-bl | NIH AIDS Reagent Program | 8129 | |
| Cell line (Cricetulus griseus) | pgsA-745 | ATCC | CRL-2242 | Xylosyltransferase I deficient |
| Cell line (Homo sapiens) | MT-4 | NIH AIDS Reagent Program | 120 | |
| Antibody | Anti-HIV-1 integrase-4 (mouse monoclonal) | Bouyac-Bertoia et al., 2001 | WB (1:4000), IP (5 μL/100 μL of Dyna beads) | |
| Antibody | Anti-HIV-1 integrase-1 (rabbit polyclonal) | This paper | WB (1:1000) | |
| Antibody | Anti-HIV-1 p24 antibody (mouse monoclonal) | NIH AIDS Reagent Program | 183-H12-5C | WB (1:100) |
| Antibody | Anti-HIV-1 reverse transcriptase antibody (rabbit polyclonal) | NIH AIDS Reagent Program | 6195 | WB (1:1000) |
| Antibody | Anti-HIV-1 Vpr antibody (rabbit polyclonal) | NIH AIDS Reagent Program | 11836 | WB (1:1000) |
| Antibody | Anti-HIV-1 MA antibody (rabbit polyclonal) | NIH AIDS Reagent Program | 4811 | WB (1:1000) |
| Commercial assay, kit | QuikChange Site-Directed Mutagenesis Kit | Agilent Technologies | Cat# 200519 | |
| Commercial assay, kit | DNeasy Blood and Tissue kit | Qiagen | Cat# 69506 | |
| Commercial assay, kit | RNAScope F luorescent Multiplex Detection Reagents | Advanced Cell Diagnostics | Ref# 320851 | |
| Chemical compound, drug | Nevirapine | NIH AIDS Reagents | ||
| Chemical compound, drug | Ethylene glycol bis(succinimidyl succinate) (EGS) | Thermo Fisher Scientific |
Additional files
-
Supplementary file 1
Quantitation of IN in virions as measured by western blotting.
- https://cdn.elifesciences.org/articles/54311/elife-54311-supp1-v2.docx
-
Supplementary file 2
Predominant multimeric species of mutant INs in vitro as assessed by SEC.
- https://cdn.elifesciences.org/articles/54311/elife-54311-supp2-v2.docx
-
Transparent reporting form
- https://cdn.elifesciences.org/articles/54311/elife-54311-transrepform-v2.docx
Download links
A two-part list of links to download the article, or parts of the article, in various formats.
Downloads (link to download the article as PDF)
Open citations (links to open the citations from this article in various online reference manager services)
Cite this article (links to download the citations from this article in formats compatible with various reference manager tools)
Integrase-RNA interactions underscore the critical role of integrase in HIV-1 virion morphogenesis
eLife 9:e54311.
https://doi.org/10.7554/eLife.54311


