Site-directed MT1-MMP trafficking and surface insertion regulate AChR clustering and remodeling at developing NMJs
- School of Biomedical Sciences, Li Ka Shing Faculty of Medicine, The University of Hong Kong, China
- School of Biological Sciences, Faculty of Science, The University of Hong Kong, China
Figures
Figure 1 with 2 supplements
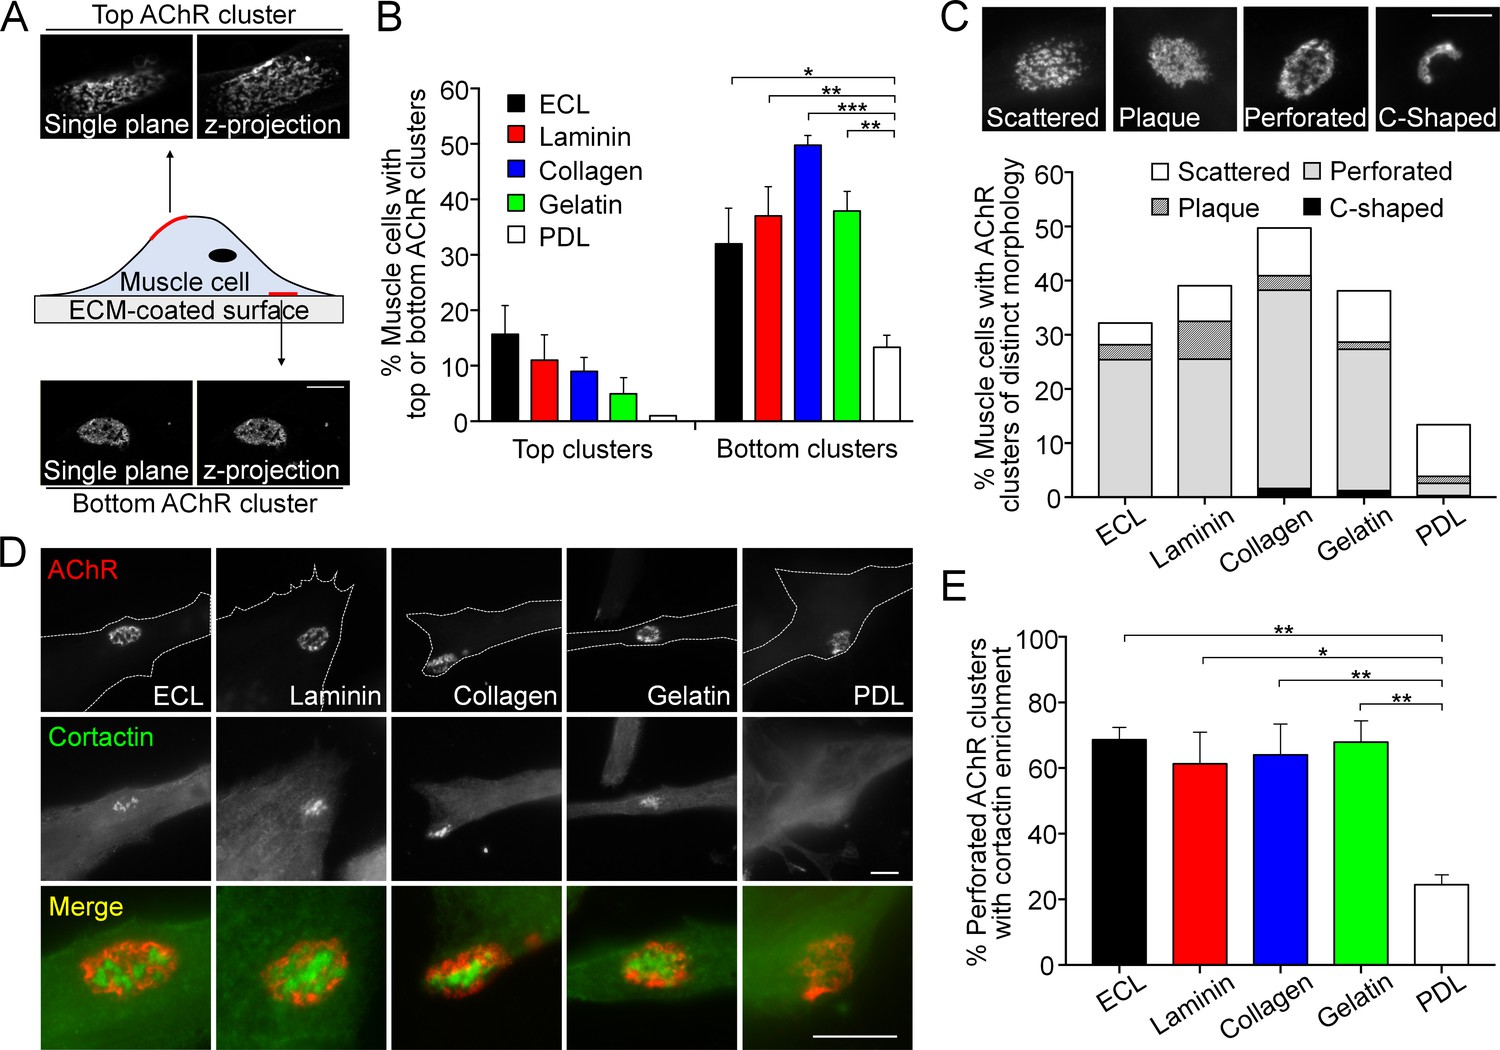
Topologically complex structures of PLS-associated aneural AChR clusters can be induced by different ECM proteins.
(A) A schematic diagram illustrating the location and morphological features of aneural AChR clusters found in the top versus bottom surface of cultured Xenopus muscle cells. Maximal projection of confocal z-stack images was constructed from 11 frames with 3 µm z-interval. (B) Quantification on the presence of top versus bottom aneural AChR clusters in muscle cells cultured on substratum coated with different ECM proteins or PDL. n = 300 cells in each condition from 3 independent experiments. (C) Representative images showing several distinct morphological features of aneural AChR clusters (scattered, plaque, perforated, and C-shaped), and the quantification showing the population of aneural AChR clusters with respective morphological features in muscle cells cultured on different ECM substrates or PDL. n = 150 cells in each condition from 3 independent experiments. (D) Representative images showing cortactin immunostaining of 2-d old Xenopus muscle cells to indicate the presence of PLSs at the perforated regions of aneural AChR clusters. (E) Quantification on the percentage of aneural AChR clusters associated with cortactin enrichment in muscle cells cultured on substratum coated with different ECM proteins or PDL. n = 150 cells in each condition from 3 independent experiments. Scale bars represent 10 μm. Data are represented as mean ± SEM. One-way ANOVA with Dunnett’s multiple comparisons test, *, **, *** represent p≤0.05, 0.01, and 0.001 respectively.
Figure 1—figure supplement 1
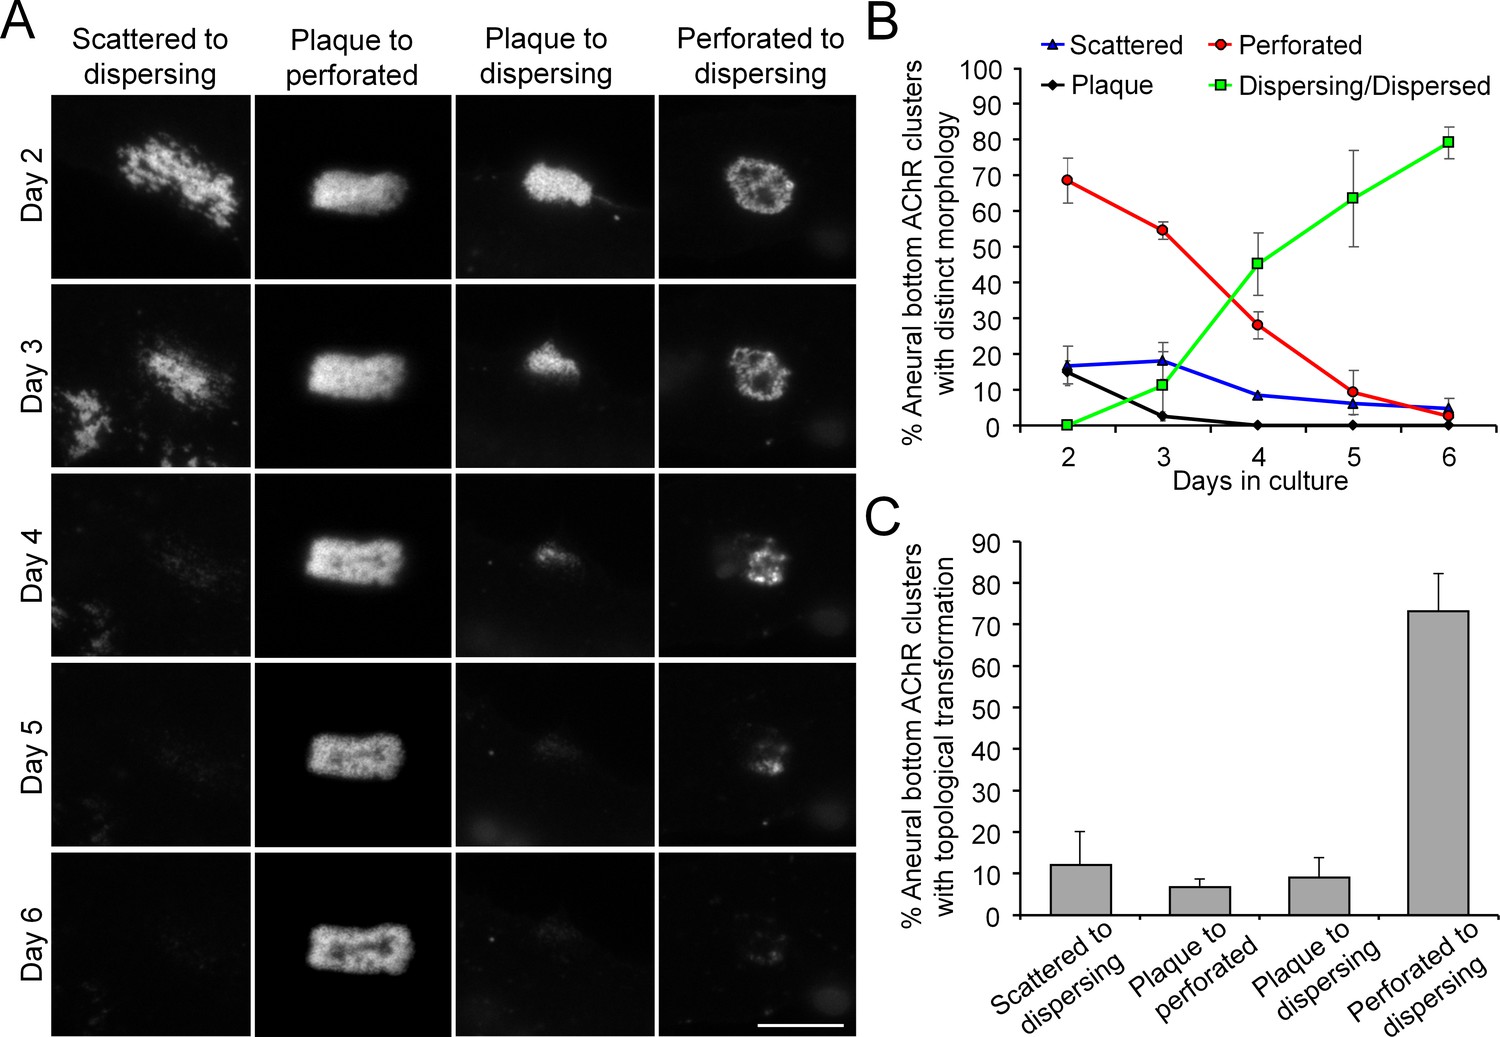
Most aneural AChR clusters are gradually dispersed in cultured Xenopus muscle cells over time.
(A) Representative images showing the gradual topological changes of aneural AChR clusters observed in cultured Xenopus muscle cells from day 2 to 6 in culture. (B) Quantification on the percentage of aneural AChR clusters with different topological features over 6 days in culture. Aneural AChR clusters were first located on day 2, and the same clusters were followed for 4 consecutive days to observe their topological changes. n = 73 muscle cells from 3 independent experiments. (C) Quantification on different types of topological transformation of aneural AChR clusters observed in the same group of muscle cells in B. Scale bar represents 10 μm. Data are represented as mean ± SEM.
Figure 1—figure supplement 2
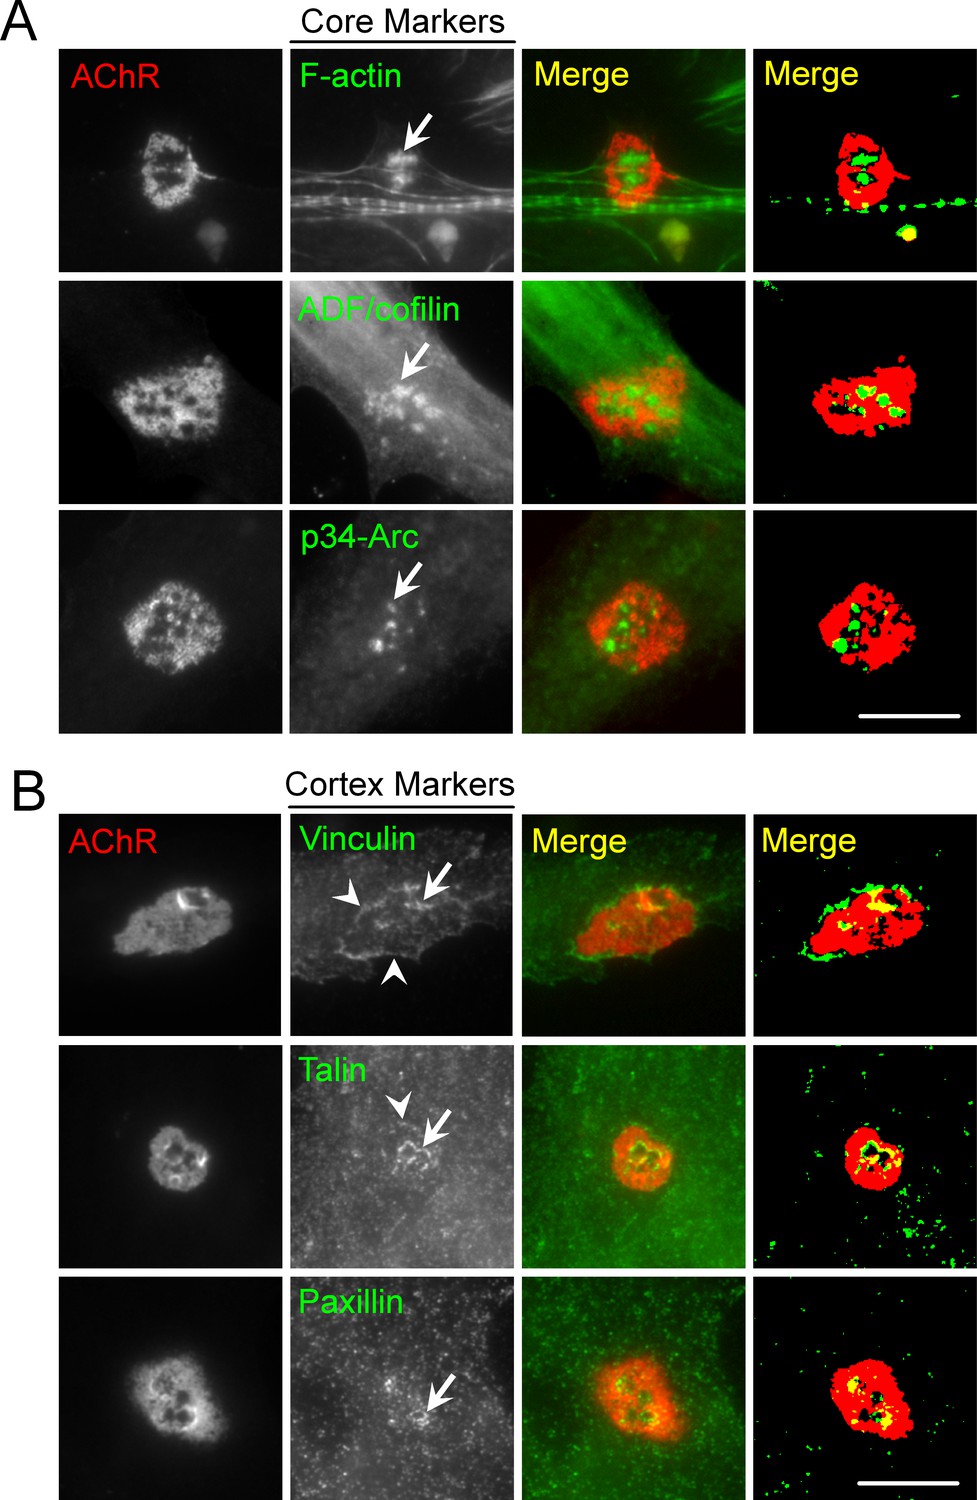
PLS core and cortex markers are present at ECM-induced AChR clusters in Xenopus primary muscle cultures.
(A) Representative images showing the localization of PLS core makers, including F-actin, ADF/cofilin, and p34-Arc, at the center of perforations (arrows) within aneural AChR clusters in muscle cells cultured on ECL-coated substrate. (B) Representative images showing the localization of PLS cortex makers, including vinculin, talin, and paxillin at the edge of perforations (arrows) or the periphery (arrowheads) of aneural AChR clusters. Scale bar represents 10 μm.
Figure 2
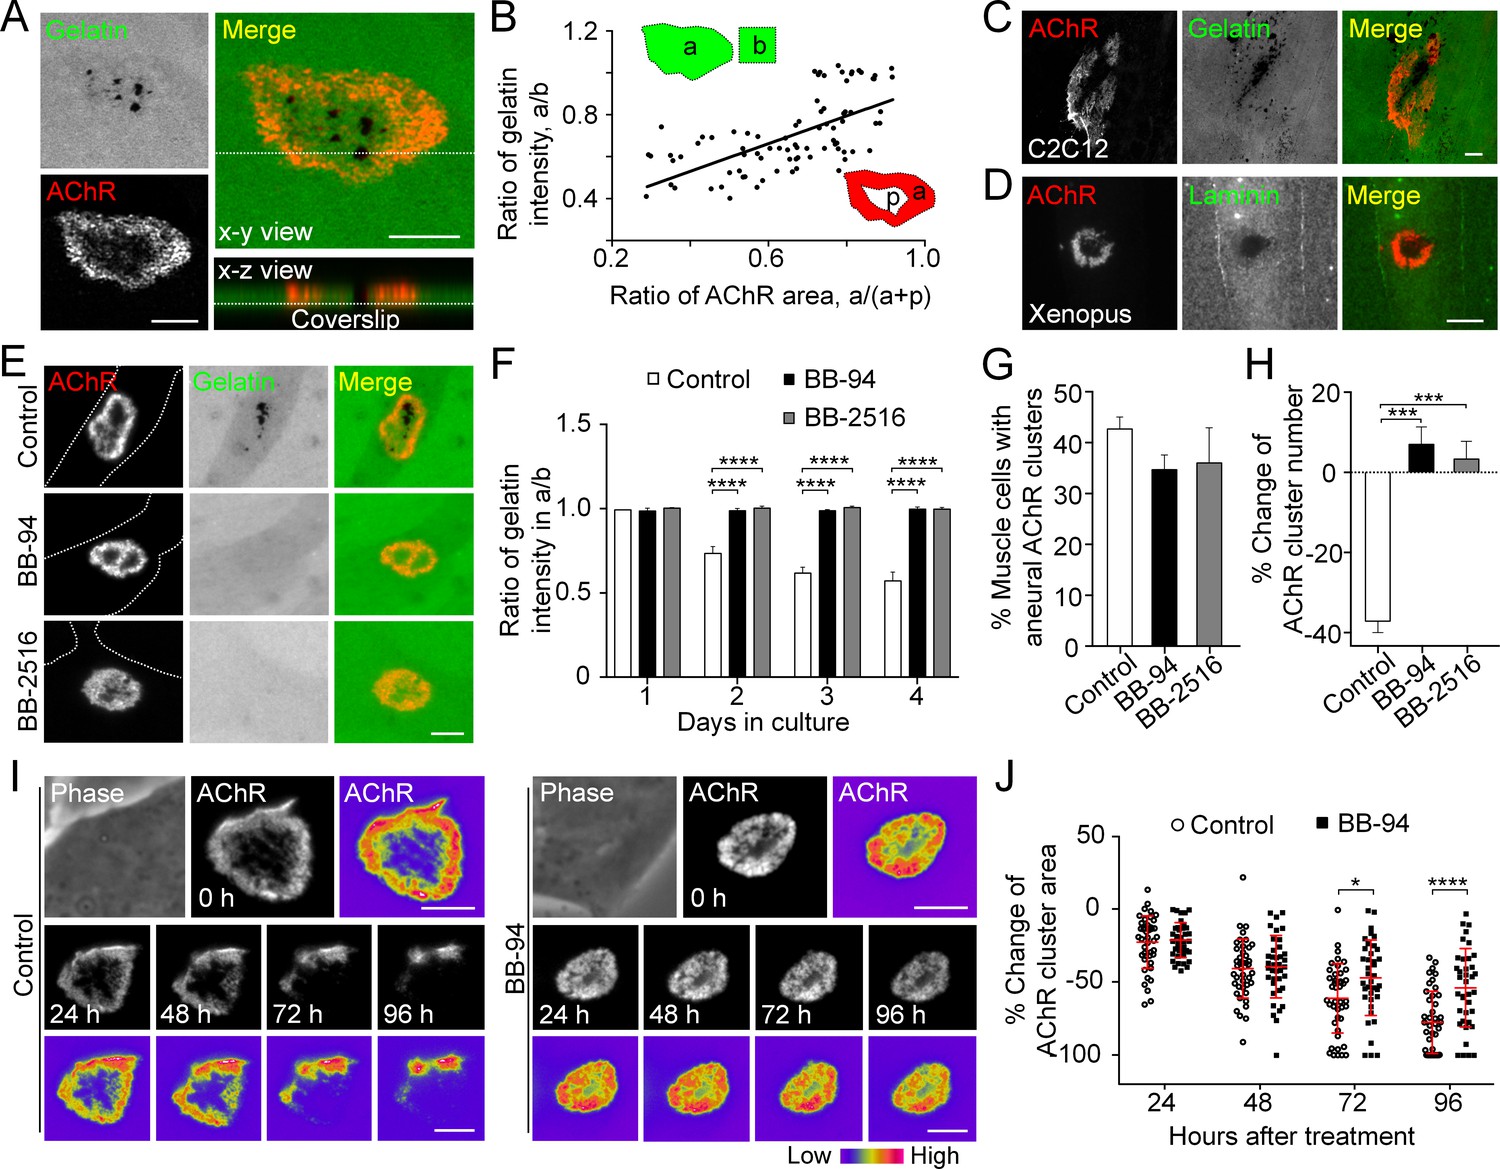
MMP-mediated ECM degradation regulates topological remodeling of aneural AChR clusters.
(A) Representative confocal z-stack images showing the discrete and extensive degradation of fluorescent gelatin at the perforated regions within aneural AChR clusters. (B) Scatter plot analysis showing a positive correlation between the fluorescent gelatin intensity in perforated AChR clusters (a) divided by that in another region of the same cell (b) and the area of AChR-rich region (a) divided by that of the entire AChR clusters with perforations (a+p). R = 0.6458, p<0.0001. n = 84 from 3 independent experiments. (C–D) Representative images showing the degradation patterns of fluorescent gelatin (C) and laminin immunostaining (D) at AChR clusters in cultured C2C12 myotubes and Xenopus primary muscle cells, respectively. (E) Representative images showing the inhibitory effects of BB-94 or BB-2516 on fluorescent gelatin degradation. Dotted lines indicate the periphery of muscle cells. (F) Quantification on the extent of fluorescent gelatin degradation at the perforated regions of AChR clusters in control and BB-94/BB-2516-treated muscle cells over the first 4 consecutive days in culture. n > 280 muscle cells in each condition from 3 independent experiments. (G) Quantification on the effects of BB-94 or BB-2516 on the formation of bottom AChR clusters in cultured Xenopus muscle cells. n = 150 muscle cells in each condition from 3 independent experiments. (H) Quantification on the effects of BB-94 or BB-2516 on the stability of bottom AChR clusters in cultured Xenopus muscle cells. n = 166 (Control), 154 (BB-94), and 137 (BB-2516) muscle cells from 3 independent experiments. (I) Representative sets of time-lapse images showing the topological changes and fluorescence intensity of AChR clusters in control (left panels) and BB-94-treated (right panels) muscle cells. 8-bit pseudo-color images highlight the difference in AChR intensity at the same aneural clusters over 96 hr with or without BB-94 treatment. (J) An individual value plot showing the percentage change in the area of each aneural AChR clusters at different time-points between control and BB-94-treated cells. n = 43 (Control) and 38 (BB-94) muscle cells from 3 independent experiments. Data are represented as mean ± SD. Scale bars represent 5 μm. Data are represented as mean ± SEM, unless otherwise specified. Two-way ANOVA with Dunnett’s multiple comparisons test (F), one-way ANOVA with Dunnett’s multiple comparisons test (G and H), two-way ANOVA with Sidak’s multiple comparisons test (J), *, ***, **** represent p≤0.05, 0.001, and 0.0001 respectively.
Figure 3

MT1-MMP activity precisely controls the extent of ECM degradation and AChR cluster formation.
(A) Representative images showing the spatial localization of endogenous MT1-MMP in perforations of aneural AChR clusters (arrows) in fixed Xenopus muscle cultures. (B) Representative images showing the extent of fluorescent gelatin degradation in area covered by MT1-MMP-mCherry-overexpressing (MT1-mCherry) muscle cells in the presence or absence of MMP inhibitors BB-94 or BB-2516. 8-bit pseudo-color images highlight the relative fluorescence intensity of AChR clusters in different conditions. (C) Quantification on the effects of MT1-MMP-mCherry overexpression on the formation of AChR top and bottom clusters in response to BB-94 or BB-2516 treatment. n = 163 (Control), 123 (MT1-mCherry), 119 (MT1-mCherry + BB-94), and 62 (MT1-mCherry + BB-2516) muscle cells from 4 independent experiments. (D) Quantification on the effects of MT1-MMP-mCherry overexpression on the extent of fluorescent gelatin degradation and the intensity of aneural AChR clusters in response to BB-94 or BB-2516 treatment. For gelatin intensity measurement: n = 30 (Control), 39 (MT1-mCherry), 33 (MT1-mCherry + BB-94), and 31 (MT1-mCherry + BB-2516) muscle cells from 3 independent experiments. For AChR intensity measurement: n = 14 (Control), 19 (MT1-mCherry), 21 (MT1-mCherry + BB-94), and 16 (MT1-mCherry + BB-2516) muscle cells from 3 independent experiments. Scale bars represent 10 μm. Data are represented as mean ± SEM. One-way ANOVA with Dunnett’s multiple comparisons test (C), one-way ANOVA with Turkey’s multiple comparisons test (D), *, **, **** represent p≤0.05, 0.01, and 0.0001 respectively.
Figure 4 with 4 supplements
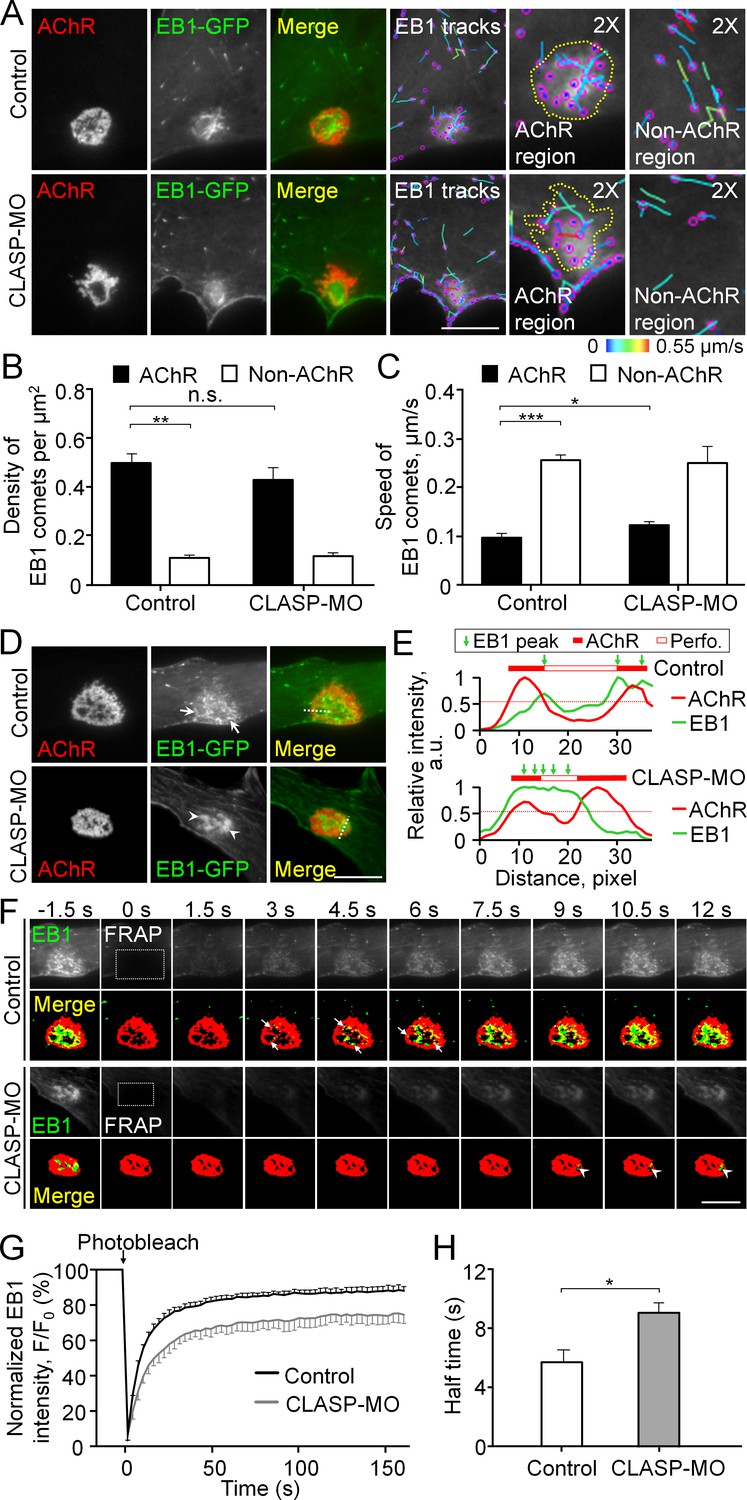
Cortical microtubule capturing is mediated by EB1-/CLASP-dependent mechanisms at perforated AChR clusters.
(A) Representative TIRF images showing the density and speed of EB1-GFP comets in AChR cluster versus and non-AChR regions between control and CLASP-MO muscle cells. The trajectories of EB1-GFP comets (purple dots) were constructed from 7 frames in 18 s, and then color-coded to reflect their speed. Yellow dotted lines indicate the location of AChR clusters. (B–C) Quantitative analyses showing the density (B) and speed (C) of EB1-GFP comets in AChR cluster and non-AChR regions between control and CLASP-MO muscle cells. n = 16 (Control), and 13 (CLASP-MO) cells from 3 independent experiments. (D) Representative TIRF images showing the differential perimembrane localization of EB1-GFP signals at aneural AChR clusters in control and CLASP-MO muscle cells. Arrows and arrowheads indicate the spatial enrichment of EB1-GFP signals at AChR clusters. (E) Line profiles showing the relative fluorescence intensities of AChR (red) and EB1-GFP (green) signals along the dotted lines indicated in merge image in panel D. The perforated region was defined by a cutoff intensity (55%) of the maximum, and the EB1 peaks were marked based on the line profiles. (F) Representative sets of time-lapse images showing the fluorescence recovery of EB1-GFP signals after photobleaching the region of aneural AChR clusters (dotted rectangle) in control and CLASP-MO muscle cells. Arrows and arrowheads indicate the spatial recovery of EB1-GFP signals in control and CLASP-MO muscle cells, respectively. (G–H) Quantification showing the FRAP curves (G) and the calculated recovery half time (H) of EB1-GFP signals in control versus CLASP-MO muscle cells. n = 18 (Control) and 14 (CLASP-MO) cells from 4 independent experiments. Scale bars represent 10 μm. Data are represented as mean ± SEM. Student’s t-test, *, **, *** represent p≤0.05, 0.01, and 0.001 respectively. n.s.: non-significant.
Figure 4—figure supplement 1
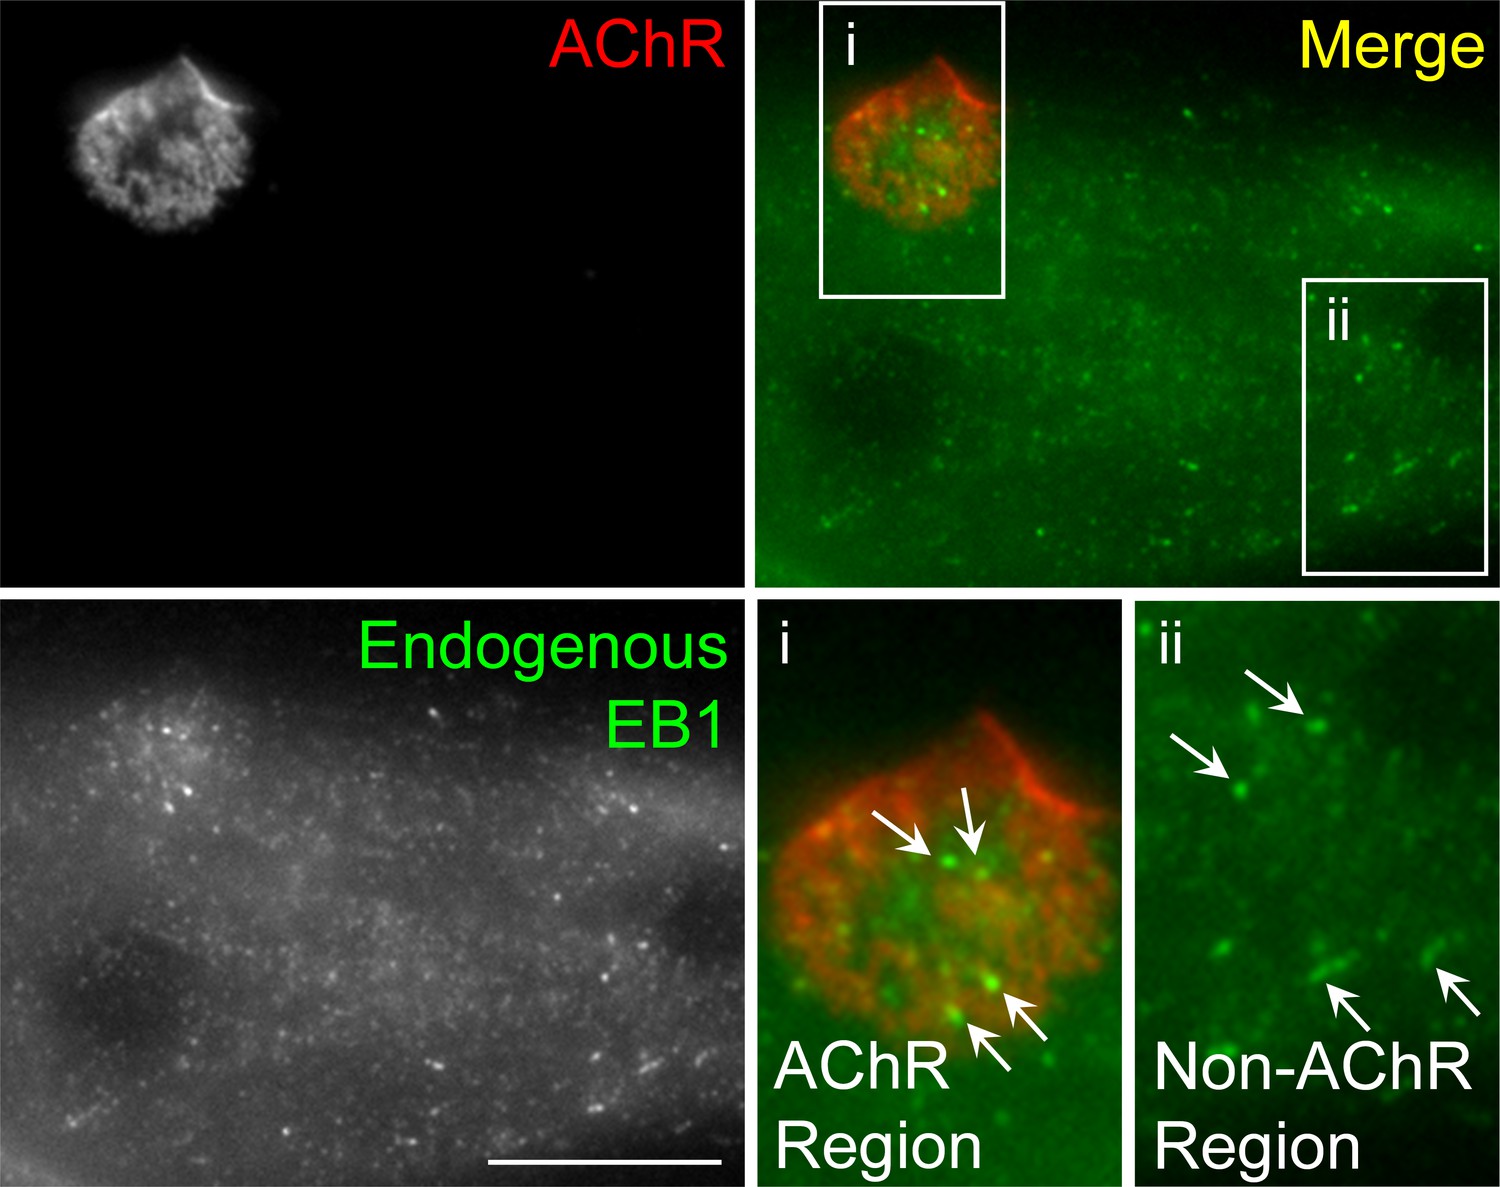
Immunostaining demonstrates the localization of endogenous EB1 in cultured Xenopus muscle cells.
Representative images showing the localization patterns of endogenous EB1 proteins in fixed muscle cells. For clarity, two regions (AChR and non-AChR) were shown in the 2X magnified views. Similar to the localization of EB1-GFP, endogenous EB1 comets (arrows) were highly enriched in the perforated sites in AChR cluster region. Scale bar represents 10 μm.
Figure 4—figure supplement 2
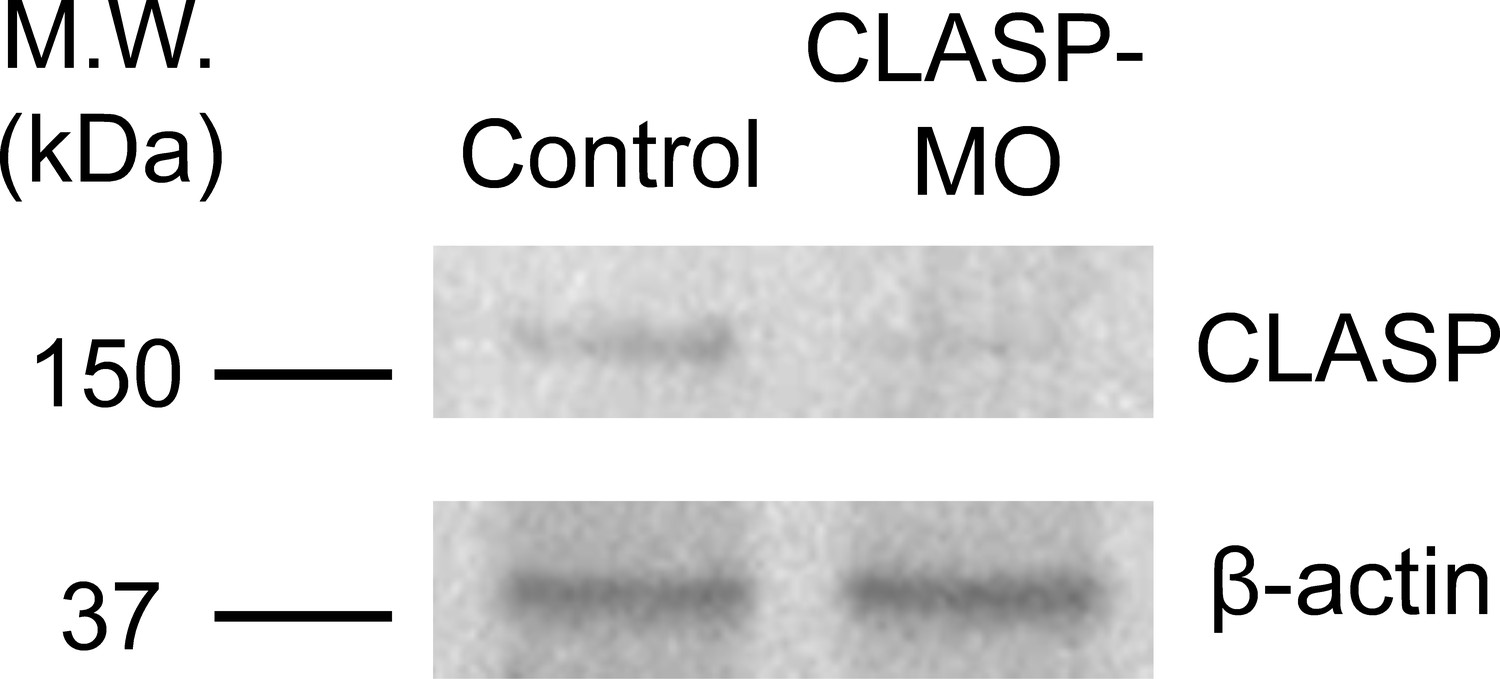
Endogenous CLASP protein level is effectively reduced by specific antisense morpholino oligonucleotides.
Western blot analysis showing the reduced endogenous CLASP protein level in Xenopus embryos injected with CLASP-MO. β-actin was used as a loading control.
Figure 4—video 1
Time-lapse video showing the FRAP signals of EB1-GFP at the perforated aneural AChR clusters in a control muscle cell.
Figure 4—video 2
Time-lapse video showing the FRAP signals of EB1-GFP at the perforated aneural AChR clusters in a CLASP-MO muscle cell.
Figure 5 with 1 supplement
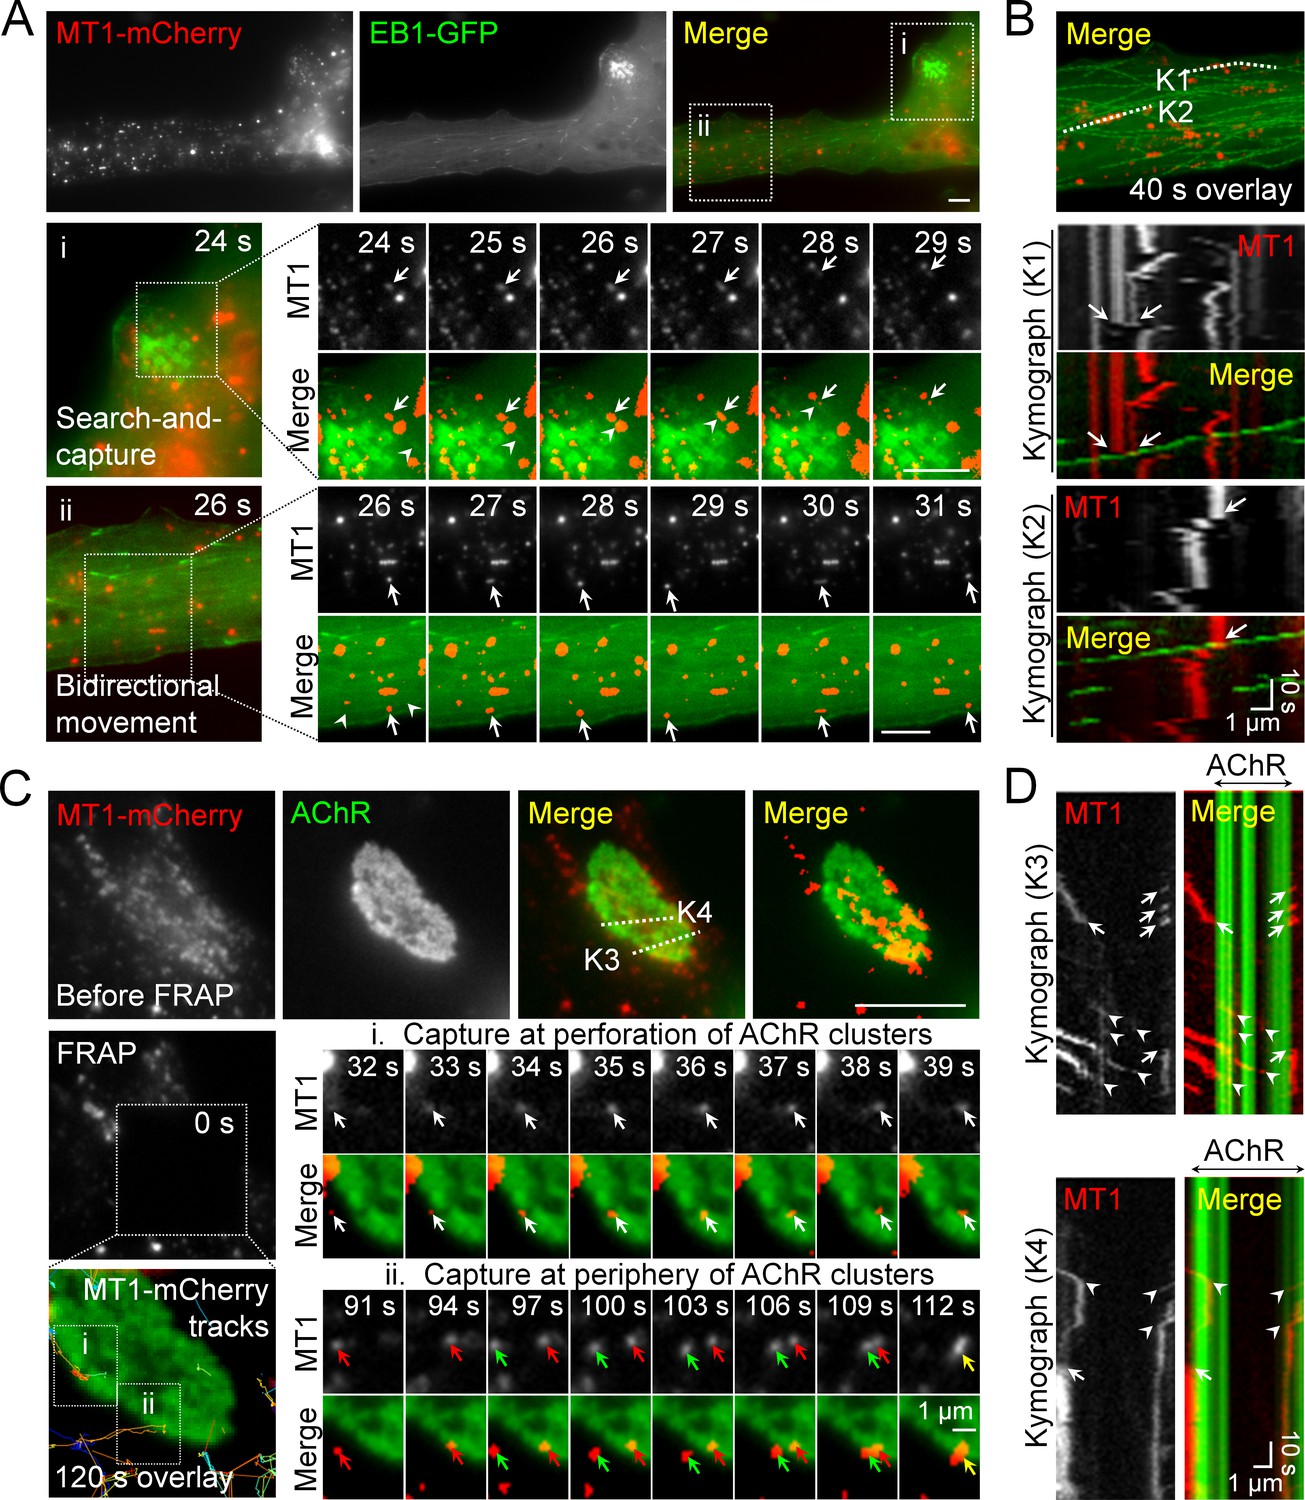
Intracellular trafficking of MT1-MMP is directed to PLS-associated AChR clusters.
(A) Representative images showing the intracellular trafficking of MT1-MMP vesicles in a cultured muscle cell expressing both MT1-MMP-mCherry (MT1-mCherry) and EB1-GFP. The time-lapse series of two regions (i and ii) outlined in the merge image showed (i) the search-and-capture of MT1-mCherry vesicles (arrows) by an EB1-GFP comet (arrowheads); and (ii) the bidirectional movement of MT1-mCherry vesicles (arrows) along the microtubules (arrowheads). (B) Kymographs showing the spatiotemporal correlation between MT1-mCherry and EB1-GFP signals along K1 and K2 lines indicated in the merge image. The maximal projection of MT1-mCherry and EB1-GFP signals was constructed from 40 frames in a 40 s time-lapse series. Arrows indicate the examples of lateral displacement of initially stationary MT1-mCherry vesicles after EB1-GFP comets had passed through. (C) Representative TIRF-FRAP images showing the local capturing of MT1-mCherry vesicles at AChR clusters. After photobleaching, the recovery of MT1-mCherry signals and their trajectories in two regions of interest indicate (i) MT1-mCherry vesicles (arrows) were transported to and captured at the perforation of AChR clusters; and (ii) two groups of MT1-mCherry vesicles (red and green arrows) were transported to and captured at the same site of AChR cluster periphery over a period of 120 s. (D) Kymographs showing the spatiotemporal capture of MT1-mCherry vesicles at AChR clusters. Two kymographs were constructed from 120 time-lapse images along K3 and K4 lines, as indicated in the merge image (top panels in C). Arrowheads and arrows indicate the sites of MT1-mCherry capture at the perforated and peripheral regions of AChR clusters, respectively. Scale bars represent 10 μm, unless stated otherwise.
Figure 5—figure supplement 1
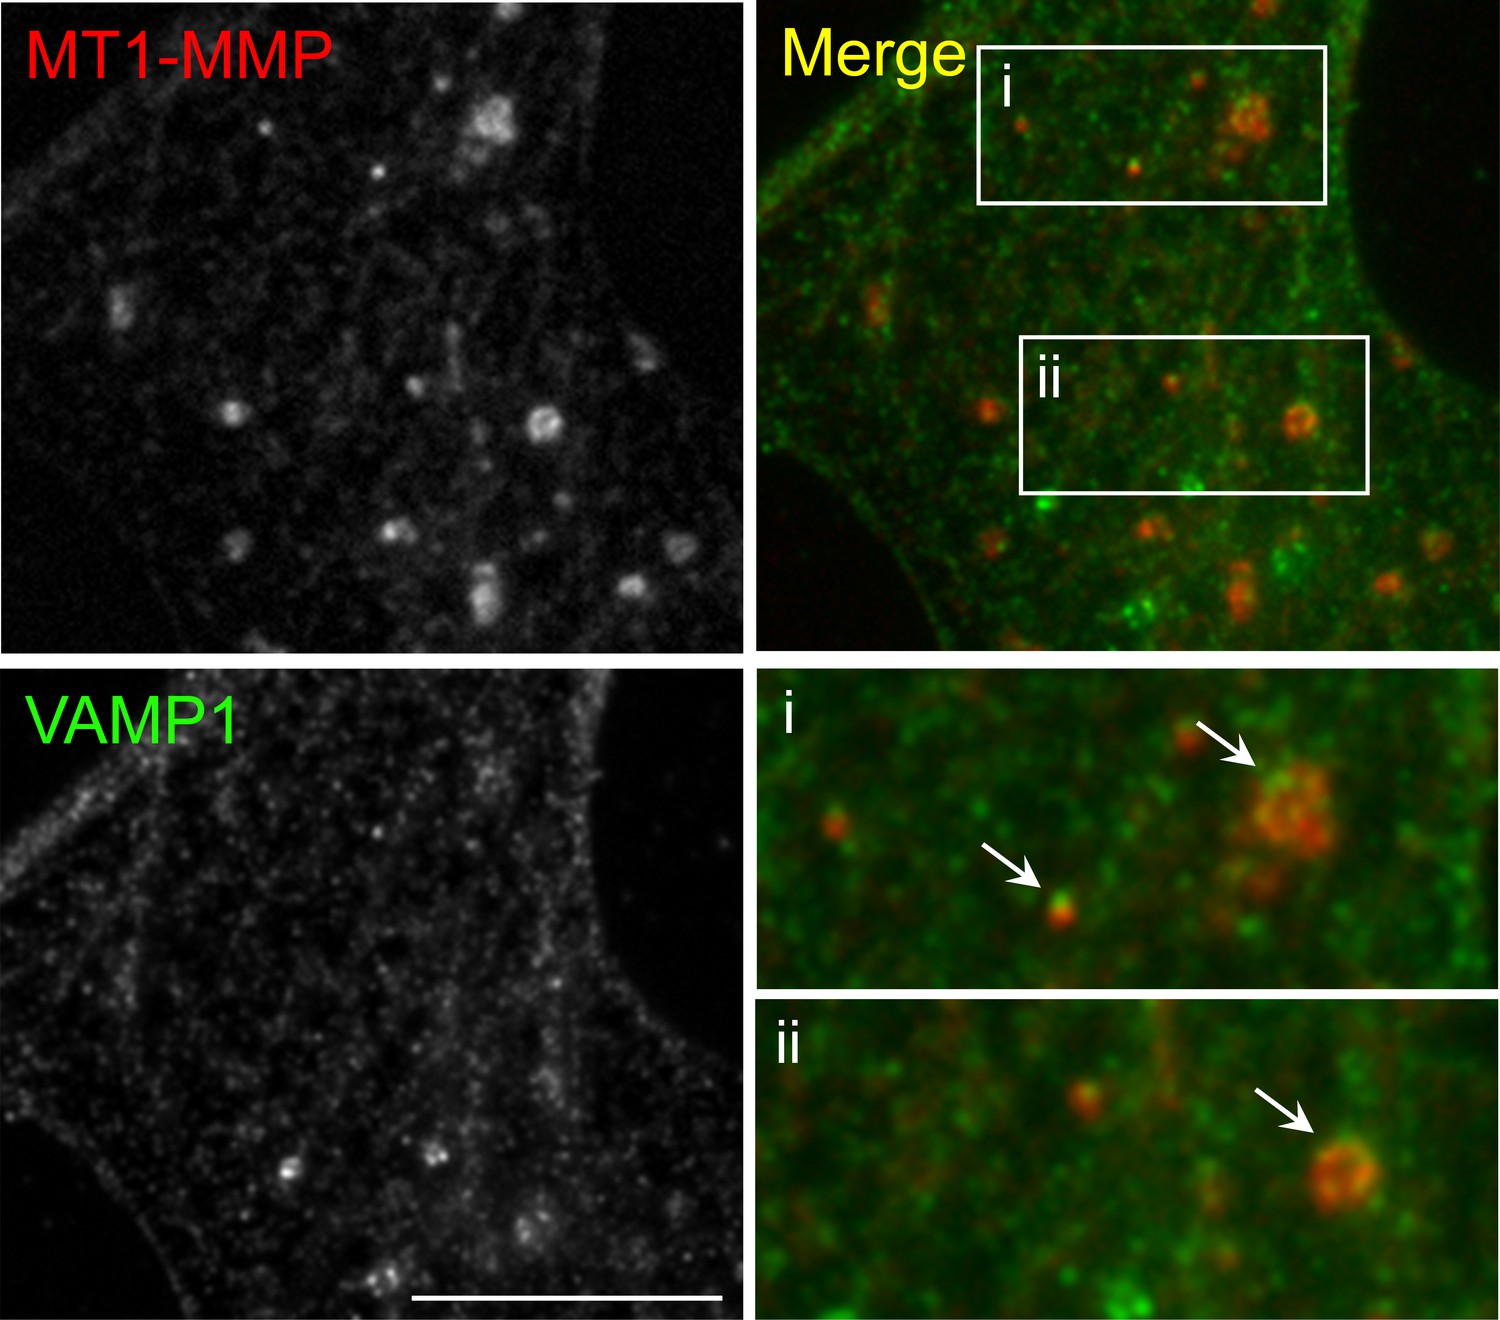
Immunostaining demonstrates the vesicular localization of endogenous MT1-MMP in cultured Xenopus muscle cells.
Representative images showing the localization of some endogenous MT1-MMP signals at the vesicular compartment (arrows), as visualized by vesicle-associated membrane protein 1 (VAMP1). For clarity, two regions were shown in the 2X magnified view. Scale bar represents 10 μm.
Figure 6
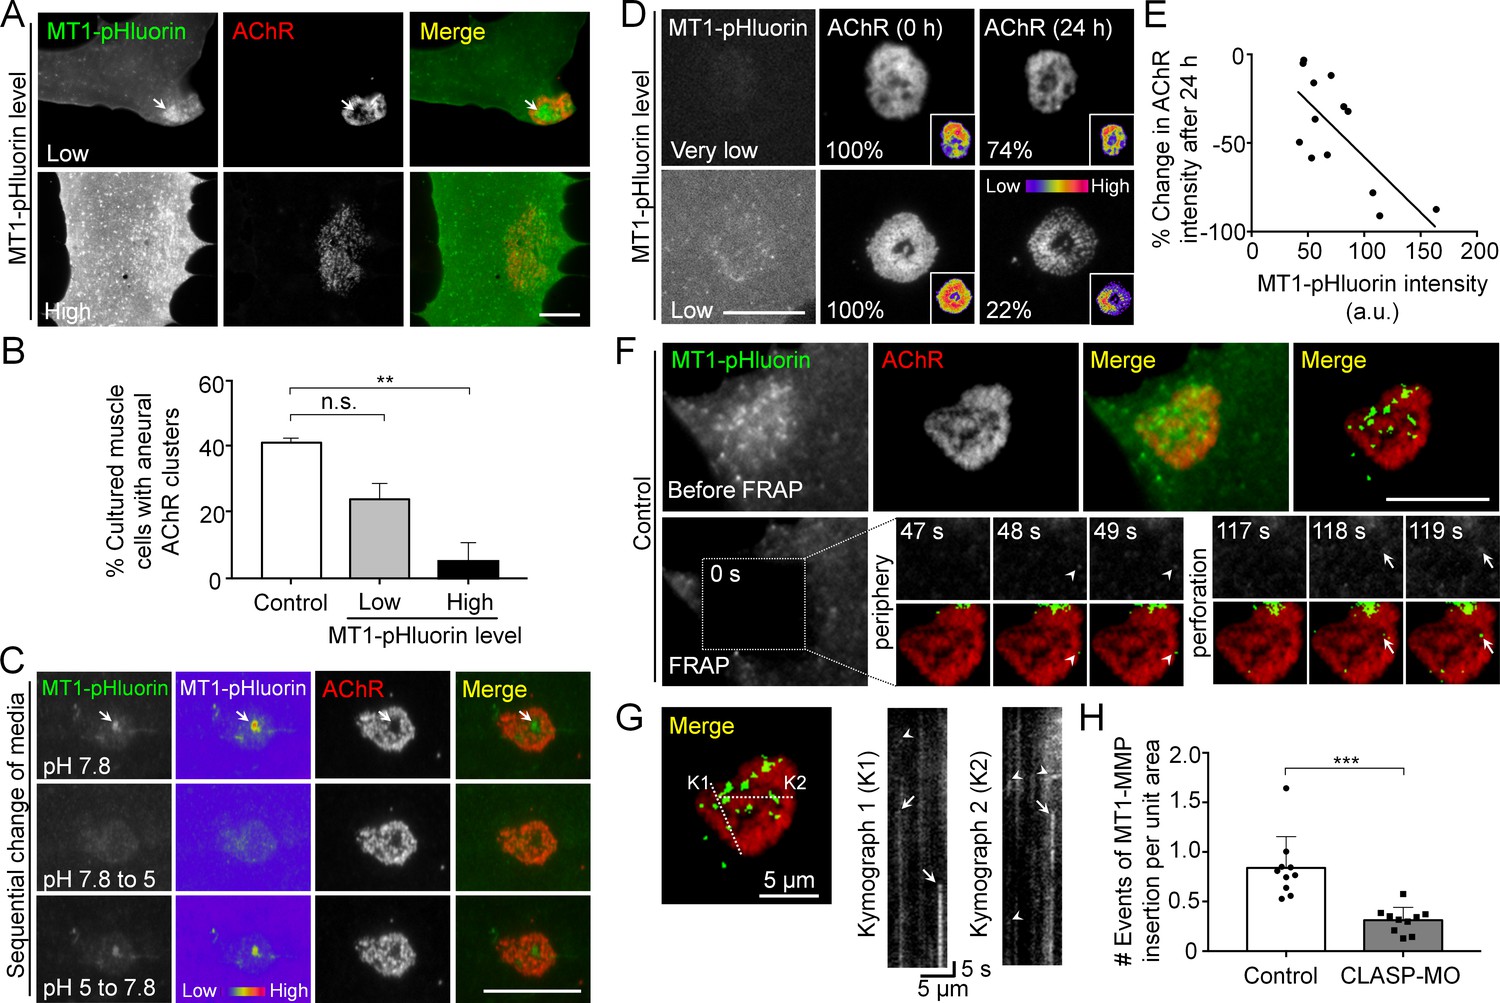
Spatial delivery of surface MT1-MMP regulates AChR cluster formation and remodeling.
(A) Representative images showing the effects on aneural AChR clustering in cultured muscle cells over-expressing different levels of MT1-MMP-pHluorin (MT1-pHluorin). Arrows indicate the spatial localization of MT1-pHluroin at perforated regions of AChR clusters. (B) Quantification on the effects on aneural AChR cluster formation in cultured muscle cells with different levels of MT1-pHluorin over-expression. Cultured muscle cells with average MT1-pHluorin intensity above the cutoff value of >500 (arbitrary unit) were classified as high expression. n = 150 (Control), 32 (Low MT1-pHluorin level), and 15 (High MT1-pHluorin level) muscle cells from 3 independent experiments. (C) Representative sets of images showing the change in MT1-pHluorin fluorescence intensity in response to a sequential switching of various culture media with different pH levels. Arrows indicate the spatial localization of MT1-pHluroin signals in the perforated region of AChR clusters. 8-bit pseudo-color images highlight the change in the relative intensity of MT1-pHluorin. (D) Representative sets of time-lapse images showing the extent of AChR cluster remodeling in muscle cells with different MT1-pHluorin expression levels. 8-bit pseudo-color images in the insets highlight the change in the relative intensity of AChR clusters. The percentage values indicate the relative fluorescence intensity of AChR clusters after 24 hr. (E) A scatter plot analysis showing the correlation between MT1-pHluorin intensity and the percentage change in AChR intensity over 24 hr in cells with different MT1-pHluorin expression levels. The black line indicates a linear correlation. R = −0.7188, p=0.0056. n = 13 from 3 independent experiments. (F) Representative TIRF-FRAP images showing the surface insertion of MT1-pHluorin at AChR clusters in cultured muscle cells. Arrows and arrowheads indicate the spatial insertion of MT1-pHluorin at the perforation and periphery of AChR clusters, respectively. (G) Kymographs showing the spatiotemporal insertion of MT1-pHluorin at AChR clusters. Two kymographs were constructed from 180 time-lapse images along the lines of K1 and K2, as indicated in the merge image (left panel). Arrows indicate some newly inserted MT1-pHluorin that were relatively stable, while arrowheads indicate that some were dispersed shortly after surface insertion. (H) Quantification on the number of events of MT1-pHluorin surface insertion per unit area (μm2) of aneural AChR clusters over the entire time-lapse duration. n = 10 (Control) and 10 (CLASP-MO) muscle cells from 3 independent experiments. Scale bars represent 10 μm, unless otherwise specified. Data are represented as mean ± SEM. One-way ANOVA with Bonferroni’s multiple comparisons test (B), Student’s t-test (H), **, *** represent p≤0.01 and 0.001 respectively. n.s.: non-significant.
Figure 7 with 2 supplements
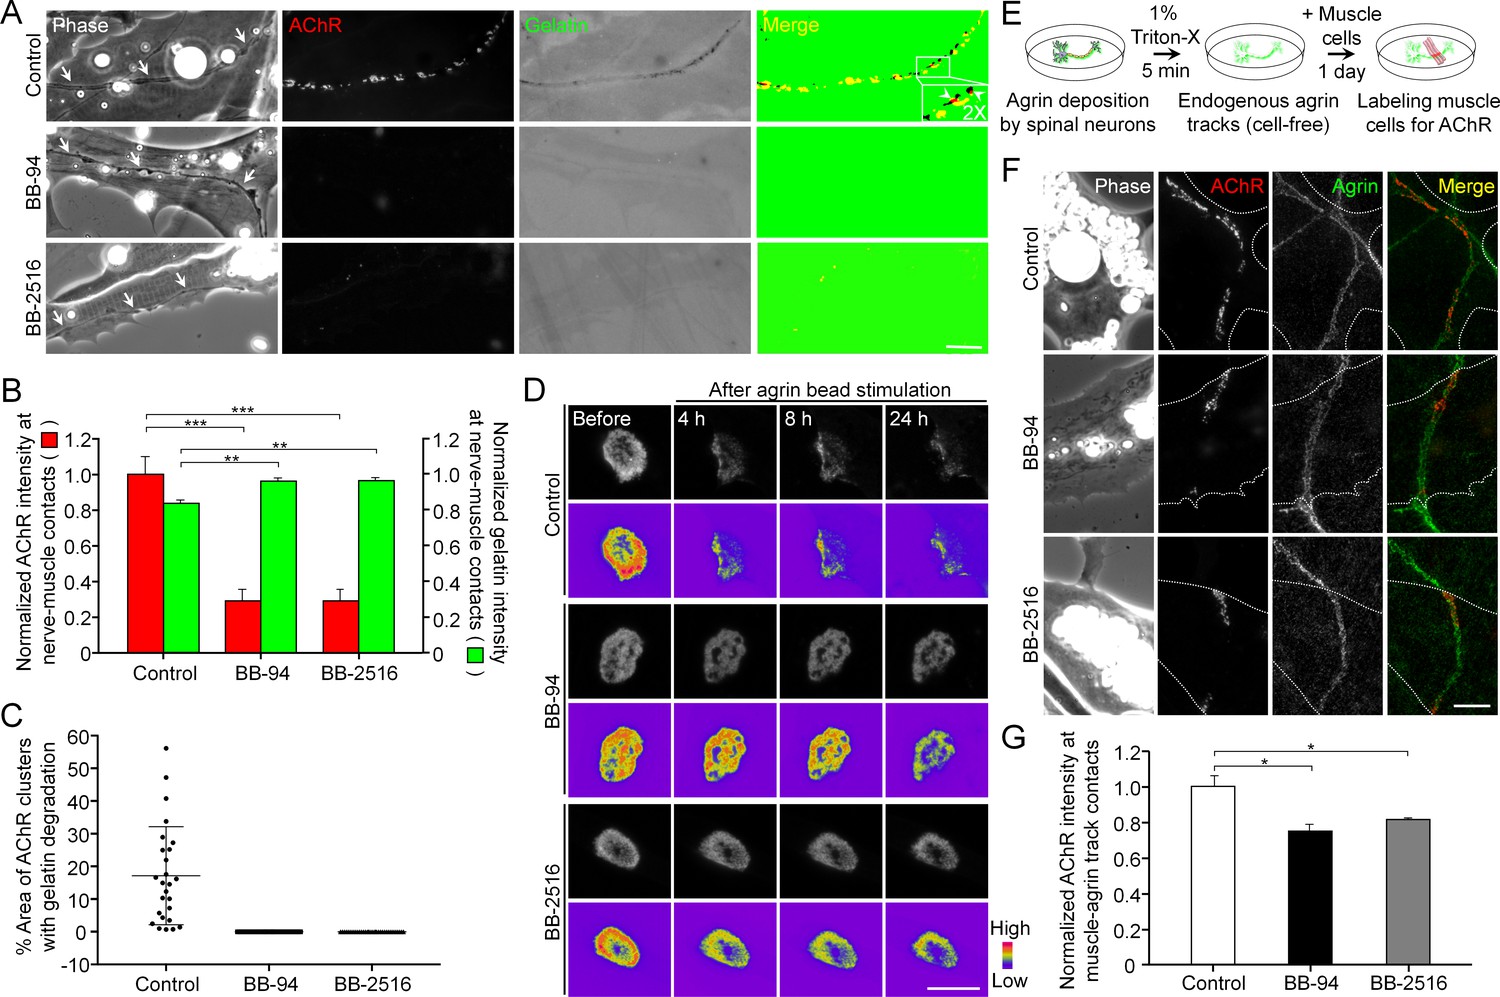
Pharmacological inhibition of MMP activity suppresses the assembly of synaptic AChR clusters and the disassembly of aneural AChR clusters.
(A) Representative images showing the focal degradation of fluorescent gelatin and the formation of nerve-induced AChR clusters along the trails of nerve-muscle contacts (arrows) in control co-cultures, but not in co-cultures treated with MMP inhibitors. To better show the degree of colocalization, merge images were created by overlaying the binary images of AChR and fluorescent gelatin channels after thresholding. Arrowheads in the magnified inset indicate the spatial colocalization between synaptic AChR clusters and gelatin degradation (with only red signals). (B) Quantification on the effects of MMP inhibitors on fluorescent gelatin degradation and nerve-induced AChR clustering. n = 30 (Control), 32 (BB-94), and 38 (BB-2516) nerve-muscle pairs from 4 independent experiments. (C) Quantification on the degree of colocalization between synaptic AChR clusters and gelatin degradation in nerve-muscle contacts. n = 26 (Control), 36 (BB-94), and 36 (BB-2516) nerve-muscle pairs from 4 independent experiments. Data are represented as mean ± SD. (D) Representative time-lapse images showing the effects of MMP inhibitors on the dispersal of aneural AChR clusters upon agrin bead stimulation. 8-bit pseudo-color images highlight the change in fluorescence intensity of aneural AChR clusters over 24 hr in different conditions. (E) A schematic diagram illustrating the preparation of endogenous agrin tracks on ECL-coated substratum for inducing synaptic AChR clustering in cultured muscle cells. (F) Representative images showing the inhibitory effects of MMP inhibitors on synaptic AChR clustering induced by endogenous agrin tracks. The location of agrin tracks was visualized by agrin immunostaining and then confirmed if neurites were not found in the phase contrast images. Dotted lines outline the periphery of muscle cells. (G) Quantification on the effects of MMP inhibitors on synaptic AChR clustering induced by endogenous agrin tracks. n = 30 (Control), 27 (BB-94), and 22 (BB-2516) muscle cells from 3 independent experiments. Scale bars represent 10 μm. Data are represented as mean ± SEM, unless otherwise specified. One-way ANOVA with Dunnett’s multiple comparisons test, *, **, *** represent p≤0.05, 0.01, and 0.001 respectively.
Figure 7—figure supplement 1

Agrin bead-induced AChR clustering is not affected by MMP inhibitors.
(A) An individual value plot showing the percentage change in the area of each aneural AChR clusters at different time-points upon agrin bead stimulation. n = 18 (Control), 22 (BB-94), 20 (BB-2516) muscle cells from 3 independent experiments. (B) Representative sets of time-lapse images showing the gradual increase in the size and intensity of agrin bead-induced AChR clusters in the same muscle cells shown in Figure 7D. Asterisks indicate the bead-muscle contacts in the phase contrast images. (C) Quantification on the mean intensity of agrin bead-induced AChR clusters at different time-points in response to BB-94 or BB-2516 treatment. n = 18 (Control), 22 (BB-94), 20 (BB-2516) muscle cells from 3 independent experiments. Scale bar represents 10 μm. Data are represented as mean ± SD (A) or mean ± SEM (C). Two-way ANOVA with Dunnett’s multiple comparisons test (A) and two-way ANOVA with Turkey’s multiple comparisons test (C), *, **, *** and **** represent ≤ 0.05, 0.01, 0.001 and 0.0001 respectively.
Figure 7—figure supplement 2
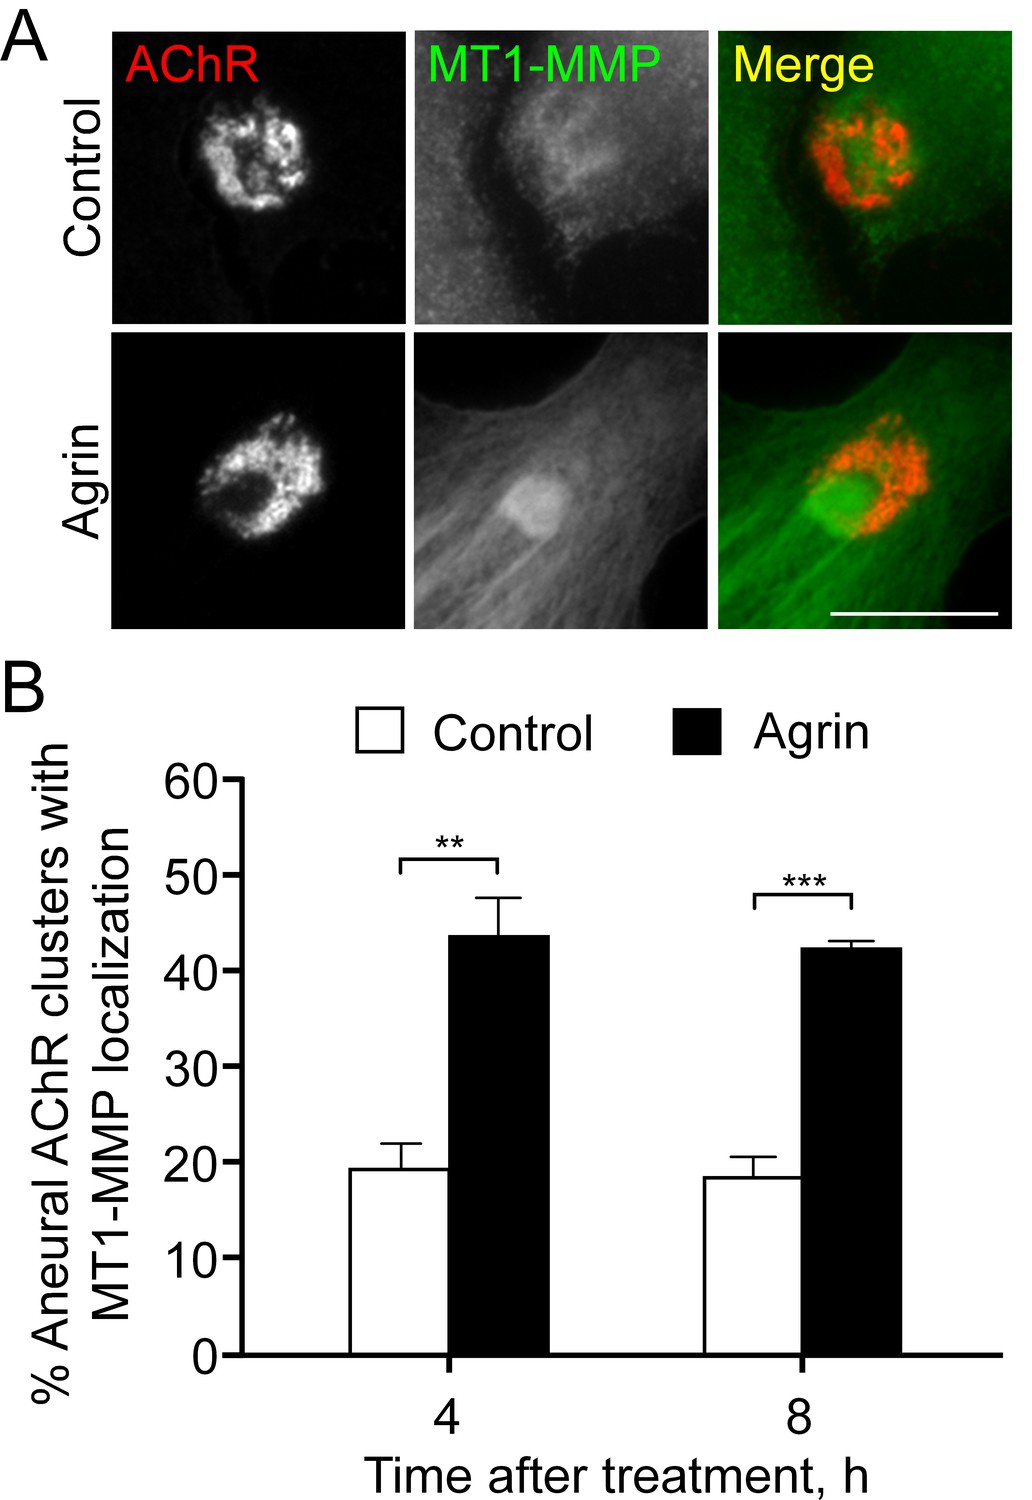
Endogenous localization of MT1-MMP at aneural AChR clusters is elevated by agrin treatment.
(A) Representative images showing the increased signals of endogenous MT1-MMP at the perforated regions of aneural AChR clusters after 8 hr agrin stimulation. (B) Quantification on the time-dependent increase in the localization of MT1-MMP signals at aneural AChR clusters in cultured muscle cells upon agrin treatment. n = 67 (Control, 4 hr), 92 (Agrin, 4 hr), 118 (Control, 8 hr), and 93 (Agrin, 8 hr) muscle cells from 3 independent experiments. Scale bar represents 10 μm. Data are represented as mean ± SEM. Student’s t-test, **, *** represent p≤0.01 and 0.001 respectively.
Figure 8 with 1 supplement
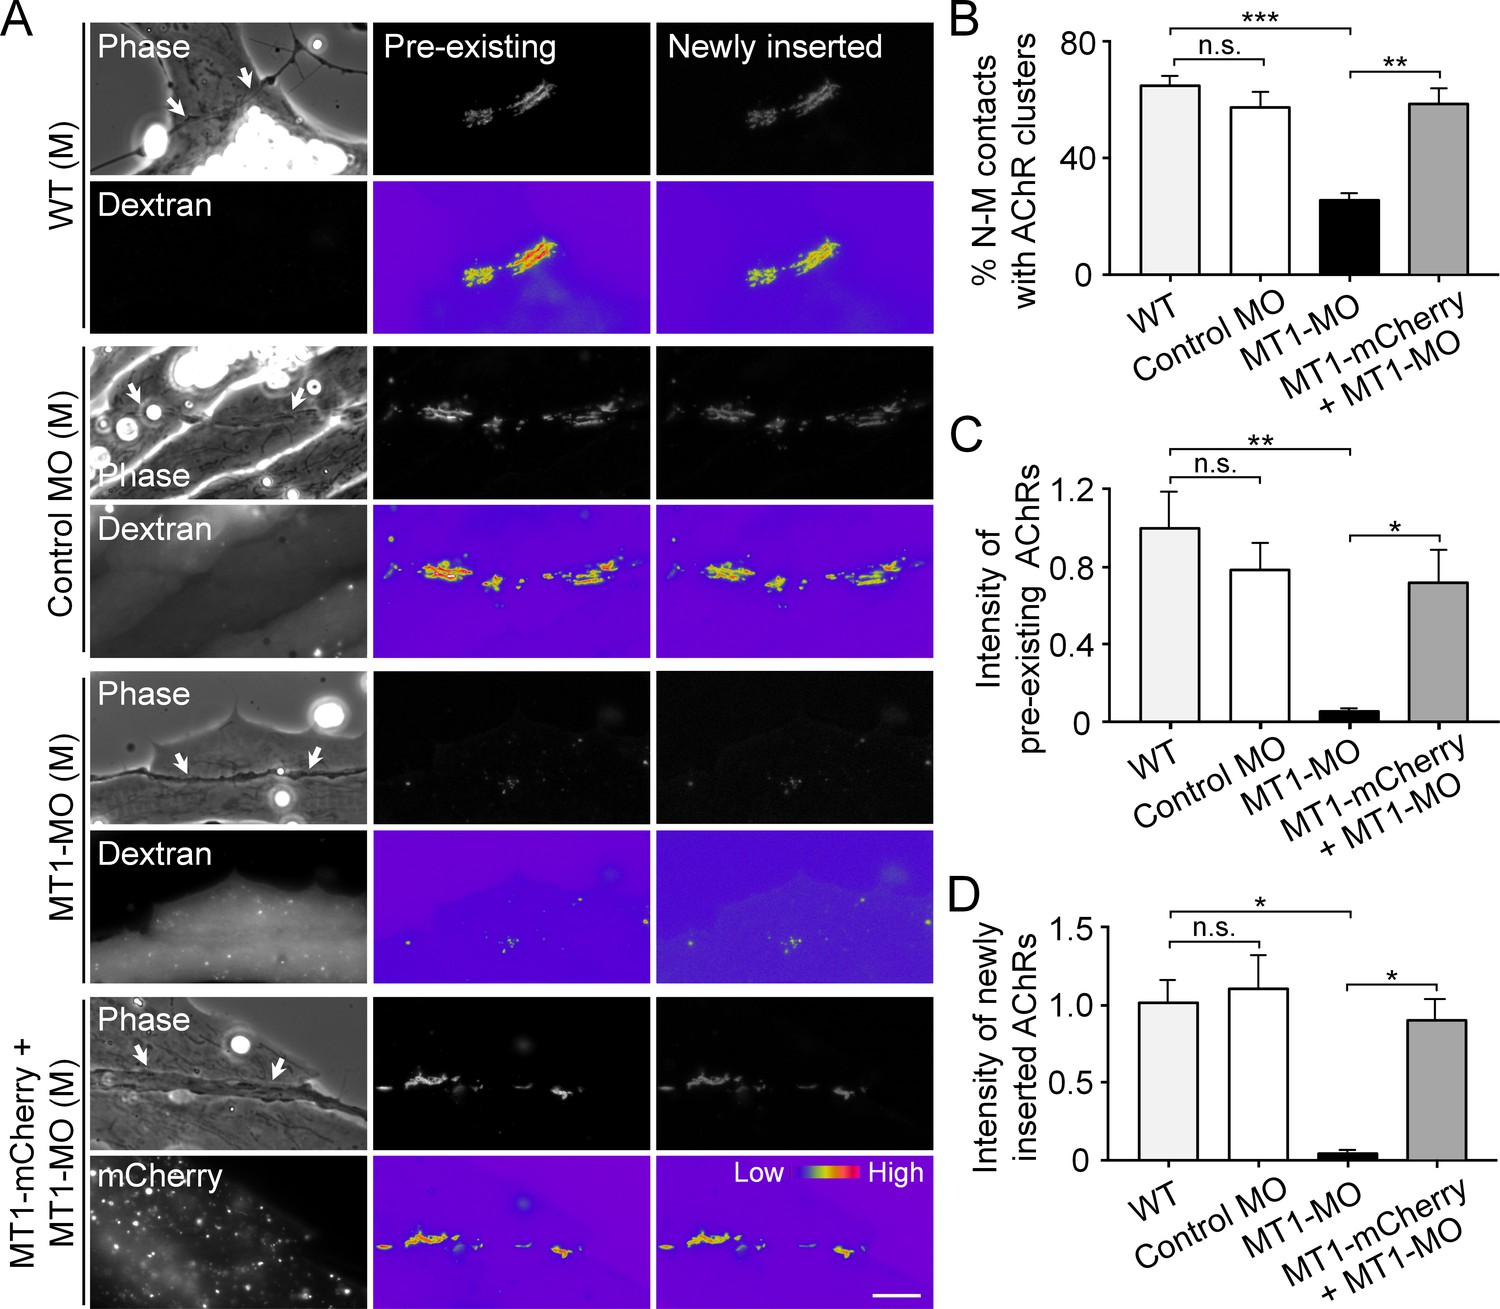
Postsynaptic MT1-MMP is required for nerve-induced AChR clustering.
(A) Representative images showing the localization of pre-existing and newly inserted AChR clusters at nerve-muscle contacts (arrows) in control co-cultures (WT (M)) and in the chimeric co-cultures of wild-type neurons and muscle cells with control morpholino (Control MO (M)), MT1-MMP-MO (MT1-MO (M)), or MT1-MMP-mCherry and MT1-MMP-MO (MT1-mCherry + MT1-MO (M)) muscles. Fluorescent dextran indicates the muscle cells derived from MO-injected embryos. 8-bit pseudo-color images highlight the relative fluorescence intensity of pre-existing and newly inserted AChR signals. (B) Quantification on the percentage of nerve-muscle contacts with AChR clusters in control nerve-muscle co-cultures and in different chimeric co-cultures. n = 127 (WT), 120 (Control MO), 146 (MT1-MO), or 34 (MT1-mCherry + MT1-MO) nerve-muscle pairs from 3 independent experiments. (C) Quantification on the intensity of pre-existing AChR signals per unit length of nerve-muscle contacts in control co-cultures and in different chimeric co-cultures. n = 29 (WT), 30 (Control MO), 32 (MT1-MO), or 23 (MT1-mCherry + MT1-MO) nerve-muscle pairs from 4 independent experiments. (D) Quantification on the intensity of newly inserted AChR signals per unit length of nerve-muscle contacts in control co-cultures and in different chimeric co-cultures. n = 24 (WT), 23 (Control MO), 25 (MT1-MO), or 19 (MT1-mCherry + MT1-MO) nerve-muscle pairs from 3 independent experiments. Scale bar represents 10 μm. Data are represented as mean ± SEM. One-way ANOVA with Sidak’s multiple comparisons test, *, **, *** represent p≤0.05, 0.01, and 0.001 respectively. n.s.: non-significant.
Figure 8—figure supplement 1
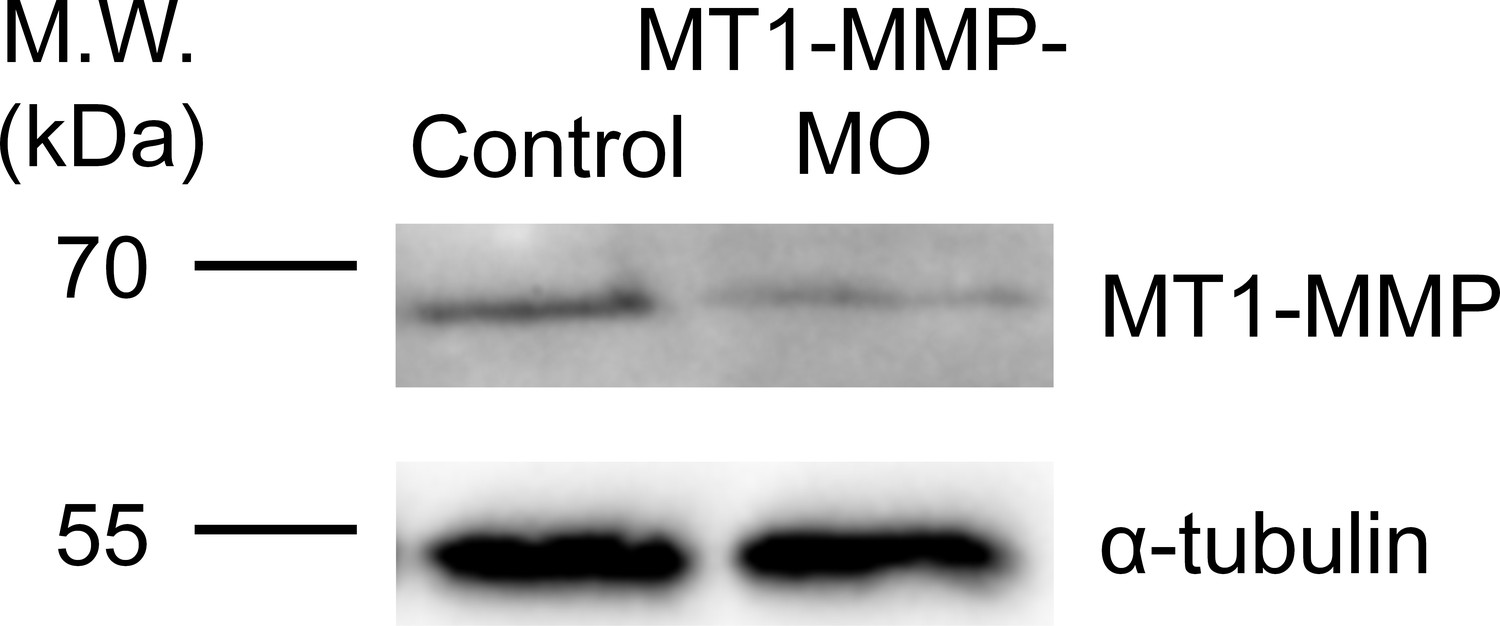
Endogenous MT1-MMP protein level is effectively reduced by specific antisense morpholino oligonucleotides.
Western blot analysis showing the reduced endogenous MT1-MMP protein level in Xenopus embryos injected with MT1-MMP-MO. α-tubulin was used as a loading control.
Figure 9
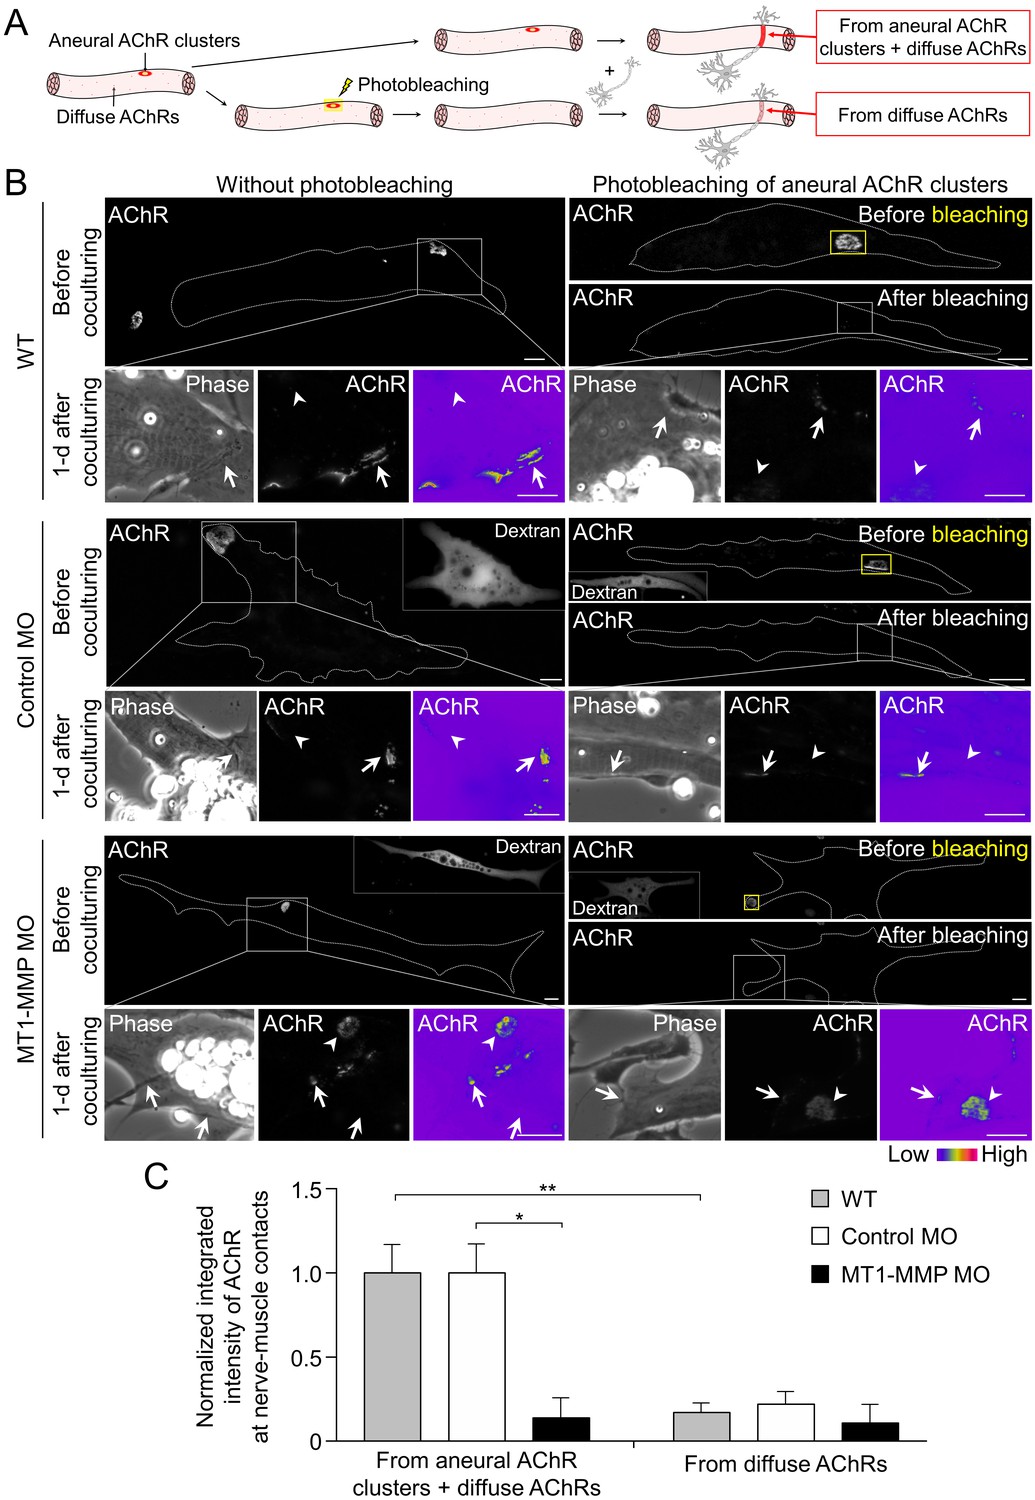
Postsynaptic MT1-MMP is required for the recruitment of aneural AChR clusters to the assembly of synaptic AChR clusters.
(A) A schematic diagram illustrating the use of laser-based photobleaching approach to differentially identify the contribution of aneural AChR clusters and diffuse AChRs for the assembly of nerve-induced synaptic AChR clusters. (B) Representative images showing the differential contribution of aneural AChR clusters and diffuse AChRs to nerve-induced synaptic AChR clusters in control co-cultures (WT) and in the chimeric co-cultures of wild-type neurons and muscle cells with control MO or MT1-MMP MO. Yellow boxes (right panels) indicate the region of photobleaching. White boxes show a magnified view of nerve-muscle contacts in 1-d old co-cultures. Dotted lines highlight the periphery of muscle cells. Fluorescent dextran signals in the insets indicate the muscle cells with microinjected MO. 8-bit pseudo-color images highlight the relative fluorescence intensity of AChR signals. Arrows indicate synaptic AChR clusters at nerve-muscle contact sites. Arrowheads indicate the original location of aneural AChR clusters. (C) Quantification on the intensity of AChR signals at the nerve-muscle contacts in control co-cultures and in chimeric co-cultures either with or without photobleaching. The control groups without photobleaching indicate the contribution from aneural AChR clusters + diffuse AChRs, n = 15 (WT), 9 (Control MO), and 9 (MT1-MMP MO) nerve-muscle pairs from 3 independent experiments. The experimental groups with photobleaching of aneural AChR clusters indicate the contribution from diffuse AChRs only, n = 23 (WT), 13 (Control MO), and 8 (MT1-MMP MO) nerve-muscle pairs from 3 independent experiments. Scale bars represent 10 μm. Data are represented as mean ± SEM. Two-way ANOVA with Sidak’s multiple comparison test, *, ** represent p≤0.05 and 0.01 respectively.
Figure 10
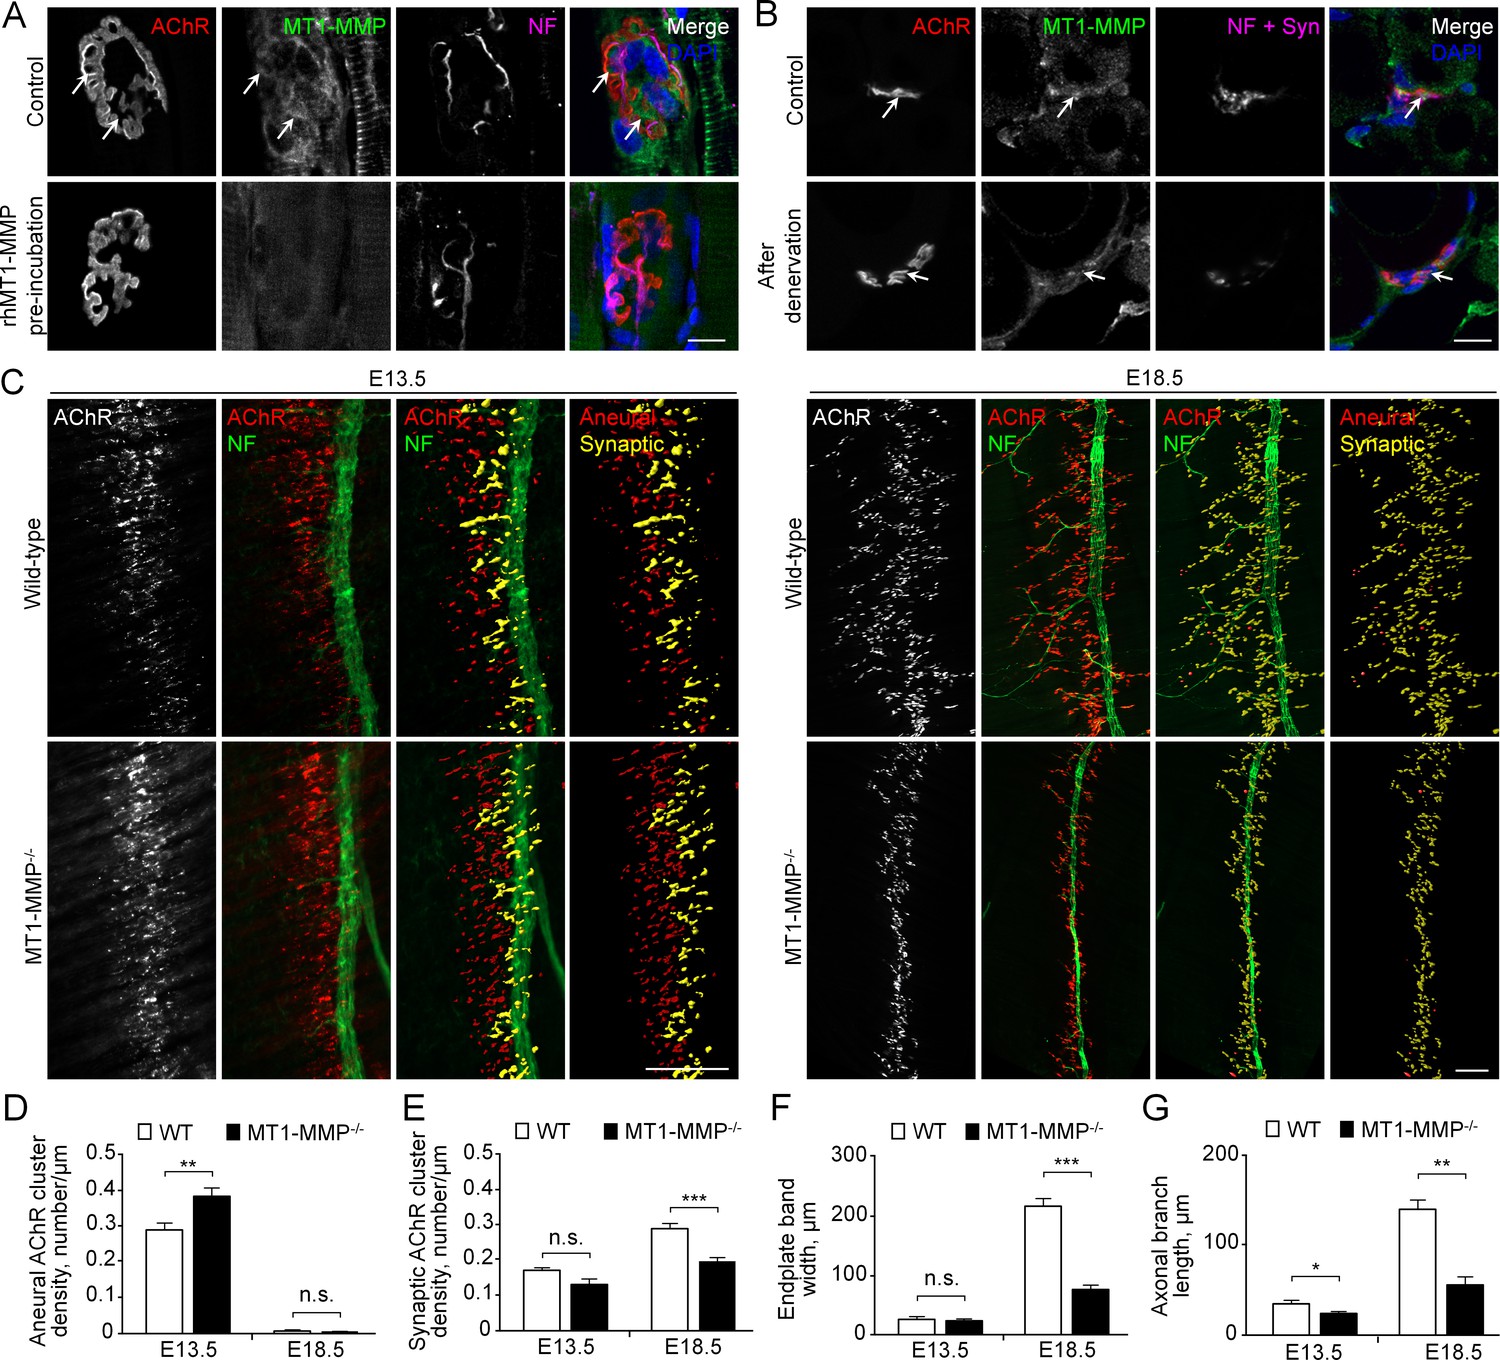
MT1-MMP is a regulator of NMJ development in vivo.
(A) Representative confocal images showing the localization of endogenous MT1-MMP at perforations of synaptic AChR clusters (arrows, top panels) in longitudinal cryosections of adult rat soleus muscles. The specificity of MT1-MMP antibody was verified by pre-incubating anti-MT1-MMP primary antibody with recombinant human MT1-MMP protein (rhMT1-MMP, bottom panels). Neurofilament (NF) was used as a neuronal marker. (B) Representative confocal images showing the postsynaptic localization of MT1-MMP at NMJs as demonstrated by the surgical denervation experiment. Staining of AChR, MT1-MMP, and presynaptic marker (NF and synaptophysin (Syn)) was performed using cross sections from adult rat soleus muscles either without (top panels) or with sciatic nerve cut after 4 days (bottom panels). (C) Representative confocal images showing aneural versus synaptic AChR clusters in whole-mount diaphragms from wild-type (WT) control and MT1-MMP-/- mice at E13.5 (left panels) and E18.5 (right panels). Whole-mount tissues were stained for AChR and NF. The superimposed 3D reconstruction images were generated by z-stack images using Imaris. Synaptic AChR clusters (yellow) were identified when signals of AChR and NF overlapped with each other, whereas other AChR signals (red) represent aneural AChR clusters. (D–G) Quantification on the density of aneural (D) versus synaptic (E) AChR clusters, the width of end-plate bands (F), and the length of axonal branches (G) in diaphragm muscles between wild-type and MT1-MMP-/- mouse embryos at E13.5 and E18.5. n = 4 (E13.5, WT) and 5 (E13.5, MT1-MMP-/-), 5 (E18.5, WT), and 3 (E18.5, MT1-MMP-/-) embryos from three independent experiments. Scale bars represent 10 μm (A) or 100 μm (C). Data are represented as mean ± SEM. Two-way ANOVA with Sidak’s multiple comparison test (D and E), Student’s t-test (F and G), *, **, *** represent p≤0.05, 0.01, and 0.001 respectively. n.s.: non-significant.
Figure 11
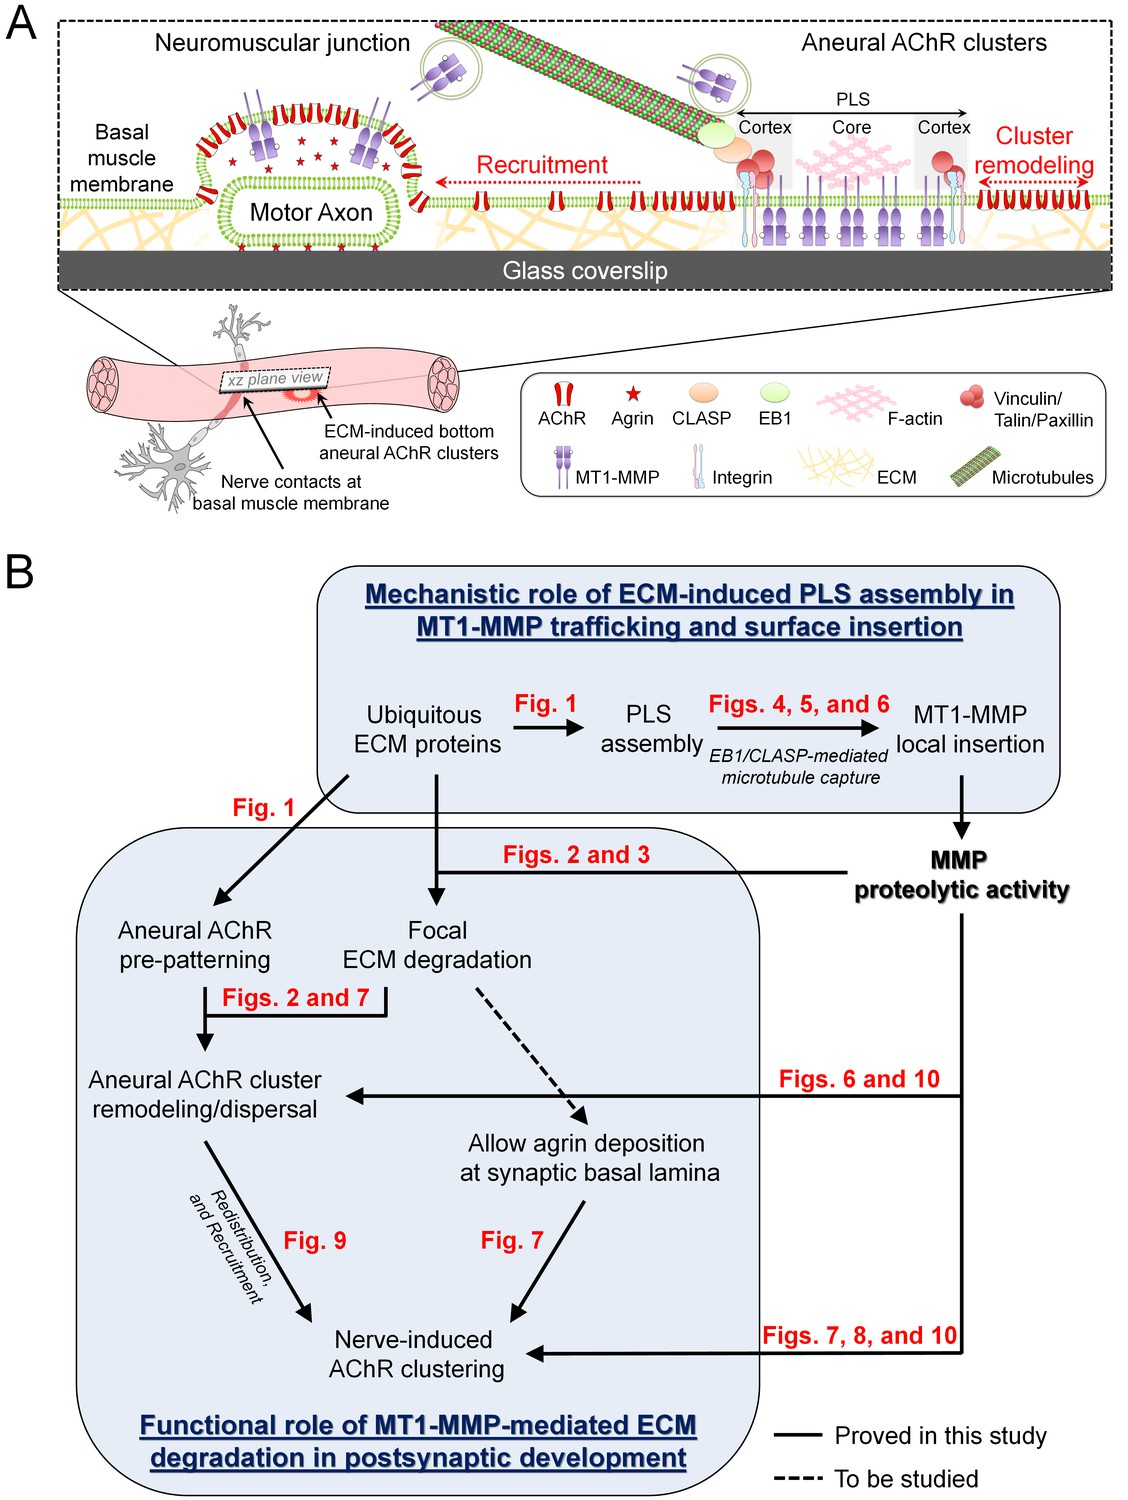
Working model on site-directed vesicular trafficking and surface delivery of MT1-MMP to regulate AChR cluster formation and remodeling.
(A) Schematic diagram showing the proposed mechanisms underlying site-directed MT1-MMP trafficking and surface insertion for the regulation of focal ECM degradation and the recruitment of ECM-induced bottom aneural AChR clusters to nerve-induced synaptic clusters at developing NMJs. (B) Logical flow diagram proposing key events in the mechanistic role of ECM-induced PLS assembly in MT1-MMP trafficking and surface insertion, and the functional role of MT1-MMP-mediated ECM degradation in postsynaptic development. The relevant data presented in the main figures that support each of the individual proposed events are highlighted in red.
Author response image 1
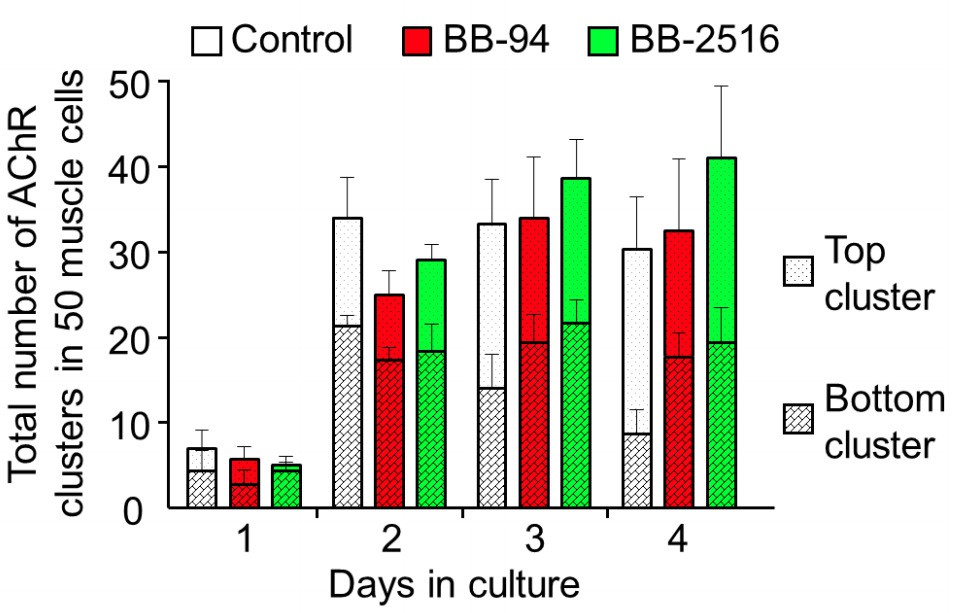
Quantitative analysis on the total AChR clusters in cultured cells treated with MMP inhibitors.
By monitoring muscle cells over 4 days in culture, AChR clusters located in the top versus bottom surface of the muscle cells were quantified in different experimental groups. Data are represented as mean ± SEM. n = 150 muscle cells in each experimental group from 3 independent experiments.
Author response image 2

Cortical microtubule capturing at AChR and focal adhesion regions.
(A) Representative TIRF images showing the hotspots of EB1-GFP comets in AChR clusters and focal adhesion (FA) structures in control or CLASP-MO muscle cells. (B) Quantitative analyses showing the speed of EB1-GFP comets in AChR cluster and focal adhesion regions between control and CLASP-MO muscle cells. n = 15 (Control) and 13 (CLASP-MO) cells from 4 independent experiments. Scale bar represents 10 μm. Data are represented as mean ± SEM. Student’s t-test, * represents p ≤ 0.05.
Author response image 3
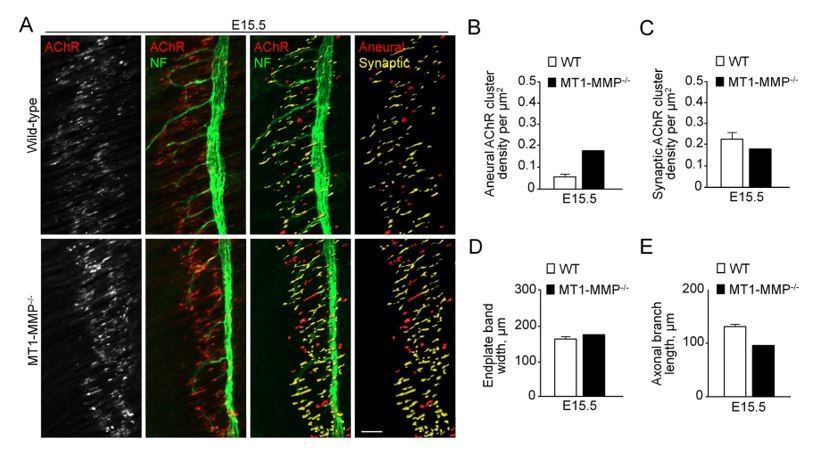
Aneural versus synaptic AChR clusters in MT1-MMP-/- diaphragm muscles at E15.5.
(A) Representative confocal images showing the AChR pre-patterns (red) and synaptic AChR clusters (yellow) in whole-mount diaphragms from control and MT1-MMP-/- mice at E15.5. Whole-mount tissues were stained for AChR and neurofilament (NF). (B-E) Quantification on the density of aneural (B) versus synaptic (C) AChR clusters, the width of end-plate bands (D), and the length of axonal branches (E) in diaphragm muscles between wild-type and MT1-MMP-/- mouse embryos. n = 3 (WT) and 1 (MT1-MMP-/-) embryos from 1 experiment only. Data are represented as mean ± SEM (WT). Scale bar represents 50 μm.
Author response image 4

Localization of PLS core and cortex markers at AChR clusters in postnatal mice.
Representative confocal images showing the enrichment of PLS core marker, ADF/cofilin (top panels), and cortex marker, talin (bottom panels), at synaptic AChR clusters in longitudinal cryosections of hindlimb muscles isolated from P11 wild-type or MT1-MMP-/- mice. Maximum projection intensity images of 12 z-stack confocal frames with 0.48 µm intervals were constructed using ZEN 2.3 (Carl Zeiss). Scale bar represents 10 μm.
Tables
Key resources table
| Reagent type (species) or resource | Designation | Source or reference | Identifiers | Additional information |
|---|---|---|---|---|
| Gene (X. laevis) | MT1-MMP | Xenbase | XB-GENE-485647 | |
| Genetic reagent (M. musculus) | MT1-MMP-/- | Professor Zhongjun Zhou (HKU) Sakamoto and Seiki, 2009 | - | |
| Cell line (M. musculus) | C2C12, Mouse immortalized myoblast | ATCC | Cat#: CRL-1772, RRID:CVCL-0188 | From ATCC; Cell identity has been confirmed by STR profiling and cell line was found to be free of Mycoplasma. |
| Biological sample (X. laevis) | Primary muscle and neuronal culture | Xenopus 1 | ||
| Biological sample (Rat) | Rat soleus muscle | Laboratory Animal Unit (HKU) | - | Sprague Dawley |
| Antibody | Anti-β-tubulin | Developmental Studies Hybridoma Bank | Cat#: 6G7-s, RRID:AB_528497 | IF (1:1000) |
| Antibody | Anti-α-tubulin | Sigma-Aldrich | Cat#: T6074, RRID:AB_477582 | WB (1:2000) |
| Antibody | Anti-Agrin | Developmental Studies Hybridoma Bank | Cat#: 6D2, RRID:AB_528071 | IF (1:100) |
| Antibody | Anti-ADF/cofilin | Dr James Bamburg (Colorado State University) Lee et al., 2009 | IF (1:500) | |
| Antibody | Anti-β-actin | Sigma-Aldrich | Cat#: A2228, RRID:AB_476697 | WB (1:1000) |
| Antibody | Anti-Cortactin | Santa Cruz Biotechnology | Cat#: sc11408, RRID:AB_2088281 | IF (1:500) |
| Antibody | Anti-CLASP1 | Abcam | Cat#: ab85919 | WB (1:250) |
| Antibody | Anti-EB1 | BD Biosciences | Cat#: 610534, RRID:AB_397891 | IF (1:100) |
| Antibody | Anti-Laminin | Thermo Fisher Scientific | Cat#: PA516287, RRID:AB_10985513 | IF (1:100) |
| Antibody | Anti-MT1-MMP | Merck Millipore | Cat#: MAB3328, RRID:AB_570599 | IF (1:100 or 1:50) |
| Antibody | Anti-MT1-MMP | Merck Millipore | Cat#: AB6005, RRID:AB_10618742 | WB (1:1000), a gift from Dr Timothy Gomez (University of Wisconsin-Madison) |
| Antibody | Anti-MT1-MMP | Santa Cruz Biotechnology | Cat#: sc-373908 | IF (1:100) |
| Antibody | Anti-NF200 | Sigma-Aldrich | Cat#: N4142, RRID:AB_477272 | IF (1:500 or 1:1000) |
| Antibody | Anti-Paxillin | Biolegend | Cat#: 624001, RRID:AB_2300550 | IF (1:100) |
| Antibody | Anti-p34-Arc | EMD Millipore | Cat#: 07–227, RRID:AB_310447 | IF (1:100) |
| Antibody | Anti-Synaptobrevin 1 | Synaptic Systems | Cat#: 104002, RRID:AB_887807 | IF (1:300) |
| Antibody | Anti-Synaptophysin | Abcam | Cat#: ab32127, RRID:AB_2286949 | IF (1:1000) |
| Antibody | Anti-Talin | Biolegend | Cat#: T3287, RRID:AB_477572 | IF (1:100) |
| Antibody | Anti-Vinculin | Sigma-Aldrich | Cat#: V4505, RRID:AB_477617 | IF (1:100) |
| Recombinant DNA reagent | GFP-EB1 | Addgene | RRID:Addgene_39299 | |
| Recombinant DNA reagent | MT1-MMP- mCherry | Dr Cheng-Han Yu (HKU) | ||
| Recombinant DNA reagent | MT1-MMP-pHluorin | Dr Cheng-Han Yu (HKU) | ||
| Sequence-based reagent | Control morpholino | Gene Tools | Standard control oligo | CCTCTTACCTCAGTTACAATTTATA |
| Sequence-based reagent | MT1-MMP morpholino | Gene Tools | Custom morpholino | CCAGGCTGCTCTCAGAGGCTCCATC |
| Sequence-based reagent | CLASP morpholino | Gene Tools | Custom morpholino | GCCAGTAGTCCATTCCCTGTTCCAT |
| Peptide, recombinant protein | α-Bungarotoxin | Thermo Fisher Scientific | Cat#: B1601 | |
| Peptide, recombinant protein | Alexa Fluor 488 Phalloidin | Thermo Fisher Scientific | Cat#: A12379 | |
| Peptide, recombinant protein | Alexa Fluor 647 conjugate-α-bungarotoxin | Thermo Fisher Scientific | Cat#: B35450 | |
| Peptide, recombinant protein | Alexa Fluor 488 conjugate-α-bungarotoxin | Thermo Fisher Scientific | Cat#: B13422 | |
| Peptide, recombinant protein | Corning Collagen I | Fisher Scientific | Cat#: C354249 | |
| Peptide, recombinant protein | Dextran, Alexa Fluor 488 | Thermo Fisher Scientific | Cat#: D22910 | |
| Peptide, recombinant protein | Dextran, Alexa Fluor 546 | Thermo Fisher Scientific | Cat#: D22911 | |
| Peptide, recombinant protein | ECL cell attachment matrix | Merck Millipore | Cat#: 08–100 | |
| Peptide, recombinant protein | Gelatin | Sigma-Aldrich | Cat#: G1393 | |
| Peptide, recombinant protein | Gelatin From Pig Skin, Fluorescein Conjugate | Thermo Fisher Scientific | Cat#: G13187 | |
| Peptide, recombinant protein | Gelatin From Pig Skin, Oregon Green 488 Conjugate | Thermo Fisher Scientific | Cat#: G13186 | |
| Peptide, recombinant protein | Laminin from Engelbreth-Holm-Swarm murine sarcoma | Sigma-Aldrich | Cat#: L2020 | |
| Peptide, recombinant protein | Poly-D-lysine hydrobromide | Sigma-Aldrich | Cat#: P1024 | |
| Peptide, recombinant protein | Recombinant human MT1-MMP | R and D Systems | Cat#: 918-MP-010 | |
| Peptide, recombinant protein | Tetramethylrhodamine α-bungarotoxin | Thermo Fisher Scientific | Cat#: T1175 | |
| Commercial assay or kit | Alexa Fluor 488 Tyramide SuperBoost Kit, goat anti-mouse IgG | Thermo Fisher Scientific | Cat#: B40941 | |
| Commercial assay or kit | Alexa Fluor 594 Tyramide SuperBoost Kit, goat anti-rabbit IgG | Thermo Fisher Scientific | Cat#: B40944 | |
| Chemical compound, drug | BB-94 | ApexBio | Cat#: A2577-S | |
| Chemical compound, drug | Collagenase from Clostridium histolyticum | Sigma-Aldrich | Cat#: C98191G | |
| Chemical compound, drug | Leibovitz's L-15 medium | Sigma-Aldrich | Cat#: L4386 | |
| Chemical compound, drug | Marimastat/BB-2516 | ApexBio | Cat#: A4049 | |
| Chemical compound, drug | Sodium borohydride | Sigma-Aldrich | Cat#: 452882 | |
| Software, algorithm | ZEN 2.3 Blue Edition | Carl Zeiss Microscopy | ||
| Software, algorithm | Prism 7 | GraphPad Software | ||
| Software, algorithm | ImageJ 1.52a (Java 1.8.0_66 (64-bit)) | NIH | https://imagej.nih.gov/ij/ | |
| Software, algorithm | Imaris 7 | Oxford Instruments | ||
| Software, algorithm | MetaMorph 7.8.2 | Molecular Devices | ||
| Software, algorithm | µmanager 1.4 | Open Imaging | ||
| Other | CryoStar NX50 Cryostat | Thermo Fisher Scientific | ||
| Other | DAPI-Fluoromount-G | Electron Microscopy Sciences | Cat#: 17984–24 | |
| Other | Fluoromount-G | Thermo Fisher Scientific | Cat#: 00-4958-02 | |
| Other | Nanoject II auto-nanoliter injector | Drummond Scientific | Cat#: 3-000-206A |
Additional files
-
Transparent reporting form
- https://cdn.elifesciences.org/articles/54379/elife-54379-transrepform-v1.pdf
-
Reporting standard 1
Table for statistical tests.
- https://cdn.elifesciences.org/articles/54379/elife-54379-repstand1-v1.docx
Download links
A two-part list of links to download the article, or parts of the article, in various formats.
Downloads (link to download the article as PDF)
Open citations (links to open the citations from this article in various online reference manager services)
Cite this article (links to download the citations from this article in formats compatible with various reference manager tools)
Site-directed MT1-MMP trafficking and surface insertion regulate AChR clustering and remodeling at developing NMJs
eLife 9:e54379.
https://doi.org/10.7554/eLife.54379


