Effects of fluorescent glutamate indicators on neurotransmitter diffusion and uptake
- Department of Neuroscience, Tufts University School of Medicine, United States
- Synaptic Physiology Section, NINDS Intramural Research Program, National Institutes of Health, United States
Figures
Figure 1 with 1 supplement
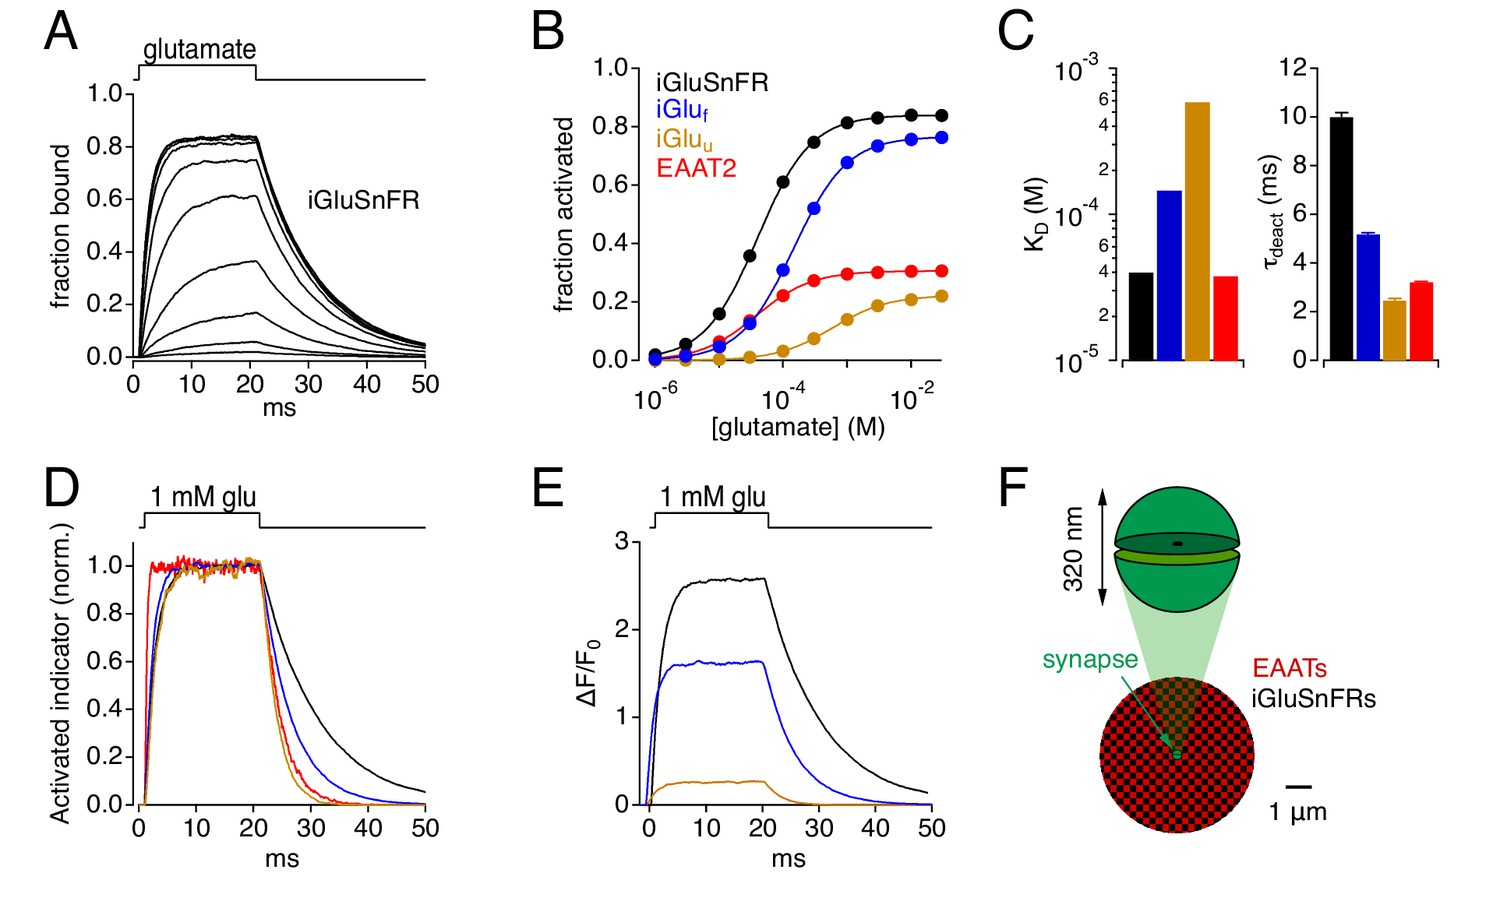
Simulations: Kinetic properties of glutamate indicators/transporters and simulated synaptic responses.
(A) Simulated iGluSnFR activation by 20 ms applications of glutamate (concentration steps varied logarithmically from 1 μM to 30 mM). (B) Comparison of simulated glutamate dose-response curves for iGluSnFR (black), iGluf (blue), iGluu (gold) and EAAT2 (red). Color scheme applies to the entire figure. (C) Simulated equilibrium affinities (KD, left) and deactivation time constants (mean ± SD, n = 10 different [glu] applications, right) for iGlus and EAAT2. (D) Activation of iGlus and EAAT2 by 1 mM glutamate, normalized and superimposed to compare activation and deactivation kinetics. (E) Responses of iGlus to 1 mM glutamate, scaled according to their background fluorescence and change in fluorescence upon activation (i.e., ΔF/F0 ≍ (Fon-Foff)/Foff; see Figure 1—figure supplement 1; Helassa et al., 2018). (F) Schematic diagrams of simulated synaptic structure (top) and surrounding extracellular space (bottom).
-
Figure 1—source data 1
Characterization of kinetic models.
- https://cdn.elifesciences.org/articles/54441/elife-54441-fig1-data1-v2.xlsx
Figure 1—figure supplement 1
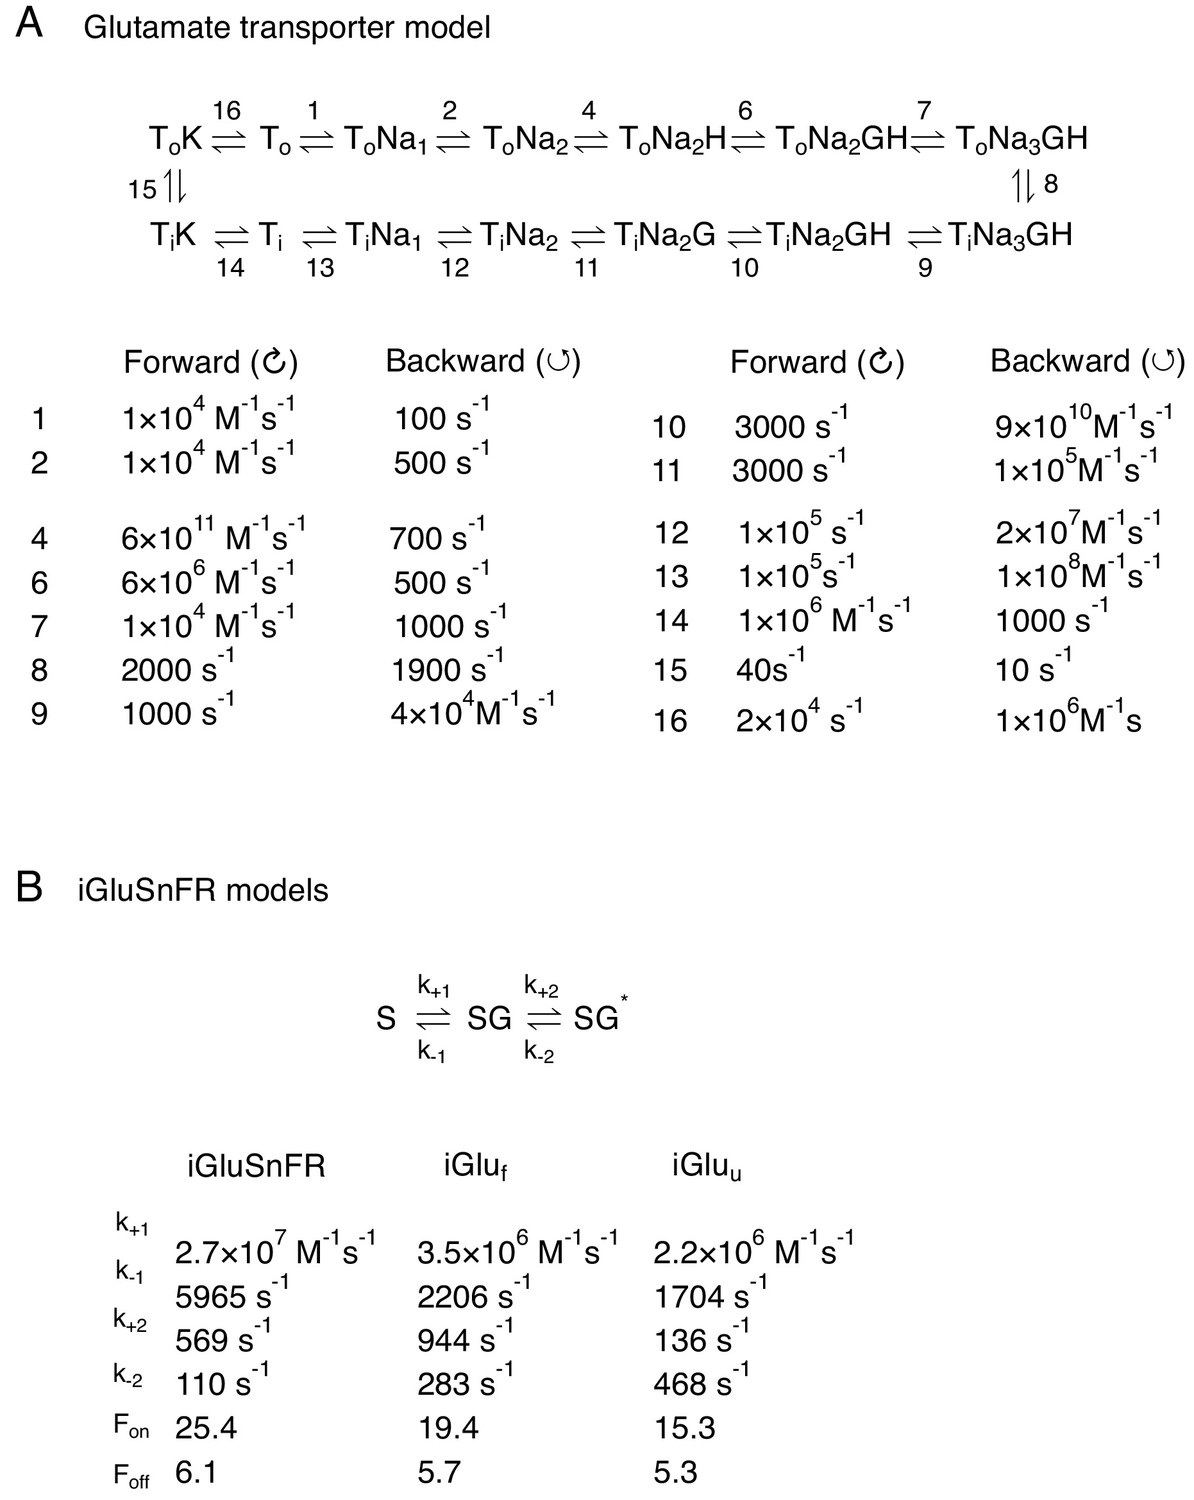
Kinetic models.
(A) Multi-state model of EAAT2 used in the simulations (Bergles et al., 2002). (B) Multi-state models used to simulate iGluSnFR, iGluf and iGluu (Helassa et al., 2018).
Figure 2
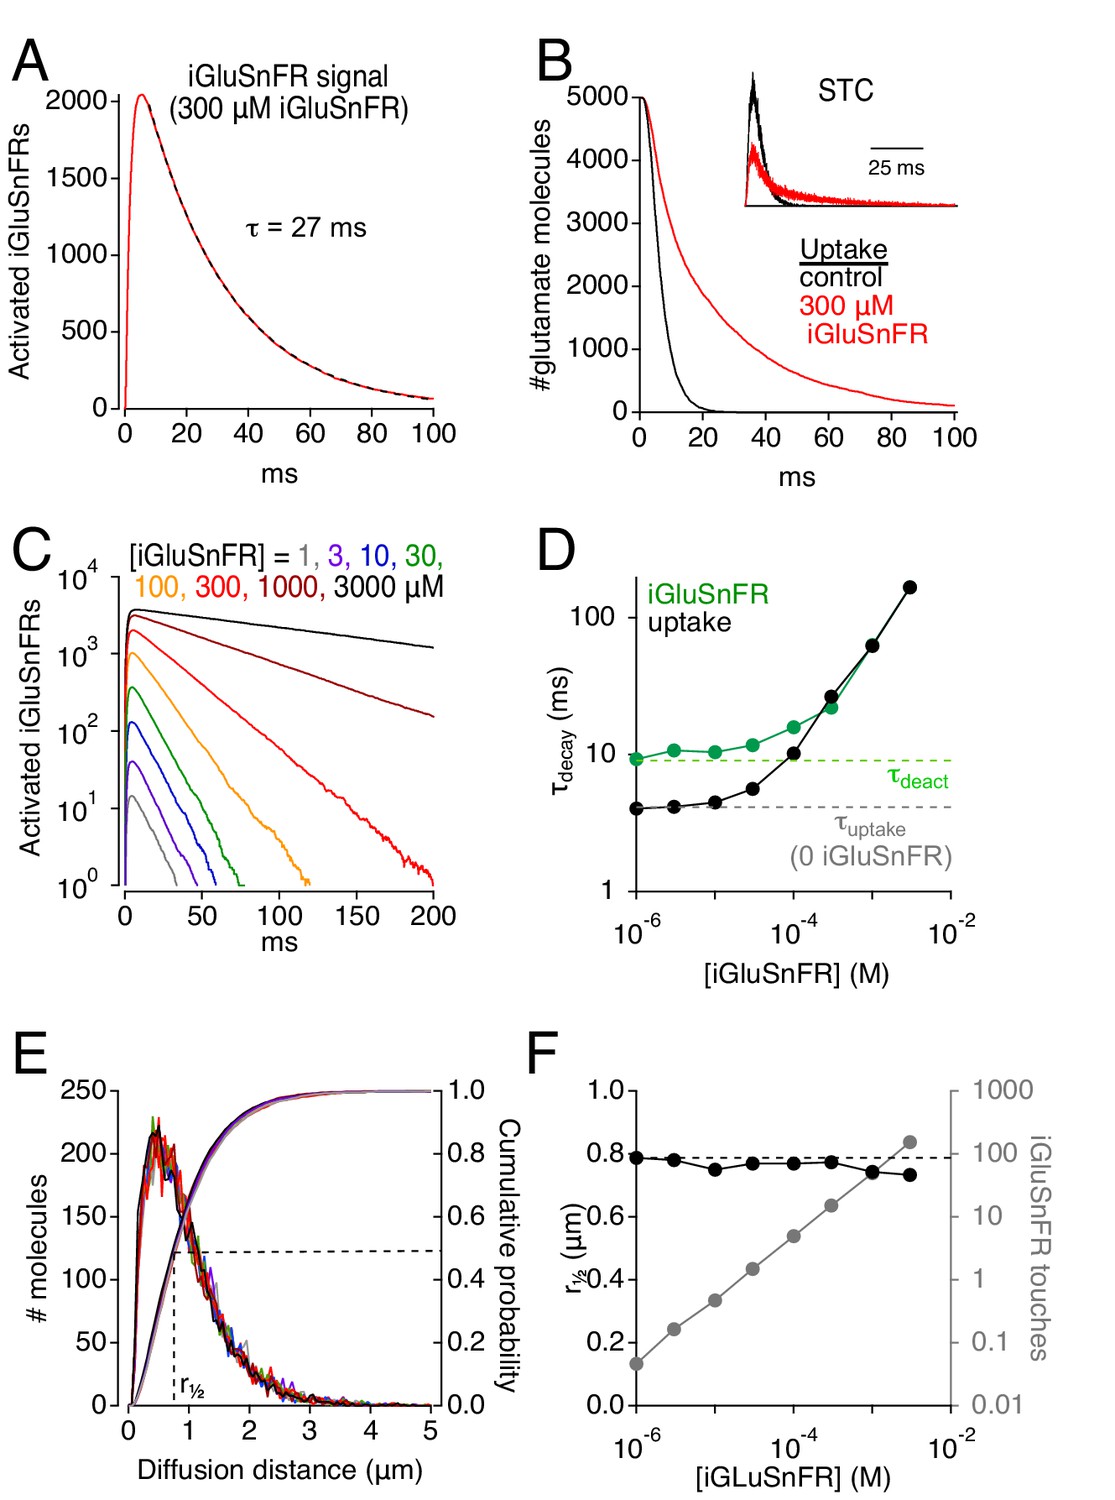
Simulations: iGluSnFR can distort fluorescence and glutamate clearance time courses.
(A) Simulated iGluSnFR activation elicited by the release of 5000 glutamate molecules from the center of the cleft in the scheme depicted in Figure 1F. Dashed line indicates exponential fit to the response decay. Activation measured over a region of interest (ROI, radius = 10 μm) centered about the synapse. (B) Simulated time course of glutamate uptake in the absence of iGluSnFR (black) and in the presence of 300 μM iGluSnFR (red). Inset, simulated STCs in the presence (red) and absence (black) of 300 μM iGluSnFR. STCs are typically inward (negative) currents but are inverted here for simplicity. (C) The concentration of iGluSnFR influences its activation time course. A semi-log plot shows that the exponential decay slows as [iGluSnFR] increases (ROI radius = 10 μm). (D) Summarized data from C (green). Glutamate uptake (black) is also slowed by [iGluSnFR]. (E) iGluSnFR buffering does not affect the distance that glutamate diffuses prior to being taken up by EAATs. Same color scheme as in C. Distance measured from the center of the synaptic cleft. (F) Summarized data from E. Gray trace shows the average number of times each glutamate molecule binds to iGluSnFR prior to being taken up by an EAAT.
-
Figure 2—source data 1
Simulated STCs and iGluSnFR signals.
Measured decay time constants of simulated STCs and iGluSnFR signals (Figure 2D). Median diffusion distance of glutamate molecules and the average number of times that each glutamate molecule bound to an iGluSnFR molecule prior to being taken up (Figure 2F). Data from a single simulation at each iGluSnFR concentration.
- https://cdn.elifesciences.org/articles/54441/elife-54441-fig2-data1-v2.xlsx
Figure 3 with 1 supplement

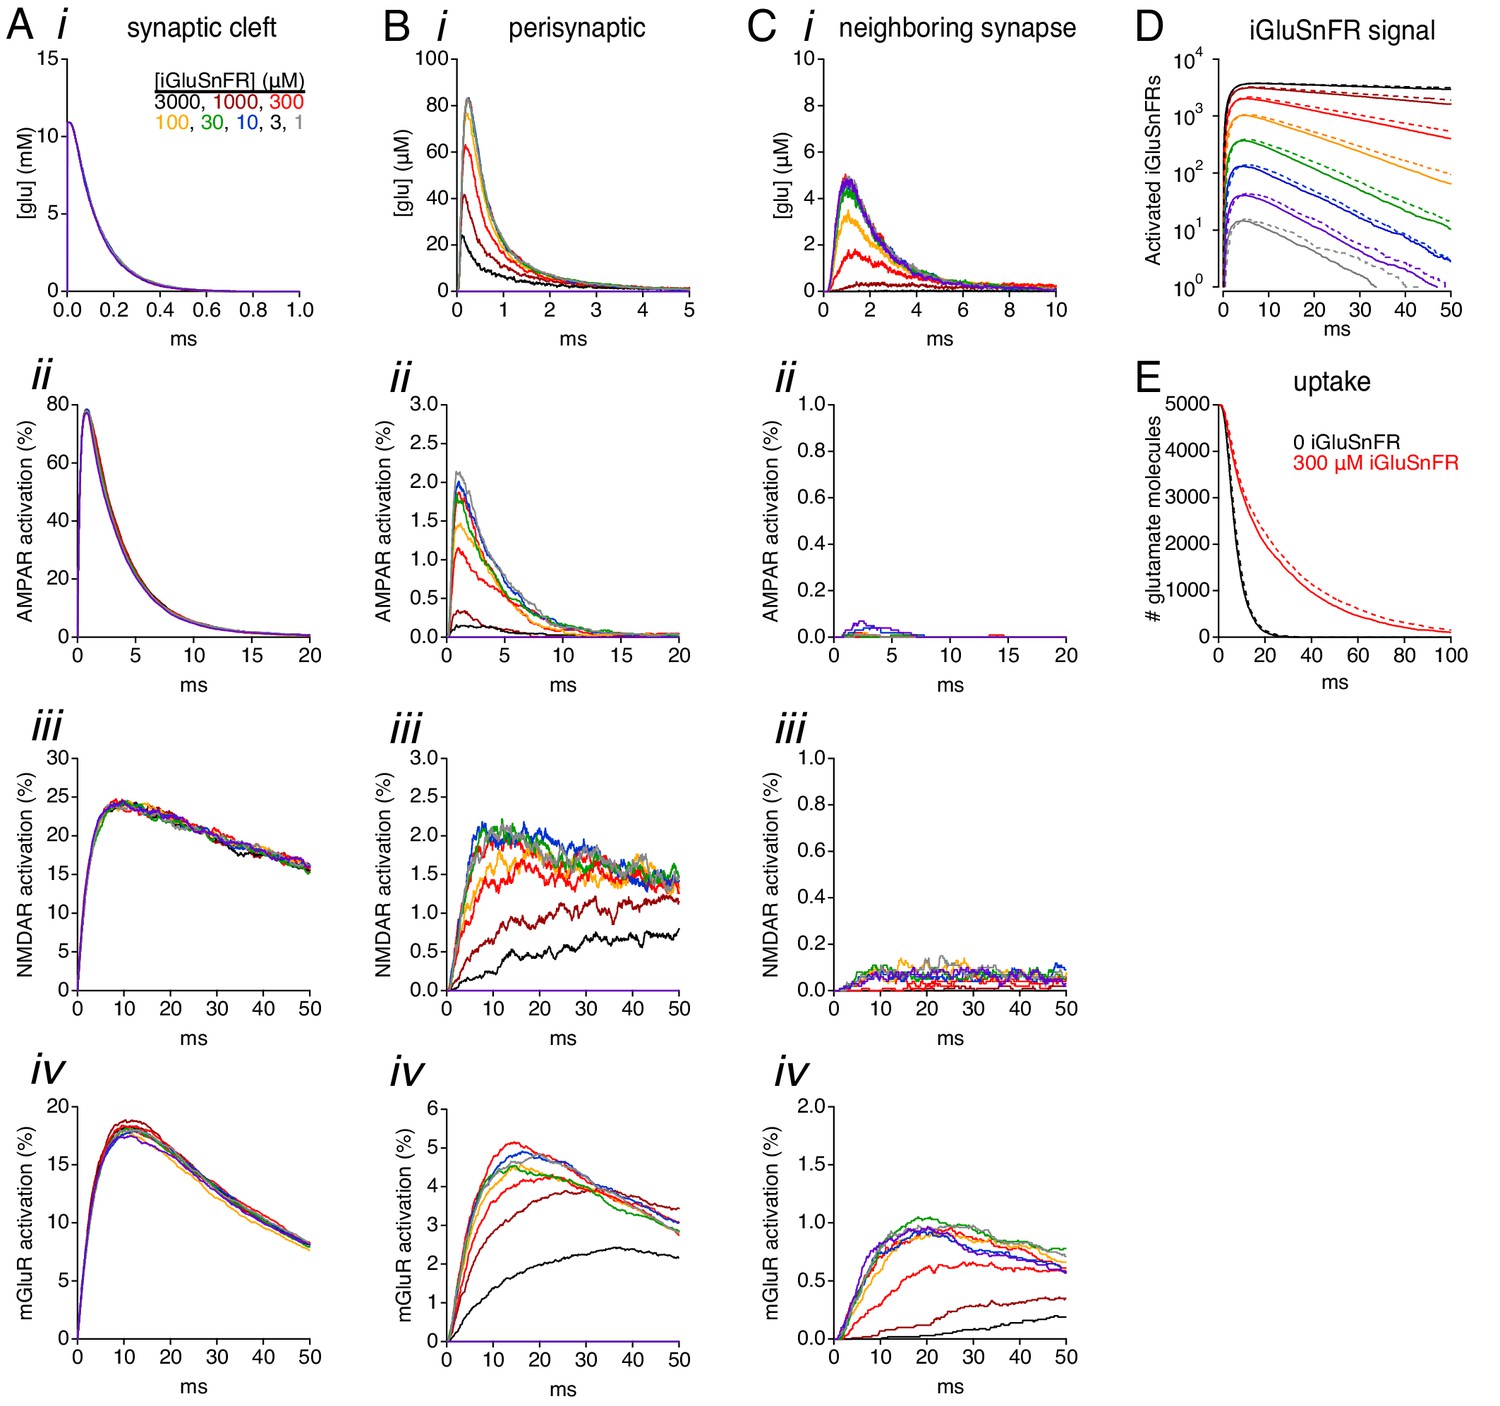
Simulations: effects of iGluSnFR on glutamate concentration and receptor activation.
(A) Simulated glutamate waveforms (i), peak glutamate concentration (ii), AMPAR activation (iii), NMDAR activation (iv) and mGluR activation (v) in the synaptic cleft (≤110 nm from the release site). Trace colors correspond to different iGluSnFR concentrations, as indicated in i. (B) As in A, but in the perisynaptic region (160–260 nm from the release site). (C) As in A, but in the extrasynaptic region 400–500 nm from the release site. (D) When iGluSnFR was also present within the synaptic cleft, it influenced cleft glutamate concentration waveforms (i) and produced sizeable signals within the cleft (ii), but did not strongly influence receptor activation within the cleft (iii-v).
-
Figure 3—source data 1
Peak free glutamate concentration as a function of iGluSnFR concentration.
Peak [glu] within the center of the synaptic cleft (110 nm) (Figure 3Aii). Peak [glu] in the perisynaptic region (160–260 nm from release site) (Figure 3Bii). Peak [glu] in a neighboring synapse (400–500 nm from release site) (Figure 3Cii).
- https://cdn.elifesciences.org/articles/54441/elife-54441-fig3-data1-v2.xlsx
Figure 3—figure supplement 1
Simulations: receptor activation and iGluSnFR signals at a lower diffusion coefficient.
(A) Simulated glutamate waveforms (i), peak glutamate concentration (ii), AMPAR activation (iii), NMDAR activation (iv) and mGluR activation (v) in the synaptic cleft (≤110 nm from the release site). Trace colors correspond to different iGluSnFR concentrations, as indicated in i. Diffusion coefficient is 5 × 10⁻⁷ cm2s−1. (B) As in A, but in the perisynaptic region (160–260 nm from the release site). (C) As in A, but 400–500 nm from the release site. (D-E) A 5-fold change in the diffusion coefficient had little effect on iGluSnFR signals (D) or the time course of glutamate uptake (E). Solid lines indicate simulations with D = 2.5 × 10⁻⁶ cm2 s−1, dashed lines indicate D = 5 × 10⁻⁷ cm2 s−1.
Figure 4
Physiological experiments: iGluSnFR expression slows uptake by cortical astrocytes.
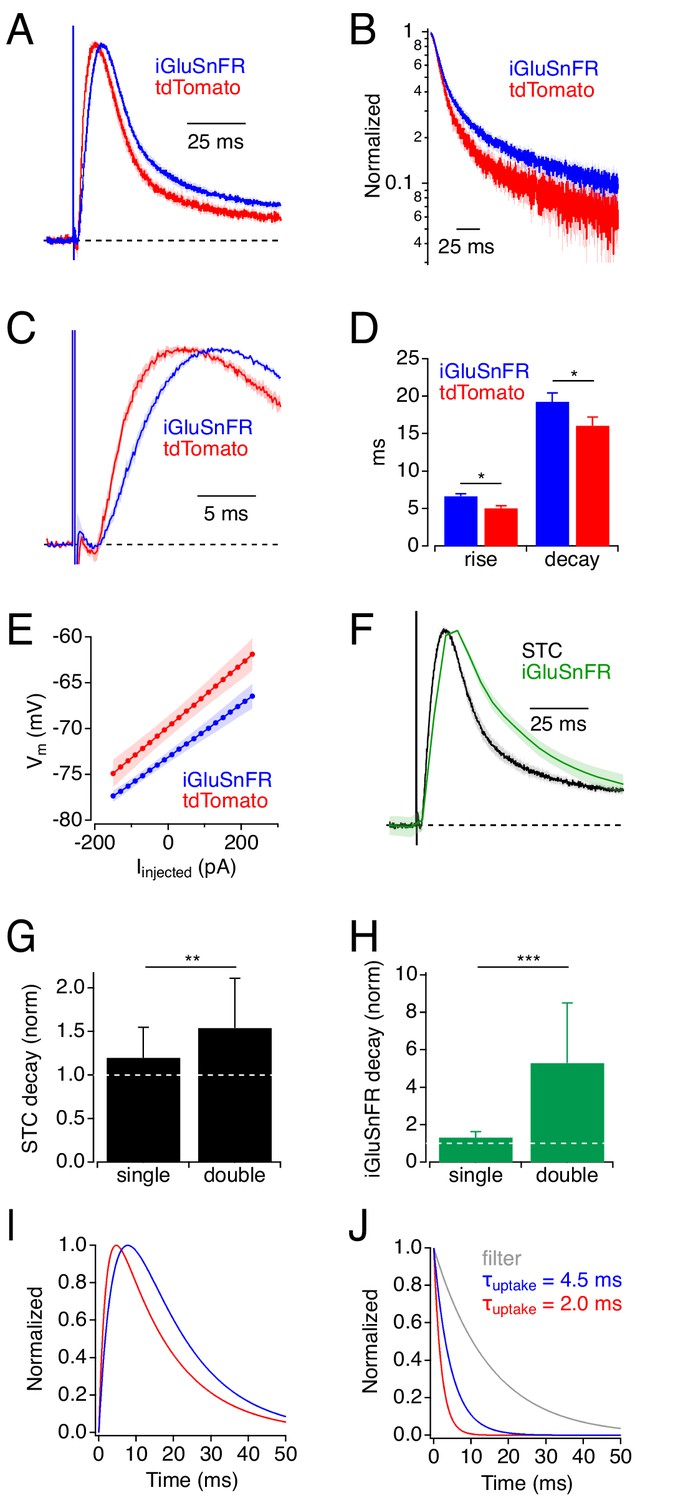
(A) Synaptic transporter currents (STCs) recorded in cortical astrocytes expressing either iGluSnFR (blue) or tdTomato (red). Traces indicate average responses (mean ± SEM; iGluSnFR: n = 21 cells; tdTomato: n = 15 cells), normalized in amplitude. (B) Responses in A, plotted on a semi-log scale. (C) Rising phases (± SEM) of the responses in A, plotted on an expanded time scale. (D) Summary data showing that STC rise and decay were slower in iGluSnFR+ astrocytes. * indicates p<0.05. (E) Astrocyte Vm (mean ± SEM), as a function of injected current, shows that iGluSnFR+ astrocytes rested at slightly more hyperpolarized potentials compared to tdTomato+ astrocytes. Input resistances (indicated by the slope of the relation) were not different in the two groups, although intercell variability diminished the statistical power of this comparison (power = 0.8 would require n = 250). (F) STCs and iGluSnFR signals measured in the same experiments (mean ± SEM, n = 10 cells). (G) Expressing iGluSnFR in both neurons and glia (‘double’) slowed STCs to a greater extent than when iGluSnFR was expressed in astrocytes only (‘single’). Asterisks indicate p=0.007 (Wilcoxon Rank test between single (n = 15) and double (n = 13)). Decay time constants normalized to average STC decay in control. (H) As in G, but showing the decays of iGluSnFR signals. Asterisks indicate p=0.0003 (Wilcoxon Rank test between single (n = 10) and double (n = 5)). (I) Simulated STC waveforms corresponding to average responses in iGluSnFR+ (blue) and tdTomato+ (red) astrocytes from panel A. (J) Waveforms used to derive STCs in I. In each case a clearance time course (red or blue) was convolved with a filter waveform (gray). This simple example demonstrates how even subtle differences in STC time course can reflect substantial differences in glutamate clearance time course (Diamond, 2005).
-
Figure 4—source data 1
STC and iGluSnFR imaging experiments.
Measured STC rise and decay values from tdTomato+ and iGluSnFR+ astrocytes (Figure 4D). Measured steady-state membrane potentials recorded under current clamp from tdTomato+ and iGluSnFR+ astrocytes (Figure 4E). STC decay data from astrocytes in singly and doubly infected slices, normalized to the average control STC decay in each case (Figure 4G). iGluSnFR signal decay data from astrocytes in singly and doubly infected slices, normalized to the average control STC decay in each case (Figure 4H).
- https://cdn.elifesciences.org/articles/54441/elife-54441-fig4-data1-v2.xlsx
Figure 5
Simulations: iGluSnFR signal time course and SNR depends on the imaging volume.
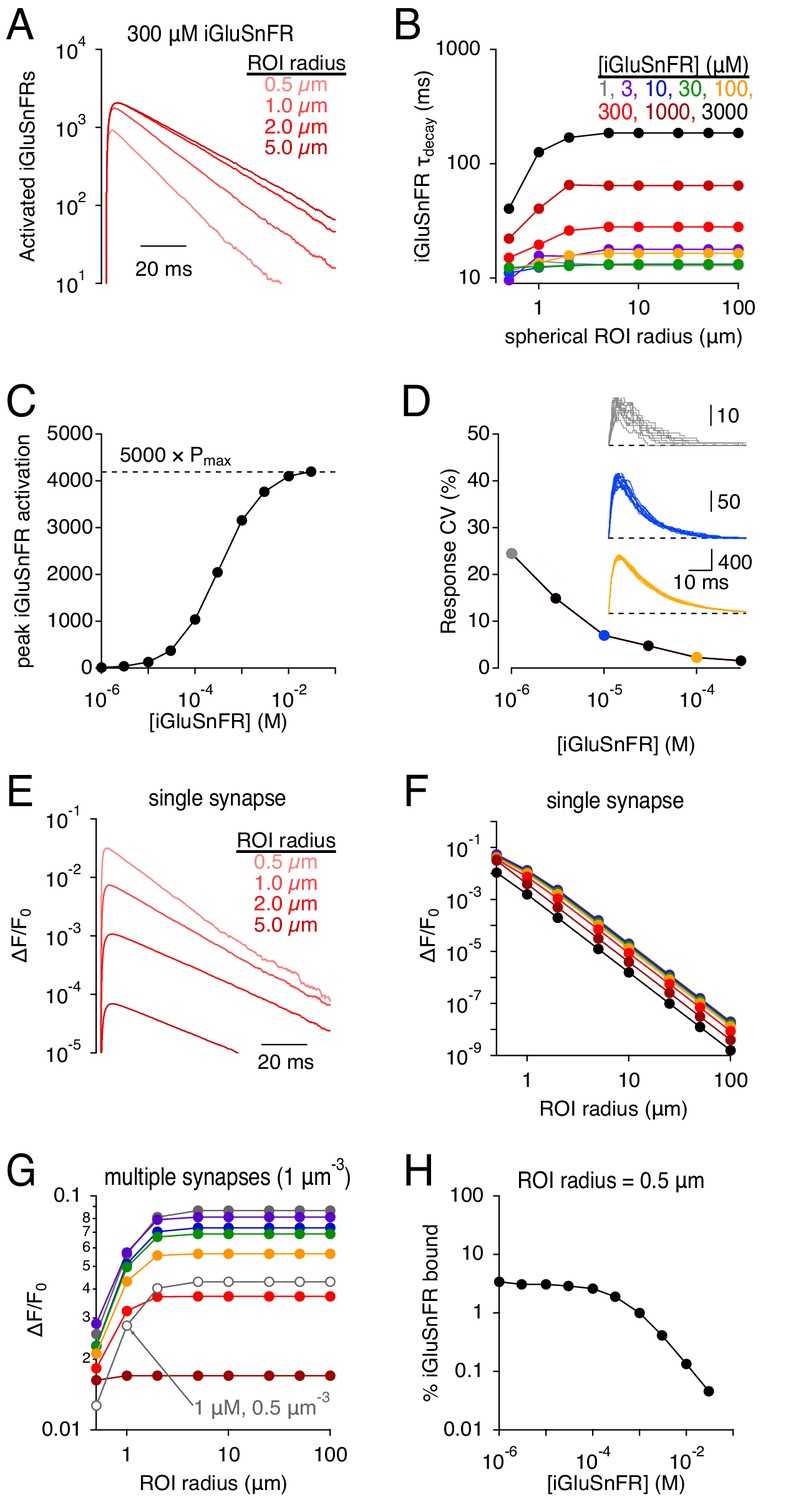
(A) iGluSnFR (300 μM) signals measured across different spherical regions of interest (ROIs). (B) Summary data shows that the dependence on ROI volume is greater at higher iGluSnFR concentrations. (C) Peak iGluSnFR response to the release of 5000 glutamate molecules as a function of iGluSnFR concentration. Dashed line indicates maximal signal based on maximal occupancy (see Figure 1B). (D) iGluSnFR signal variability decreases with indicator concentration. Inset, individual responses at three different iGluSnFR concentrations (gray, 1 μM; blue, 10 μM; orange, 100 μM). (E-F) iGluSnFR single-synapse response signal (ΔF/F0) depends on indicator concentration (E) and ROI dimensions (F). (G) iGluSnFR compound ΔF/F0 responses depend on ROI dimensions and the density of activated synapses. (H) When iGluSnFR was evenly sampled throughout even a small volume, only a small fraction of the indicator was activated by glutamate. Laser line scanning, by contrast, yields higher ΔF/F0 values (Helassa et al., 2018).
-
Figure 5—source data 1
iGluSnFR signals depend on imaging volume.
Simulated iGluSnFR signal decay time constants measured across different ROI radii and at different iGluSnFR concentrations (Figure 5B). Peak iGluSnFR signals vs. iGluSnFR concentration (Figure 5C). iGluSnFR response variability (CV) vs. iGluSnFR concentration (Figure 5D). Simulated peak iGluSnFR ΔF/F values (single synapse) across different ROI radii and at different iGluSnFR concentrations (Figure 5F). Simulated peak iGluSnFR ΔF/F values (multiple synapses) across different ROI radii and at different iGluSnFR concentrations (Figure 5G). Fraction of iGluSnFR bound within a 0.5 μm radius ROI vs. iGluSnFR concentration (Figure 5H).
- https://cdn.elifesciences.org/articles/54441/elife-54441-fig5-data1-v2.xlsx
Figure 6
Simulations: iGluSnFR distorts effects of varying uptake capacity.
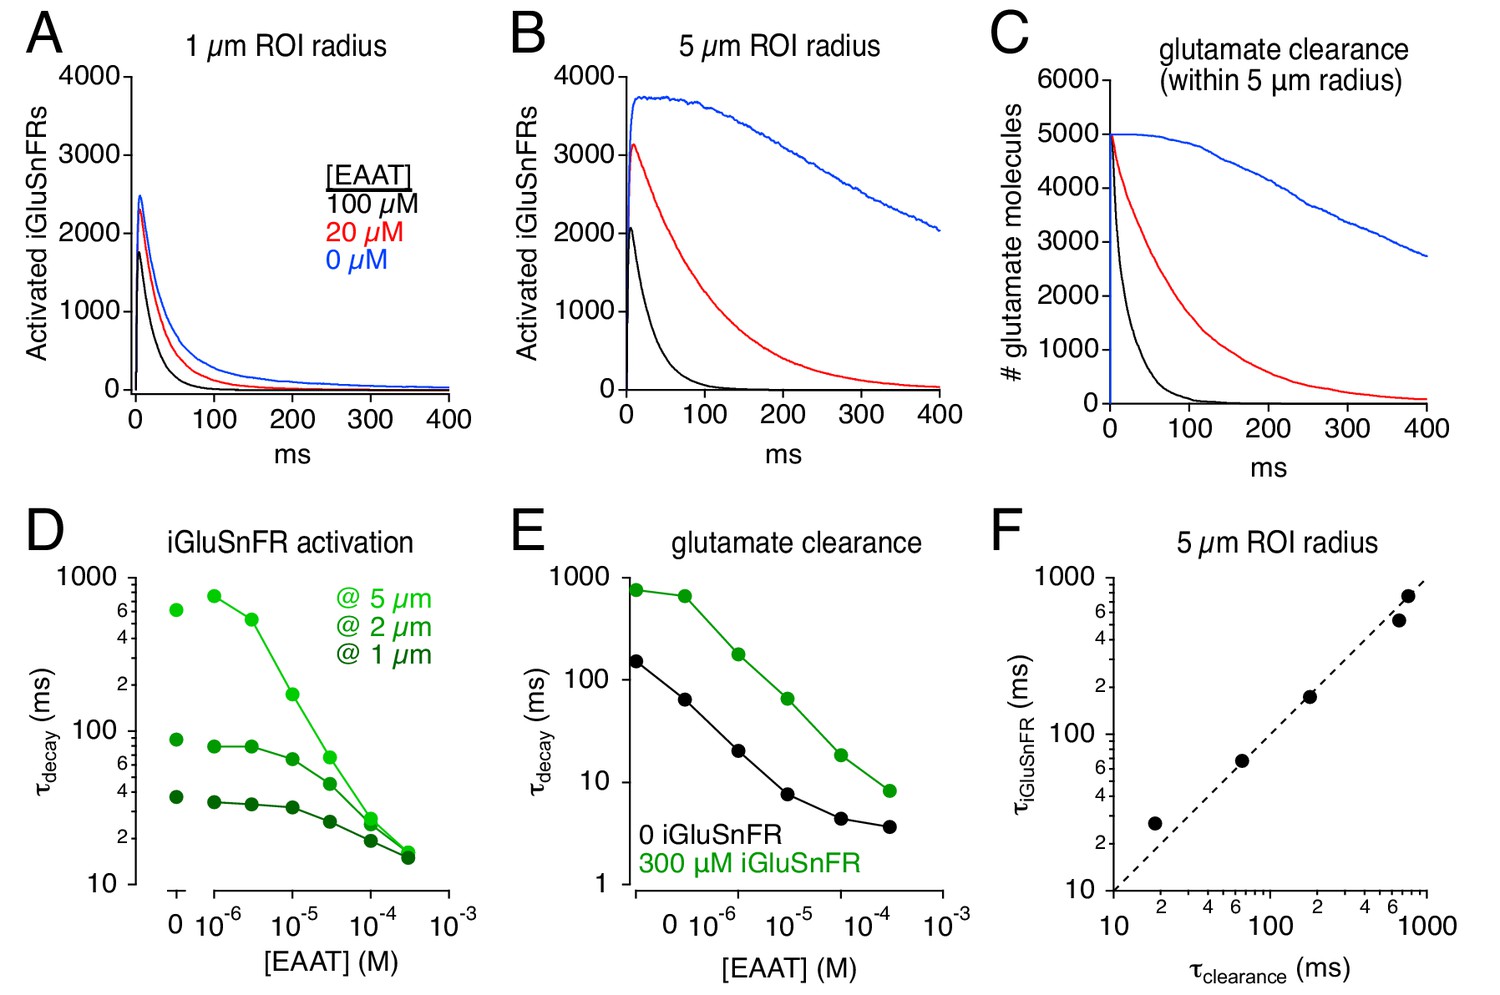
(A) iGluSnFR responses (300 μM iGluSnFR) simulated in three different EAAT concentrations. In the immediate vicinity of the synapse (1 μm ROI radius), reducing uptake capacity has little effect on iGluSnFR signal amplitude or time course. (B) As in A, but over a larger imaging volume (5 μm ROI radius), which exaggerates the effects of reducing uptake capacity. (C) Time course of glutamate clearance (uptake and diffusion beyond a 5 μm radius) in the conditions shown in A and B. (D) Summary graph showing the effects of EAAT concentration and ROI dimensions on the exponential decay time course of iGluSnFR activation. (E) The time course of glutamate clearance in the absence of indicator (black) and in the presence of 300 μm iGluSnFR (green). (F) The iGluSnFR signal measured across a 5-μm-radius ROI accurately reports the (modified) time course of glutamate clearance across a range of EAAT concentrations.
-
Figure 6—source data 1
Effects of varying [EAAT] on iGluSnFR signals.
iGluSnFR signal decay time constants over a range of EAAT concentrations at three different ROI sizes (Figure 6D). Uptake time constants over a range of EAAT concentrations with 300 μM iGluSnFR and 0 iGluSnFR (Figure 6E). Comparison of iGluSnFR signal decay (5 μm ROI) and uptake time course (Figure 6F).
- https://cdn.elifesciences.org/articles/54441/elife-54441-fig6-data1-v2.xlsx
Figure 7
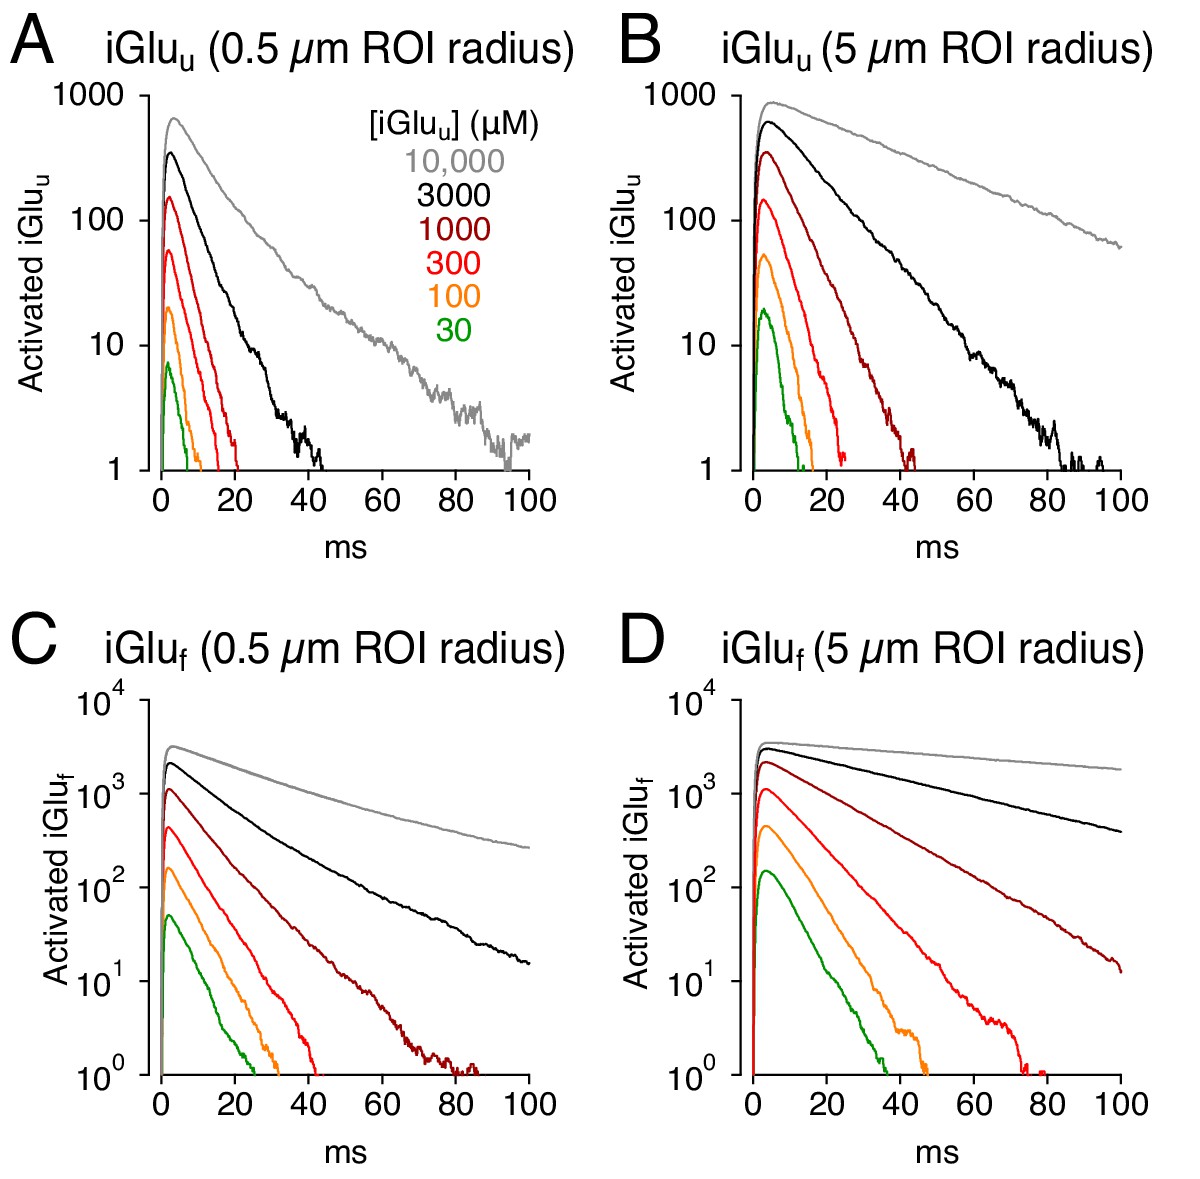
Simulations: faster glutamate indicators do not eliminate distortion.
(A) iGluu signals (0.5 μm ROI radius) simulated with different concentrations of the lower-affinity indicator. (B) As in A but over a 5 μm ROI radius. (C and D), As in A and B but with iGluf.
Figure 8 with 1 supplement
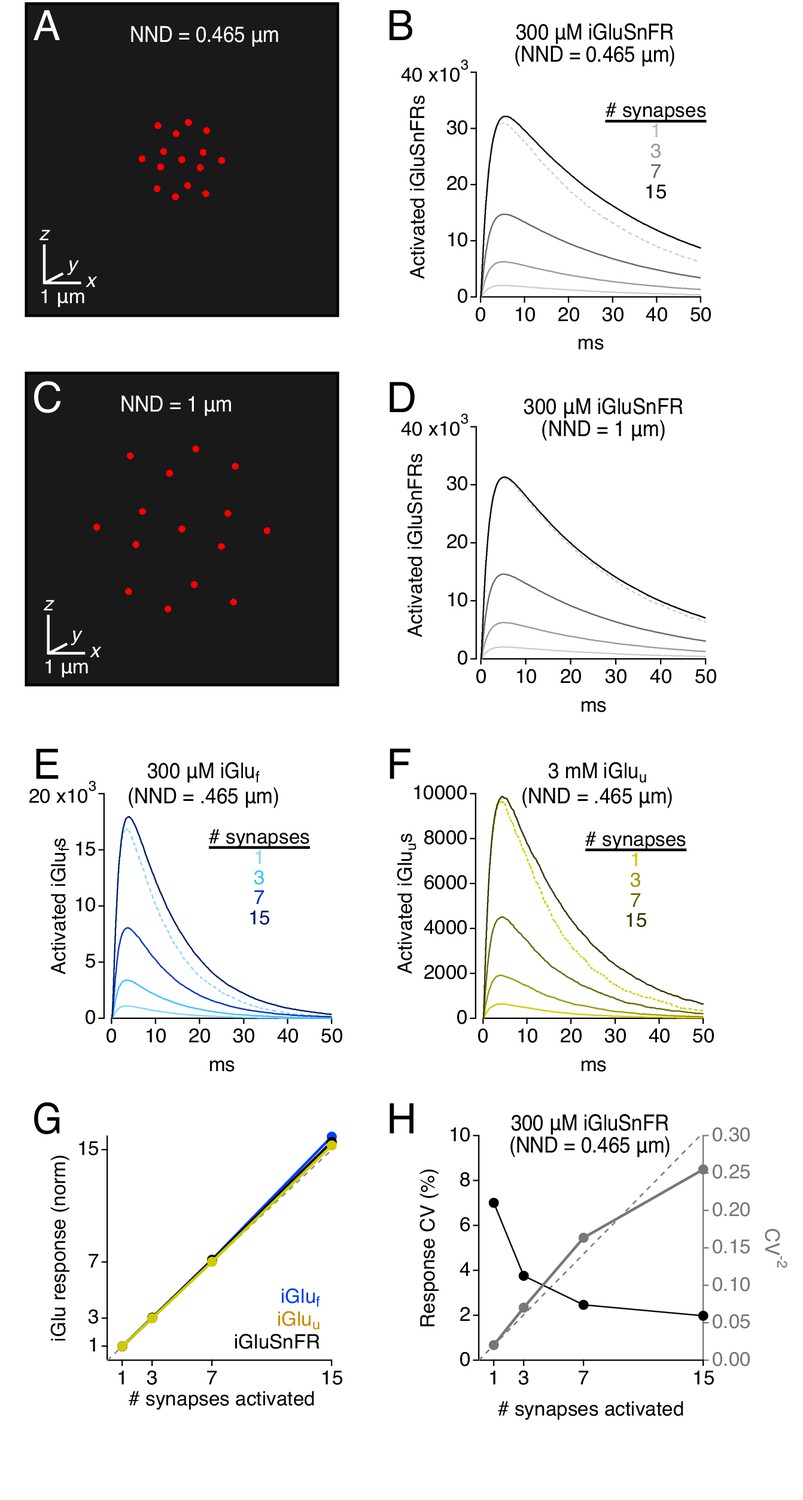
Simulations: iGluSnFR and variants provide a linear indication of synaptic release.
(A) Schematic showing 15 active synapses clustered tightly (NND = 0.465 μm) in 3D diffusion space. (B) Simulated iGluSnFR signals (300 μm iGluSnFR, 100 μm EAAT) elicited by coincident activation of 1, 3, 7, and 15 synapses (NND = 0.465 μm). Dotted gray trace shows the linear prediction for the 15-synapse case, that is the single synapse response multiplied by 15. (C and D) As in A and B, but NND = 1 μm. (E) As in B but for simulated iGluf-mediated signals. (F) As in B but for simulated iGluu-mediated signals. (G) Summary graph showing that iGlu signals provide a linear indication of synaptic release, even when NND = 0.465. (H) iGluSnFR response variability (CV) also provides a reliable indication of relative numbers of activated synapses (see Faber and Korn, 1991).
-
Figure 8—source data 1
Multi-synapse simulations.
Peak indicator responses, normalized to the single synapse response, for iGluSnFR, iGluf, and iGluu (Figure 8G). Response variability (CV, 1/CV2), versus the number of activated synapses (Figure 8H). Comparison of iGluSnFR response amplitude over a range of ROIs with and without an explicit synaptic structure (Figure 8—figure supplement 1B). Comparison of iGluSnFR response decay over a range of ROIs with and without an explicit synaptic structure (Figure 8—figure supplement 1C).
- https://cdn.elifesciences.org/articles/54441/elife-54441-fig8-data1-v2.xlsx
Figure 8—figure supplement 1
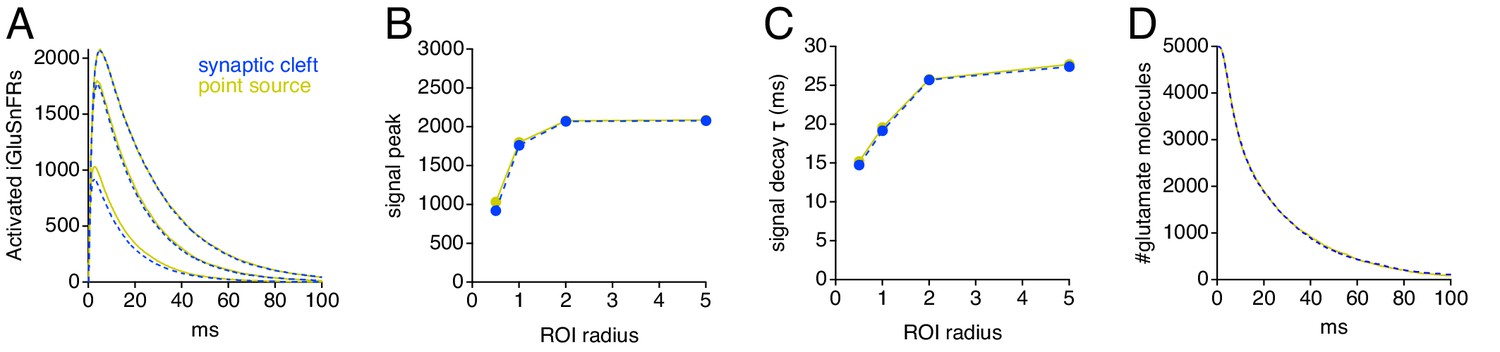
Simulations: including the synaptic cleft has little effect on simulated iGluSnFR time courses.
(A) Simulated iGluSnFR signals in a radially symmetric model that either included (blue) or excluded (gold) a 320-nm-diameter synaptic cleft. (B) Summary of amplitudes of simulated iGluSnFR signals with and without an explicitly modeled synaptic cleft. (C) As in B but showing exponential decay times. (D) Comparison of glutamate uptake time course.
Figure 9
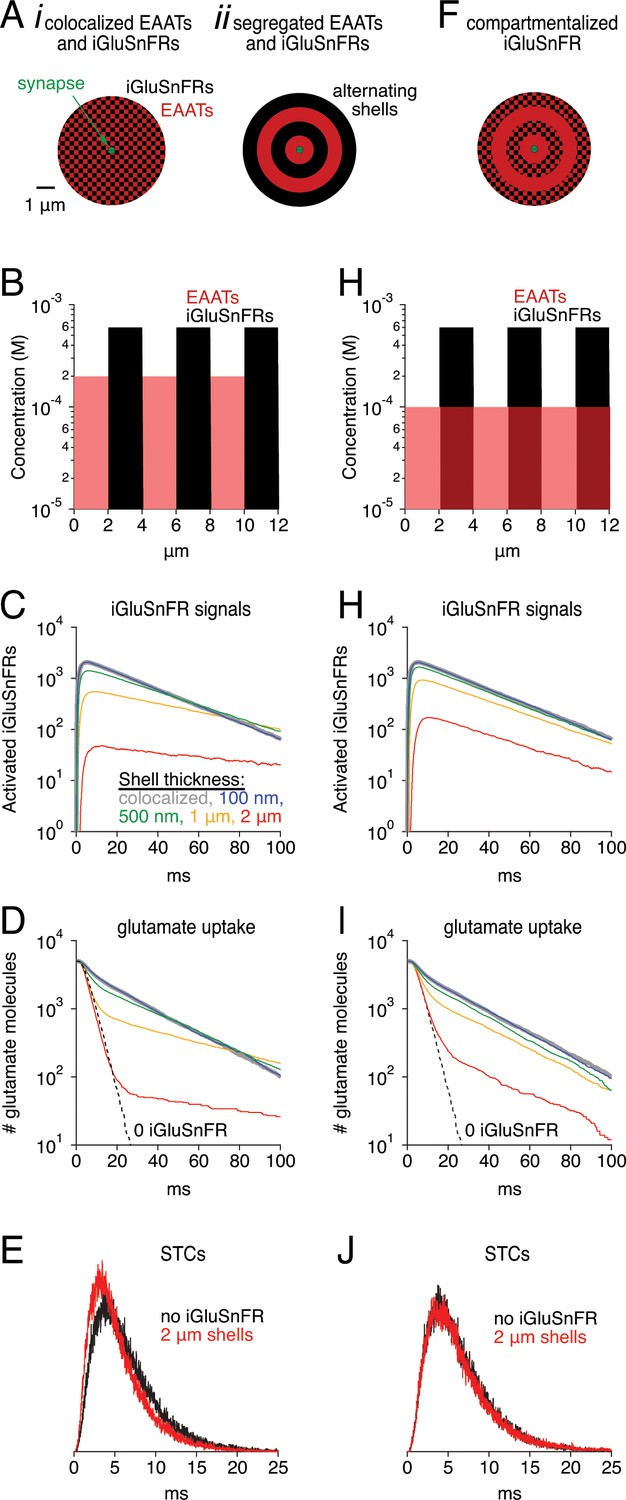
Simulations: Segregated expression reduces buffering effects.
(A) Schematics of simulation in which EAATs and iGluSnFRs were colocalized (i), or segregated into alternating spherical shells surrounding the synapse, with EAATs occupying the innermost shell (ii). (B) Concentration profile of EAATs and iGluSnFRs in the 2 μm shell case. In each case, the average EAAT and iGluSnFR concentrations were 100 μM and 300 μM, respectively. (C) Simulated iGluSnFR signal wave forms at four different shell thicknesses. (D) Glutamate clearance time courses in the same simulations described in C. (E) Simulated synaptic transporter currents (STCs) in the 2 μm shell condition and in the absence of iGluSnFR. (F-J) As in Aii-E, except that EAATs were distributed evenly throughout all shells.
Figure 10
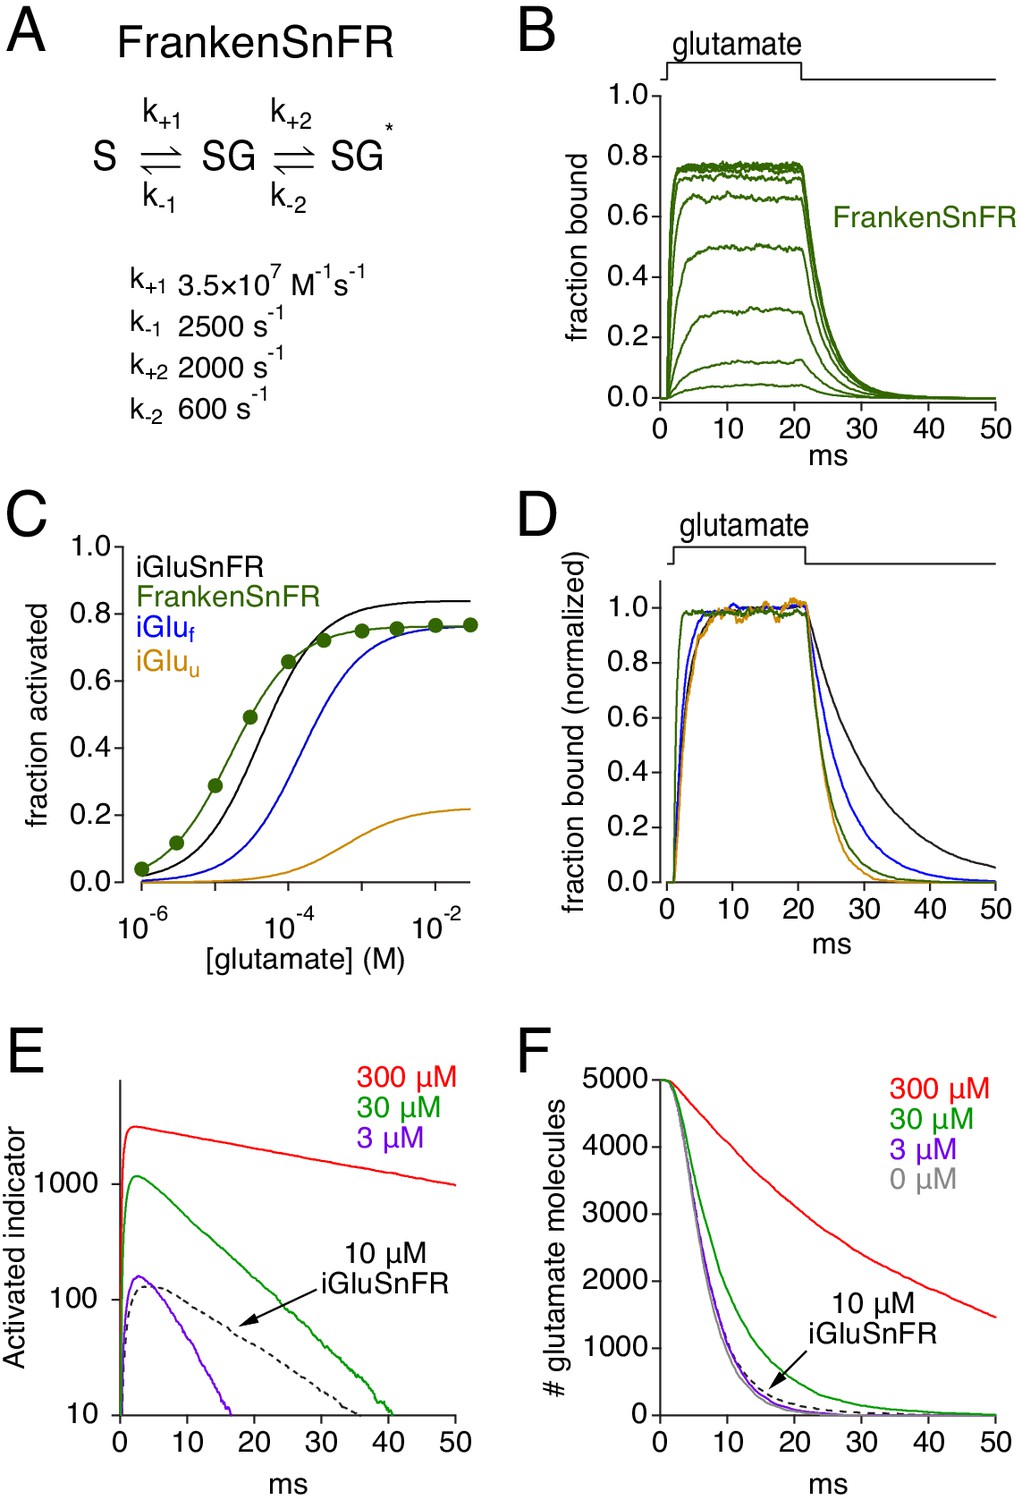
Simulations: characteristics of a theoretically ideal glutamate indicator.
(A) Rate constants used to create FrankenSnFR, a hypothetical glutamate indicator. (B) Simulated FrankenSnFR activation by 20 ms applications of glutamate (concentrations varied logarithmically from 1 μM to 30 mM). (C) Comparison of simulated glutamate dose-response curves for iGluSnFR (black), iGluf (blue), iGluu (gold) and FrankenSnFR (green). (D) Responses of indicators (same color scheme as C) to 1 mM glutamate, normalized and superimposed to compare activation and deactivation kinetics. (E) Simulated FrankenSnFR responses (three different concentrations, spherical ROI radius = 10 μm) to the synaptic release of 5000 glutamate molecules. Response of 10 μM iGluSnFR shown for comparison (dashed black trace). (F) Glutamate uptake time course in the simulations shown in E, as well as clearance in the absence of any indicator (gray).
-
Figure 10—source data 1
| FrankenSnFR simulations.
Steady-state simulated responses of FrankenSnFR to different glutamate concentrations (Figure 10C).
- https://cdn.elifesciences.org/articles/54441/elife-54441-fig10-data1-v2.xlsx
Tables
Key resources table
| Reagent type (species) or resource | Designation | Source or reference | Identifiers | Additional information |
|---|---|---|---|---|
| Strain, strain backgroundMus musculus | C57Bl/6J | Jackson Labs or in-house colony | Stock: 000664 | |
| Recombinant DNA reagent | AAV5-GFAP-iGluSnFr | Addgene/University of Pennsylvania Vector Core | Addgene: 98930-AAV5 Penn: AV-5-PV2723 | |
| Recombinant DNA reagent | AAV5-GfaABC1D-tdtomato | Addgene/University of Pennsylvania Vector Core | Addgene: 44332-AAV5 Penn: AV-5-PV3106 | |
| Recombinant DNA reagent | AAV1-hSyn-EGFP | Addgene | Cat# 50465-AAV1 | |
| Recombinant DNA reagent | AAV1-hSyn-iGluSnFr | Addgene | Cat# 98929-AAV1 | |
| Chemical compound, drug | Sulforhodamine 101 (SR-101) | Sigma | Cat# S7635-50MG | Aqueous Stock: 0.5 mM Working: 0.5 µM |
| Chemical compound, drug | DNQX | Tocris | Cat# 189 | DMSO Stock: 20 mM Working: 20 µM |
| Chemical compound, drug | AP5 | Abcam | Cat# ab120003 | Aqueous Stock: 50 mM Working: 50 µM |
| Chemical compound, drug | Gabazine/SR95531 | Tocris | Cat# 1262 | Aqueous Stock:10 mM Working: 10 µM |
Additional files
-
Source code 1
Matlab code for radially symmetric diffusion simulations of release from a single synapse.
Simulated random walk diffusion of neurotransmitter molecules from the center of a synaptic cleft surrounded by radially symmetric, isotropic three-dimensional extrasynaptic space. User can vary cleft dimensions, the number of transmitter molecules released, iGluSnFR subtype and concentration, EAAT concentration, etc. Provides graphical updates of simulation progress and writes output files. Allows multiple trials to be averaged together.
- https://cdn.elifesciences.org/articles/54441/elife-54441-code1-v2.zip
-
Source code 2
Matlab code for radially symmetric diffusion simulations of release fom multiple synapses.
Simulated random walk diffusion of neurotransmitter molecules from a variable number of point sources located within isotropic extrasynaptic space. Space is represented in cartesian coordinates, and diffusion distance is measured from each release point. User can vary the number and location of synapses, the number of transmitter molecules released, iGluSnFR subtype and concentration, EAAT concentration, etc. Provides graphical updates of simulation progress and writes output files. Allows multiple trials to be averaged together.
- https://cdn.elifesciences.org/articles/54441/elife-54441-code2-v2.zip
-
Transparent reporting form
- https://cdn.elifesciences.org/articles/54441/elife-54441-transrepform-v2.docx
Download links
A two-part list of links to download the article, or parts of the article, in various formats.
Downloads (link to download the article as PDF)
Open citations (links to open the citations from this article in various online reference manager services)
Cite this article (links to download the citations from this article in formats compatible with various reference manager tools)
Effects of fluorescent glutamate indicators on neurotransmitter diffusion and uptake
eLife 9:e54441.
https://doi.org/10.7554/eLife.54441


