Dissecting the phenotypic and functional heterogeneity of mouse inflammatory osteoclasts by the expression of Cx3cr1
- Laboratoire de PhysioMédecine Moléculaire, CNRS, France
- Université Côte d’Azur, France
- Department of Pharmacy, Cardenal Herrera-CEU University, Spain
- Laboratory of Immune Cell Biology, Center for Cancer Research, National Cancer Institute, National Institutes of Health, United States
- Université Paris-Saclay, UVSQ, INSERM, Infection et inflammation, France
- IRMB, Univ Montpellier, INSERM, CHU Montpellier, France
- Genetics division, Ambroise Paré Hospital, AP-HP, France
Figures
Figure 1 with 2 supplements
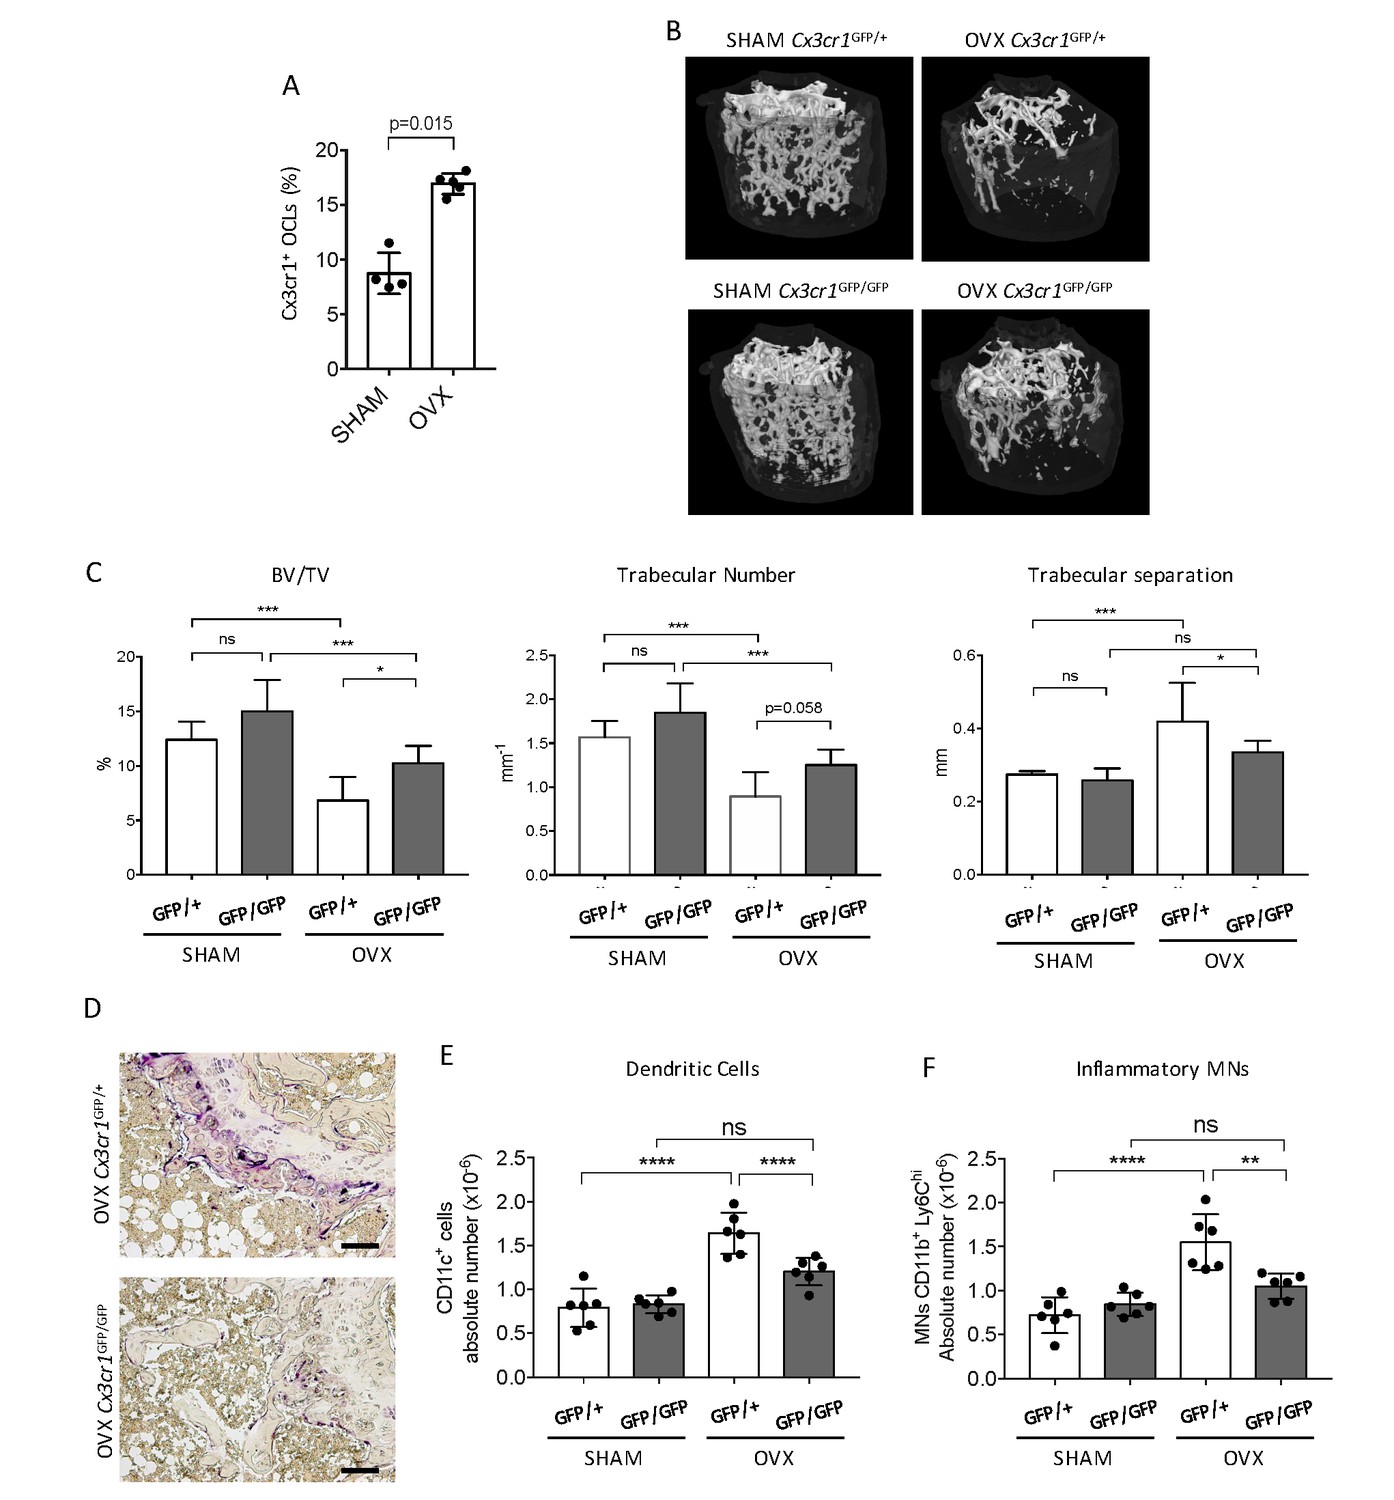
Cx3cr1-deficient mice display reduced bone loss after ovariectomy.
(A) FACS analysis of Cx3cr1+ OCLs generated from BM cells from SHAM-operated and OVX WT mice. Histograms indicate the mean ± SD percentage of Cx3cr1+ i-OCLs (n = 4–5). (B) Representative images of femur µCT analysis from SHAM-operated and OVX WT Cx3cr1GFP/+ and Cx3cr1-deficient Cx3cr1GFP/GFP mice 6 weeks post-surgery. (C) Histograms show the mean ± SD percentage of bone volume fraction (BV/TV), trabecular number and trabecular separation (n = 8 mice per group). (D) Representative TRAcP staining on femora from OVX Cx3cr1GFP/+ and Cx3cr1GFP/GFP mice. Scale bar = 100 µm. (E) Ex vivo FACS analysis of CD11c+ DCs and (F) CD11b+Ly6Chi MNs present in the BM of SHAM and OVX mice. Cells were gated as in Figure 1—figure supplement 2 and histograms are showing the absolute cell number of these populations in the bone marrow. **p<0.01; ***p<0.001; n.s., no significant difference.
Figure 1—figure supplement 1
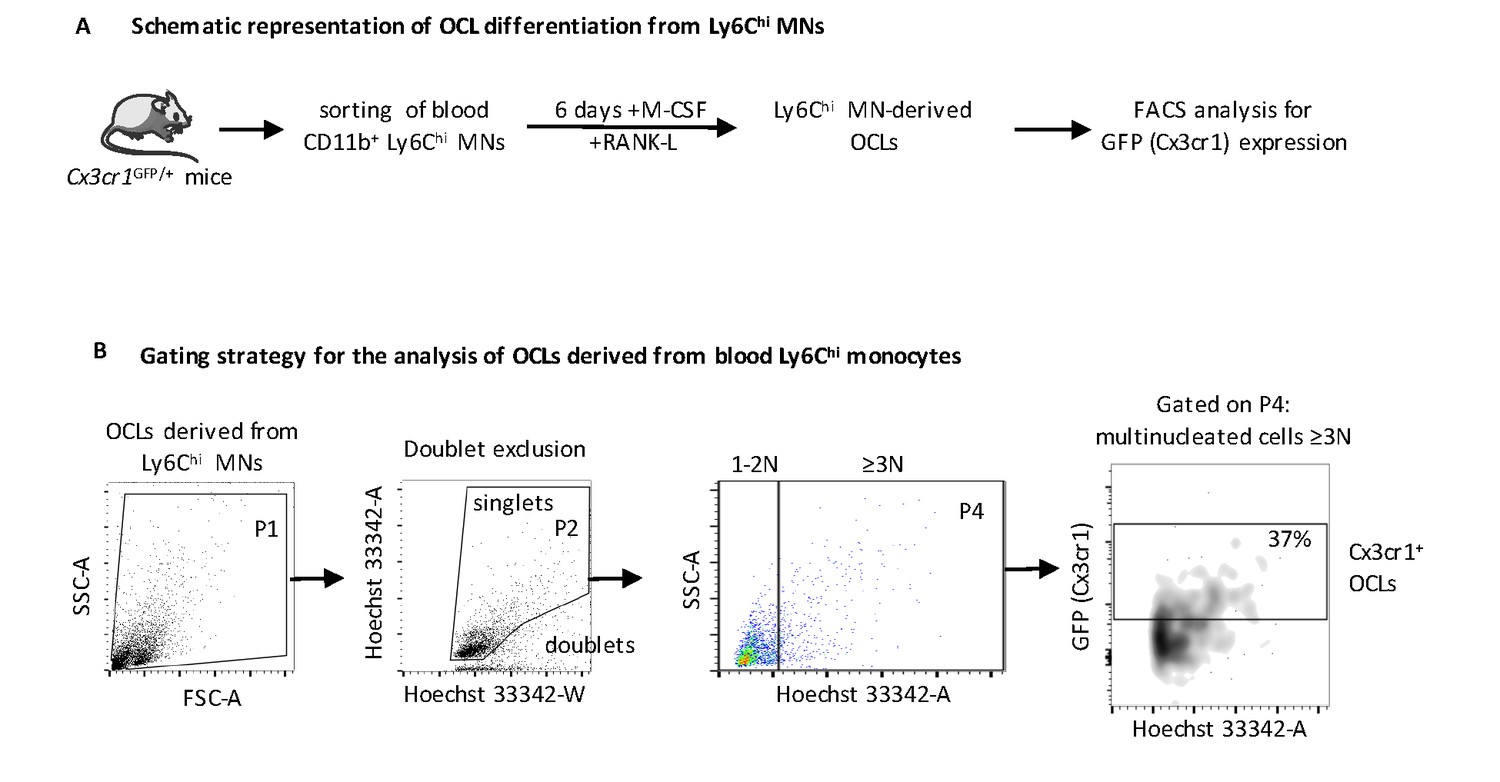
Analysis of i-OCLs progenitors in OVX mice.
(A) Schematic representation of the differentiation of OCLs from blood CD11b+Ly6Chi monocytes from WT Cx3cr1GFP/+ mice (B) FACS analysis on these CD11b+ Ly6Chi MNs-derived OCLs using Hoechst 33342-A staining revealed that GFP+ (Cx3cr1+) OCLs differentiate efficiently from CD11b+ Ly6Chi MNs. OCLs were gated as cells having three nuclei and more (≥3N) as described previously (Madel et al., 2018).
Figure 1—figure supplement 2
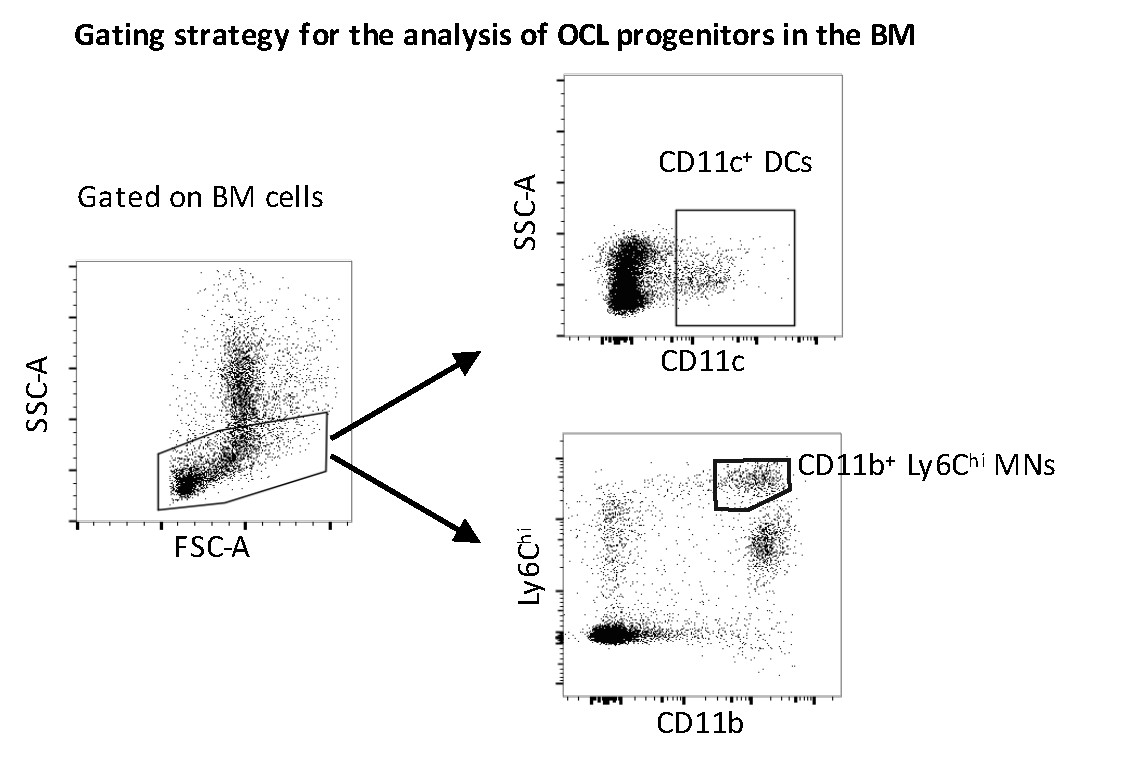
Gating strategy for ex vivo FACS analysis.
Gating strategy for ex vivo FACS analysis of bone marrow DCs and inflammatory monocytes in SHAM and OVX mice.
Figure 2 with 2 supplements
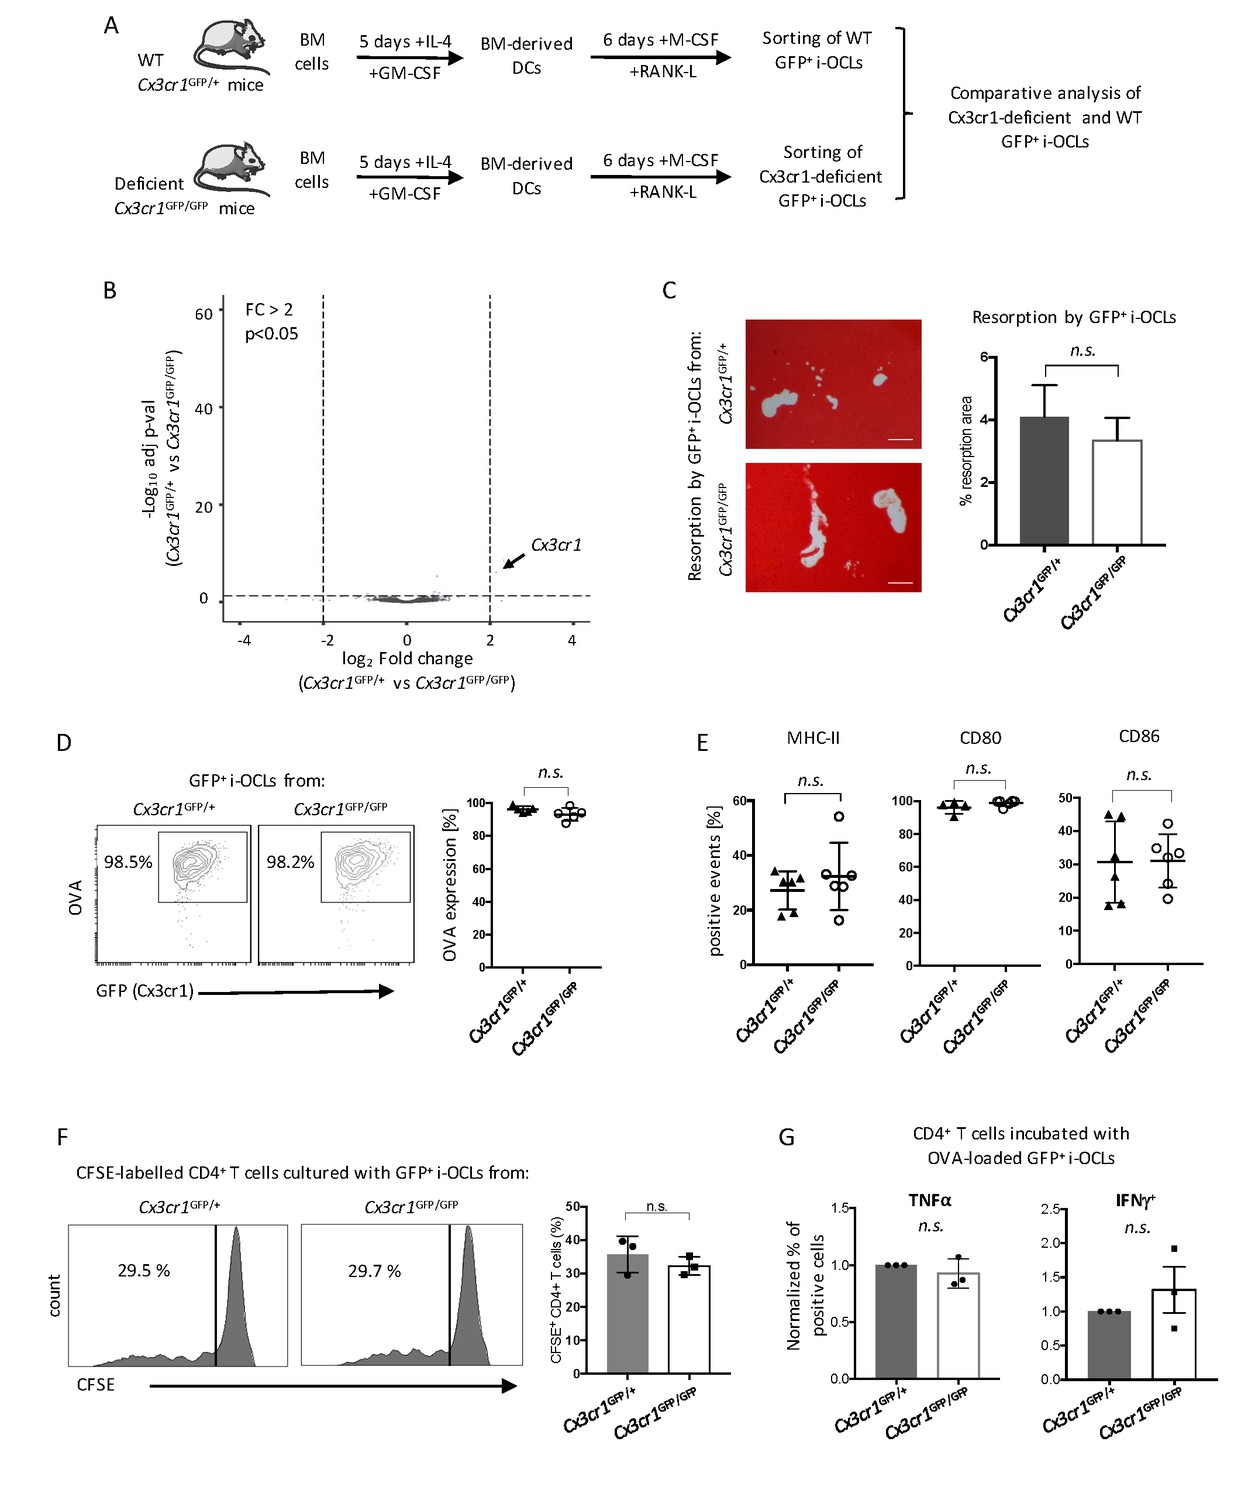
Cx3cr1 deficiency does not affect resorption and immune function in Cx3cr1+ i-OCLs.
(A) Schematic representation of the differentiation of i-OCLs from BM-derived DCs of WT Cx3cr1GFP/+ and Cx3cr-deficient Cx3cr1GFP/GFP mice. (B) RNA-seq analysis on sorted GFP+ i-OCLs (representing Cx3cr1+ i-OCLs) differentiated from BM-derived DCs of WT Cx3cr1GFP/+ and Cx3cr-1deficient Cx3cr1GFP/GFP mice (gated as in Figure 2—figure supplement 1). Volcano-plot indicates –Log10 adjusted p value versus log2 fold-change comparing gene expression in i-OCL subsets. (C) Matrix dissolution activity of sorted GFP+ i-OCLs from WT Cx3cr1GFP/+ and Cx3cr1-deficient Cx3cr1GFP/GFP mice seeded at the same cell density on a calcified matrix was evidence by red alizarin staining of the mineralized matrix. Unstained areas correspond to the resorbed areas. Left panel: representative images of resorbed area. Scale bar = 100 µm. Right panel: quantification of resorbed areas presented as mean ± SD percentage of three independent biological replicates each in triplicates. (D) FACS analysis of fluorescent-OVA uptake among GFP+ i-OCLs from Cx3cr1GFP/+ and Cx3cr1GFP/GFP mice. Left panel: representative density plots and right panel: percentage of OVA+ cells from five independent experiments. (E) FACS analysis of GFP+ i-OCLs from Cx3cr1GFP/+ and Cx3cr1GFP/GFP mice in at least four independent experiments. (F) T cell proliferation assay on CD4+ T cells labelled with CFSE and cultured in the presence of OVA-challenged GFP+ i-OCLs differentiated from Cx3cr1GFP/+ and Cx3cr1GFP/GFP mice and analyzed by FACS after 4 days of coculture. (G) CD4+ T cells activated by OVA-challenged GFP+ i-OCLs from Cx3cr1GFP/+ and Cx3cr1GFP/GFP mice were analyzed for their expression of TNFα and IFNγ by FACS after intracytoplasmic staining of these cytokines. n.s., no significant difference.
Figure 2—figure supplement 1
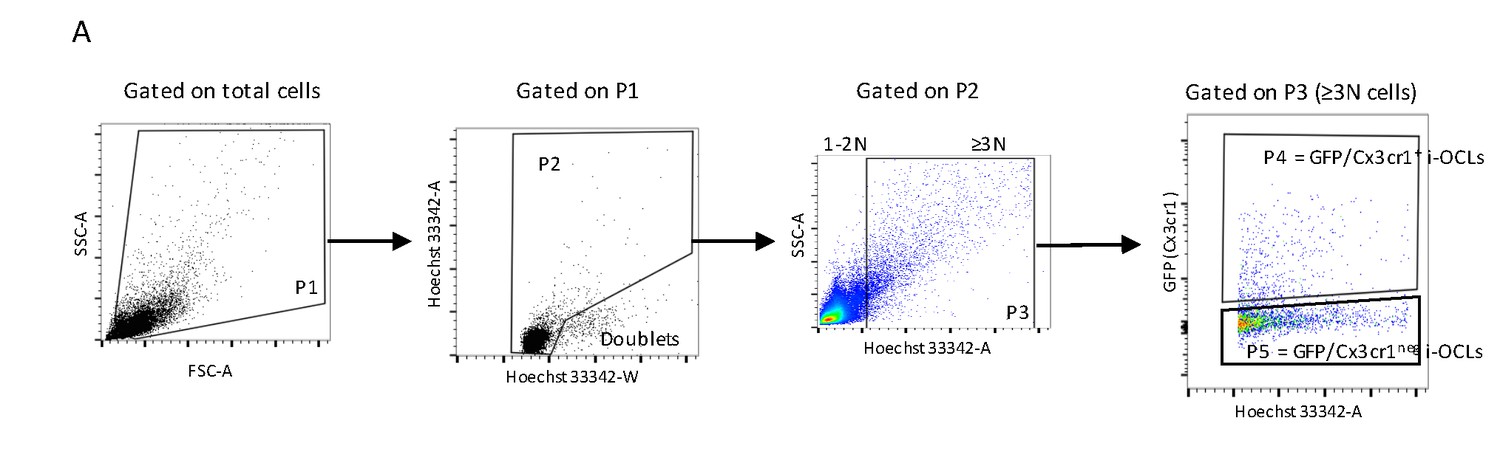
Gating strategy for mature Cx3cr1+ and Cx3cr1neg i-OCLs.
(A) Gating strategy for the analysis and sorting of mature GFP+ (Cx3cr1+) and GFPneg (Cx3cr1neg) i-OCLs using flow cytometry. After gating on total cells, doublets were excluded and cells with ≥3 nuclei (≥3N) cells were considered as OCLs and distinguished from 1 to 2 nucleated (1–2N) cells based on their Hoechst 33342 staining level. OCLs were analyzed based on their GFP expression and GFP+ (Cx3cr1+) and GFPneg (Cx3cr1neg) i-OCLs were sorted.
Figure 2—figure supplement 2
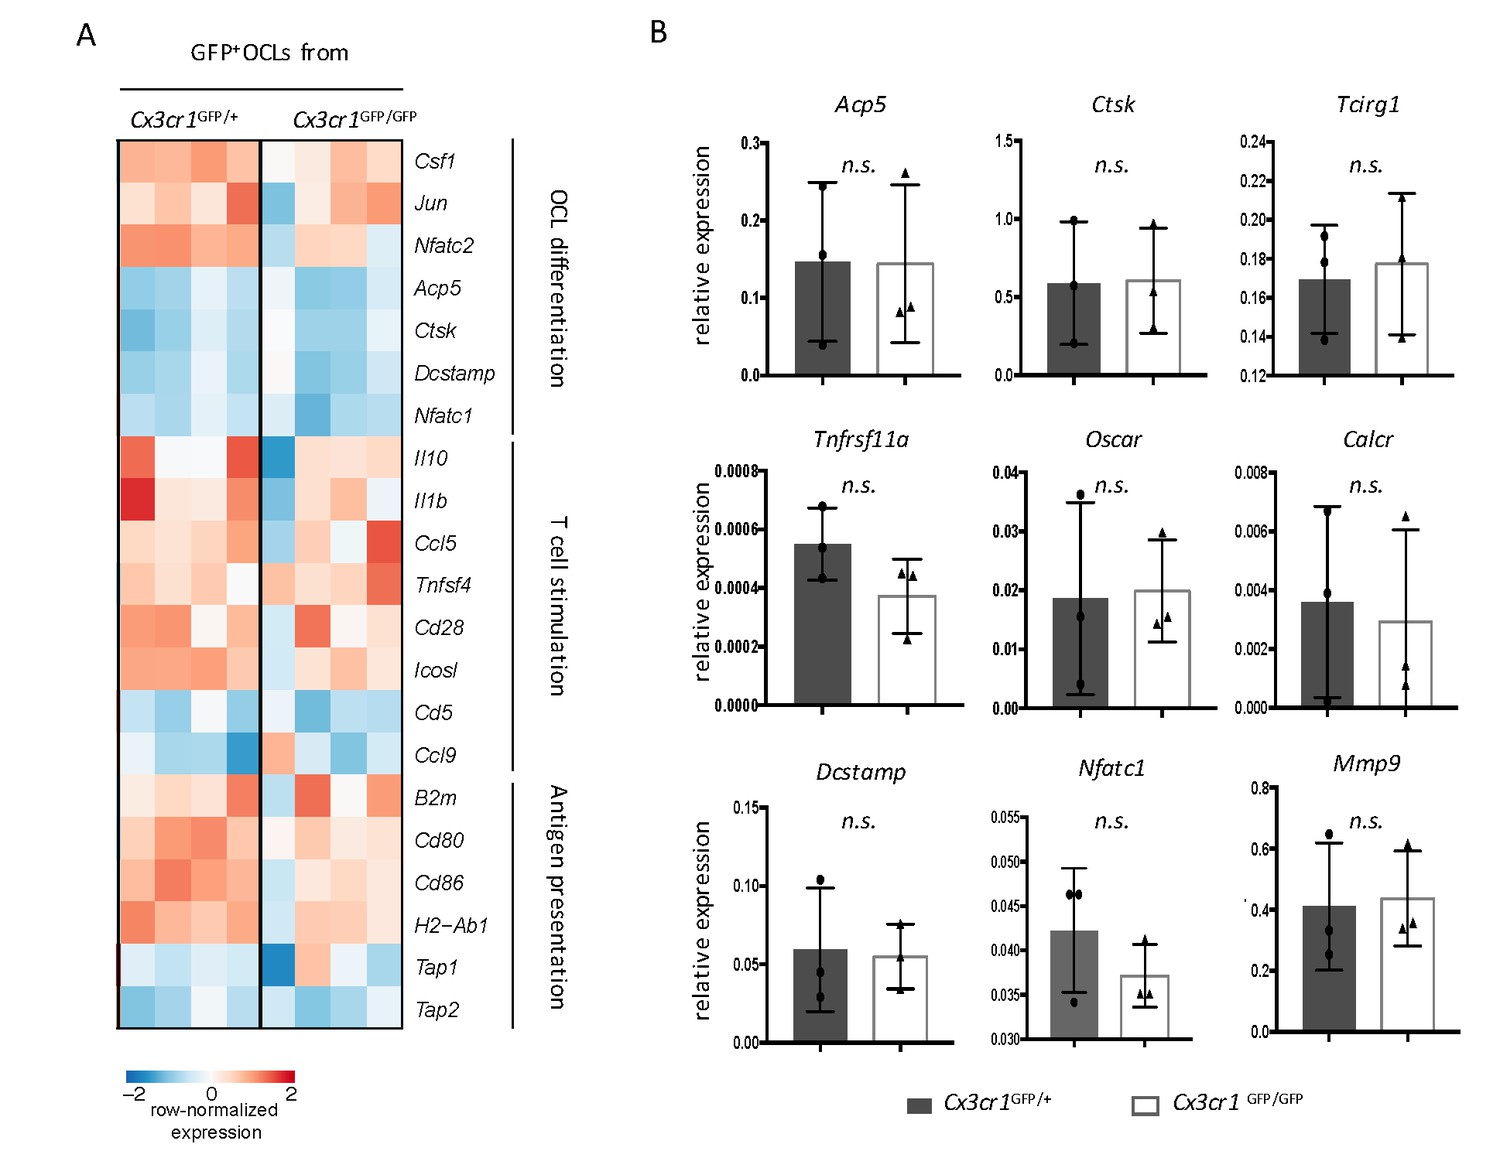
Comparative transcriptomic analysis of Cx3cr1+ i-OCLs from Cx3cr1GFP/GFP and Cx3cr1GFP/+ mice.
(A) Comparative RNA-seq analysis between GFP+ (Cx3cr1+) i-OCLs from KO Cx3cr1GFP/GFP and WT Cx3cr1GFP/+ mice. Heatmap visualization of the z-scored expression for selected genes involved in OCL differentiation, T cell stimulation and antigen presentation. (B) Relative mRNA expression of GFP+ (Cx3cr1+) i-OCLs from KO Cx3cr1GFP/GFP and WT Cx3cr1GFP/+ mice. Results are represented as the mean with 95% confidence interval of three independent biological replicates conducted in triplicates. n.s., no significant difference.
Figure 3 with 1 supplement
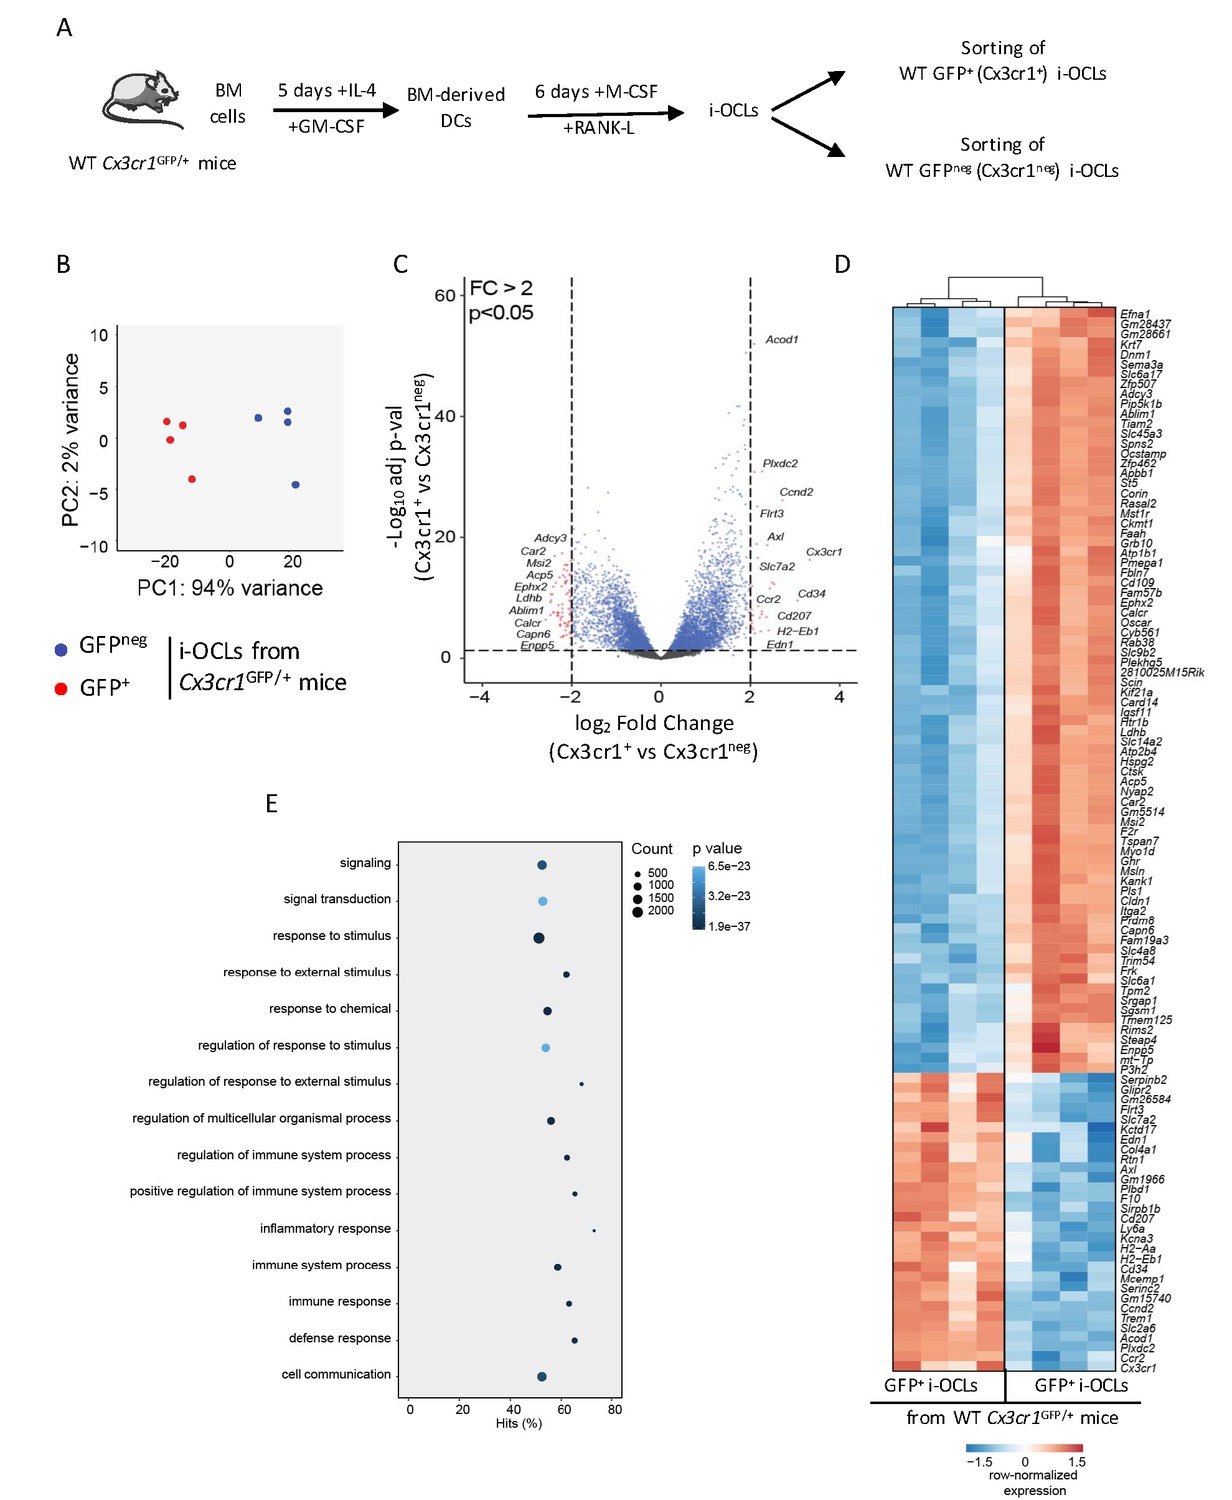
Transcriptomic profiling of Cx3cr1+ and Cx3cr1neg i-OCLs reveals two distinct populations of i-OCLs.
(A) Schematic representation of the differentiation of GFP+ (Cx3cr1+) and GFPneg (Cx3cr1neg) i-OCLs from BM-derived DCs of WT Cx3cr1GFP/+ mice and their sorting (gated as in Figure 2—figure supplement 1). (B) Principal component analysis of Cx3cr1+ and Cx3cr1neg i-OCLs clusters samples in two groups (red: GFP+ (Cx3cr1+) OCLs and blue GFPneg (Cx3cr1neg) OCLs, both from Cx3cr1GFP/+ mice). Data shows the two first components on the top 500 most differentially expressed genes after batch correction. Each dot represents the expression profile of one sample. (C) Volcano-plot showing representative differentially expressed genes for Cx3cr1+ and Cx3cr1neg i-OCLs. Cut-off values were defined by a fold change (FC) >2 and an adjusted p-value<0.05. (D) Heatmap visualization of the top 107 genes significantly differentially expressed between GFP+ (Cx3cr1+) and GFPneg (Cx3cr1neg) i-OCLs from Cx3cr1GFP/+ mice (adjusted p-value<0.05, FC ≥2). (E) Graphical representation of gene ontology analysis associated with differentially expressed genes between Cx3cr1+ and Cx3cr1neg i-OCLs.
Figure 3—figure supplement 1
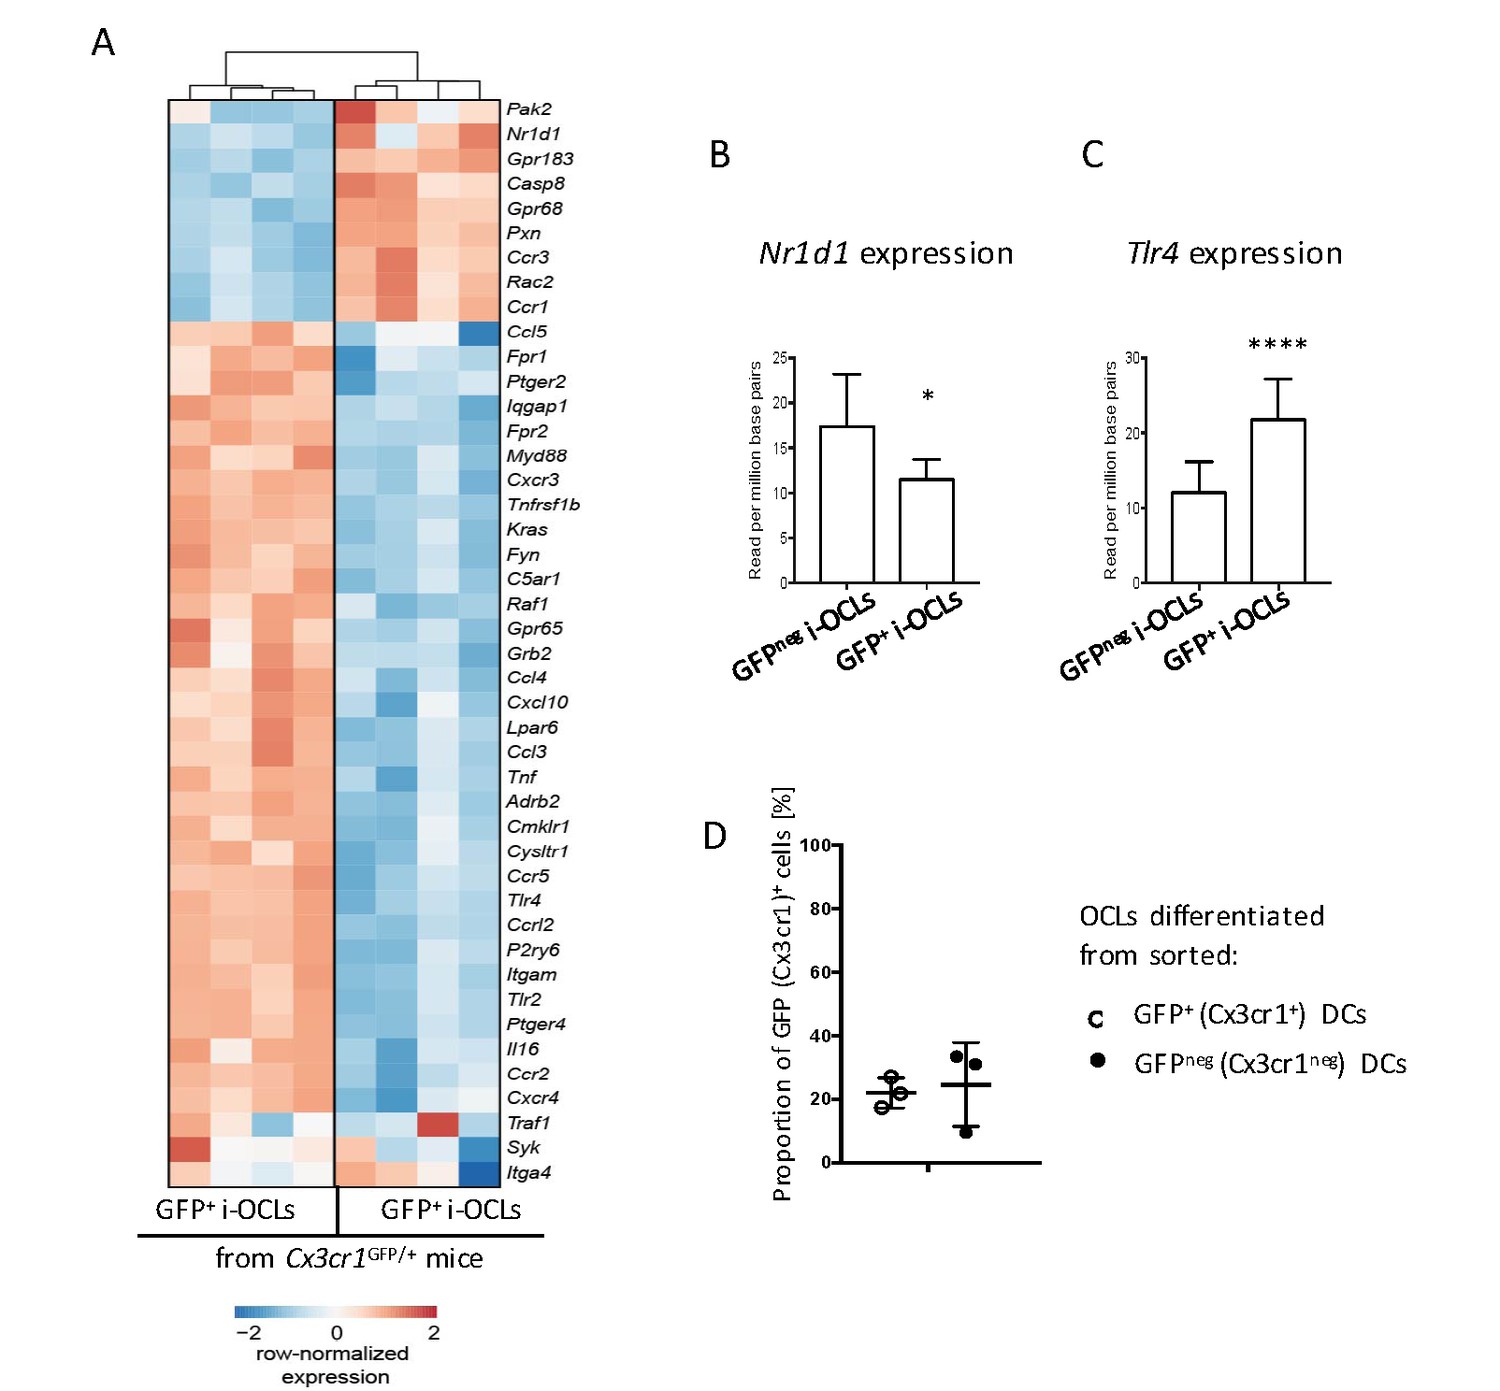
Cx3cr1+ and Cx3cr1neg i-OCLs differ in their expression of Cx3cr1-interacting genes.
(A) Heatmap visualization of selected genes involved in the Cx3cr1 pathway that are significantly differentially expressed (p<0.05, FC ≥2) between GFP+ (Cx3cr1+) and GFPneg (Cx3cr1neg) i-OCLs differentiated from WT Cx3cr1GFP/+ mice. (B) Relative expression levels of Nr1d1 and (C) Tlr4 in Cx3cr1+ and Cx3cr1neg i-OCLs. (D) BM-derived DCs from Cx3cr1GFP/+ mice were sorted based on their expression of GFP and were differentiated into i-OCLs. Both GFP+ (Cx3cr1+) and GFPneg (Cx3cr1neg) DCs gave rise to approx. 20% of Cx3cr1+ i-OCLs. *p<0.05; ****p<0.0001.
Figure 4 with 1 supplement
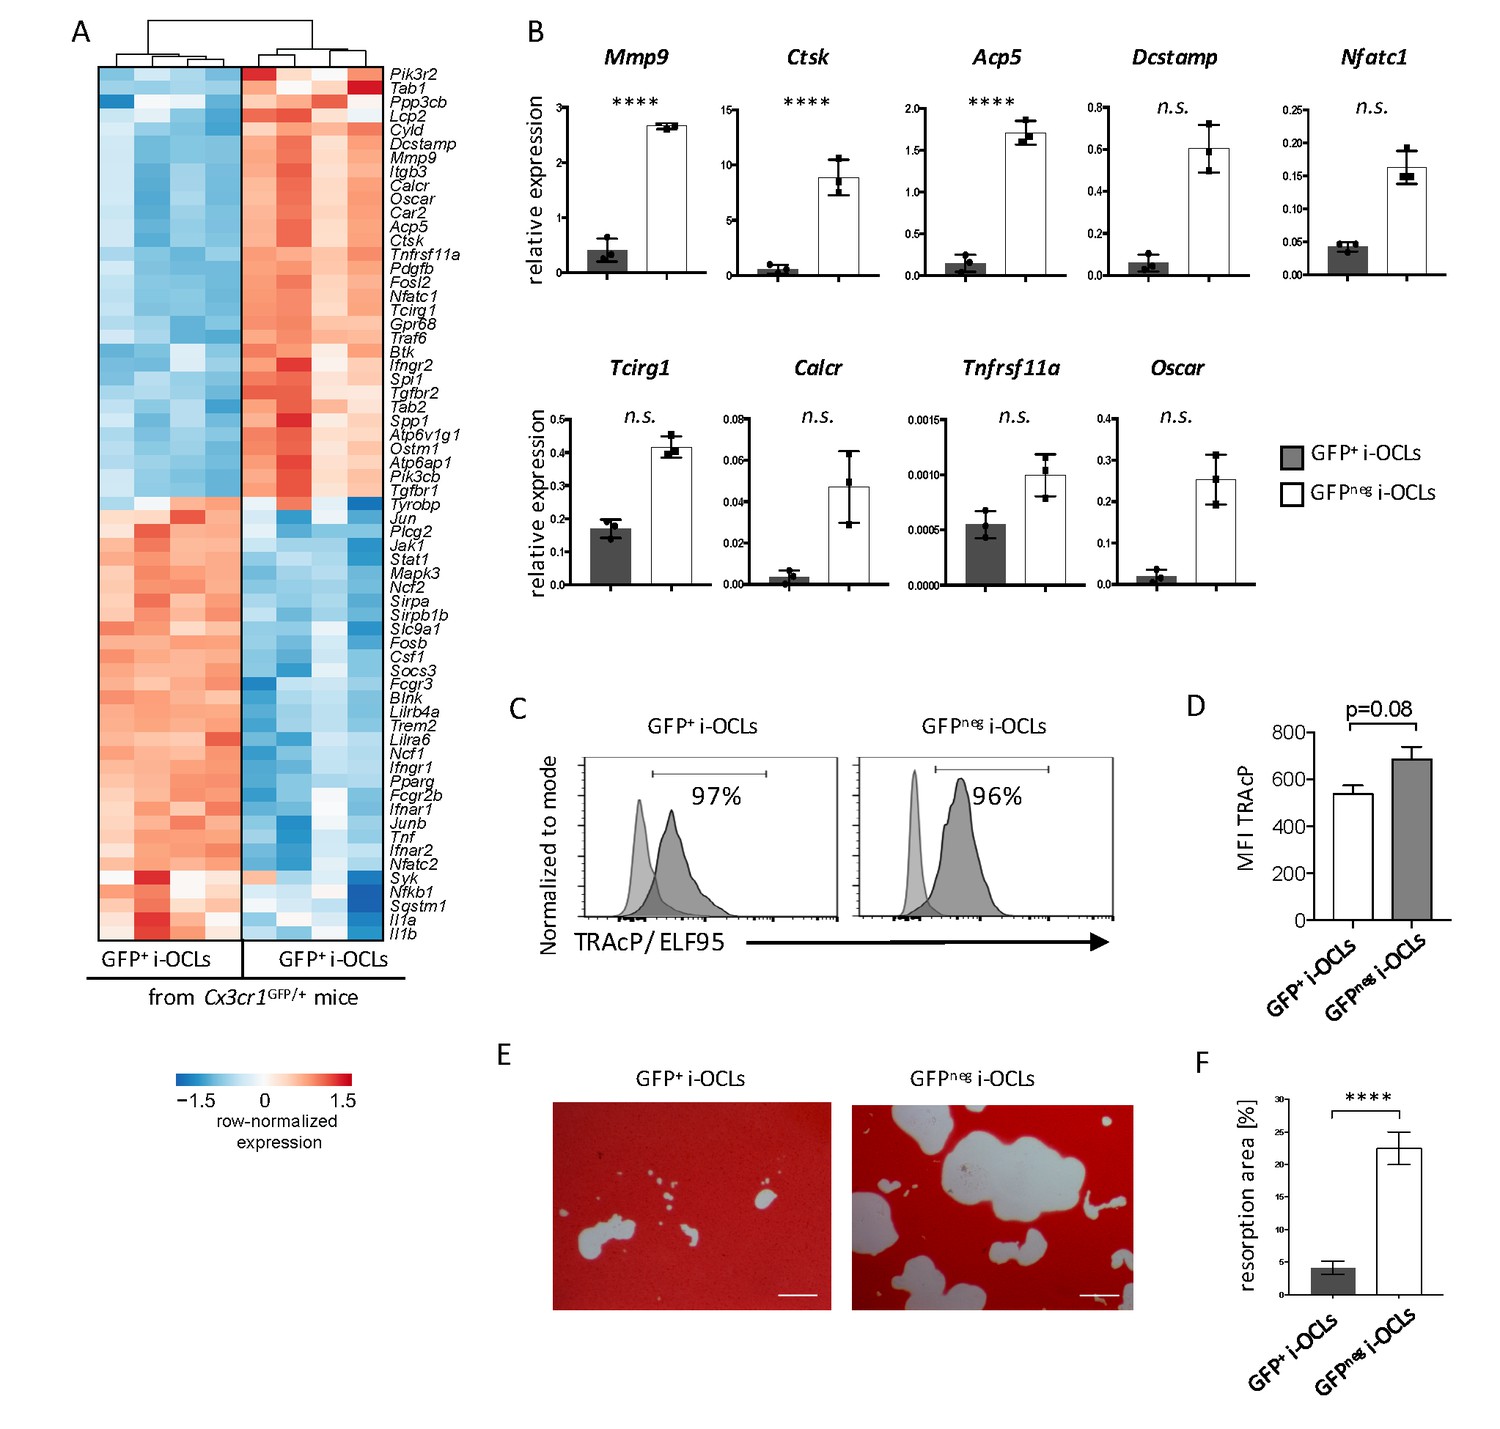
Cx3cr1neg and Cx3cr1+ i-OCLs differ in their resorbing activity.
(A) Heatmap visualization of the z-scored expression for selected genes involved in bone resorption, osteoclast fusion and differentiation that are differentially expressed between GFP+ (Cx3cr1+) and GFPneg (Cx3cr1neg) i-OCLs both differentiated from WT Cx3cr1GFP/+ mice (adjusted p-value<0.05, FC ≥2). (B) RT-qPCR analysis on GFP+ (Cx3cr1+) and GFPneg (Cx3cr1neg) i-OCLs. Results are represented as the mean with 95% confidence interval of 3 independent biological replicates in triplicates. (C) Flow cytometry analysis of TRAcP expression using ELF95 substrate in the 2 i-OCLs subsets. Percentage of positive cells (dark curve) compared to the negative control (light curve) is indicated. (D) Quantification of the mean fluorescence intensity (MFI) of TRAcP in GFP+ (Cx3cr1+) and GFPneg (Cx3cr1neg) i-OCLs (n = 3). (E) Representative images of matrix dissolution activity of sorted GFP+ (Cx3cr1+) and GFPneg (Cx3cr1neg) i-OCLs seeded at the same cell density. Red alizarin staining of the mineralized matrix revealed the resorbed areas as unstained. Scale bar = 100 µm. (F) Quantification of resorbed areas from three independent experiments in triplicates are indicated as percentage. ****p<0.0001; n.s., no significant difference.
Figure 4—figure supplement 1
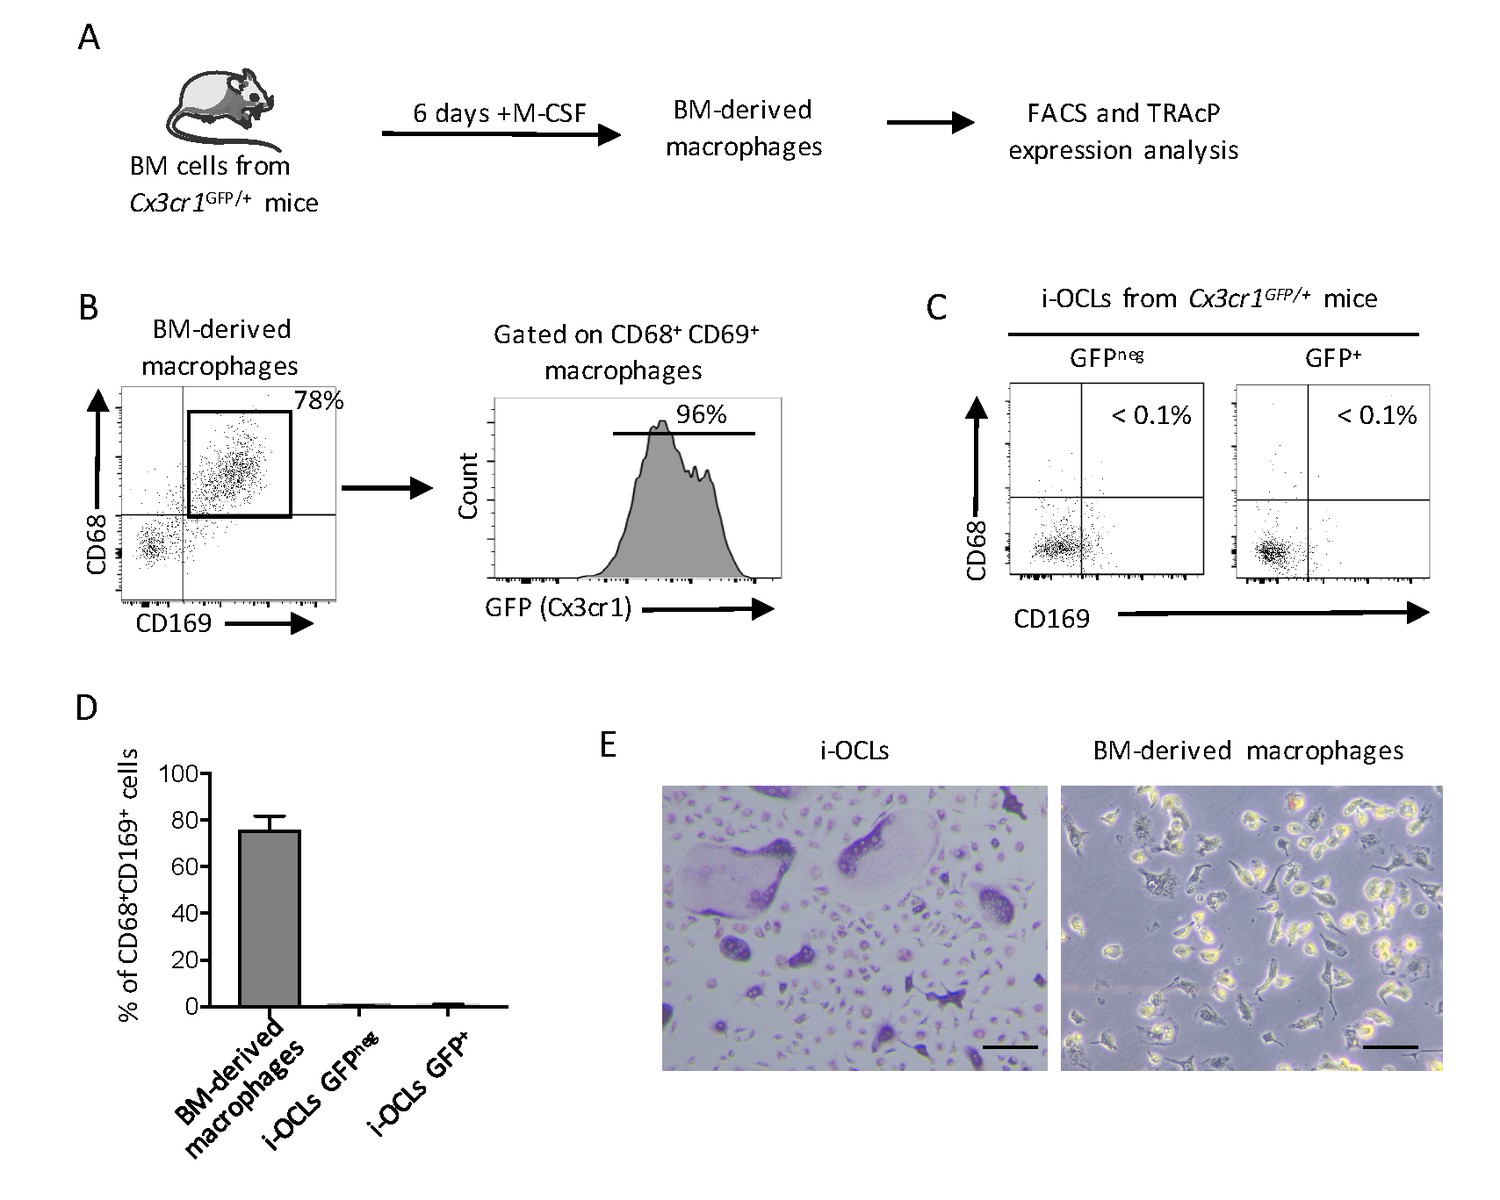
Cx3cr1+ i-OCLs differ from Cx3cr1+ BM-derived macrophages.
(A) Schematic representation of the differentiation of macrophages from the BM of Cx3cr1GFP/+ mice. (B) FACS analysis of macrophage markers on BM-derived macrophages and (C) on GFP+ (Cx3cr1+) and GFPneg (Cx3cr1neg) i-OCLs (n = 3). (D) Quantification of CD68+CD169+ cells in Cx3cr1+ BM-derived macrophages and in Cx3cr1neg and Cx3cr1+ i-OCL subsets. (E) Representative images of TRAcP staining on i-OCLs and BM-derived macrophages showing that contrasting to i-OCLs that all express TRAcP, BM-derived macrophages are negative for TRAcP expression. Scale bar = 50 µm.
Figure 5 with 1 supplement
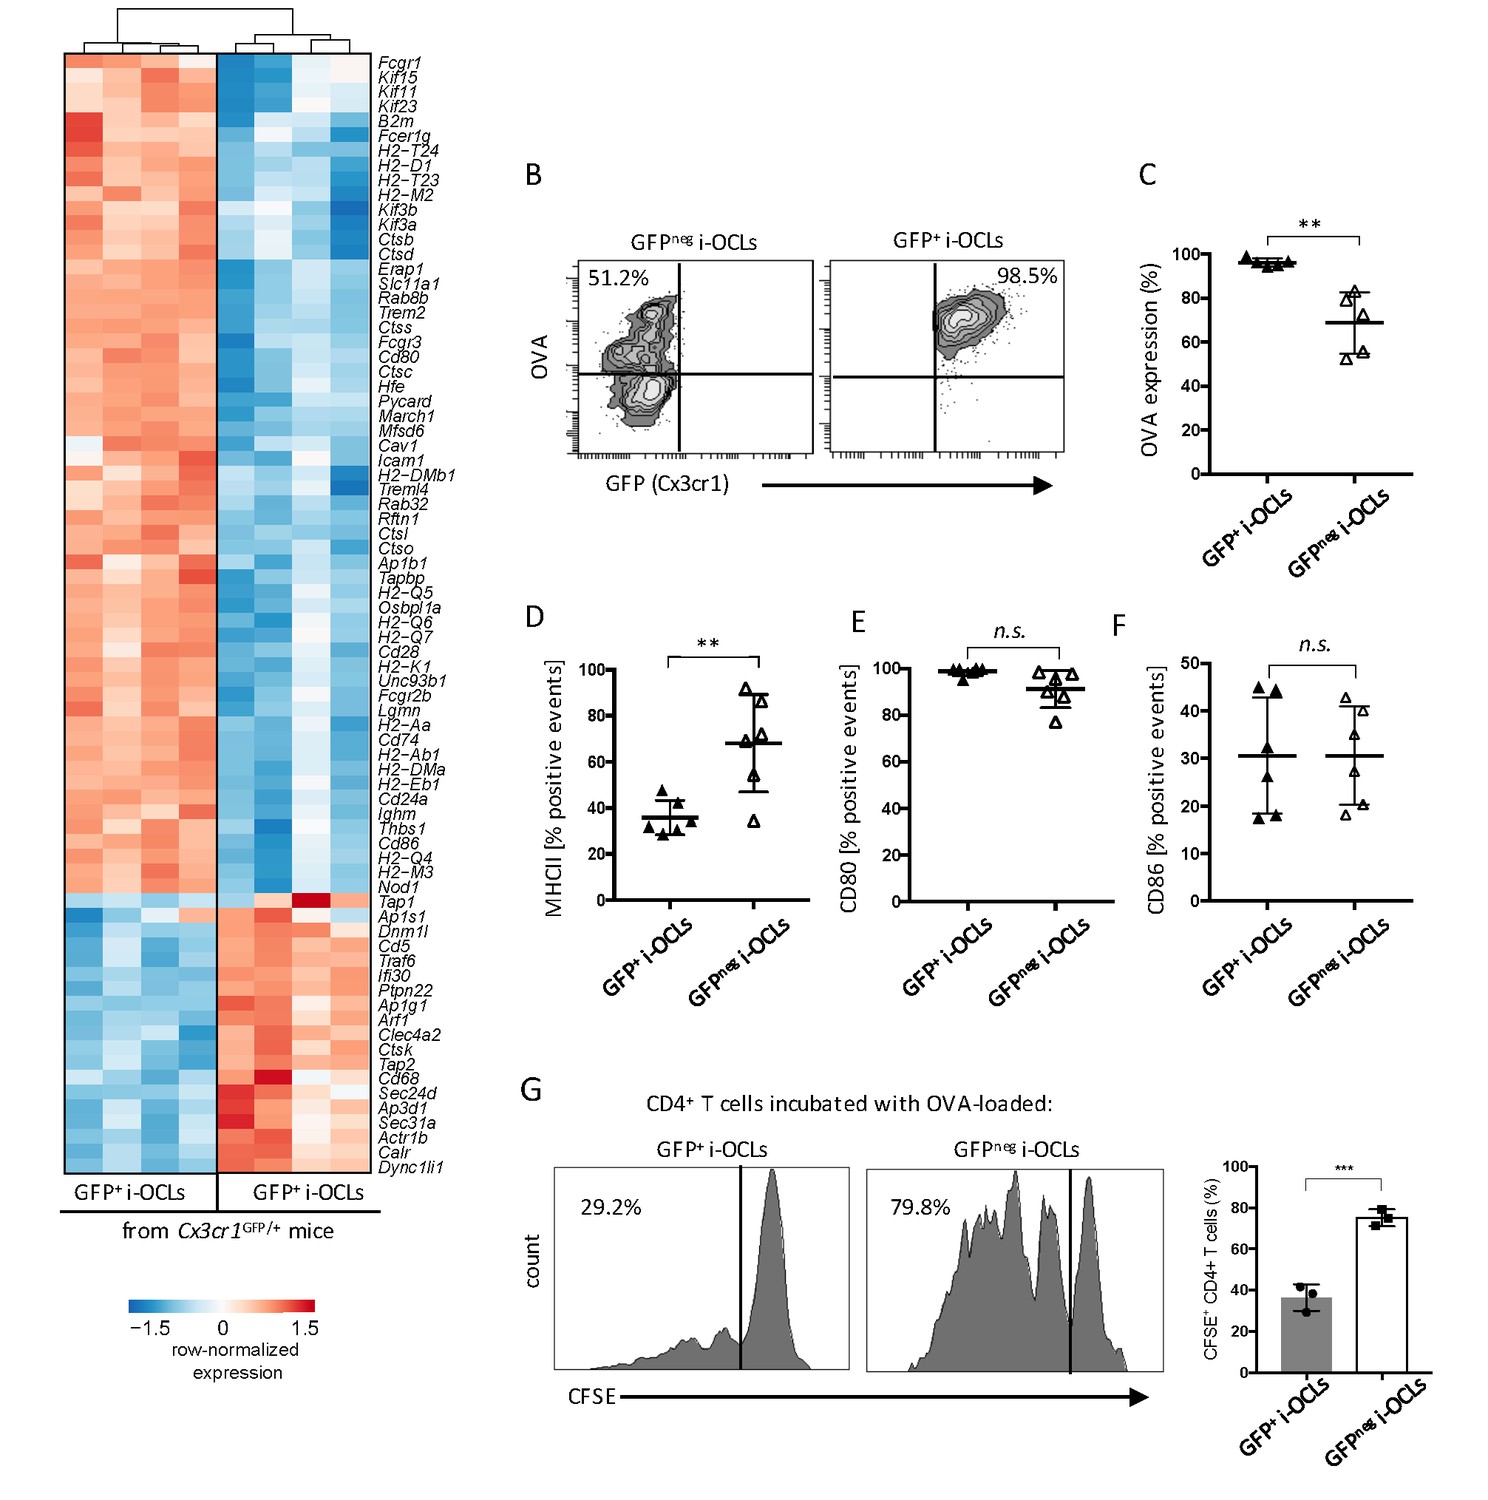
Cx3cr1neg and Cx3cr1+ subsets differ in their antigen uptake and presentation.
(A) Heatmap visualization of the z-scored expression for selected genes involved in antigen uptake, processing and presentation that are differentially expressed between GFP+ (Cx3cr1+) and GFPneg (Cx3cr1neg) i-OCLs from WT Cx3cr1GFP/+ mice (adjusted pVal <0.05, FC ≥2). (B) Representative FACS plots of OVA uptake in Cx3cr1+ and Cx3cr1neg i-OCLs. (C) Quantification of FACS analysis for OVA uptake in GFP+ (Cx3cr1+) and GFPneg (Cx3cr1neg) i-OCLs (n = 5). (D–F) FACS analysis of GFP+ (Cx3cr1+) and GFPneg (Cx3cr1neg) i-OCLs for (D) MHC-II, (E) CD80 and (F) CD86 (n = 6). (G). Representative FACS histograms for T cell proliferation assay of CFSE-labelled CD4+ T cells from OT-II mice cultured with OVA-loaded GFP+ (Cx3cr1+) or GFP neg (Cx3cr1neg) i-OCLs after 5 days of coculture. **p<0.01; n.s., no significant difference.
Figure 5—figure supplement 1
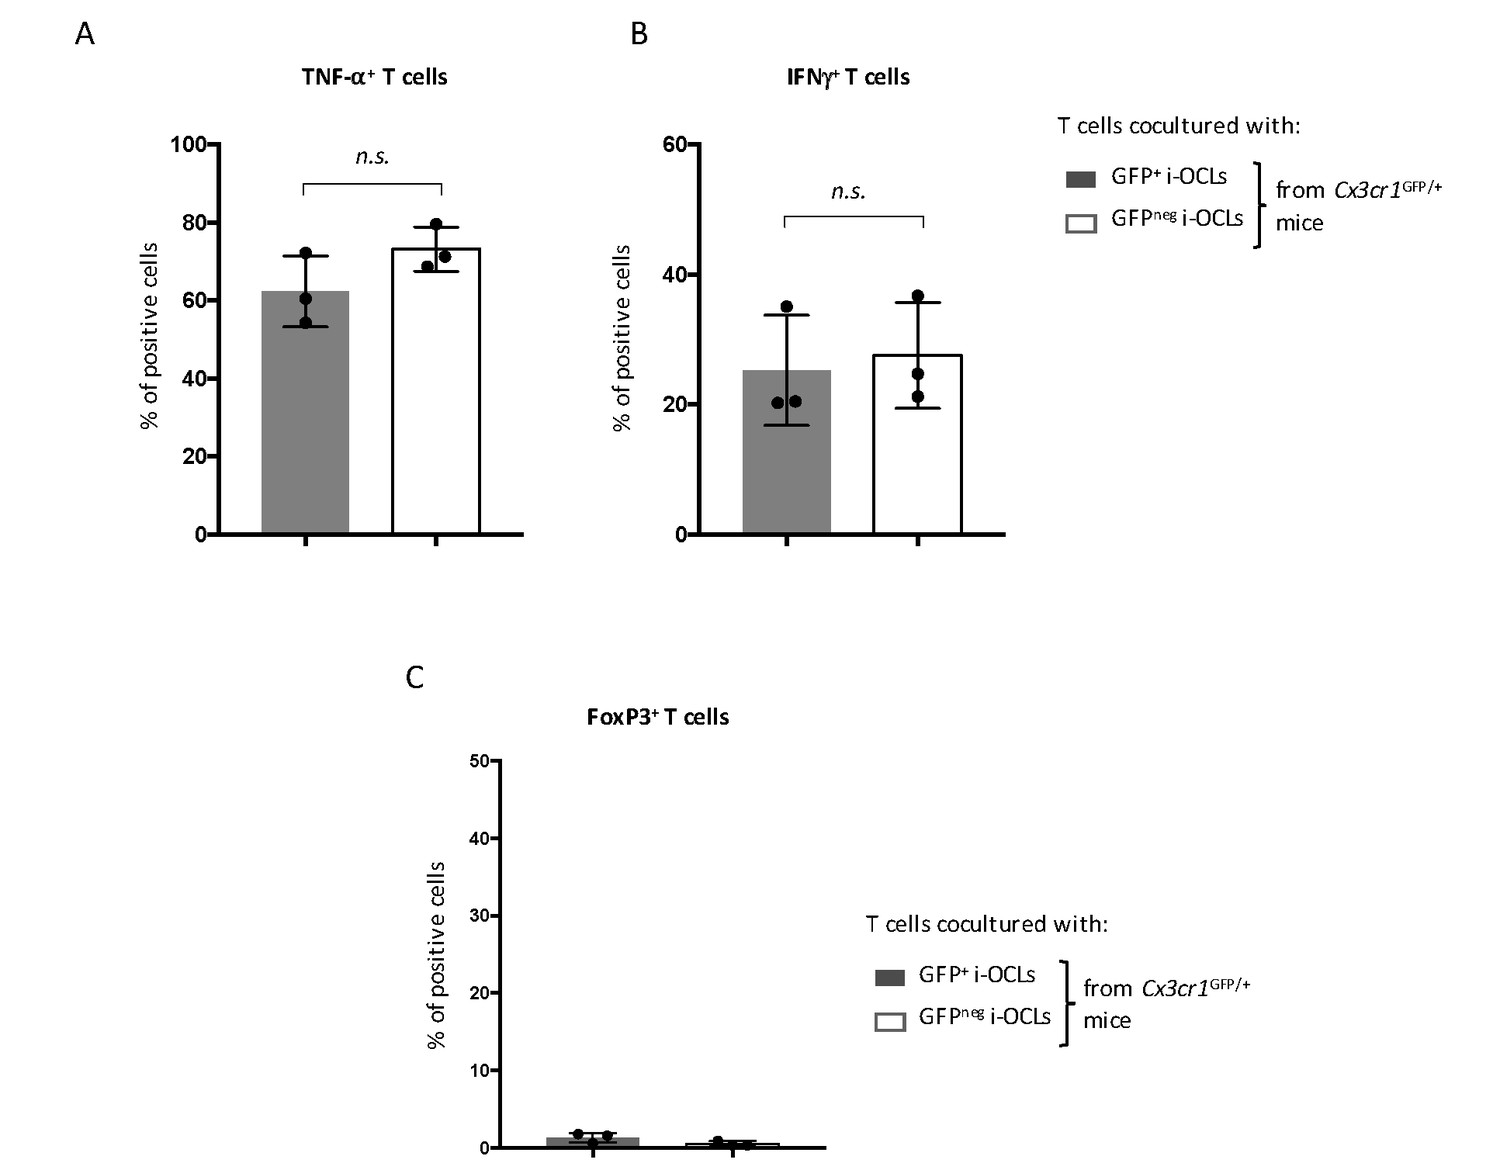
CD4+ T cell polarization analysis CD4+ T cells from OT-II mice were cocultured with OVA-challenged GFP+ (Cx3cr1+) and GFPneg (Cx3cr1neg) i-OCLs from WT Cx3cr1GFP/+ mice, respectively, and analyzed by intracytoplasmic staining for their (A) TNFα, (B) IFNγ and (C) FoxP3 expression using flow cytometry. n.s., no significant difference.
Figure 6
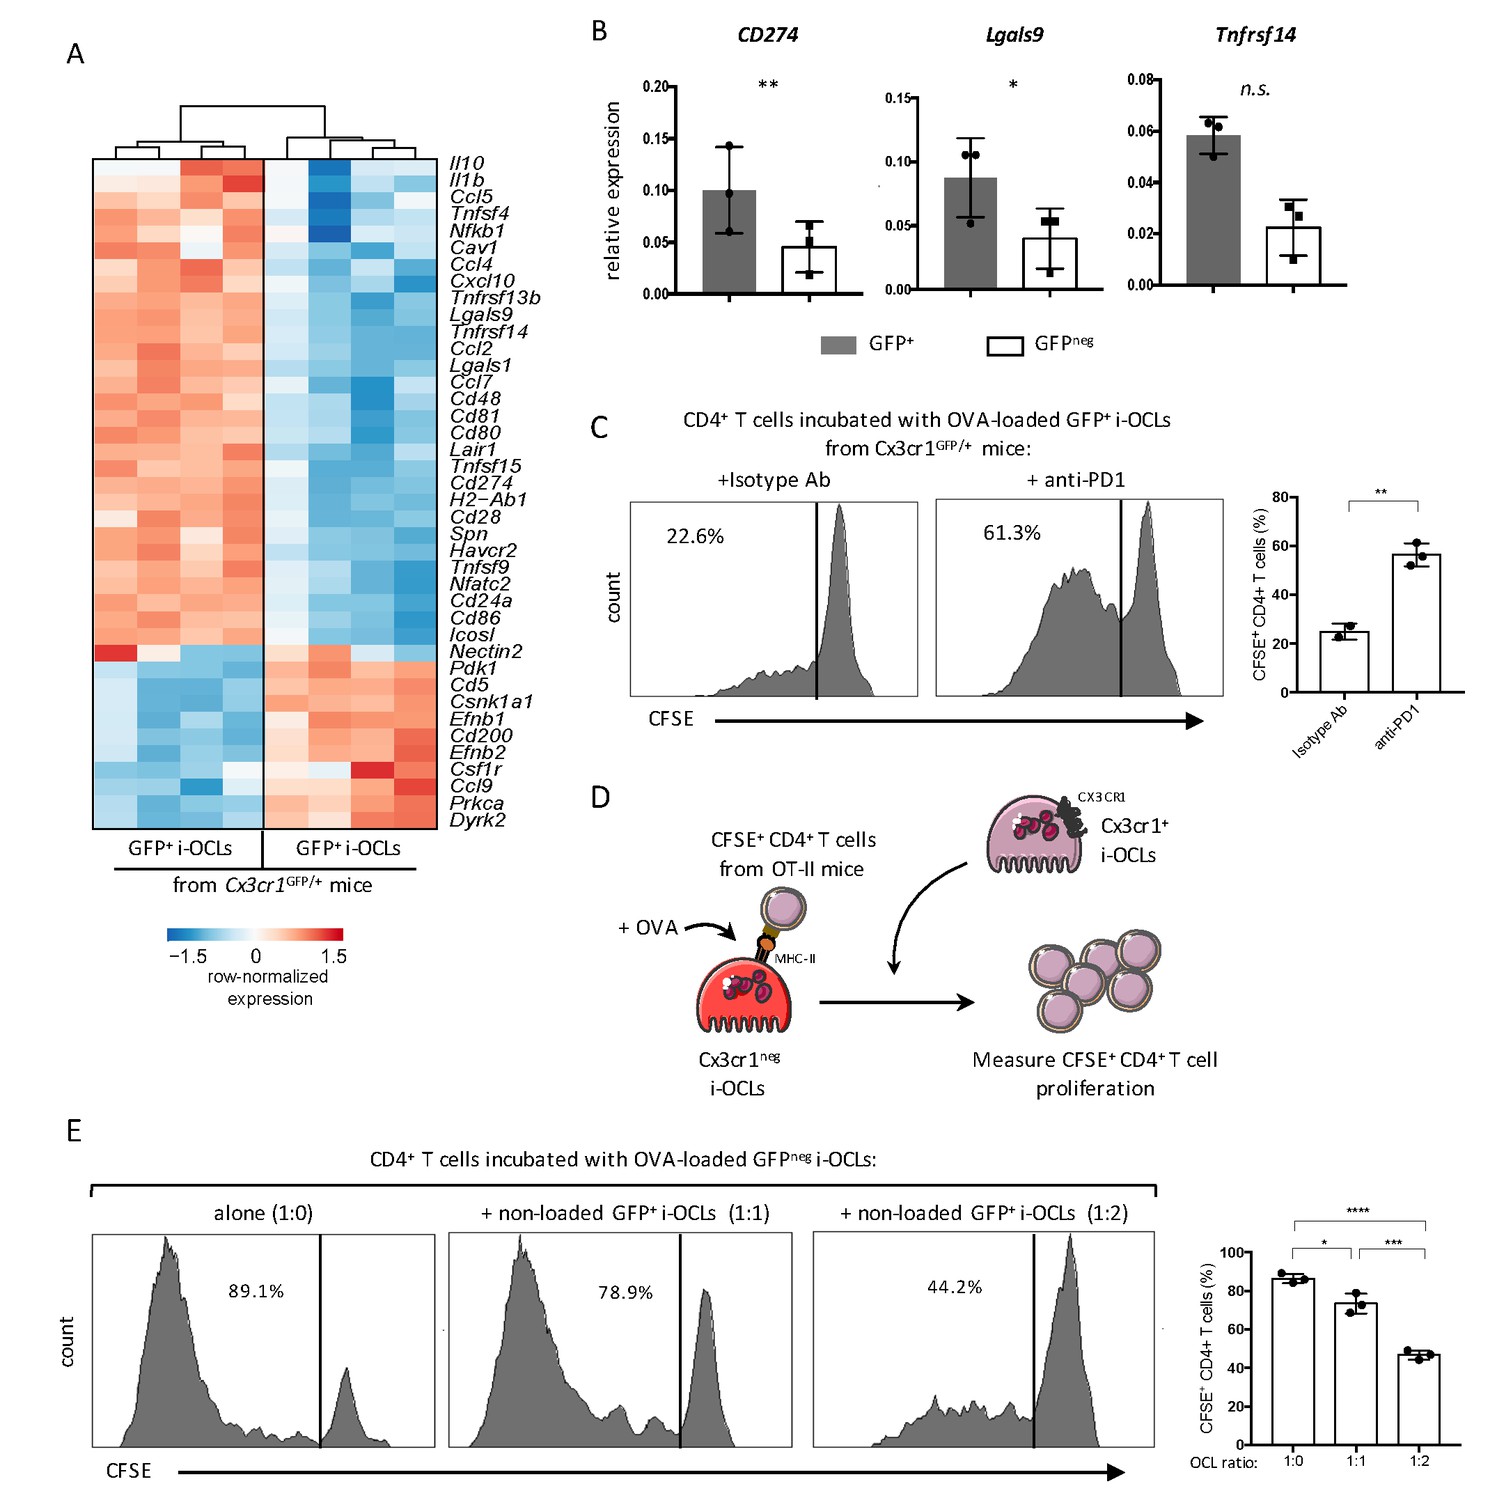
Cx3cr1neg and Cx3cr1+ subsets differ in their T cell activation capacity.
(A) Heatmap visualization of the z-scored expression for selected genes involved in T cell stimulation and inhibition that are differentially expressed between GFP+ (Cx3cr1+) and GFPneg (Cx3cr1neg) i-OCLs from WT Cx3cr1GFP/+ mice (adjusted p<0.05, FC ≥2). (B) RT-qPCR analysis of immunosuppressive molecules. Graphs show three independent experiments conducted in triplicates. (C) Representative FACS histograms and quantification of the proliferation of CSFE-labelled CD4+ T cell from OT-II mice cocultured with OVA-loaded Cx3cr1+ i-OCLs from WT Cx3cr1GFP/+ mice and an isotype antibody (left panel) or an anti-PD-1 antibody (right panel). (D) Schematic representation of the experimental setup. Sorted GFPneg (Cx3cr1neg) i-OCLs from WT Cx3cr1GFP/+ mice were loaded with OVA for 3 hr and incubated with CFSE+ CD4+ T cells in the presence of different rations of non-OVA loaded GFP+(Cx3cr1+) i-OCLs from WT Cx3cr1GFP/+ mice. (E) FACS analysis and quantification of CFSE+ CD4+ T cells of OT-II mice cocultured in the presence of different ratios (1:0; 1:1; 1:2) between OVA-loaded Cx3cr1neg i-OCLs and Cx3cr1+ i-OCLs (non-loaded with OVA) for 5 days. *p<0.05; **p<0.01; ***p<0.001; ****p<0.0001; n.s., no significant difference.
Figure 7
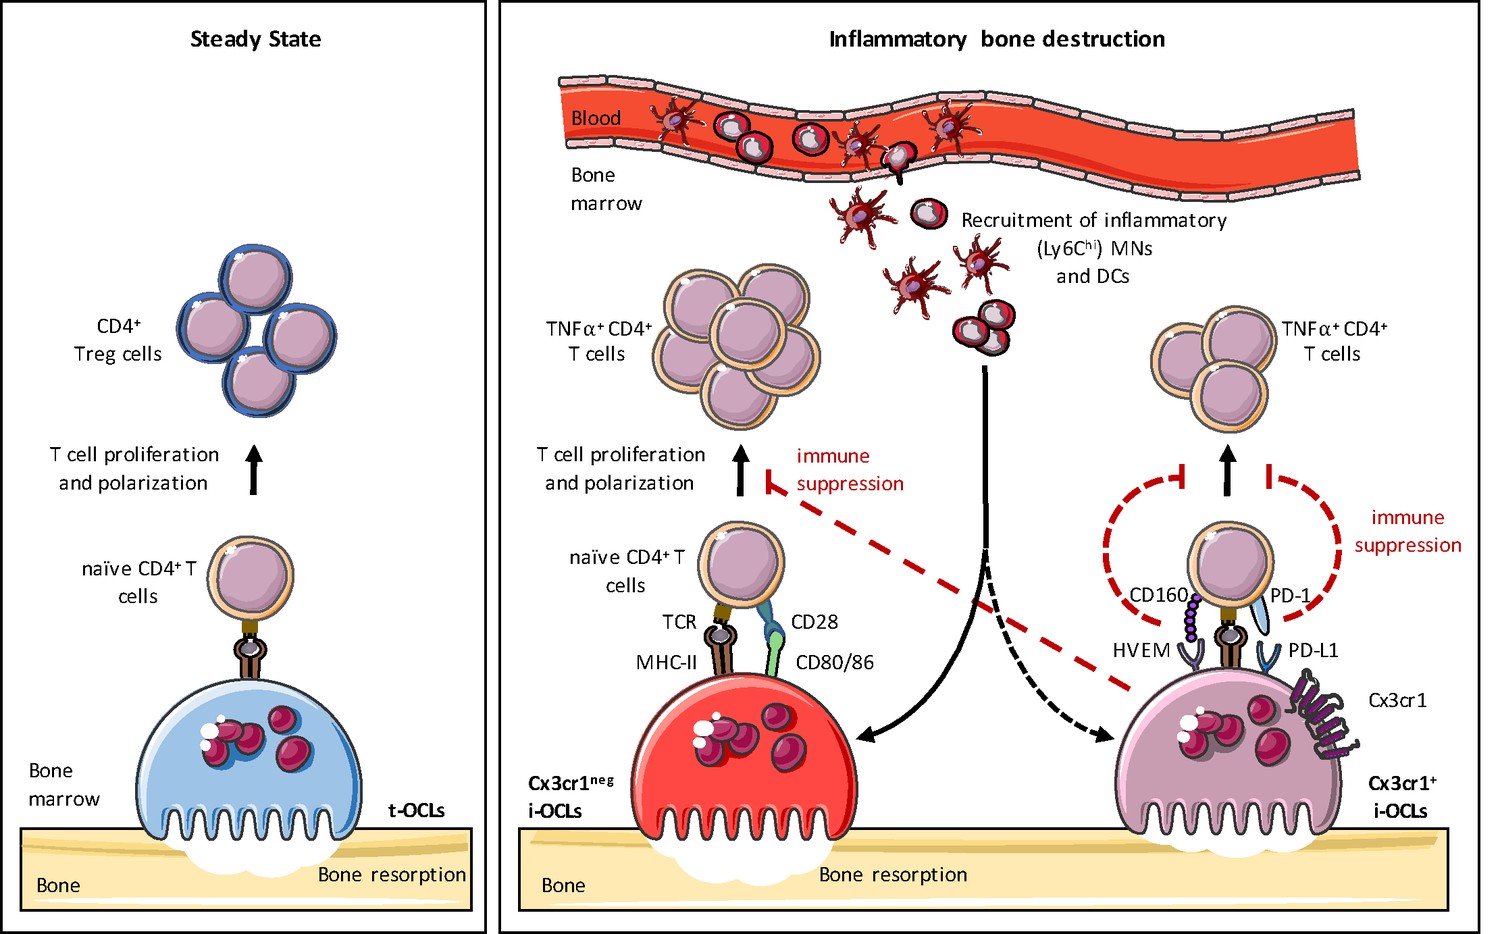
Heterogeneity of osteoclasts and underlying molecular mechanisms.
In steady state, BM progenitors differentiate into tolerogenic OCLs (t-OCLs) that are able to present antigens and induce CD4+ Treg cells. During inflammation, inflammatory MNs and DCs are recruited to the BM and differentiate into i-OCLs. Approx. 25% of these i-OCLs can be characterized by their expression of Cx3cr1 while the majority of i-OCLs does not express this marker. Cx3cr1neg i-OCLs show significantly higher bone resorption activity in vitro compared to Cx3cr1+ i-OCLs. Both i-OCL subsets act as antigen-presenting cells but differ in their T cell activation capacity that is higher for the Cx3cr1neg i-OCL subset. Both i-OCL subsets are able to induce TNFα-producing CD4+ T cells, however the Cx3cr1+ OCL subset express high levels of co-inhibitory molecules such as PD-L1 that reduce their capacity to activate T cells. Moreover, Cx3cr1+ i-OCLs have an immune suppressive effect on Cx3cr1 neg i-OCLs by reducing their T cell proliferation capacity in vitro.
Author response image 1
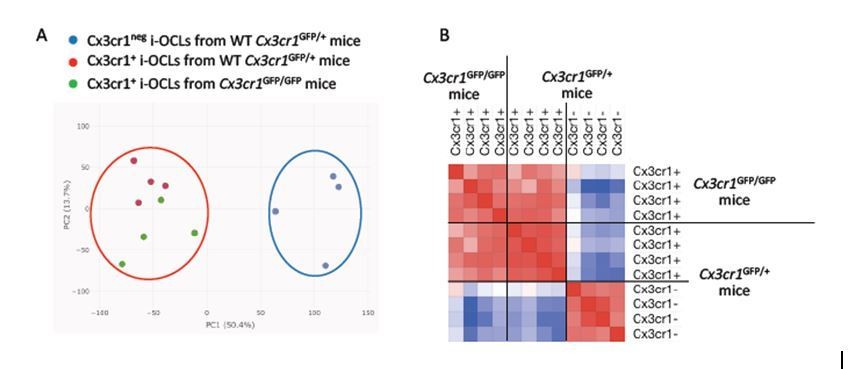
Cx3cr1neg i-OCLs from Cx3cr1GFP/+ mice are distinct from Cx3cr1+ i-OCLs from deficient Cx3cr1GFP/GFP mice.
A) Principal component analysis of Cx3cr1+ from deficient Cx3cr1GFP/GFP mice (green) and Wt Cx3cr1GFP/+ mice (red) and Cx3cr1neg i-OCLs from Cx3cr1GFP/+ mice (blue). Data shows the two first components after batch correction. Each dot represents the expression profile of one sample. B) Similarity matrix analysis on the same samples.
Tables
Key resources table
| Reagent type (species) or resource | Designation | Source or reference | Identifiers | Additional information |
|---|---|---|---|---|
| Strain, strain background (Mus musculus) | Cx3cr1GFP/+ | Jung et al., 2000 | CDTA, CNRS, Orléans, France | |
| Sequenced-based reagent | Calcr | PCR primers | CTTCCATGCTGATCTTCTGG andCAGATCTCCATTGGGCACAA | |
| Sequenced-based reagent | Acp5 | PCR primers | TGCCTACCTGTGTGGACATGA andCACATAGCCCACACCGTTCTC | |
| Sequenced-based reagent | Mmp9 | PCR primers | TGAGTCCGGCAGACAATCCT and CGCCCTGGATCTCAGCAATA | |
| Sequenced-based reagent | Ctsk | PCR primers | CAGCAGAGGTGTGTACTATG and GCGTTGTTCTTATTCCGAGC | |
| Sequenced-based reagent | Atp6V0a3/Tcirg1 | PCR primers | CGCTGCGAGGAACTGGAG and AGCGTCAGACCTGCCCG | |
| Sequenced-based reagent | Tnfrsf11a | PCR primers | CTTGGACACCTGGAATGAAGAAG and AGGGCCTTGCCTGCATC | |
| Sequenced-based reagent | Nfatc1 | PCR primers | TGAGGCTGGTCTTCCGAGTT and CGCTGGGAACACTCGATAGG | |
| Sequenced-based reagent | Dcstamp | PCR primers | GGGCACCAGTATTTTCCTGA and CAGAACGGCCAGAAGAATGA | |
| Sequenced-based reagent | Oscar | PCR primers | GTAACGGATCAGCTCCCCAG and CGCGGTACAGTGCAAAACTC | |
| Sequenced-based reagent | CD274 | PCR primers | CAAGCGAATCACGCTGAAAG and GGGTTGGTGGTCACTGTTTGT | |
| Sequenced-based reagent | Lgals9 | PCR primers | TCAAGGTGATGGTGAACAAGAAA and GATGGTGTCCACGAGGTGGTA | |
| Sequenced-based reagent | Lightr/Tnfrsf14 | PCR primers | TGTCCATTCTTTTGCCACTTG and CCTGATGGTGTTCTCCTGTTGTT | |
| Sequenced-based reagent | 36B4 | PCR primers | TCCAGGCTTTGGGCATCA and CTTTATCAGCTGCACATCACTCAGA | |
| Antibody | Monoclonal anti-mouse CD80 | BD Biosciences | clone 16-10A1 | APC-conjugated (1:100) |
| Antibody | Monoclonal anti-mouse CD86 | BD Biosciences | clone GL1 | PE-conjugated (1:100) |
| Antibody | Monoclonal anti-mouse I-A[b] | BD Biosciences | clone AF6-120.1 | Biotin-conjugated (1:200) |
| Antibody | Monoclonal anti-mouse/human CD11b | BD Biosciences | clone M1/70 | PE-conjugated (1:500) |
| Antibody | Monoclonal anti-mouse CD4 | BD Biosciences | clone RM4-5 | PECy7-conjugated (1:1000) |
| Antibody | Monoclonal anti-mouse CD68 | ThermoFisher Scientific | clone FA-11 | PECy7-conjugated (1:200) |
| Antibody | Monoclonal anti-mouse CD11c | ThermoFisher Scientific | clone N418 | PECy7-conjugated (1:200) |
| Antibody | Monoclonal anti-mouse Ly6C | ThermoFisher Scientific | clone HK1.4 | PerCP-conjugated (1:1000) |
| Antibody | Monoclonal anti-mouse CD169 | ThermoFisher Scientific | clone SER-4 | APC-conjugated (1:100) |
| Antibody | Monoclonal anti-mouse IFNγ | ThermoFisher Scientific | clone XMG1.2 | APC-conjugated (1:400) |
| Antibody | Monoclonal anti-mouse TNFα | ThermoFisher Scientific | clone MP6-XT22 | BV421-conjugated (1:400) |
| Chemical compound, drug | streptavidin | ThermoFisher Scientific | PercP-conjugated (1:200) | |
| Chemical compound, drug | ovalbumin | ThermoFisher Scientific | Alexa Fluor 647-conjugated | |
| Commercial assay or kit | Acid Phosphatase Leucocyte (TRAcP) kit | Sigma-Aldrich | 387A | |
| Commercial assay or kit | ELF 97 Endogenous Phosphatase Detection Kit | Molecular probes | E-6601 |
Additional files
-
Source data 1
Raw counts-HTSeq.
Raw counts (HTseq) per gene and per sample from the RNAseq analysis of Cx3cr1+ and Cx3cr1neg i-OCLs from WT Cx3cr1GFP/+ mice and Cx3cr1+ i-OCLs from deficient Cx3cr1GFP/GFP mice. In each group, the 4 i-OCL samples have been obtained from 4 different mice.
- https://cdn.elifesciences.org/articles/54493/elife-54493-data1-v1.xlsx
-
Source data 2
Counts_Deseq NormaBatch Corrected.
Counts per gene and per sample after normalization and batch correction from the RNAseq analysis of Cx3cr1+ and Cx3cr1neg i-OCLs from WT Cx3cr1GFP/+ mice and Cx3cr1+ i-OCLs from deficient Cx3cr1GFP/GFP mice. In each group, the 4 i-OCL samples have been obtained from 4 different mice.
- https://cdn.elifesciences.org/articles/54493/elife-54493-data2-v1.xlsx
-
Source data 3
Cx3cr1+ i-OCLs from WT Cx3cr1GFP/+ mice versus Cx3cr1+ i-OCLs from deficient Cx3cr1GFP/GFP mice _Deseq.
Statistics (Deseq) for the comparison of expressed genes in Cx3cr1+ i-OCLs from WT Cx3cr1GFP/+ mice versus Cx3cr1+ i-OCLs from deficient Cx3cr1GFP/GFP mice. In each group, the 4 i-OCL samples have been obtained from 4 different mice.
- https://cdn.elifesciences.org/articles/54493/elife-54493-data3-v1.xlsx
-
Source data 4
Cx3cr1+ i-OCLs from WT Cx3cr1GFP/+ mice versus Cx3cr1neg i-OCLs from WT Cx3cr1GFP/+ mice mice _Deseq.
Statistics (Deseq) for the comparison of expressed genes in Cx3cr1+ versus Cx3cr1neg i-OCLs from WT Cx3cr1GFP/+ mice. In each group, the 4 i-OCL samples have been obtained from 4 different mice.
- https://cdn.elifesciences.org/articles/54493/elife-54493-data4-v1.xlsx
-
Transparent reporting form
- https://cdn.elifesciences.org/articles/54493/elife-54493-transrepform-v1.pdf
Download links
A two-part list of links to download the article, or parts of the article, in various formats.
Downloads (link to download the article as PDF)
Open citations (links to open the citations from this article in various online reference manager services)
Cite this article (links to download the citations from this article in formats compatible with various reference manager tools)
Dissecting the phenotypic and functional heterogeneity of mouse inflammatory osteoclasts by the expression of Cx3cr1
eLife 9:e54493.
https://doi.org/10.7554/eLife.54493


