Systematic examination of low-intensity ultrasound parameters on human motor cortex excitability and behavior
- Krembil Research Institute, University Health Network, Canada
- Department of Neurology, National Taiwan University Hospital Hsin-Chu Branch, Taiwan
- Division of Neurology, Department of Medicine, University of Toronto, Canada
- Sunnybrook Research Institute, Canada
- Division of Neurosurgery, Department of Surgery, Toronto Western Hospital, University of Toronto, Canada
Figures
Figure 1 with 1 supplement
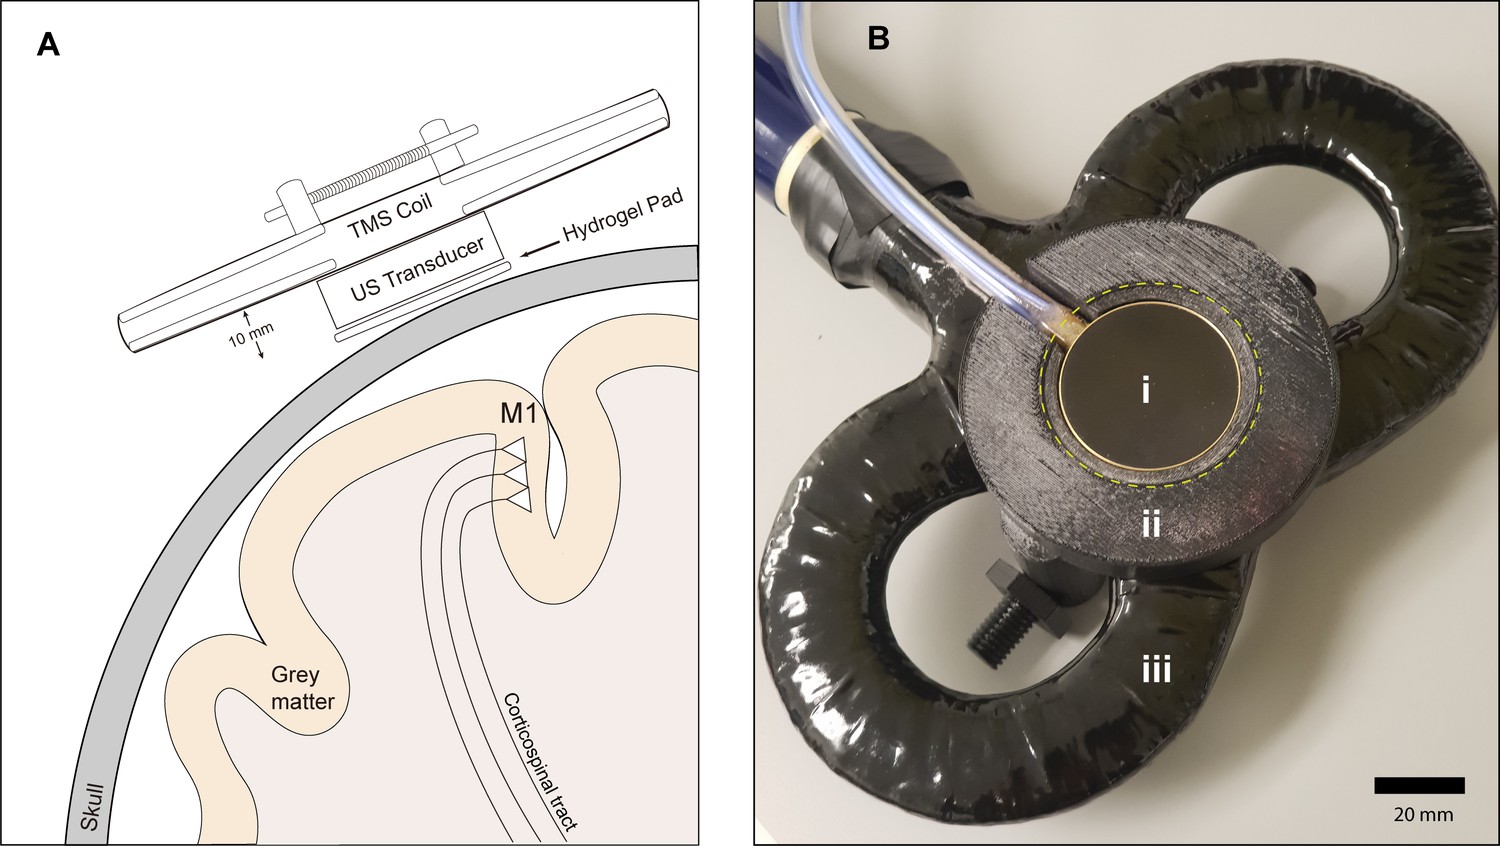
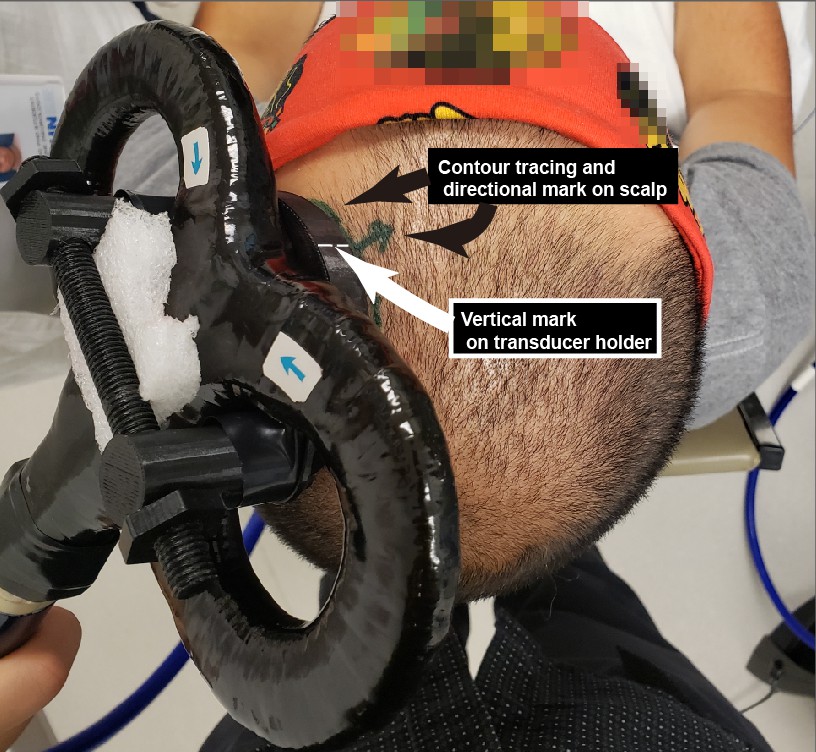
Experimental setup.
(A) Diagram depicting the primary motor cortex hand knob in coronal section, with the ultrasound transducer coupled to the scalp via compressible hydrogel and held to the underside of a transcranial magnetic stimulation (TMS) coil with a 3D printed plastic holder (not to scale). The transducer and holder measure 10 mm thick, allowing for adequate magnetic stimulation of cortical neuron populations. (B) Photograph of the custom TUS-TMS delivery apparatus components, showing: (i) the active face of the TUS transducer, (ii) plastic 3D-printed holder, and (iii) 70 mm figure-eight TMS coil. The yellow dashed line indicates the recessed cutout for the hydrogel coupling pad.
Figure 1—figure supplement 1
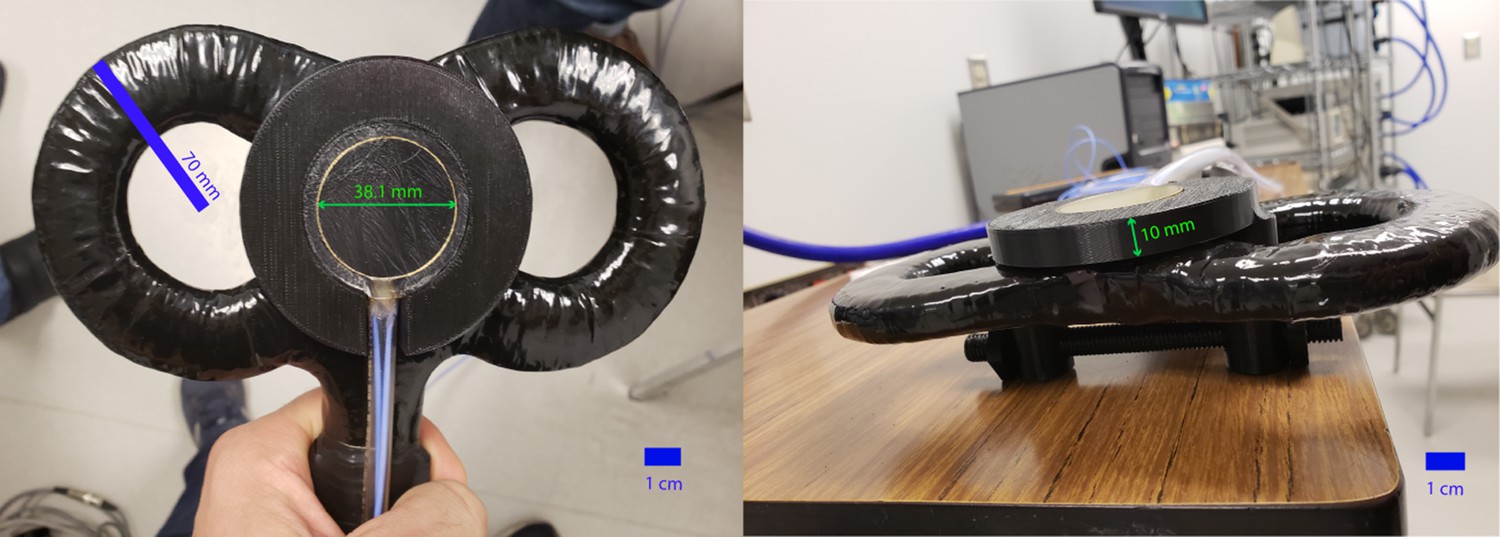
Material specifications for the 500 kHz 2-element annular ultrasound transducer, and scale photographs of coupling to TMS coil.
Transducer manufacturer: Sonic concepts, Custom-made (Model H-246). Transducer Housing: Brass, RF-shielded, MRI-safe, water-tight. Cylindrical Housing dimensions: 38.1 mm outer diameter, 10 mm high. BNC Cable: 50 Ohms, side exit, 6-m length, exits housing on side. Center Frequency: (Fundamental): 500 kHz. Operating band: 400–600 kHz. Environment: MRI-safe, Immersible in water to a depth of 3.5 m, Matching Network: A fundamental resonance mode RF impedance matching network is supplied inside an RF-shielded external enclosure, intended for use with a 50 Ohm RF amplifier.
Figure 2 with 1 supplement
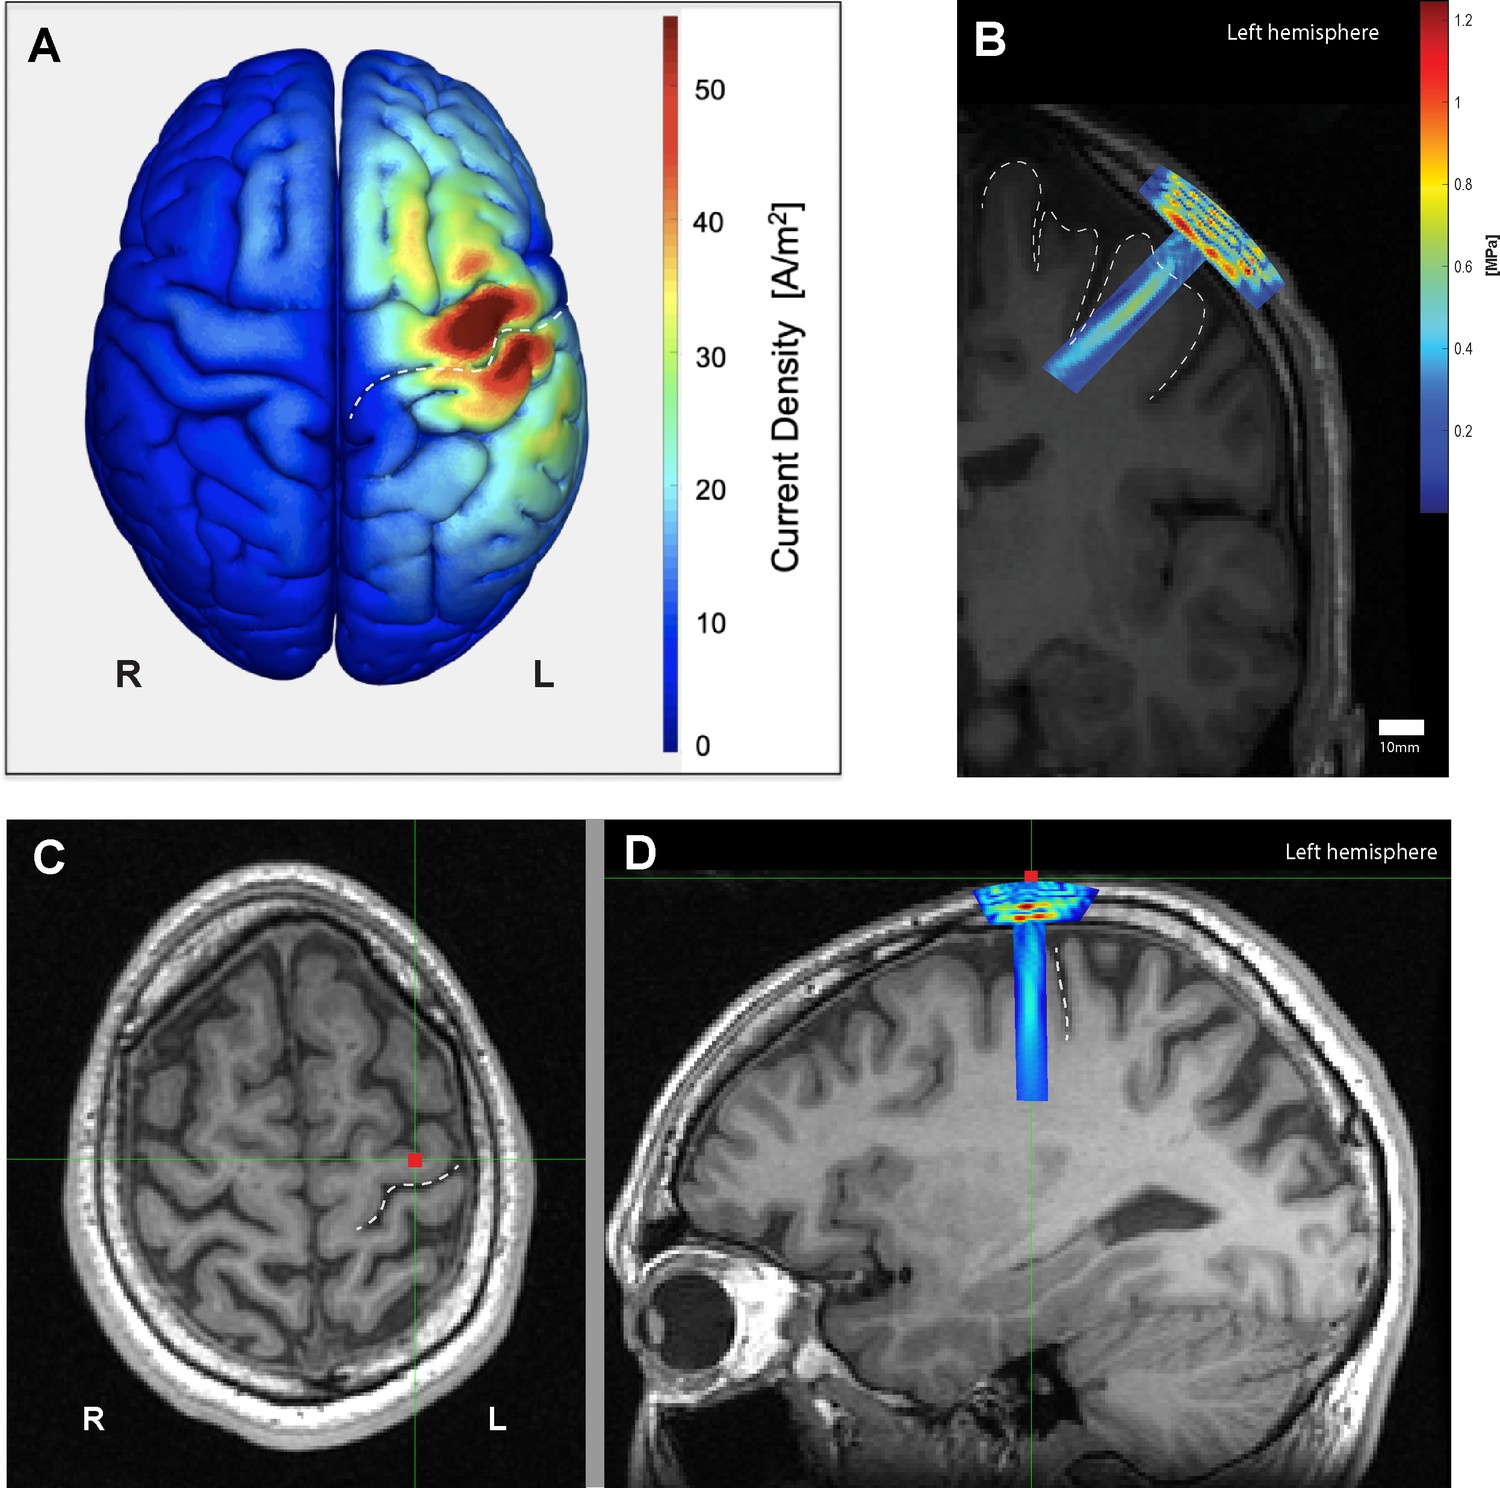
Electromagnetic and acoustic characterization.
(A) Characterization of TMS-induced electromagnetic current distribution around the left primary motor cortex, anterior to the central sulcus (dashed line), averaged across 16 participants rendered using SIMNIBS. (B) Simulation of transcranial ultrasound pressure field in a characteristic participant (k-Wave MATLAB toolbox), showing high pressure at the skull, and a cigar-shaped volume of tissue activation over the motor cortex and underlying white matter, with a focus centered 30 mm away from the face. (C) Scalp position of the US transducer on the same participant as determined by neuronavigation software during the experiment on axial and (D) sagittal views, showing the underlying hand knob of the precentral gyrus, anterior to the central sulcus (dashed line).
Figure 2—figure supplement 1
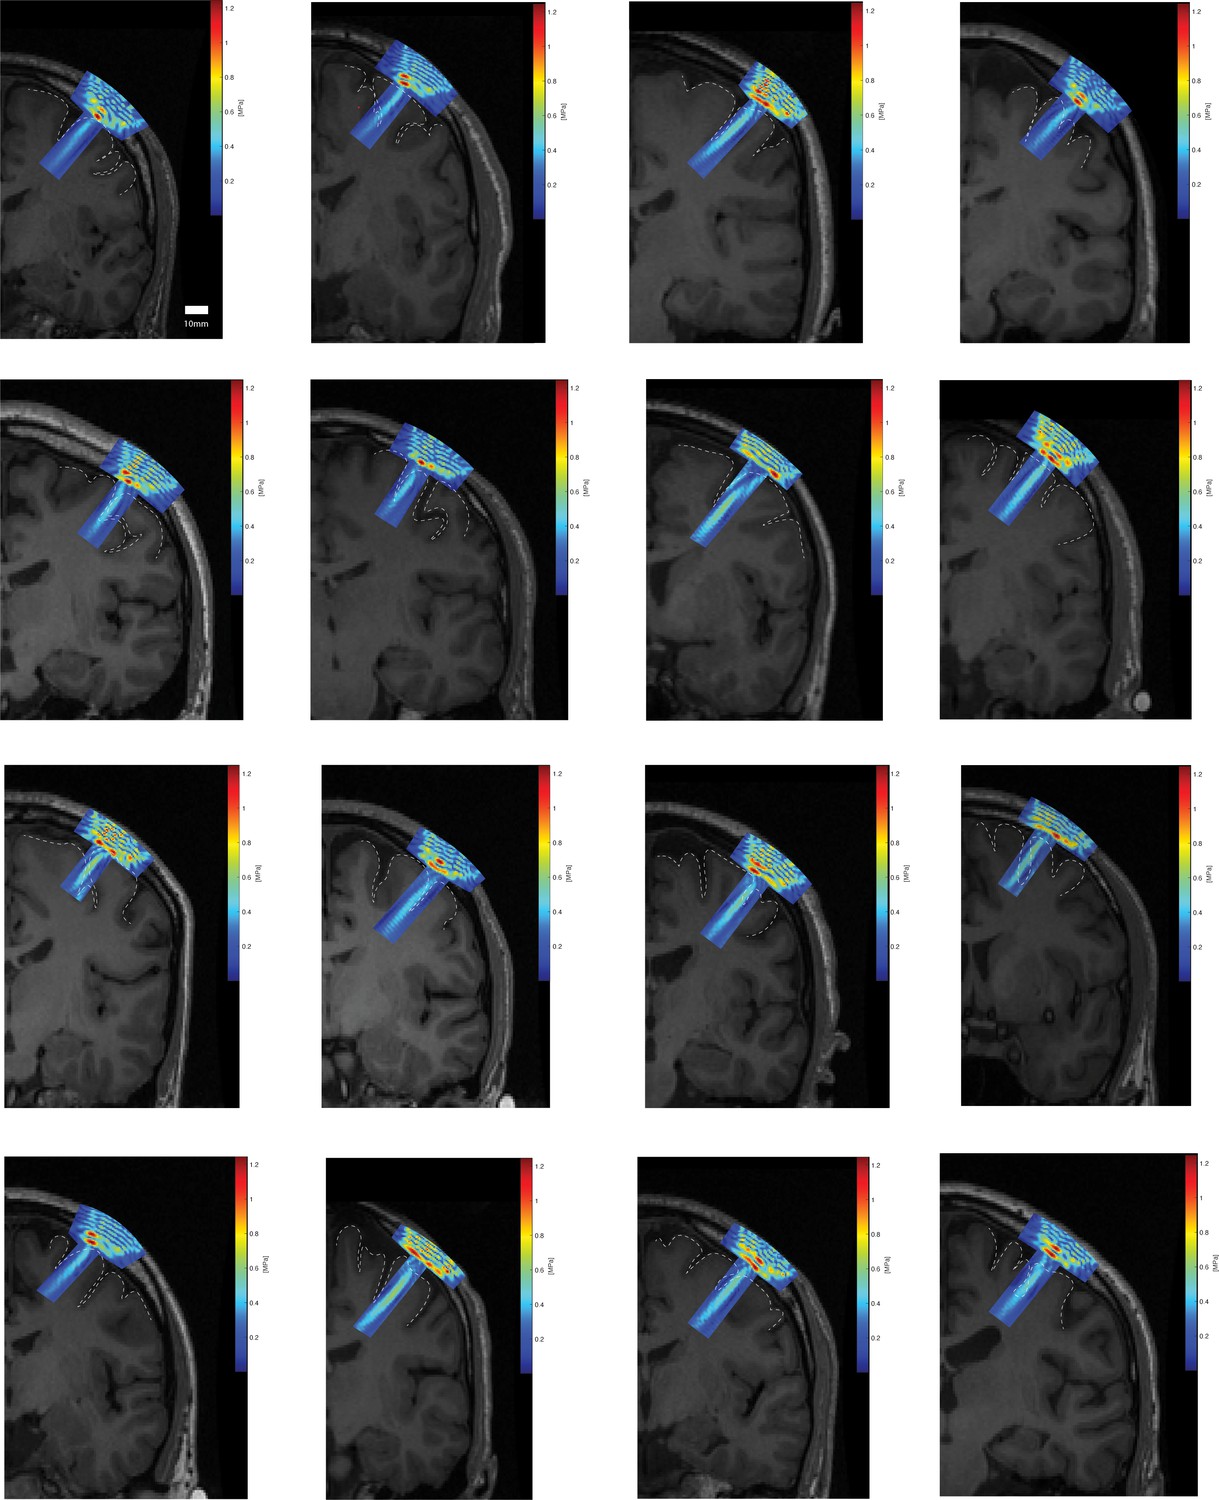
Individual acoustic simulations of each participant’s transducer focal field overlaid on the corresponding coronal T1 MRI.
Cortical topography of surrounding primary motor cortex highlighted with a dashed line.
Figure 3
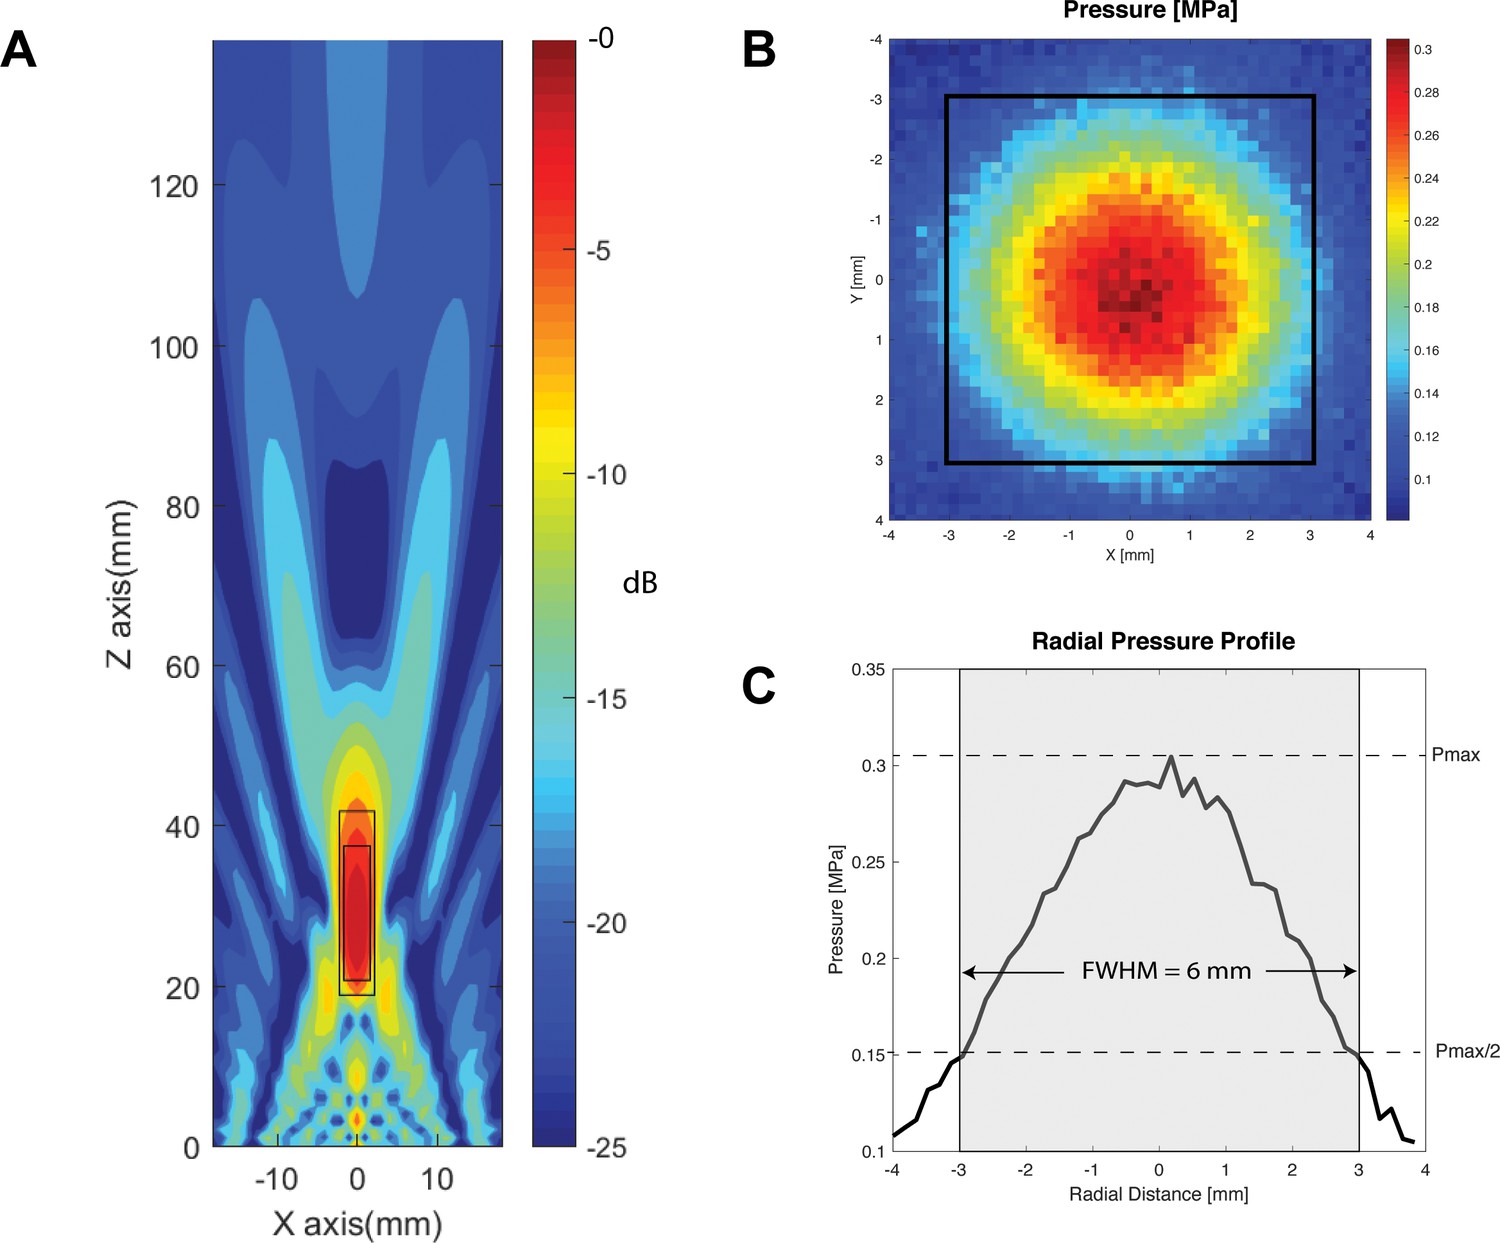
Transducer characterization.
(A) Characterization of the longitudinal (Z-axis) of the two-element 500 kHz transducer with focus 30 mm away from the face, within a simulated free-water field. Within −6 dB and −3 dB of the focal point, the focal lengths are 23 mm (large rectangle), and 17 mm (small rectangle), respectively. (B) Radial (X and Y axes) hydrophone quantification of the transducer at 30 mm away from the active face (top), with focal width at half maximum outlined in black square. (C) Radial pressure profile through the origin demonstrating a focal width at half maximum of 6 mm.
Figure 4

Effect of baseline ultrasound versus active and inactive sham on TMS-induced resting motor-evoked potential (MEP) amplitudes as measured by FDI EMG.
(A) Baseline parameters (PRF = 1000 Hz, DC = 30%, SD = 0.5 s) suppressed mean MEP voltage compared to active sham, or powered transducer pointing upward (p<0.001, paired t-test) N = 12. (B) Individual MEP values by participant by condition (C) Baseline parameters suppressed mean MEP voltage compared to inactive sham, or unpowered transducer pointing toward the scalp (p=0.012, paired t-test) N = 4. (d) Individual MEP values by participant by condition. Error bars represent standard error.
Figure 5 with 2 supplements
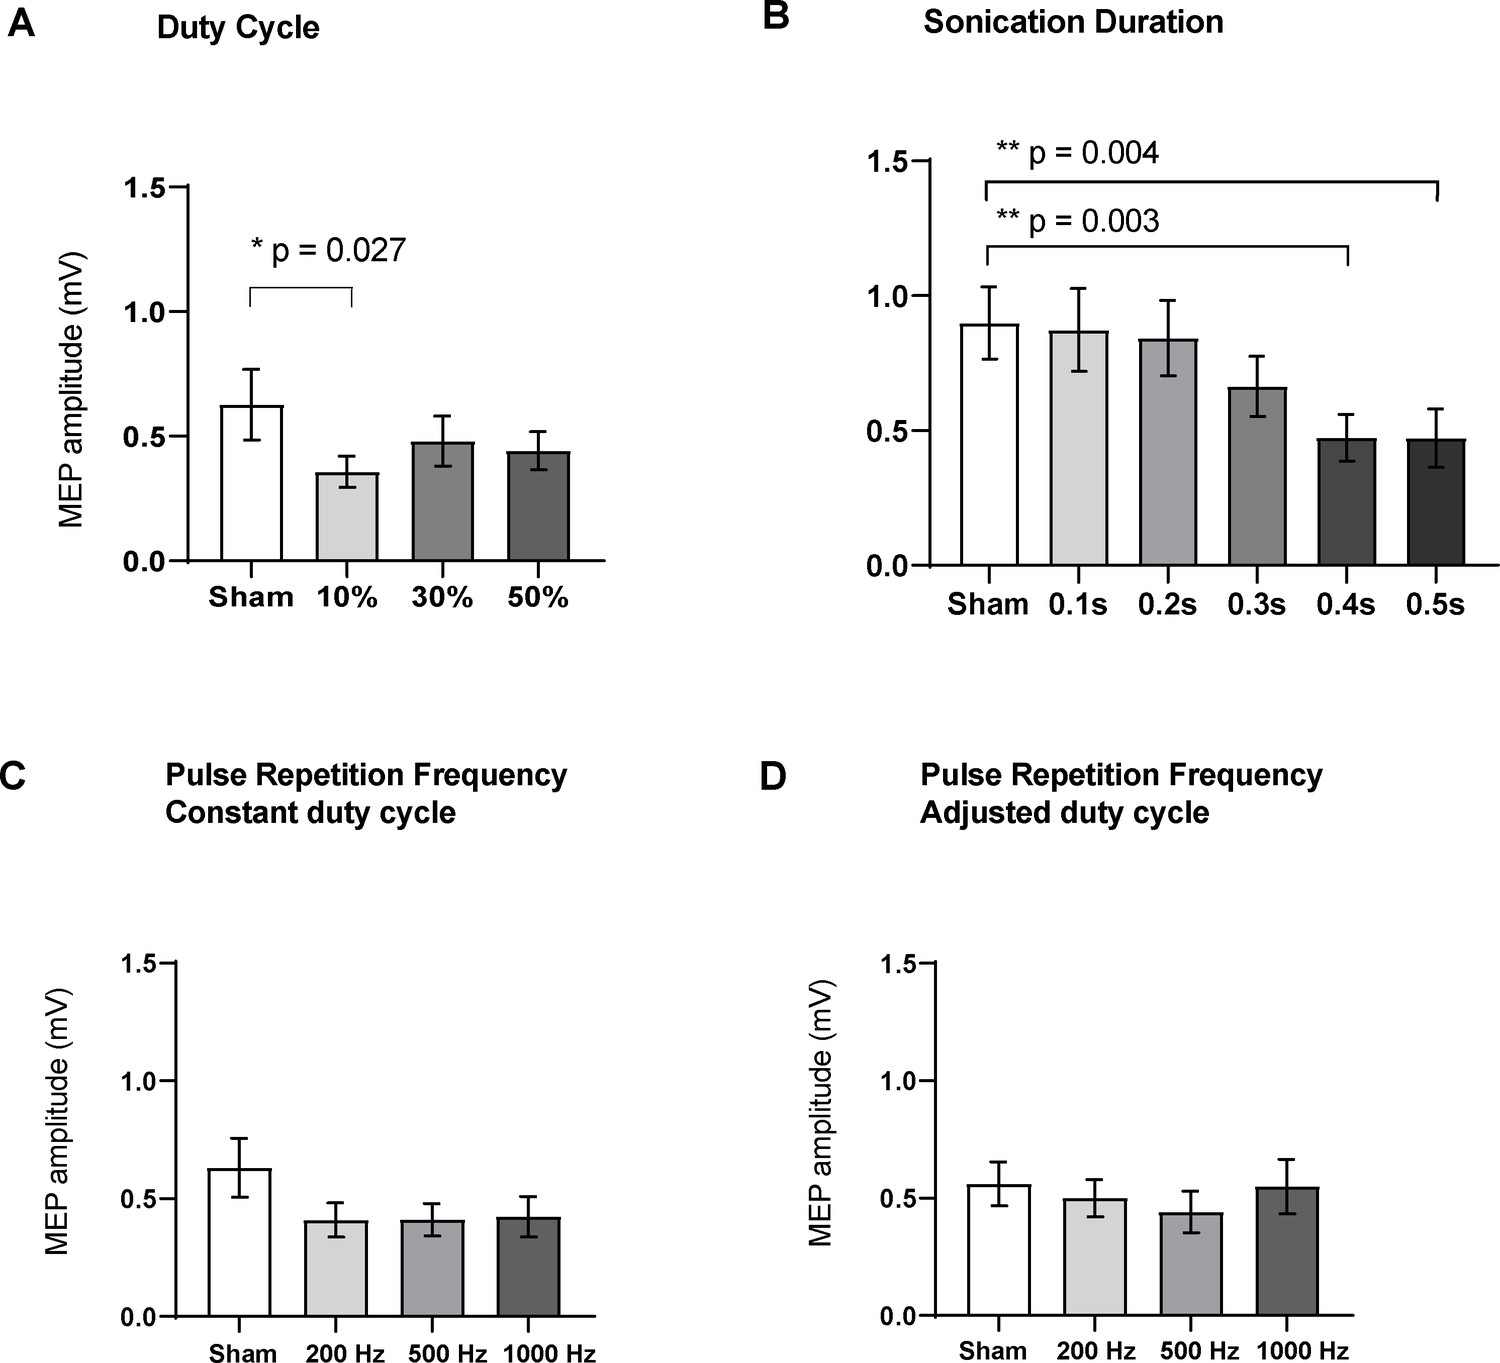
Effects of ultrasound parameters on TMS-induced resting peak-to-peak motor-evoked potential (MEP) amplitudes as measured by FDI EMG (N = 16).
Means of MEPs were plotted across the different sub-experiments which varied different parameters (A) Duty cycle (p=0.015; RM one-way ANOVA), 10% DC suppressed MEPs compared to sham (p=0.027, paired t-test). (B) Sonication duration had an effect proportional to the length of sonication (p<0.001; RM one-way ANOVA), with significant suppression compared to sham with 0.4 s (p=0.003), and 0.5 s (p=0.004). (C) Varying the pulse repetition frequency with fixed DC (p=0.08; RM one-way ANOVA) or (D) adjusted DC to keep constant burst duration (p=0.31; RM one-way ANOVA) did not have a significant effect. Error bars represent standard error. Asterisks are indicative of a significant post-hoc two-tailed paired t-test, and p-values are adjusted with the Holm-Bonferroni method (α = 0.05).
Figure 5—figure supplement 1
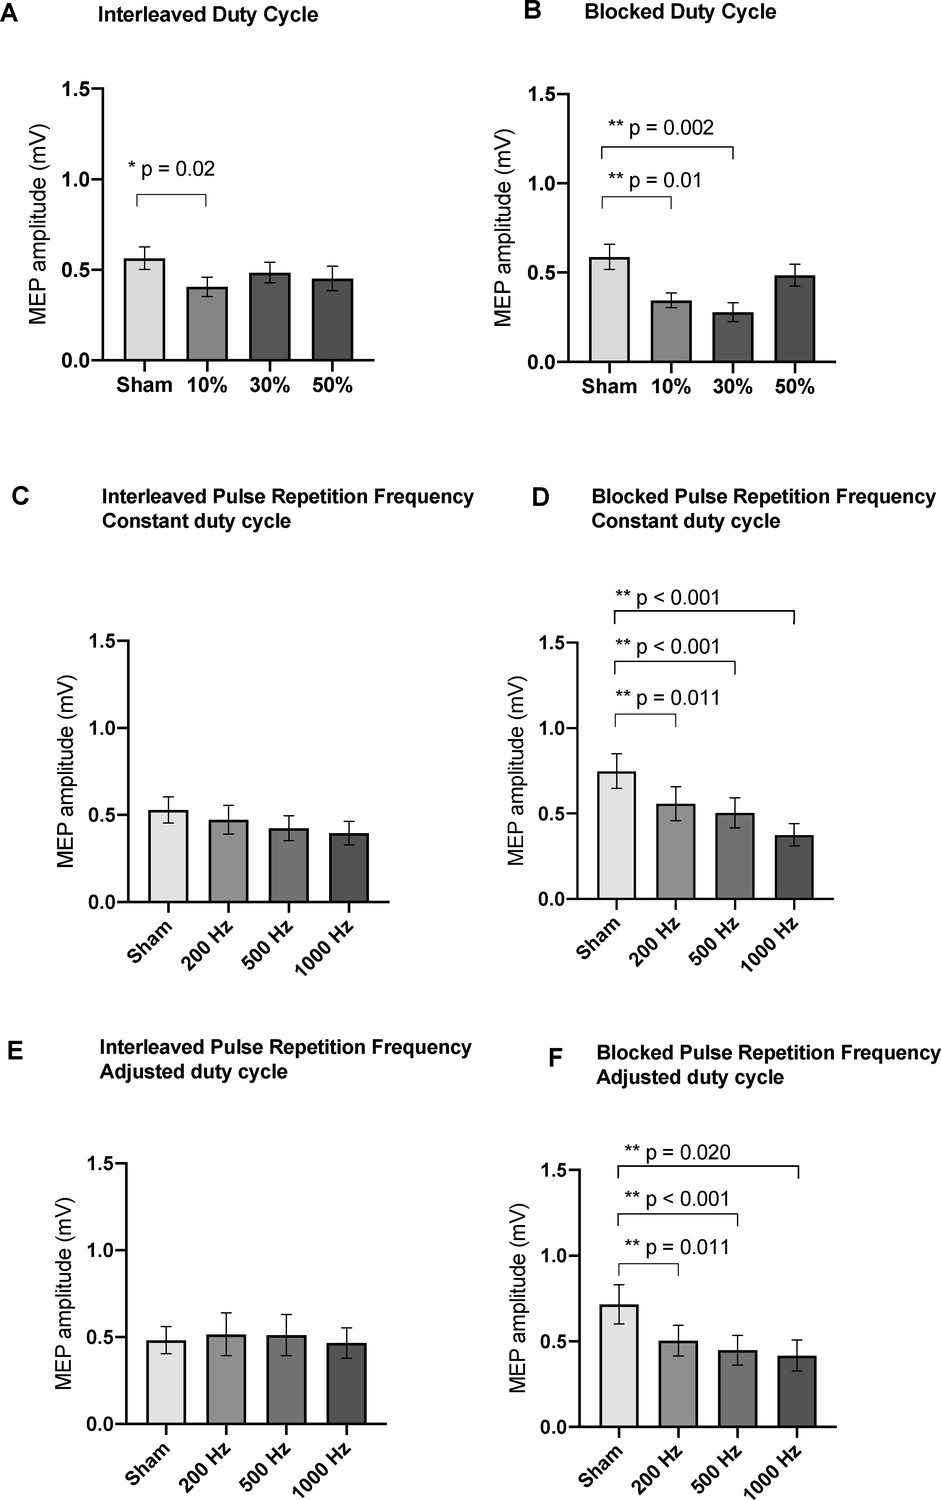
Effects of blocked and interleaved variation of ultrasound parameters on TMS-induced resting peak-to-peak MEP amplitudes as measured by FDI EMG (N = 16).
Medians of MEPs were plotted across the different sub-experiments: (A) Interleaved Duty cycle (p=0.02; RM one-way ANOVA), 10% DC suppressed MEPs compared to sham. (B) Blocked Duty cycle (p<0.0001; RM one-way ANOVA), both 10% and 30% DC suppressed MEPs compared to sham. (C) Interleaving the pulse repetition frequency with constant DC parameters did not result in significant differences from sham (p=0.122; RM one-way ANOVA), but doing so in a blocked paradigm (D) resulted in significant suppression of MEPs compared to sham (p<0.001; RM one-way ANOVA) for 200, 500, and 1000 Hz. (E) Interleaving the pulse repetition frequency with adjusted DC parameters did not result in significant differences from sham (p=0.648; RM one-way ANOVA), but doing so in a blocked paradigm (F) resulted in significant suppression of MEPs compared to sham (p=0.003; RM one-way ANOVA) for 200, 500, and 1000 Hz. Error bars represent standard error. Asterisks are indicative of a significant post-hoc two-tailed paired t-test, and p-values are adjusted with the Holm-Bonferroni method (α = 0.05).
Figure 5—figure supplement 2
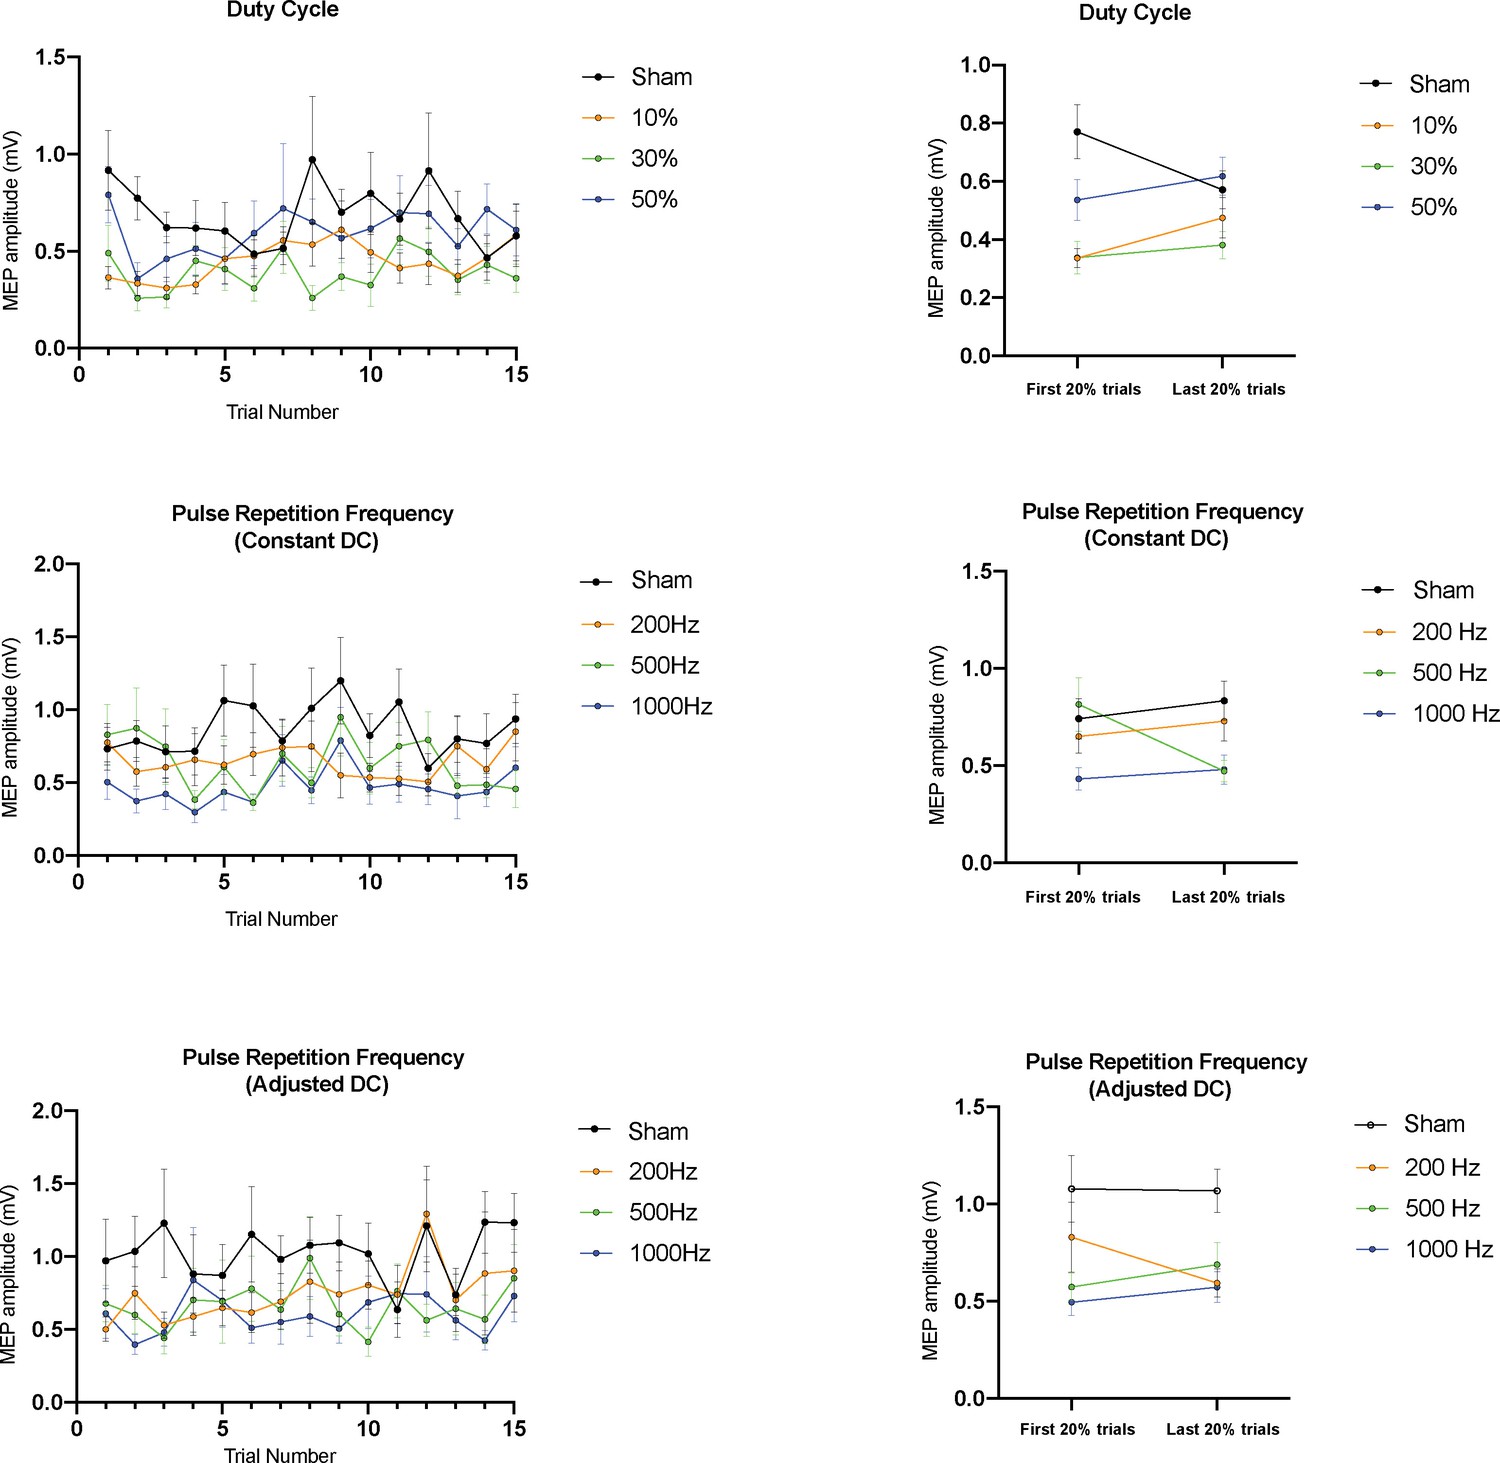
Post-hoc analysis of blocked delivery of ultrasound parameters by trial number (N = 16).
The left panels plot the mean TMS-induced resting peak-to-peak MEP amplitudes stratified by trial number within the block for the three parameter condition sets tested. The right panels compare early to late trials across conditions. In the blocked Duty Cycle experiment, no significant differences between early and late trials were found in the sham, 10%, 30%, or 50% conditions (p=0.31, 0.31, 0.81,0.81, paired t-tests). Similarly, in the blocked PRF experiments, no differences were found between early and late trials within the sham, 100, 500, or 1000 Hz conditions when DC was held constant (p=0.09, 1.0, 1.0, 1.0, paired t-tests) or adjusted (p=0.92, 1.0, 1.0, 1.0, paired t-tests). Error bars represent standard error, and p-values are adjusted with the Holm-Bonferroni method (α = 0.05).
Figure 6
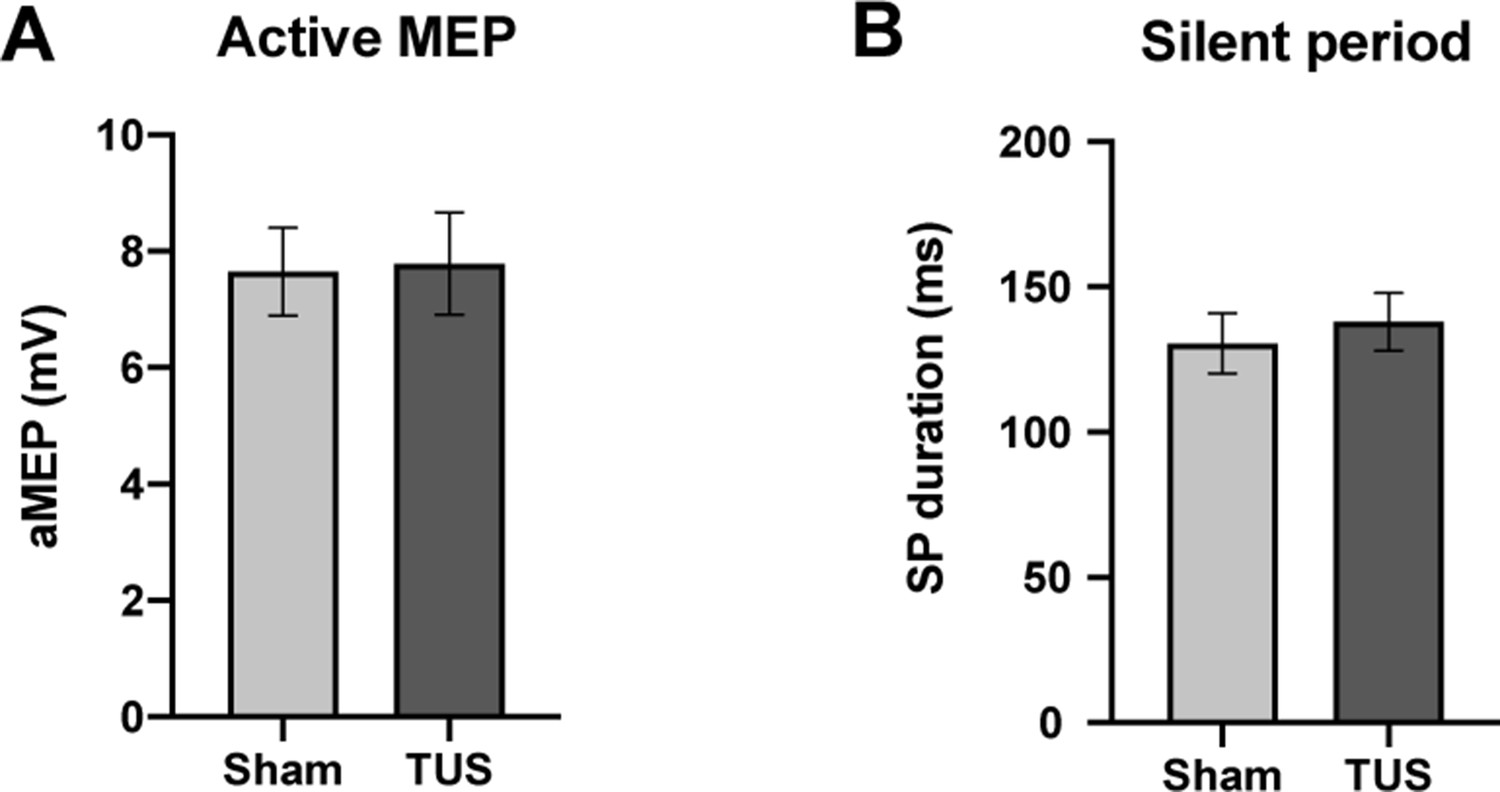
Results of single-pulse experiments investigating active MEP, including (A) amplitude, and (B) silent period (SP) duration of sham and TUS condition.
N = 12. Error bars represent standard error.
Figure 7
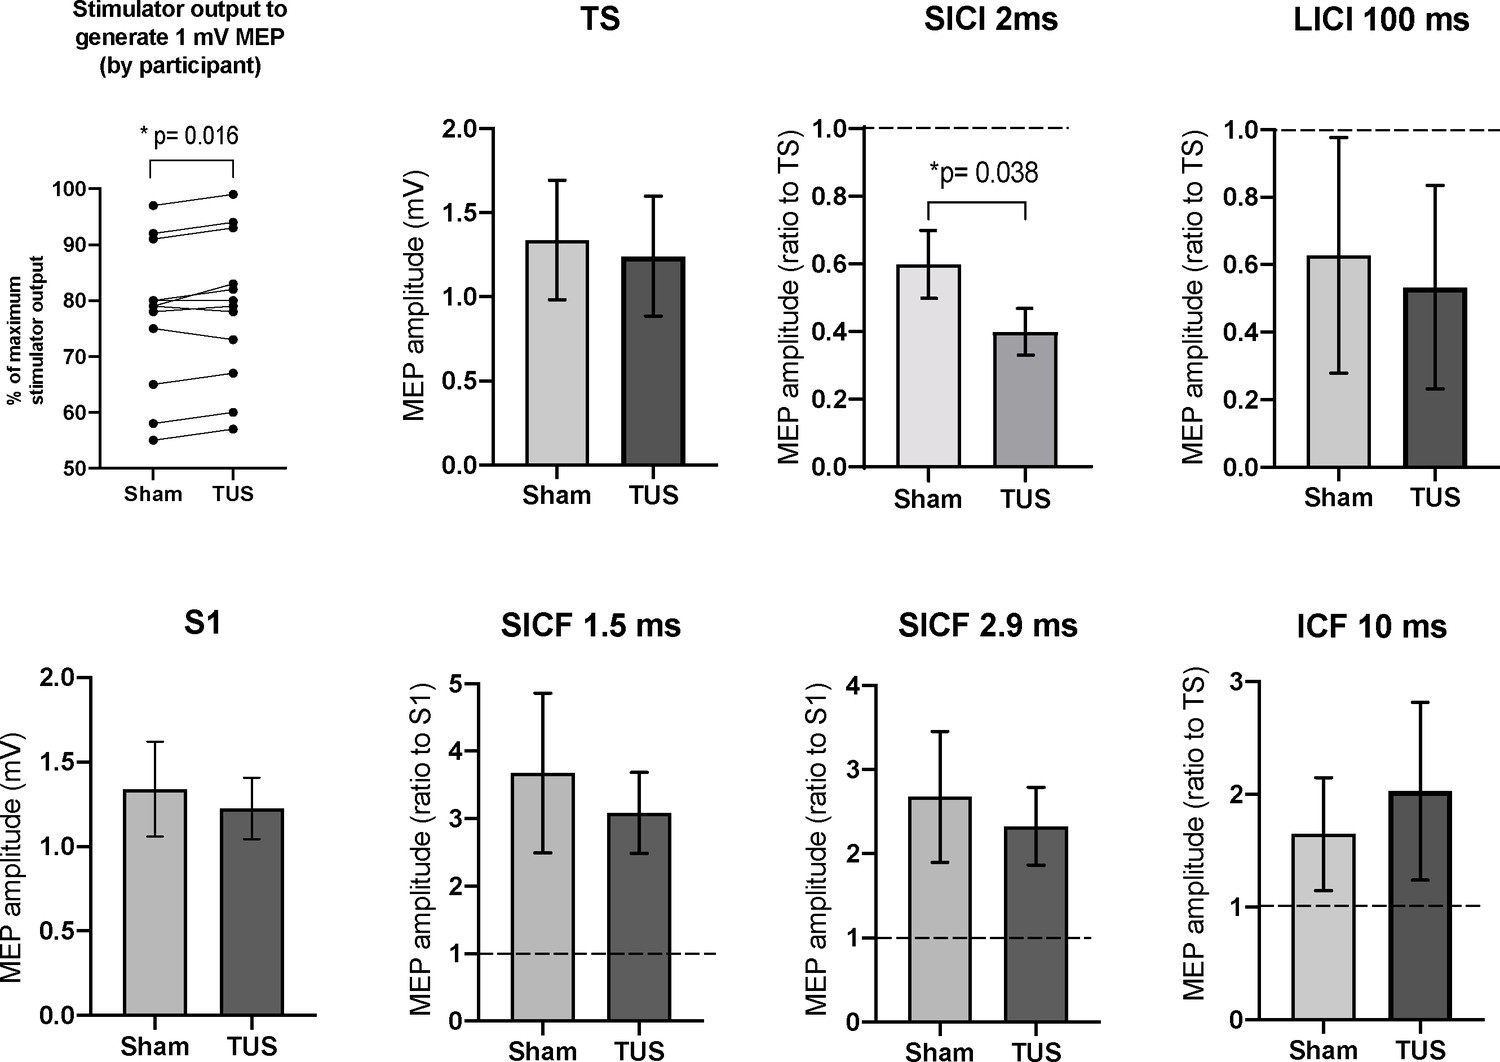
Results of the paired-pulse experiments.
A mean increase of +1.3% in stimulator intensity is required to elicit a 1 mV MEP under the TUS condition, compared to sham (p=0.016, paired t-test). After adjusting stimulator output to compensate, suppression, the TS and S1 conditions are not significantly different between sham and TUS. Results shown include short-interval intracortical inhibition (SICI), intracortical facilitation (ICF), long-interval intracortical inhibition (LICI), and short-interval cortical facilitation (SICF). N = 12. The data is plotted as a ratio to the test stimulus (TS) or stimulus alone (S1) amplitude. Ratios higher than 1.0 indicate facilitation and ratios below 1.0 indicate inhibition. TUS applied before the test stimulus significantly reduced SICI compared to sham (p=0.038, paired t-test). Error bars represent standard error.
Figure 8 with 1 supplement

Results of the visuo-motor behavioral task experiment, showing reduction in a pooled reaction time to the presentation of visual stimulus with TUS at 2.32 W/cm2, p=0.043, paired t-test (N = 12).
Reaction times for TUS at 2.32 W/cm2 compared to 0.54 W/cm2 were not significantly different (N = 4). Bottom row: Comparison of Sham and TUS trials sorted by distance to target (near, medium, far). N = 12. Asterisk denotes significance p<0.05 on paired t-test. Error bars represent standard error.
Figure 8—figure supplement 1
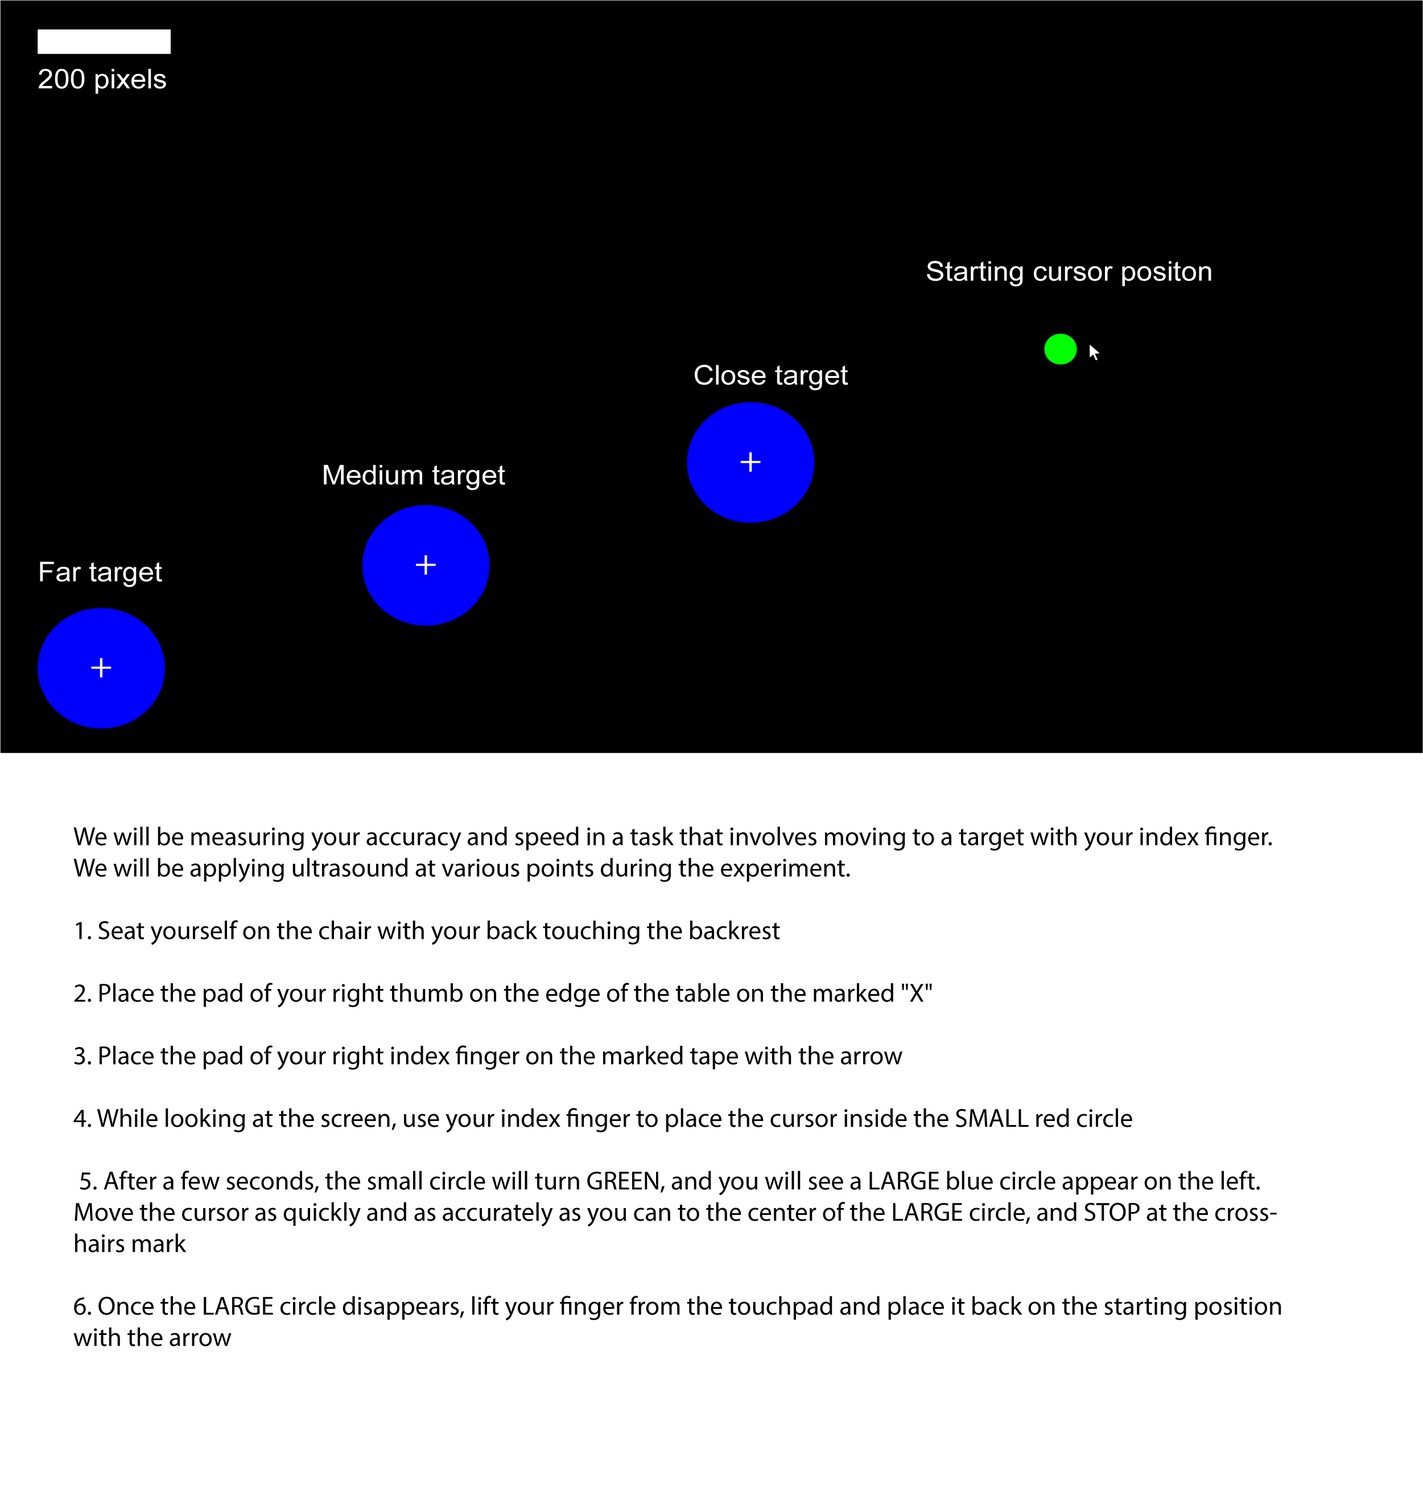
Visuomotor behavioral task starting position and targets, as they appear on the screen during the experiment (top), and instructions given to participant (bottom).
Figure 9
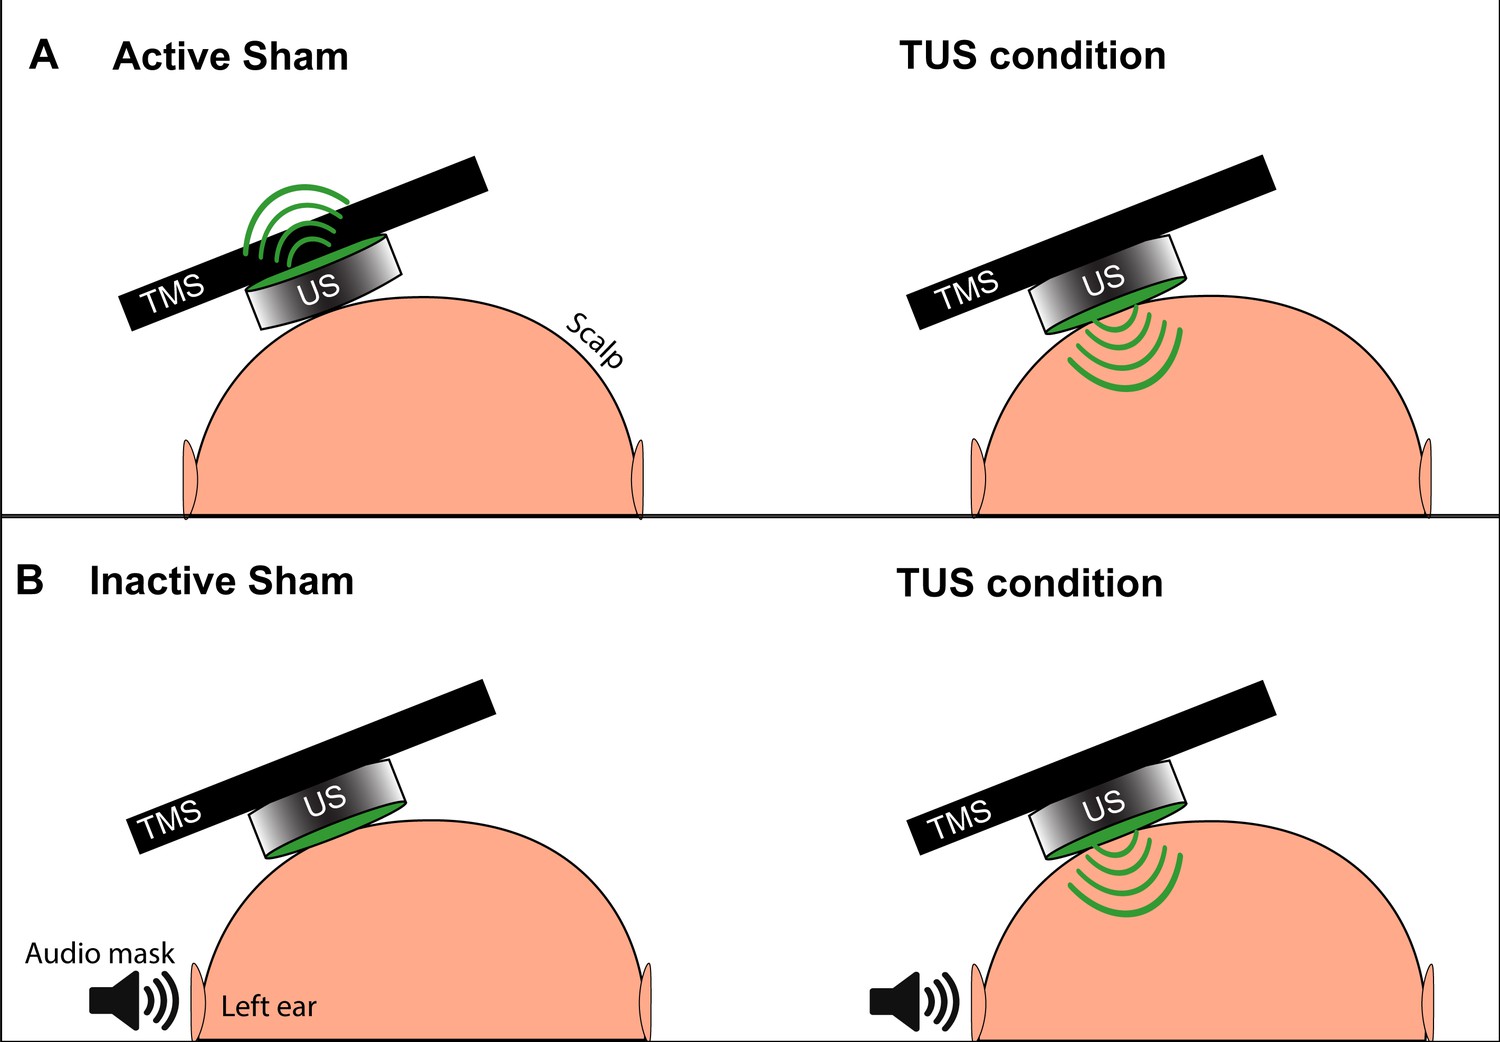
Depiction of the two types of TUS sham and masking used in experiments.
(A) The active sham condition, as per Legon et al., 2018b involves flipping the active face (green) of the transducer to point away from the scalp and delivering acoustic energy away from the subject (left). During the active TUS condition, the transducer is flipped over to deliver acoustic energy transcranially (right). (B) Our inactive sham condition used for quick successive delivery of experimental conditions involves keeping the active face of the transducer always oriented toward the scalp (left), and only activating the transducer and delivering acoustic energy transcranially during an active TUS condition (right). This allows for interleaving experimental conditions with sham without the need to manually reposition the transducer. An audible tone lasting 0.5 s is played near the ipsilateral ear during both conditions to mask TUS delivery.
Figure 10
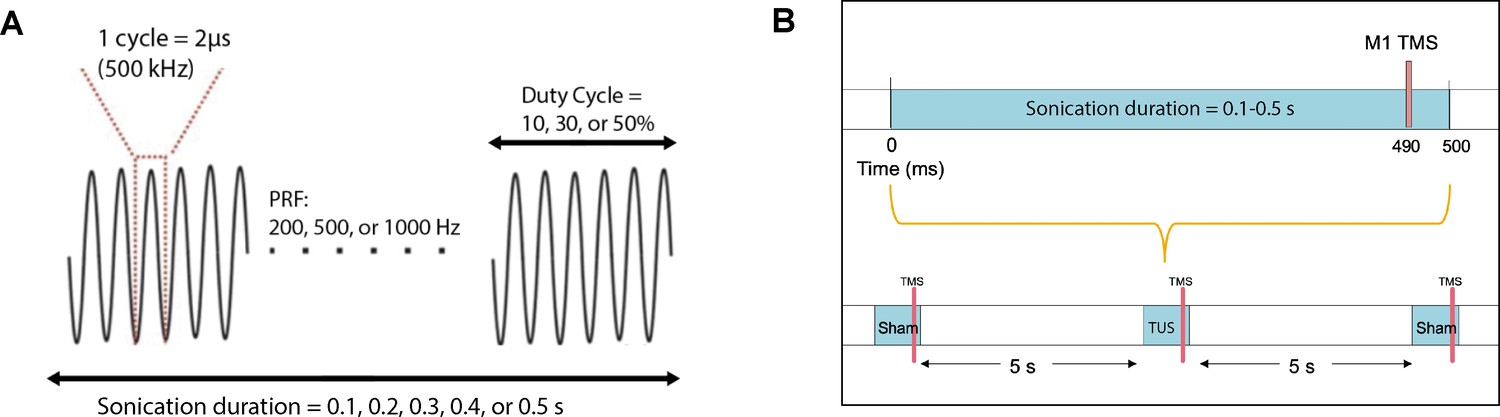
Acoustic parameters and timing relative to TMS.
(A) Acoustic parameters of low-intensity ultrasound which were varied in the experiments include sonication duration, pulse repetition frequency, and duty cycle. The fundamental frequency was held constant at 500 kHz. (B) TMS and TUS stimulation delivery while varying the sonication duration parameter. Different durations (0.1, 0.2, 0.3, 0.4, 0.5 s) were randomized with the sham condition, where TUS was not delivered. TMS was always time-locked to 10 ms before the end of sonication. An inter-stimulus interval of 5 s was used between each stimulation epoch.
Appendix 1—figure 1
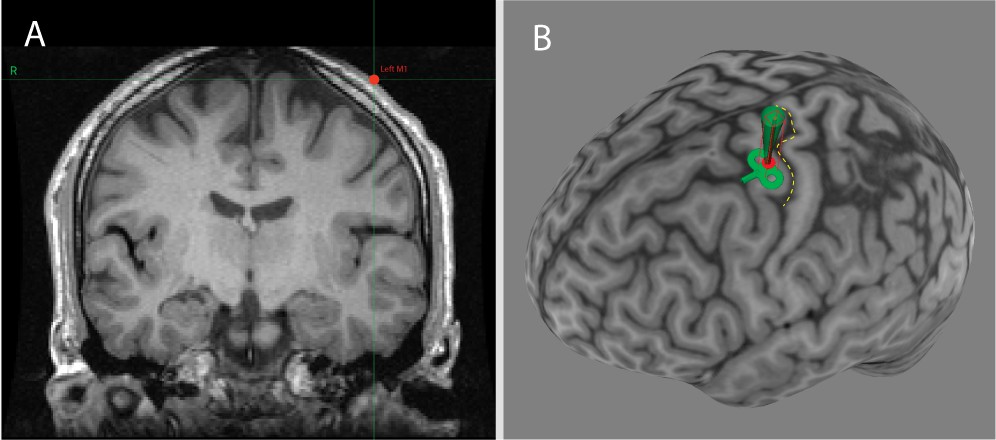
Neuronavigation software (Brainsight) showing the individualized location of the US transducer on the scalp captured during US/TMS stimulation of one participant.
Panel A: Coronal T1-weighted MRI of the brain at the location of the US transducer (red dot). Panel B: Three-dimensional reconstruction of the participant’s cortical surface, with the central sulcus highlighted with a yellow dashed line. The red dot represents the scalp location of the transducer and the green path represents the predicted path of sonication perpendicular to the transducer face.
Appendix 1—figure 2

MRI-based manual tissue segmentation pipeline shown for a single participant.
Tissue properties were set as follows, with a medium alpha power (y) = 1.43. Panel (A) Skin and scalp (green). Alpha coefficient: 2.05 dB/(MHz y cm), sound speed: 1732 m/s, density: 1100 kg/m3. Panel (B) Bone (red). Alpha coefficient: 8.83 dB/(MHz y cm), sound speed: 2850 m/s, bulk density: 1732 kg/m3. Panel (C) Brain (blue). Alpha coefficient: 1.00 dB/(MHz y cm), sound speed: 1552 m/s, density: 1040 kg/m3. Panel (D) The three masks were used to set the properties of the acoustic propagation medium in the subsequent numerical simulation. The background medium was set as water (black) with the following properties: Alpha coefficient: 0.05 dB/(MHz y cm), sound speed: 1482 m/s, density: 1000 kg/m3.
Appendix 1—figure 3
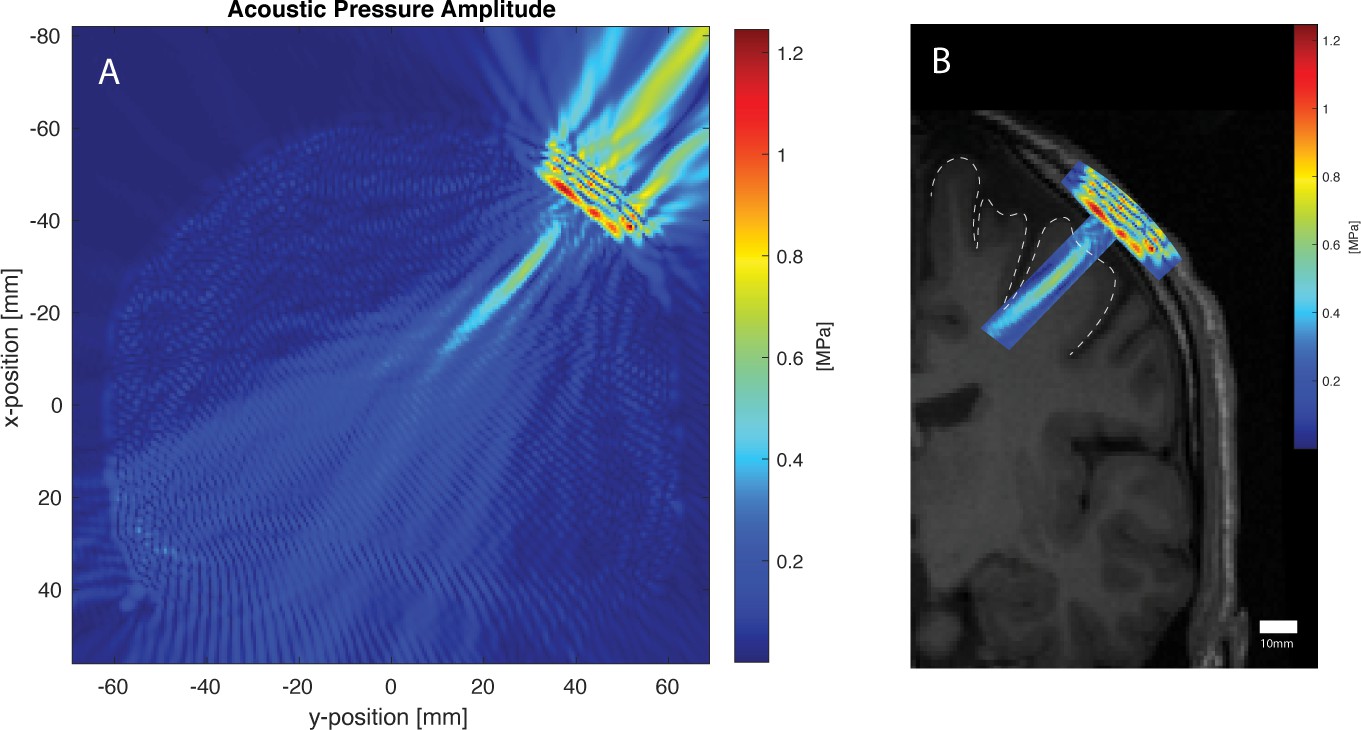
Acoustic simulation and visualization for the same participant using the k-WAVE Matlab toolbox.
The parameters of the simulation were as follows: Fundamental frequency: 500 kHz, Grid points: 472 × 472, Points-per-wavelength: 10, Points per period: 67, Courant-Friedrichs-Lewy number: 0.15, Size of perfectly matched layer: 20 grid points. Panel A: Acoustic pressure profile of simulated 500 kHz transducer sonicating against the participant’s scalp at the scalp location determined by neuronavigation. Cigar-shaped focus within the brain, and artifact from non-active transducer face can be seen. Panel B: Pressure profile deep to the transducer overlaid onto participant’s T1 MRI (left hemisphere only shown), with the primary motor cortex cortical surface shown with a dotted line. Areas outside the acoustic focus are cropped.
Appendix 2—figure 1

Visual and imaging validation of air-free coupling interfaces.
Panel (A): Visible air bubble at the TUS transducer-gel interface, indicated by the red arrow (left), and corresponding refraction and shadowing artifact seen when an imaging transducer (Hitachi Aloka ProSound Alpha 7) is placed over the air bubble (right). Panel (B) Manual smoothing of the gel pad is performed until any small bubbles are extruded, leaving a homogenous black interface (left), and confirmatory imaging with ultrasound probe at the gel pad surface shows no artifact at the TUS transducer-gel interface (right). Panel (C) Application of gel pad over the frontal bone with the imaging transducer applied over the gel, visualizing the scalp-pad interface (left). Imaging of the scalp-pad interface, showing underlying tissue layers with no visible artifacts (right).
Author response image 1
Tables
Table 1
Calculated extracranial and estimated intracranial acoustic intensity values by parameter.
| 10% DC, PRF = 1000 Hz, SD 0.1–0.5 s | 30% DC, PRF = 1000 Hz, SD 0.1–0.5 s | 50% DC, PRF = 1000 Hz, SD 0.1–0.5 s | ||||
|---|---|---|---|---|---|---|
| Extracranial (quantified) | Intracranial (estimated) | Extracranial (quantified) | Intracranial (estimated) | Extracranial (quantified) | Intracranial (estimated) | |
| ISPTA (W/cm2) | 0.93 | 0.23 | 2.78 | 0.69 | 4.63 | 1.16 |
| ISPPA(W/cm2) | 9.26 | 2.32 | 9.26 | 2.32 | 9.26 | 2.32 |
| MI (unitless) | 0.74 | 0.19 | 0.74 | 0.19 | 0.74 | 0.19 |
Additional files
Download links
A two-part list of links to download the article, or parts of the article, in various formats.
Downloads (link to download the article as PDF)
Open citations (links to open the citations from this article in various online reference manager services)
Cite this article (links to download the citations from this article in formats compatible with various reference manager tools)
Systematic examination of low-intensity ultrasound parameters on human motor cortex excitability and behavior
eLife 9:e54497.
https://doi.org/10.7554/eLife.54497


