Spen links RNA-mediated endogenous retrovirus silencing and X chromosome inactivation
- Center for Personal Dynamic Regulomes, Stanford University, United States
- Department of Biochemistry, University of Colorado, United States
- Department of Dermatology, Stanford University School of Medicine, United States
- Department of Surgery, Division of Plastic and Reconstructive Surgery, Stanford University School of Medicine, United States
- Institute for Stem Cell Biology and Regenerative Medicine, Stanford University, United States
- Novartis Institute for Biomedical Research, United States
- Howard Hughes Medical Institute, Stanford University, United States
Figures
Figure 1 with 1 supplement
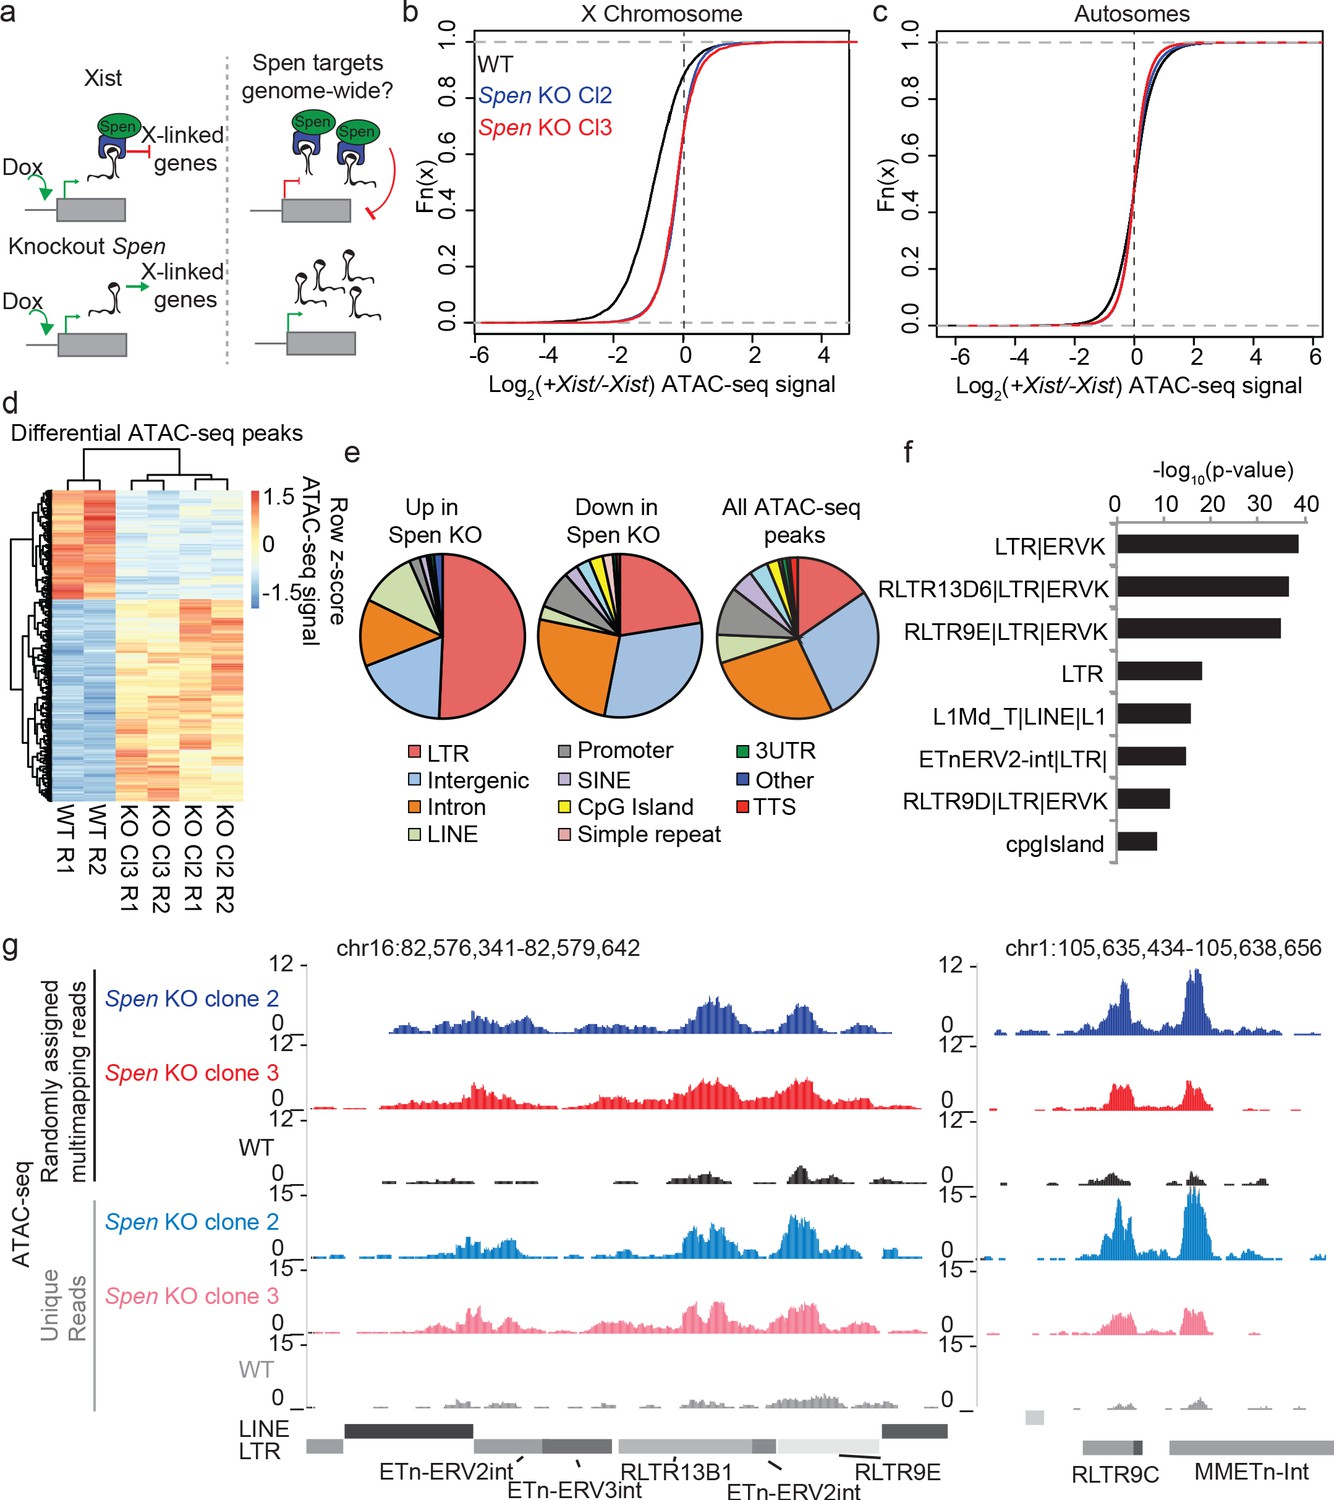
Spen knockout blocks XCI chromosome-wide and leads to derepression of autosomal ERVs.
(a) Diagram of experimental set up. Spen KO mESCs are cultured +/- Doxycycline for 48 hr to induce Xist expression and then ATAC-seq is performed. We ask which sites are de-repressed in Spen KO compared to WT cells both during XCI and on the autosomes. (b) Log2 ratio of ATAC-seq signal in +Dox and –Dox samples at all ATAC-seq peaks on the X chromosome in WT and Spen KO mESCs. Two independent Spen KO mESC clones are shown. (c) Same as in b for all autosomal peaks. (d) Heatmap showing ATAC-seq signal for all differential peaks between WT and Spen KO mESCs. Values depict the z-scored value for normalized ATAC-seq reads within each peak for WT, Spen KO Cl2, and Spen KO Cl3 cells (with two replicates each). (e) Pie charts depicting the proportion of ATAC-seq peaks that cover each genomic region annotation. Annotations are derived from HOMER. (f) Genome Ontology enrichment (by HOMER) for all sites gaining accessibility in Spen KO mESCs compared to WT (n = 288). Plotted is the –log10 p-value for enrichment. P values (one-sided binomial) are corrected for multiple hypothesis testing using the Benjamini-Hochberg correction. (g) Two example ERVK regions on chromosome 16 (left) and chromosome 1 (right) showing a gain in chromatin accessibility specifically in two clones of Spen KO mESCs. Shown are tracks of uniquely mapping reads (top) and tracks where multimapping reads are randomly assigned to one location (bottom).
Figure 1—figure supplement 1
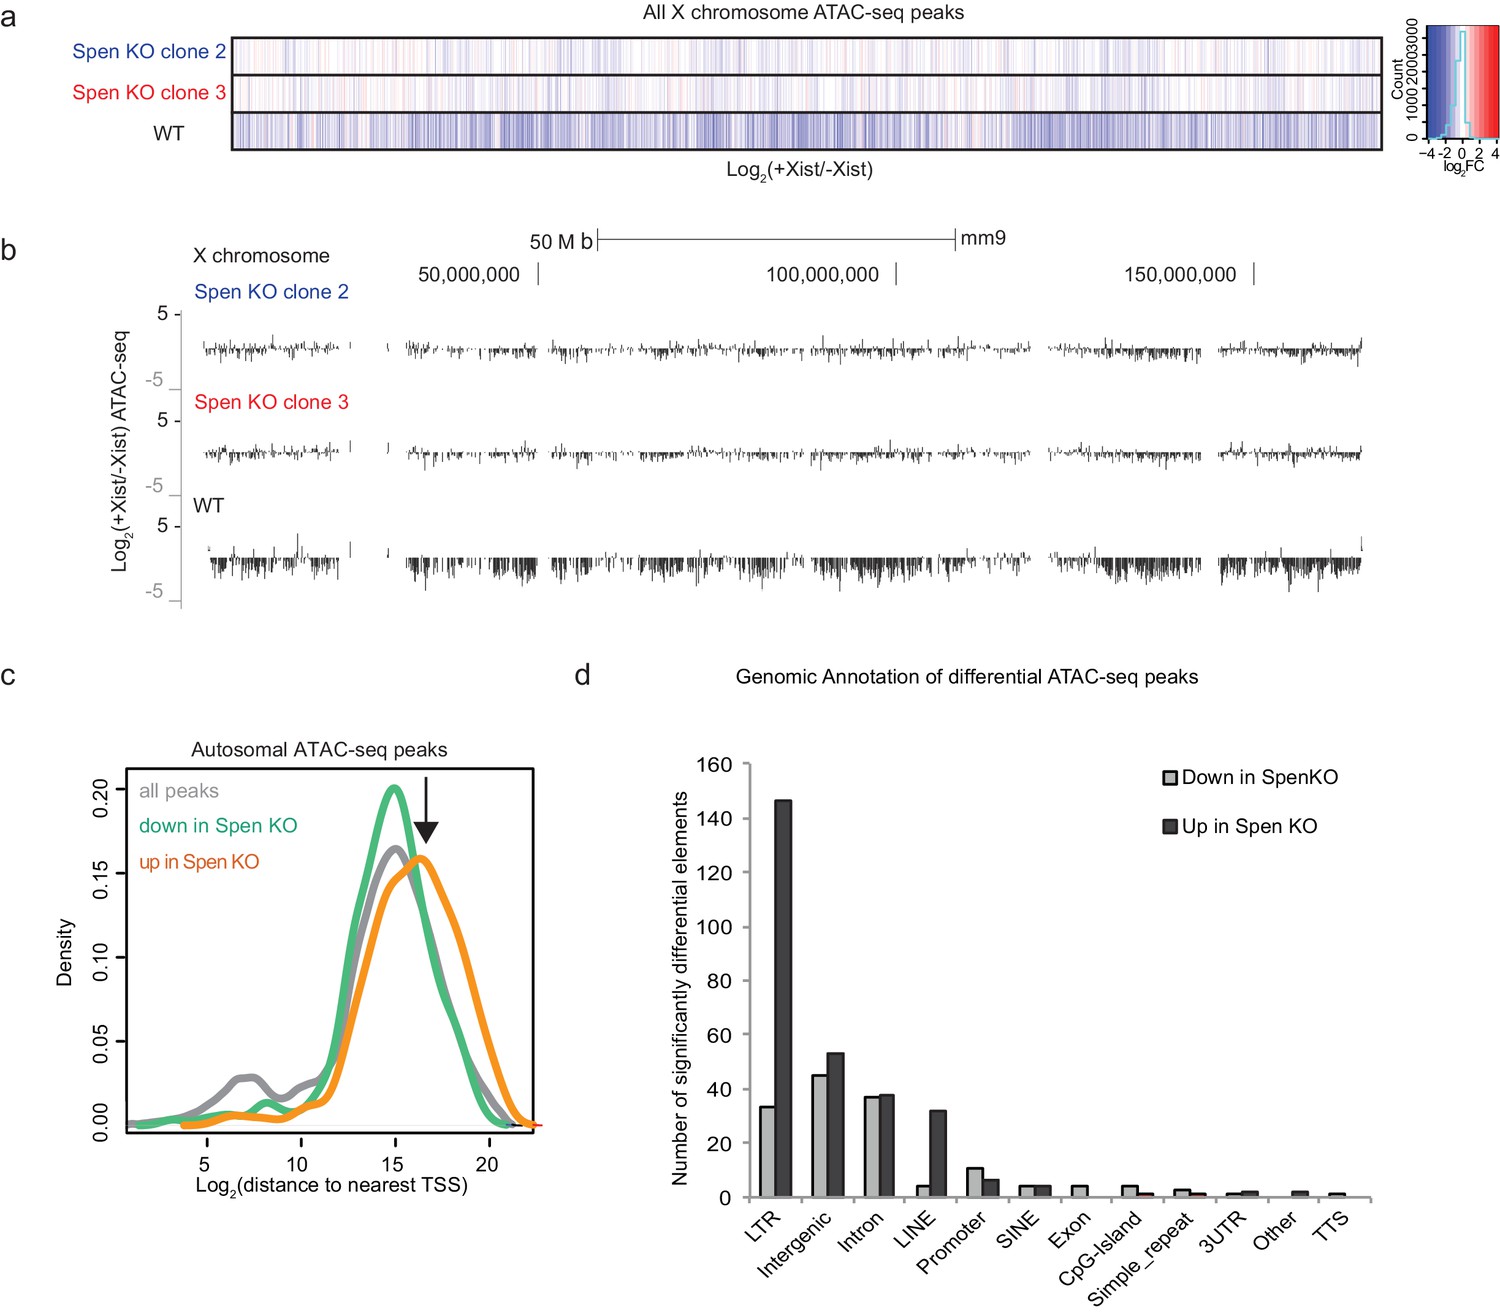
Spen is required for XCI chromosome-wide.
(a) Heatmap showing the log2(fold change) in +Dox / -Dox conditions in WT and Spen KO clones 2 and 3 for all ATAC-seq peaks on the X chromosome. (b) Tracks showing the log2 ratio of ATAC-seq signal in +Dox and –Dox samples for 2 Spen KO clones and one WT clone after 48 hr Xist induction. The entire X chromosome is shown to scale. (c) The log2 distance to the nearest coding gene transcription start site (TSS) for all ATAC-seq peaks on the autosomes. All peaks are shown in gray and show a small peak at TSSs and a larger peak at distal sites. Peaks that lose accessibility in Spen KO (green) show a similar pattern. Peaks that gain accessibility (orange) in Spen KO are distal to TSSs, as indicated by arrow (p-value=5.97×10⁻¹³ by KS test) and do not overlap promoters. (d) Plot showing the number of ATAC-seq peaks covering each genomic annotation from HOMER. Shown are the significantly differential peaks between WT and Spen KO mESCs that gain (black) or lose (gray) accessibility.
Figure 2 with 3 supplements
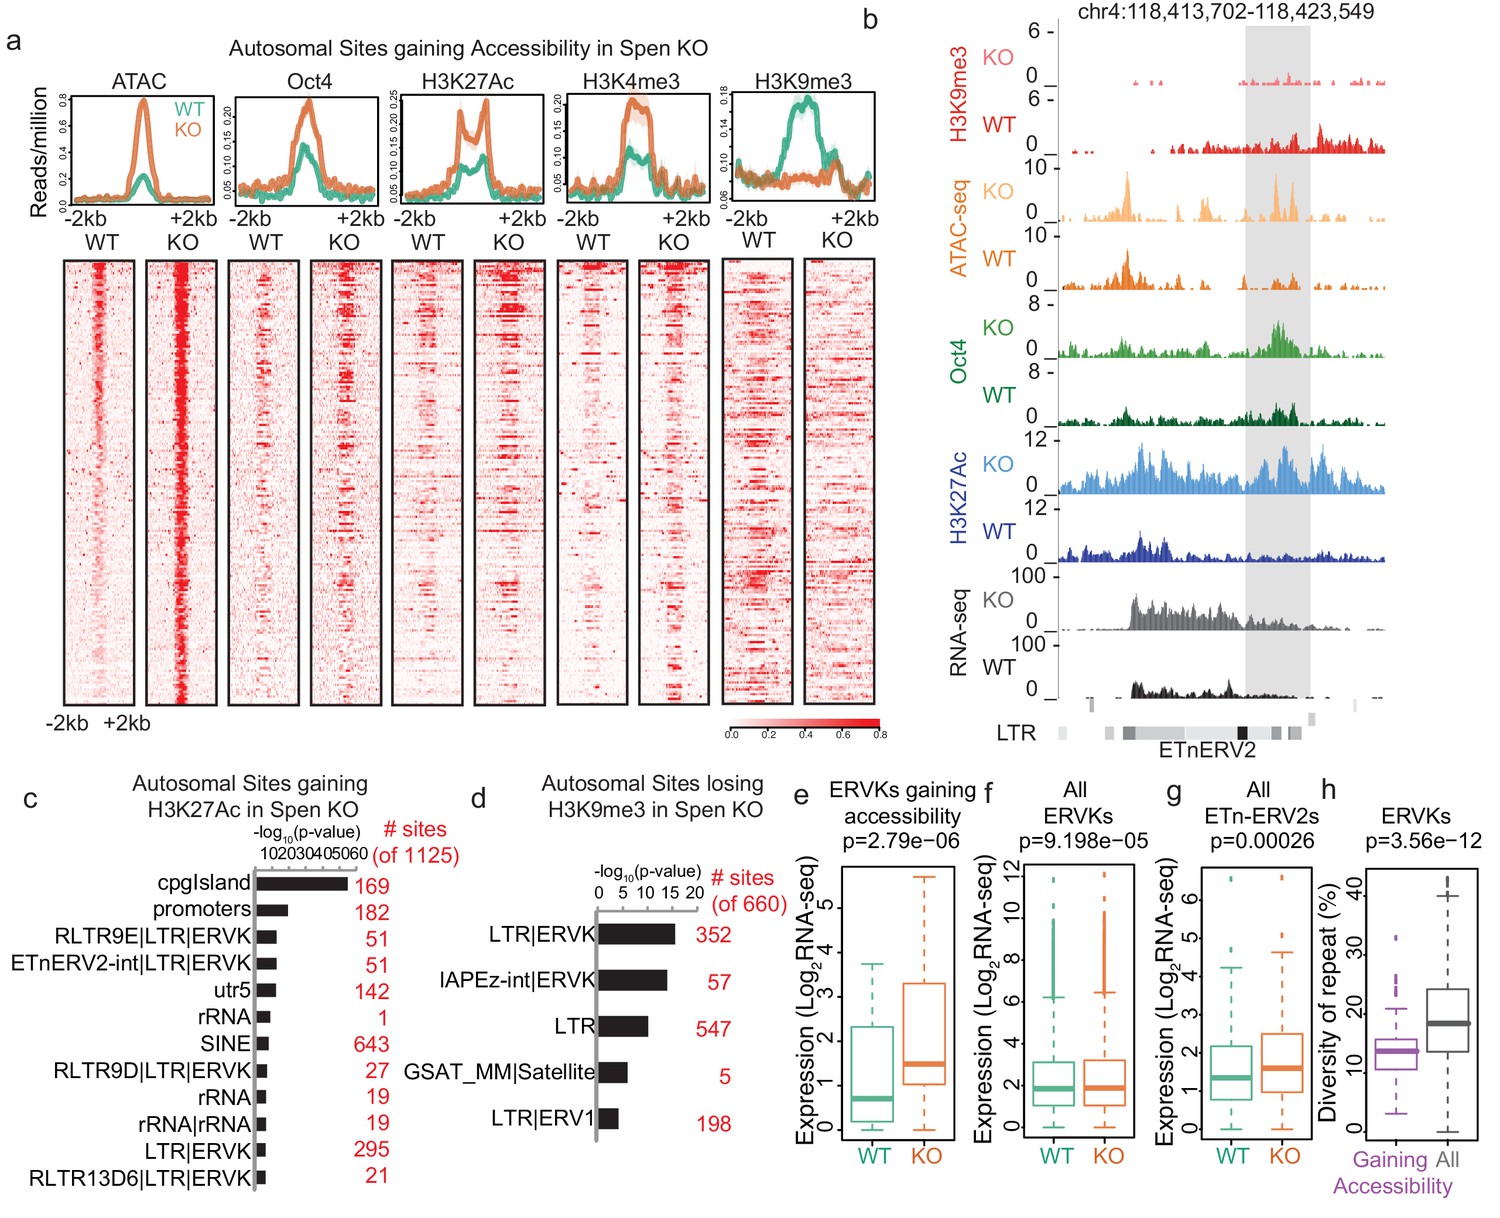
Spen knockout leads to gain of histone acetylation and loss of H3K9me3-mediated repression at ERVKs.
(a) Average diagrams and heatmaps showing the read count per million mapped reads for ATAC-seq and ChIP-seq plotted over all ATAC-seq peaks that gain accessibility in Spen KO mESCs (n = 288) (+ / - 2 kb). From left to right are ATAC-seq, Oct4 ChIP-seq, H2K27Ac ChIP-seq, H3K4me3 ChIP-seq, and H3K9me3 ChIP-seq. Data is shown for WT mESCs (green) and Spen KO clone 2 mESCs (orange). For the heatmaps, each row represents one peak. (b) An example of an ETnERV2 element on chromosome four that shows a gain of chromatin accessibility, RNA expression, H3K27Ac ChIP-seq, Oct4 ChIP-seq, and a loss of H3K9me3 ChIP-seq in Spen KO mESCs compared to WT. (c) Genome Ontology enrichment (by HOMER) for all sites gaining H3K27Ac ChIP-seq signal in Spen KO mESCs compared to WT (n = 1125 sites). Plotted is the –log10 p-value for enrichment. P values (one-sided binomial) are corrected using the Benjamini-Hochberg correction. (d) Genome Ontology enrichment (by HOMER) for all sites losing H3K9me3 ChIP-seq signal in Spen KO mESCs compared to WT (n = 660 sites). Plotted is the –log10 p-value for enrichment. P values (one-sided binomial) are corrected using the Benjamini-Hochberg correction. (e) Expression of ERVKs gaining accessibility in Spen KO mESCs in WT mESCs (green) and Spen KO mESCs (orange). Shown is the log2 transformed normalized RNA-seq read counts. For all boxplots, the thick line represents the median, while the box gives the IQR. P values are calculated using a two-tailed T test. (f) Same as in d for all ERVKs, genome wide. (g) Same as in e for all ETn-ERV2s. (h) Diversity of repeat for all ERVK elements that gain accessibility in Spen KO mESCs (purple) and all ERVK elements (gray). Percent diversity represents the percentage of the sequence that has diverged from the ancestral TE insertion. Percentages come from RepeatMasker.
Figure 2—figure supplement 1
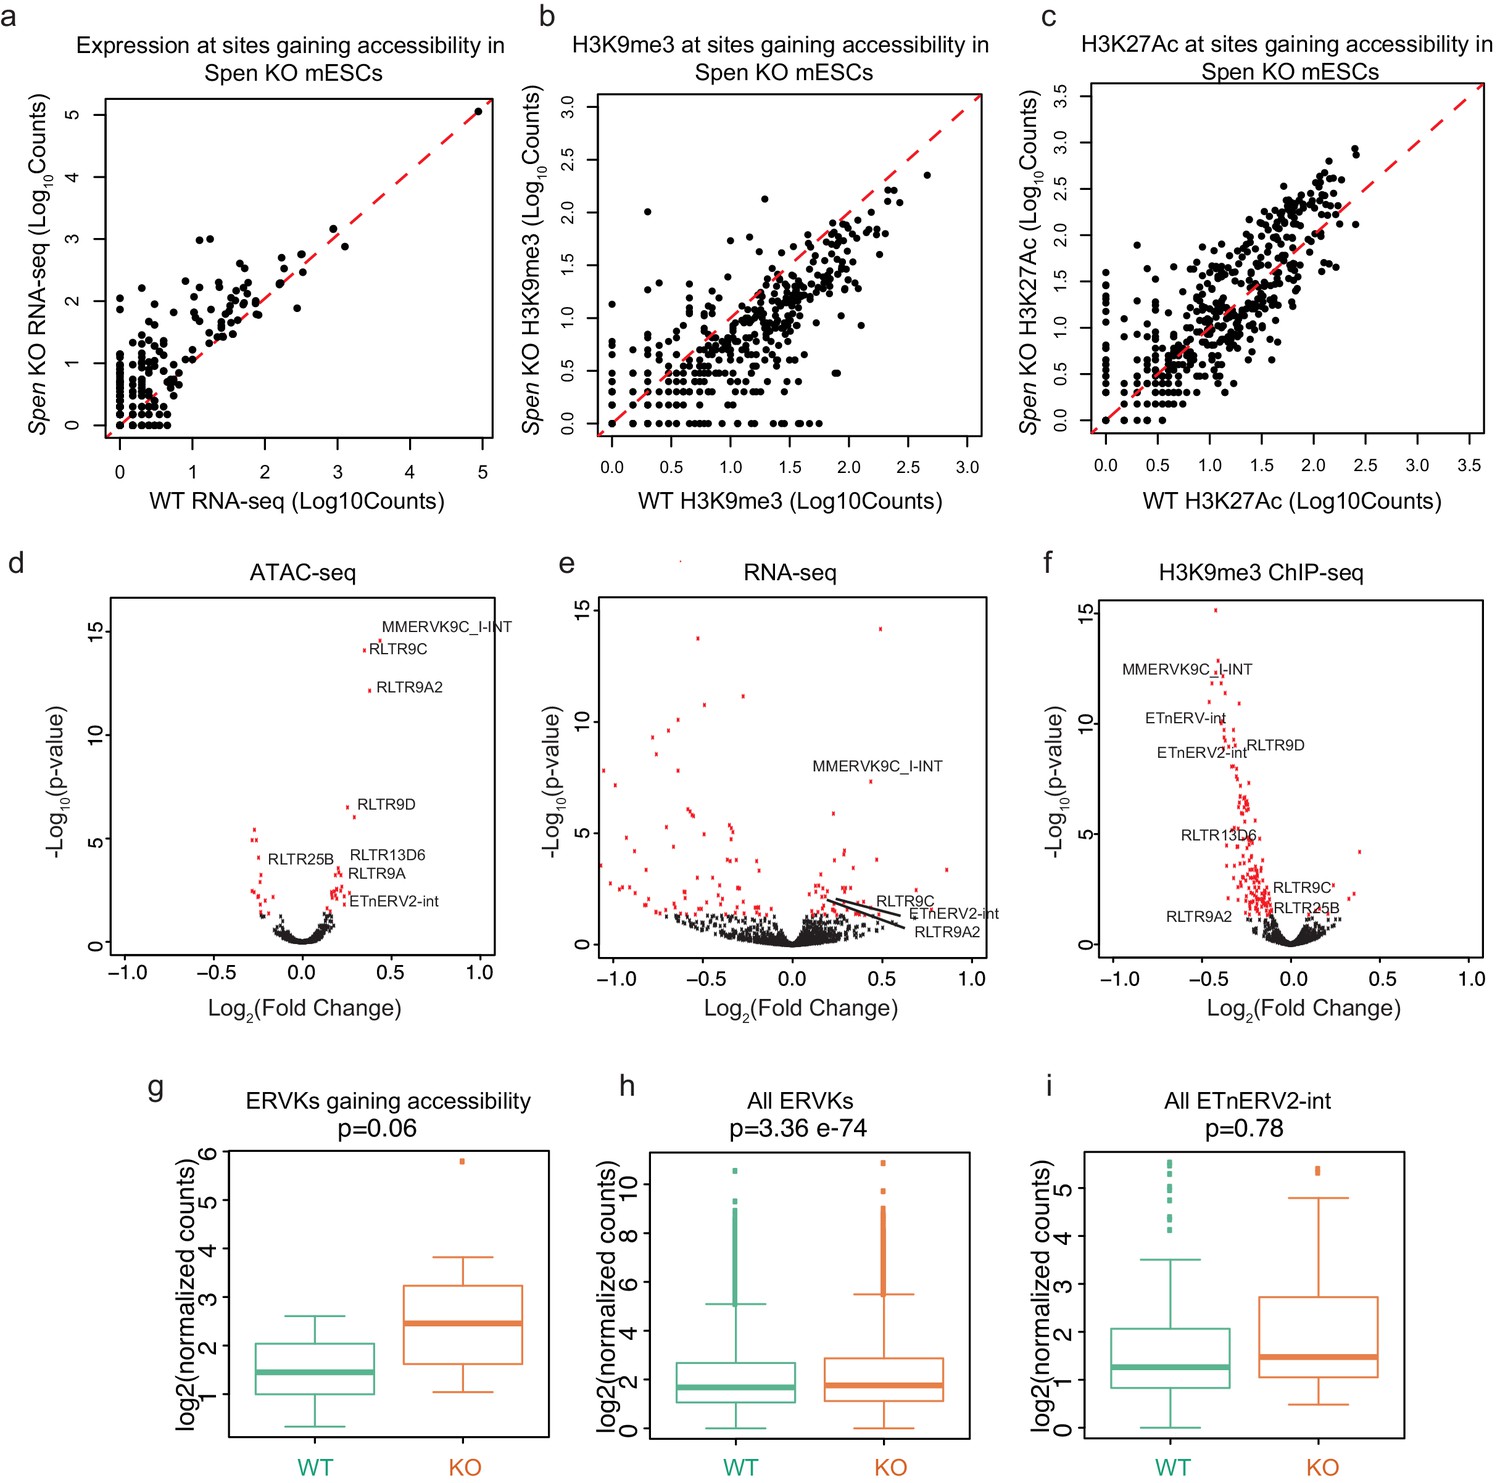
Spen KO leads to dysregulation of ERVs.
(a) Expression from RNA-seq of RNAs transcribed from sites that gain accessibility in Spen KO mESCs. The x-axis displays the normalized RNA-seq read counts from WT mESCs, and the y-axis displays the normalized RNA-seq read counts from Spen KO mESCs. The red dashed line represents y = x. (b) Same as in a for H3K9me3 ChIP-seq. (c) Sam as in b for H3K27Ac ChIP-seq. (d) Volcano plot displaying differential analysis of ATAC-seq signal at TE subfamilies in WT and Spen KO ATAC-seq. Each point represents one subfamily of TE. The x-axis represents the log2(fold change) between WT and Spen KO mESCs. The y-axis represents the -log10(adjusted p-value) from DESeq2. (e) Same as in d for RNA-seq. (f) Same as in d for H3K9me3 ChIP-seq. (g-i). Expression in WT and Spen KO mESCs of TEs using the MMR algorithm to assign multiple mapping reads (Karimi et al., 2011). Shown are ERVKs gaining accessibility in Spen KO mESCs, all ERVKs, and all ETnERV2-ints.
Figure 2—figure supplement 2
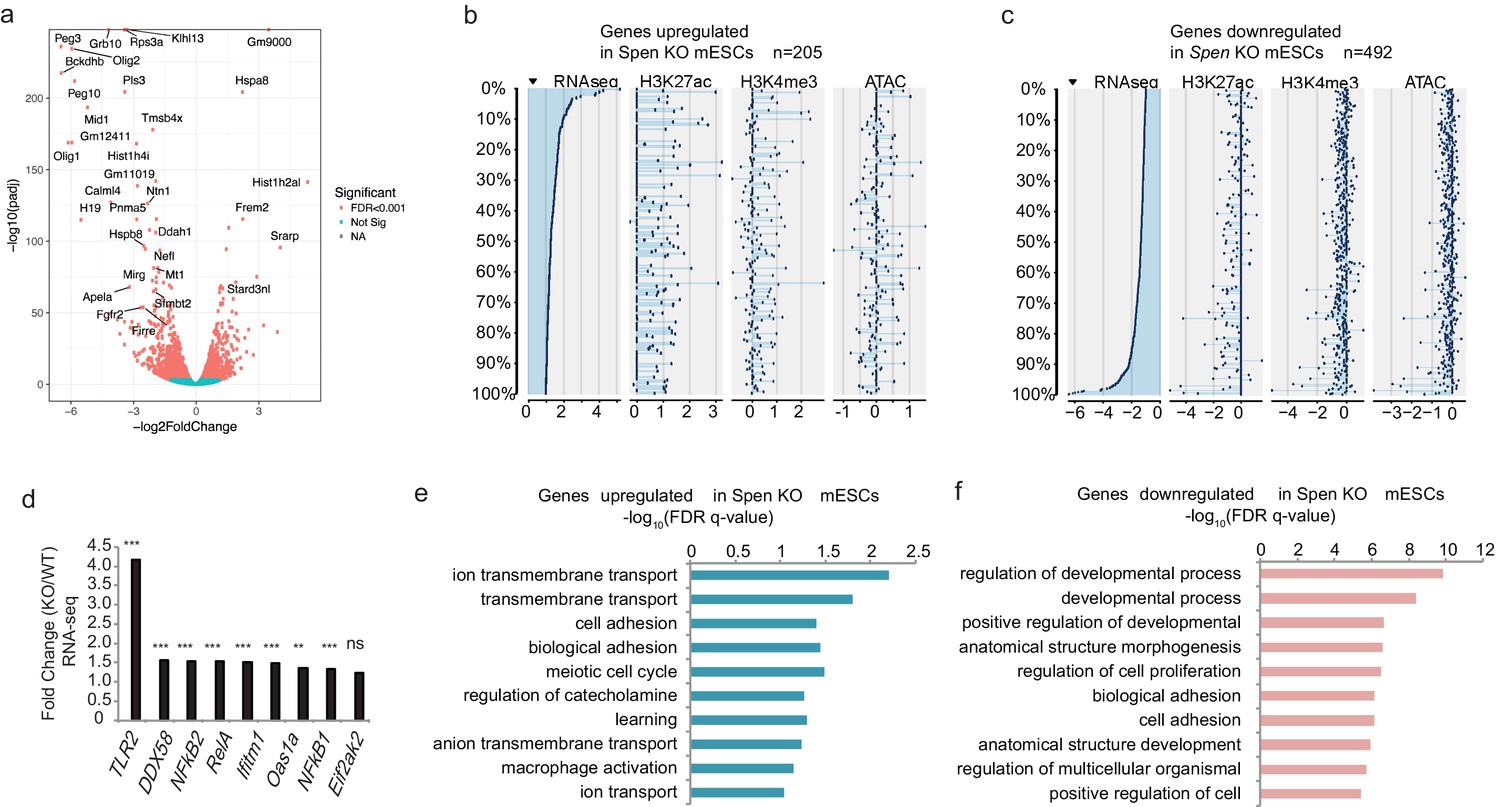
RNA-seq reveals downregulation of developmental genes in Spen KO mESCs.
(a) Volcano plot showing the log2 fold change for gene expression (RNA-seq) in WT vs. Spen KO mESCs. Genes with negative values are upregulated in Spen KO mESCs compared to WT controls. The y-axis shows the –log10 (p-adjusted) calculated from DESeq2. (b) Histone modifications and chromatin accessibility changes at the promoters of genes upregulated in Spen KO mESCs (n = 205 genes). Plotted is the log2 fold change for each mark at the promoter of genes upregulated in Spen KO mESCs. (c) Same as in b for genes downregulated in Spen KO mESCs (n = 492 genes). (d) Fold change (Spen KO/WT) in expression (from RNA-seq) for genes involved in the innate cellular immunity pathway. (e) GO terms for cellular processes associated with the genes upregulated in Spen KO mESCs. GO terms are derived from GORilla and the FDR q-value is calculated from a Benjamini-Hochberg correction of the p-value for enrichment using a ranked list of the genes changing in Spen KO. (f) GO terms for cellular processes associated with the genes downregulated in Spen KO mESCs. GO terms are derived from GORilla and the FDR q-value is calculated from a Benjamini-Hochberg correction of the p-value for enrichment using a ranked list of the genes changing in Spen KO.
Figure 2—figure supplement 3
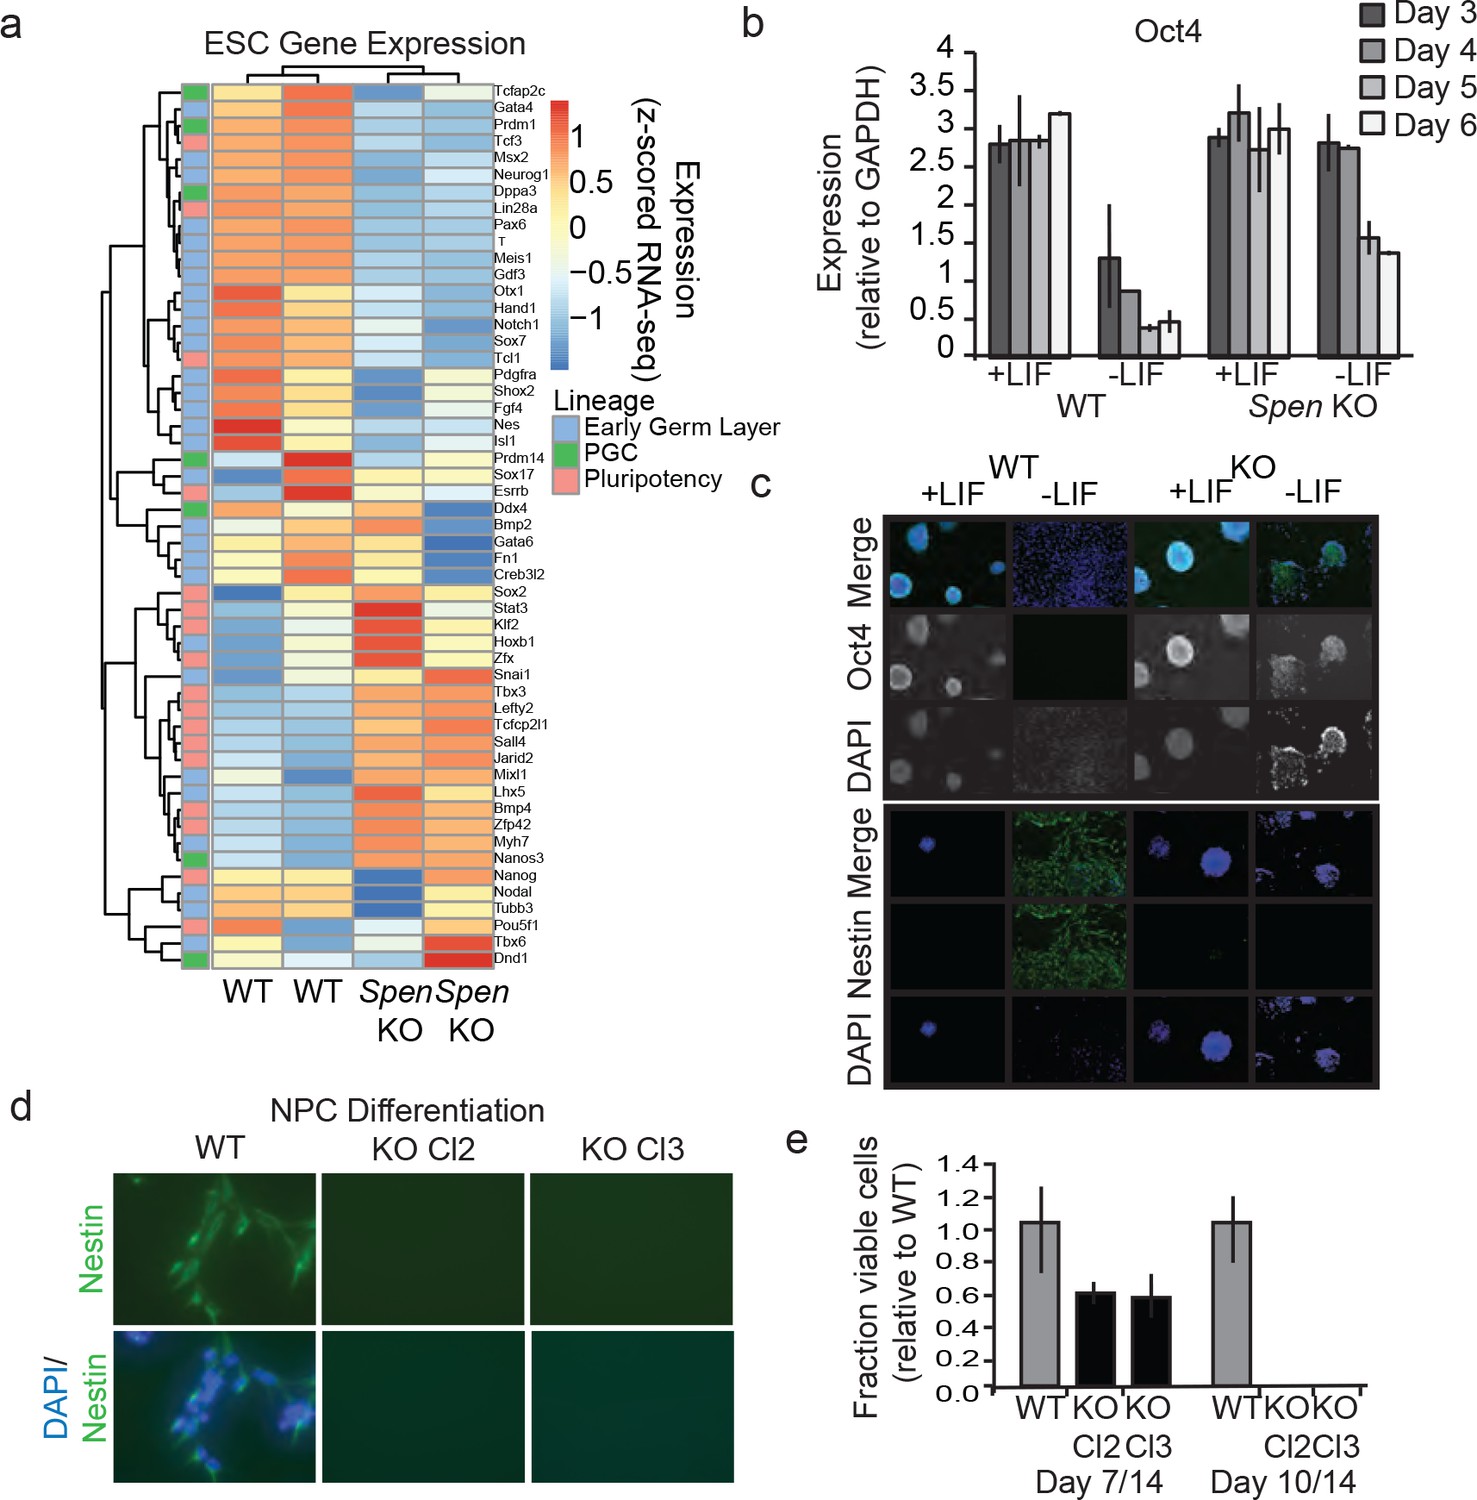
Spen KO mESCs fail to differentiate from the pluripotent state.
(a) Expression of canonical mESC genes in Spen KO and WT mESCs. Color on the left indicates whether the genes specify early germ layers (blue), primordial germ cells (green), or self-renewal (pluripotency; pink). Color in the heatmap represents the z-score for normalized expression by RNA-seq in WT and Spen KO mESCs. (b) Oct4 expression, measured by qRT-PCR in Spen KO and WT cells with or without LIF for 3,4,5, and 6 days. Expression relative to GAPDH is plotted. Error bars represent the standard deviation across three independent replicates. (c) Representative immunofluorescence images of WT and Spen KO mESCs in +LIF and –LIF conditions stained with antibodies against Oct4, and Nestin. DAPI staining shows nuclei. LIF was removed for 4 days, and cells were allowed to differentiate spontaneously in vitro before fixing and staining. (d) Representative immunofluorescence images of WT and Spen KO mESCs stained with anti-Nestin antibody and DAPI after 14 days of in vitro differentiation toward neural progenitor cells. Images are acquired at 40x magnification. (e) Quantification of the fraction of viable cells (relative to WT) at day 7 and day 14 of NPC differentiation.
Figure 3 with 3 supplements
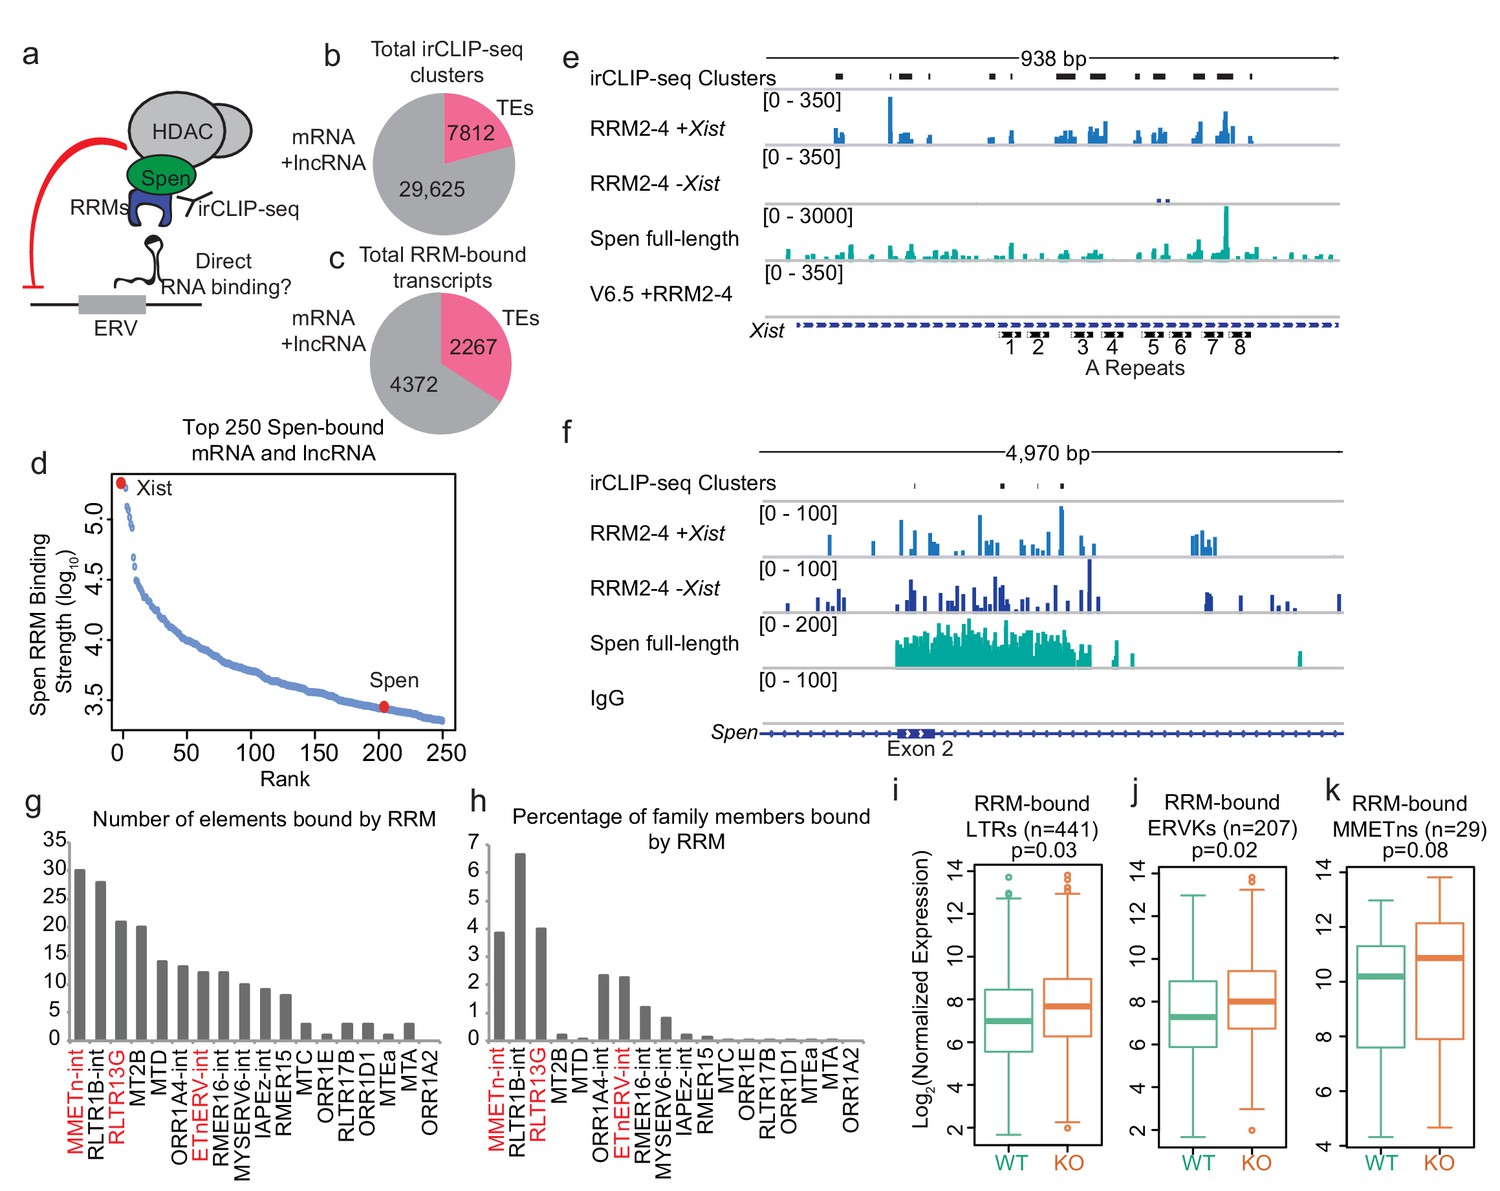
Spen’s RNA binding domains bind specifically to ERV RNAs in vivo.
(a) Diagram of irCLIP-seq rationale. irCLIP-seq was performed for the Spen RNA binding domains to identify direct RNA binding partners of Spen genome-wide. (b) Pie chart showing the number of irCLIP-seq clusteres called on TE RNAs and mRNAs and lncRNAs. (c) Pie chart showing the number of RNA transcripts containing at least one irCLIP-seq cluster in TEs and mRNAs and lncRNAs. (d) Binding strength of RRM2-4 for the top 50 Spen-bound RNAs. Xist (#1) and Spen (#204) are highlighted in red. (e) Tracks showing the irCLIP-seq signal across the A-repeats of Xist. Tracks are shown for Spen KO +RRM2-4 (+ / - Xist), Spen full-length, and V6.5 male mESCs. irCLIP-seq clusters are shown in black at the top. (f) Tracks showing the irCLIP-seq signal across exon 2 of Spen. Tracks are shown for Spen KO +RRM2-4 (+ / - Xist), Spen full-length, and an IgG control. irCLIP-seq clusters are shown in black at the top. (g) Graph showing the number of bound TE loci for each TE subfamily with significant Spen RRM2-4 binding. (h) Graph showing the percentage of TE loci bound for each TE subfamily with significant Spen RRM2-4 binding. (i) Expression of RRM-bound LTRs in WT mESCs (green) and Spen KO mESCs (orange). Shown is the log2 transformed normalized RNA-seq read counts. For all boxplots, the thick line represents the median, while the box gives the IQR. P values are calculated using a two-tailed T test. (j) Same as in i for RRM-bound ERVKs. (k) Same as in i for RRM-bound MMETns.
Figure 3—figure supplement 1
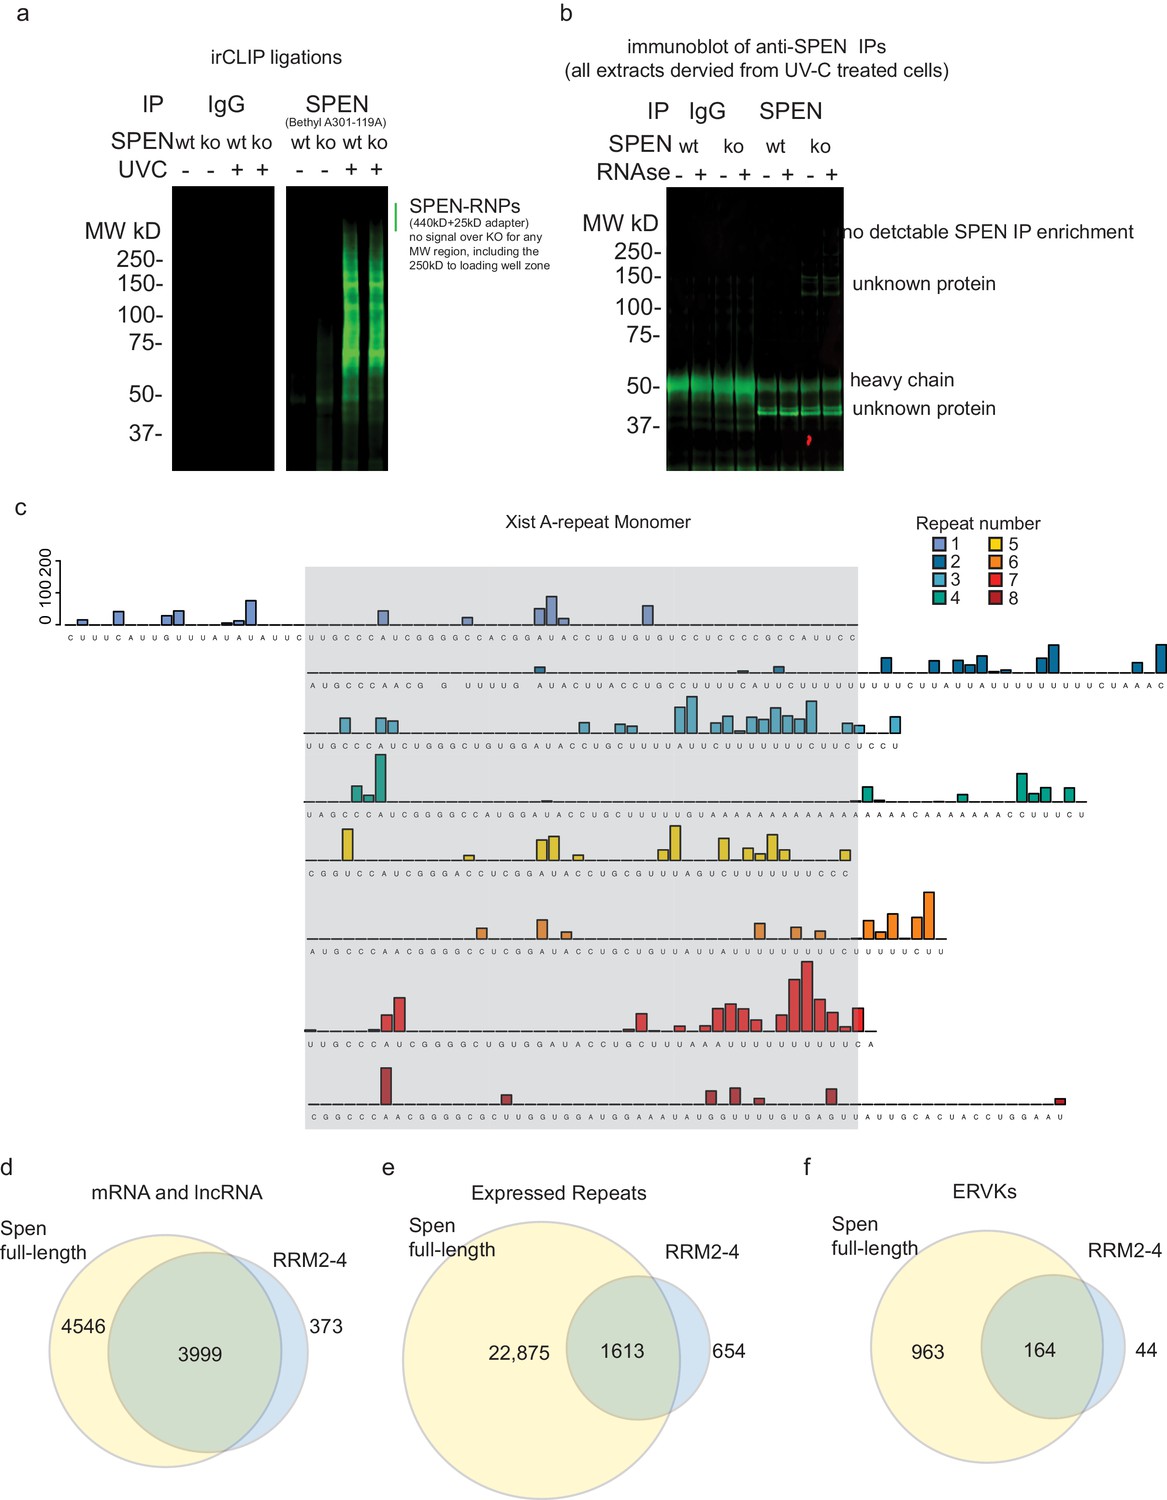
irCLIP-seq of RRM2-4 at the Xist A-repeats.
(a) irCLIP gel image showing RNA pulldown (ir-labeled) after IP of endogenous Spen (right) protein using the Bethyl A301-119A antibody or IgG in WT or Spen KO mESCs + / - UV crosslinking. (b) Immunoblot for endogenous Spen protein after IP using IgG or Spen antibody in WT and Spen KO mESCs. (c) Related to Figure 4b. irCLIP-seq signal from RRM2-4 shown for each of the A-repeats in mouse. The conserved portion of the repeat is shown stacked together (in gray box) with the linker regions outside. (d) Overlap of Spen mRNA and lncRNA targets identified by irCLIP-seq in full-length endogenous Spen irCLIP-seq vs. RRM2-4 only. (e) Same as in d for all expressed repeat RNAs. (f) Same as in d for all expressed ERVK RNAs.
Figure 3—figure supplement 2
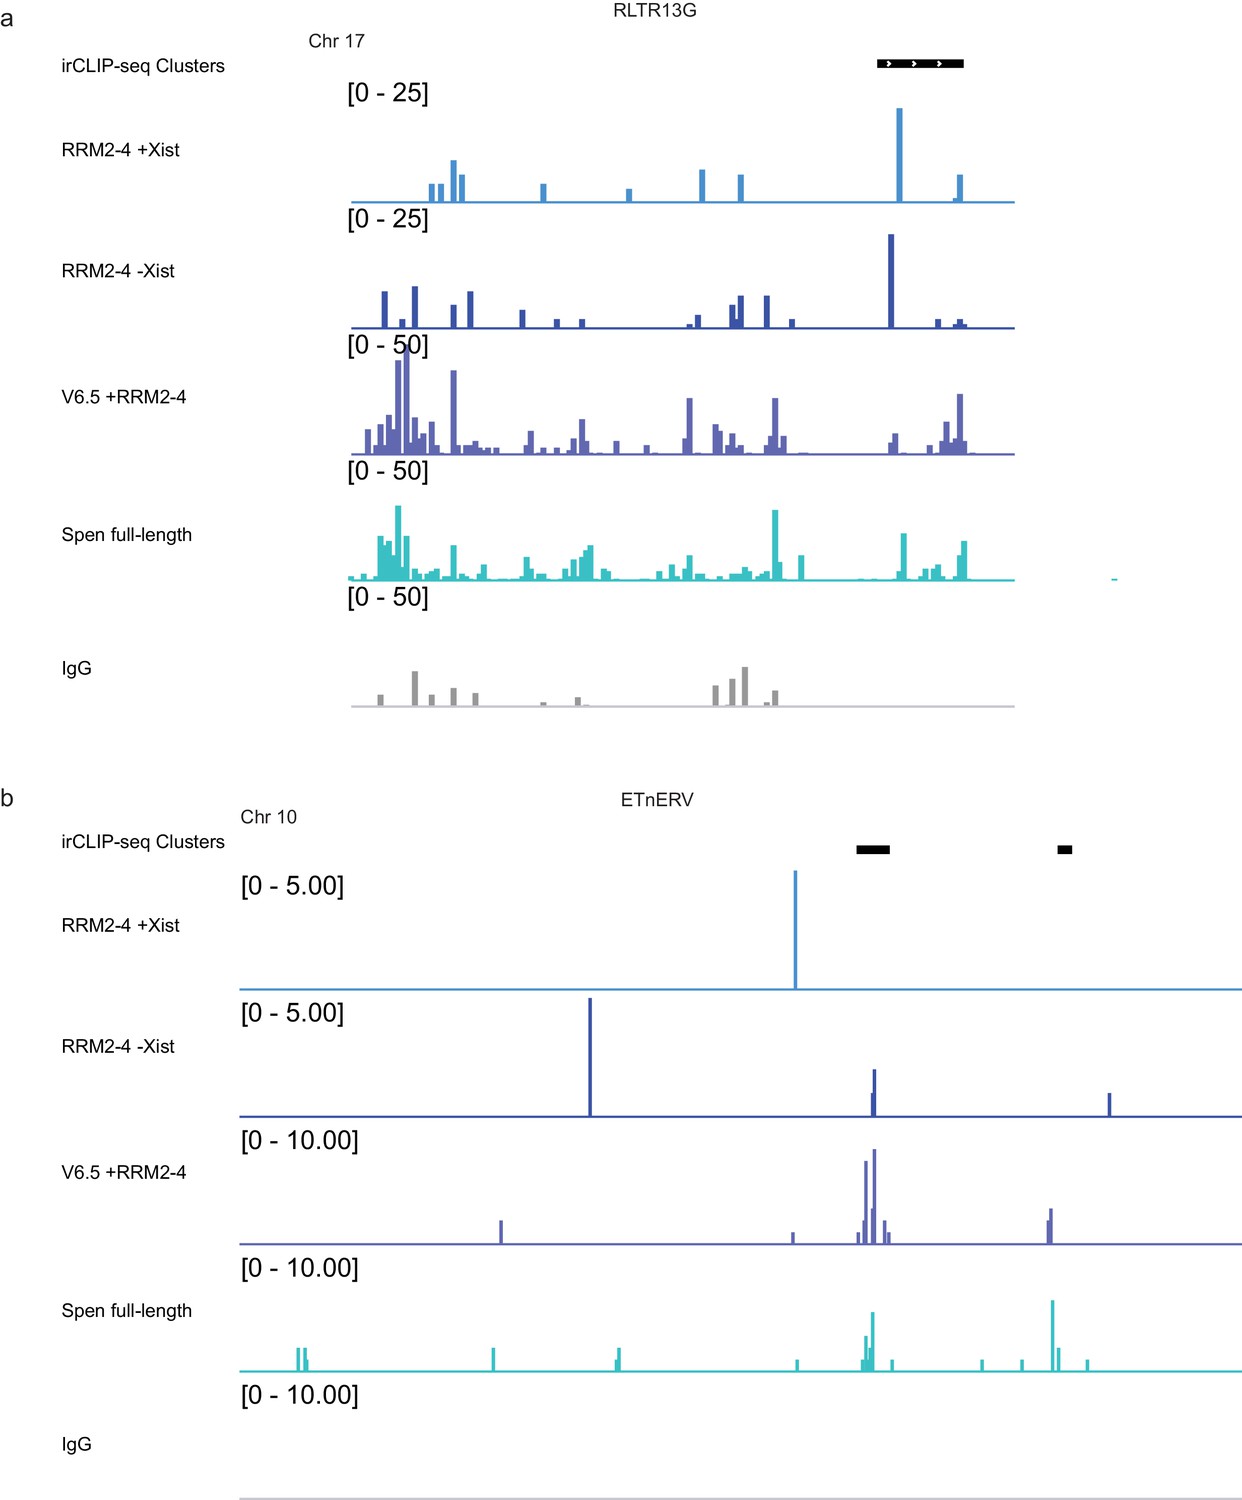
Comparison of RRM2-4 and Spen full-length binding to ERVs.
(a) Tracks showing irCLIP-seq signal for RRM2-4 and Spen full-length at an RLTR13G element on chromosome 17. irCLIP-seq clusters are indicated in black at the top. (b) Same as in a for an ETnERV element on chromosome 10.
Figure 3—figure supplement 3
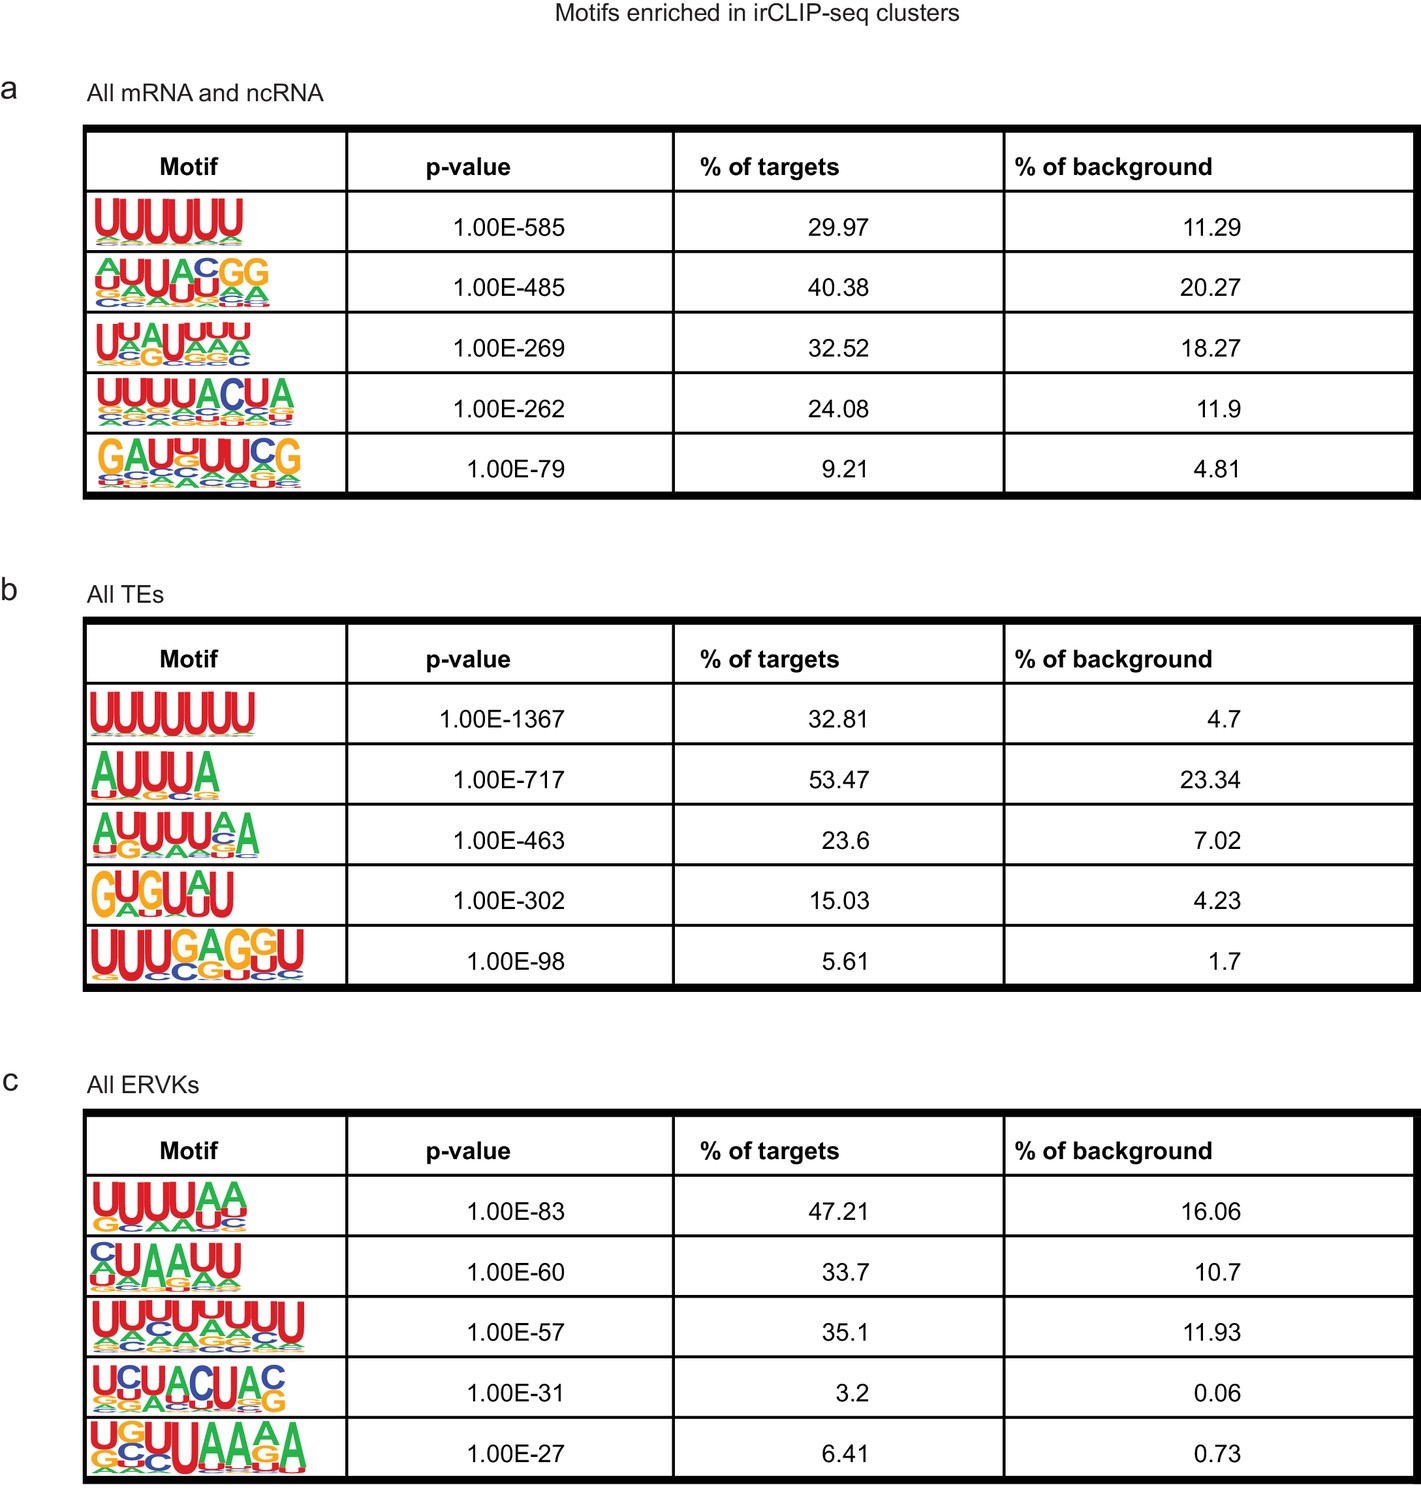
Motif analysis for RRM2-4 RNA binding sites.
(a) Motifs identified in irCLIP-seq clusters (extened to 50 bp total length) by HOMER for mRNAs and lncRNAs. Presented is the motif, the p-value, the percentage of peaks containing the motif, and the percentage of background sites containing the motif. (b) Same as in a for irCLIP-seq clusters in TEs. (c) Same as in a for irCLIP-seq clusters in ERVKs.
Figure 4 with 2 supplements
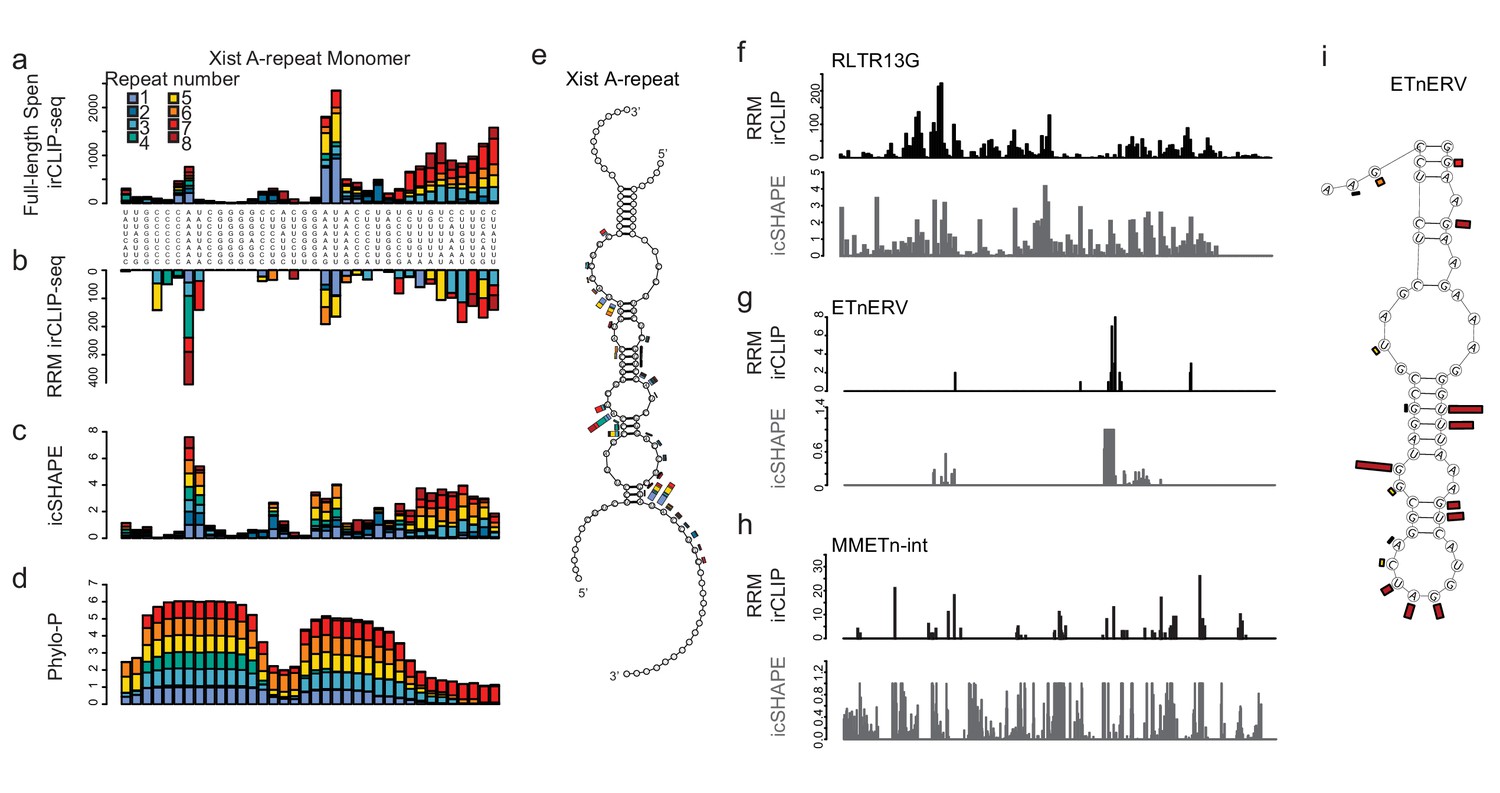
Spen RRMs recognize a common structural feature in A-Repeat and ERV RNA.
(a) irCLIP-seq signal from full-length Spen (Kahles et al., 2016) across the 8 Xist A-repeats. Signal for each repeat is stacked across the conserved repeat region. (b) Same as in a for RRM2-4 irCLIP-seq. (c) icSHAPE reactivity scores for each of the Xist A-repeats performed in vitro. Signal for each repeat is stacked across the conserved repeat region. (d) Phylo-P scores across the A-repeats, showing conservation of repeat sequence at the RRM2-4 binding sites. (e) Structural model for Xist A-repeats 4 and 5 which form a hairpin structure. Structural prediction is supported by icSHAPE data. At each nucleotide, the RRM2-4 irCLIP-seq signal strength is plotted as a bar for each repeat (in color). (f) irCLIP-seq signal (top, black) and icSHAPE reactivity scores (bottom, gray) for the consensus sequence of RLTR13G elements. Included are elements for which we have both confident RRM2-4 binding and icSHAPE data. (g) Same as in f for ETnERV. (h) Same as in f for MMETn-int. (i) Structural model for ETnERV. Structural prediction is supported by icSHAPE data. At each nucleotide, the RRM2-4 irCLIP-seq signal strength is plotted as a bar.
Figure 4—figure supplement 1
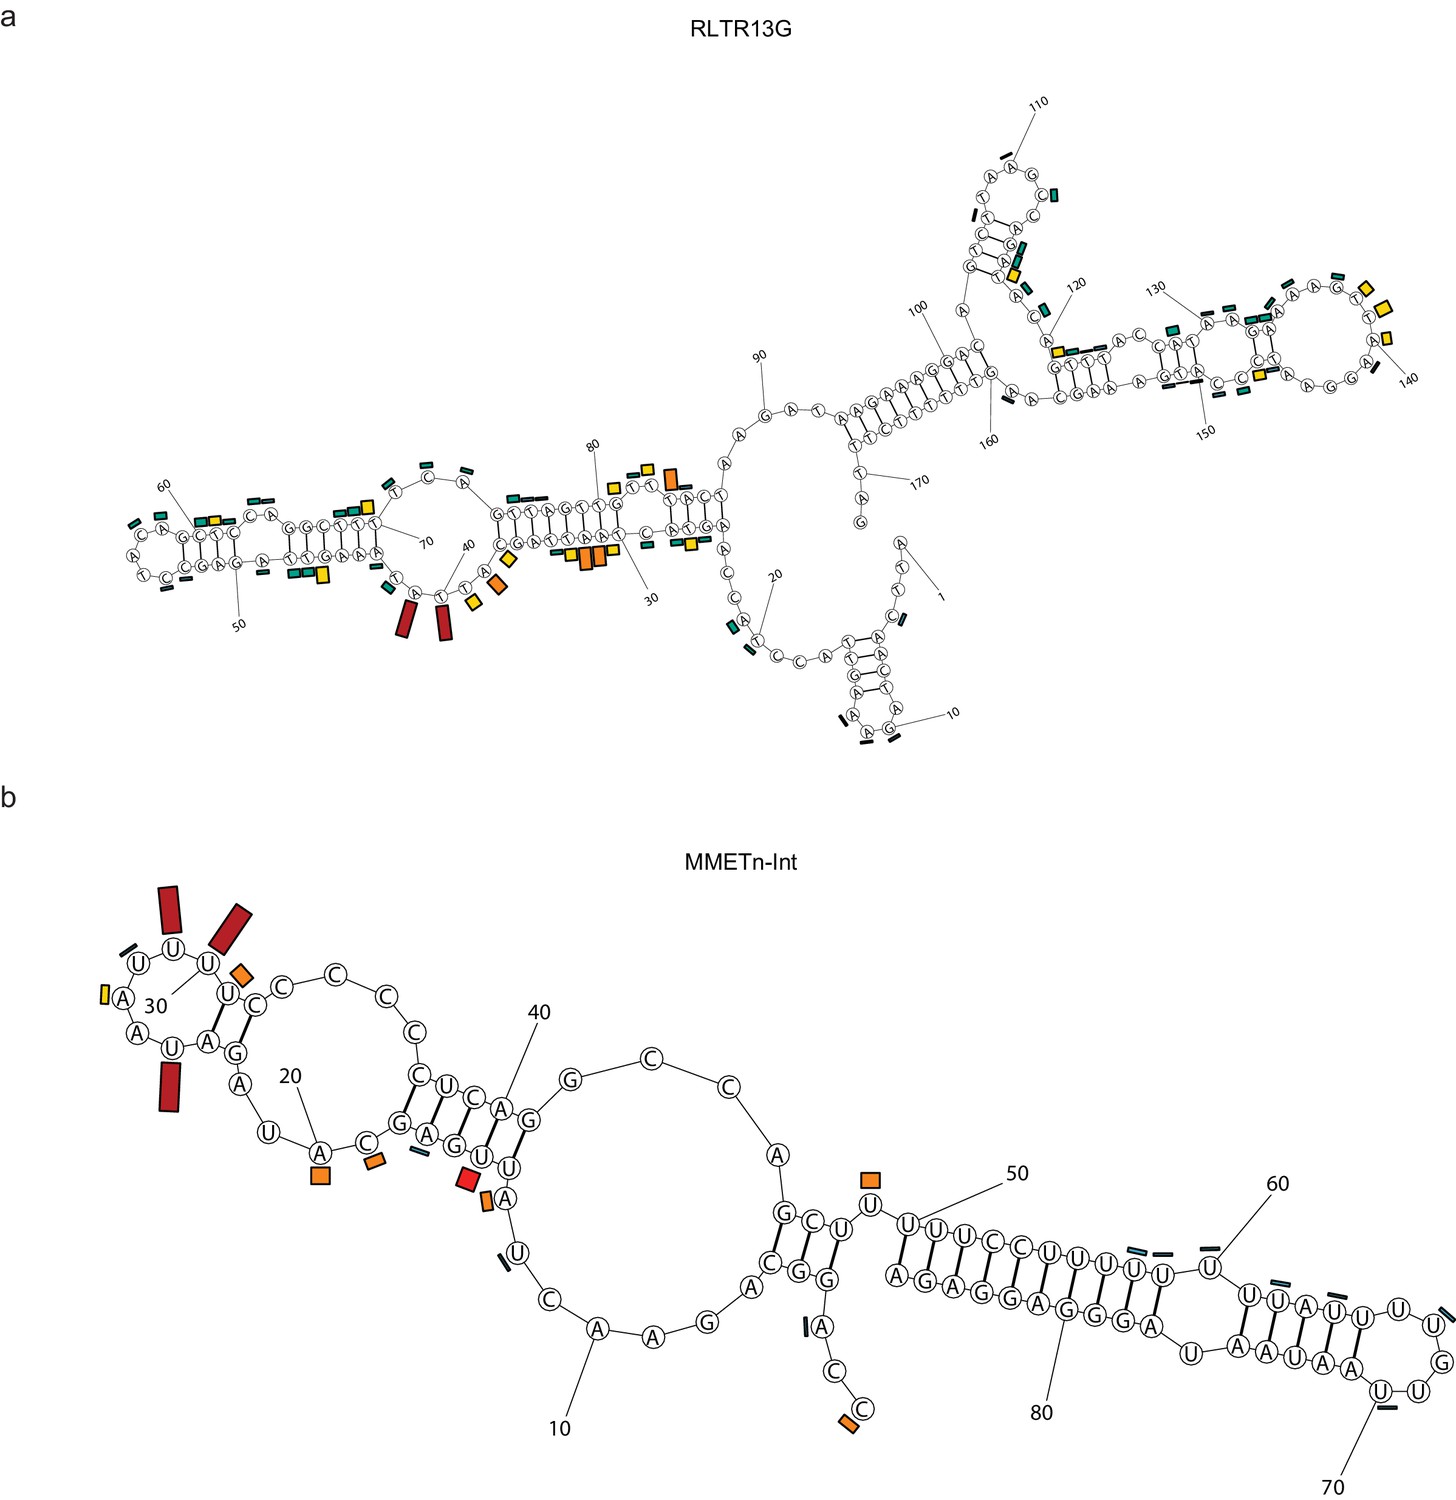
Structural models for Spen-bound ERV RNAs.
Figure 4—figure supplement 2
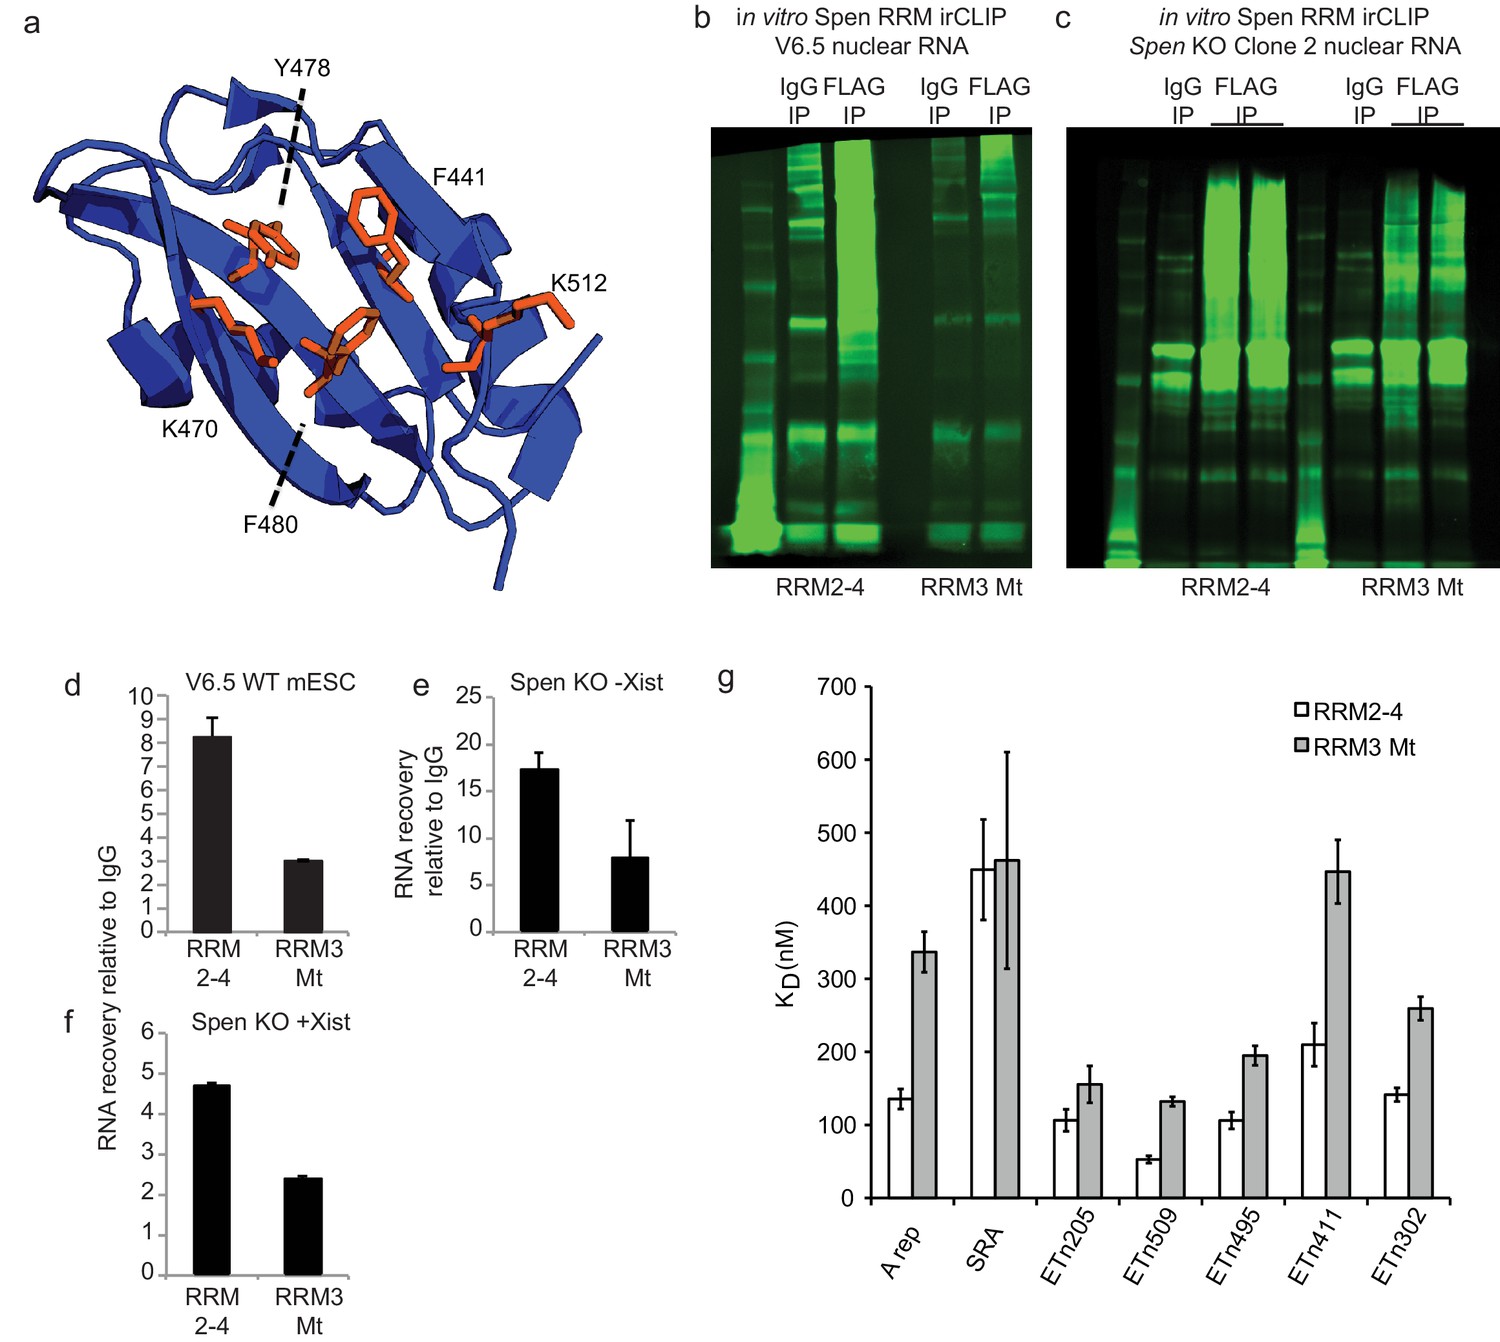
Characterization of RRM3 Mt protein.
(a) PyMol structure of the RRM3 domain of Spen with the five mutated residues indicated. These five residues were identified by Arieti et al. as residues important for RNA binding (Sundaram et al., 2014). Figure adapted from PDB: 4P6Q. (b) Representative infrared gel image showing ir-labeled RNA after pulldown of RNA-protein crosslinked protein with anti-IgG or anti-FLAG antibodies from V6.5 WT mESCs. FLAG antibody recognizes the Spen RRM2-4-FLAG or Spen RRM3Mt-FLAG protein. The ladder (lefthand lane for each sample) ranges from 12 to 225 kDa. (c) Same as in b for RNA from Spen KO cell lines. (d) Quantification of the gel in b and an additional replicate. Plotted is the signal intensity in the FLAG lane compared to the IgG lane. Error bars represent the standard deviation from two independent biological experiments. (e) Same as in d for the gel in c (left). (f) Same as in d for the gel in c (right). (g) KD values from fluorescence anisotropy experiments for RRM2-4 and RRM3 Mt binding to SRA RNA, Xist A-Repeat RNA, and ERV RNAs (ETn 205, 509, 495, 411, 302). Error bars represent standard error.
Figure 5
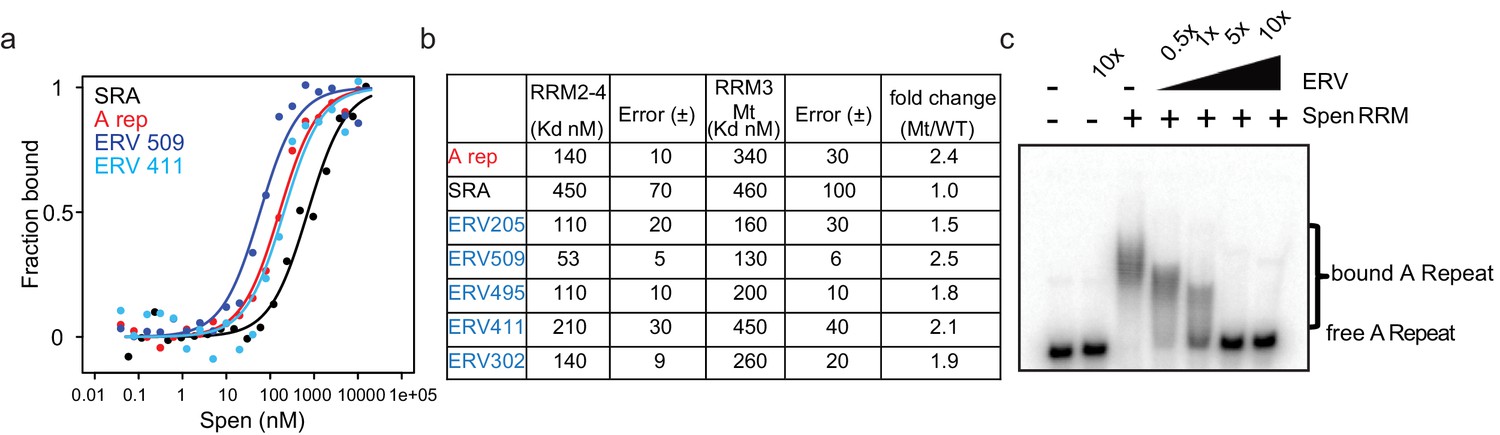
ERVs bind Spen RRMs in vitro and compete with the A-Repeat.
(a) Representative binding curves for Spen RRM2-4 from fluorescence anisotropy experiments. Fluoresence anisotropy values are normalized with saturation and offset parameters from the fit to yield fraction bound. Shown are binding curves for SRA, the A-Repeat region of Xist (A rep), and two ERV RNAs bound in irCLIP-seq data (ERV509, ERV411). (b) Direct binding constants (KD) between RNAs of interest and the Spen RRM2-4 and RRM3 Mt proteins from fluorescence anisotropy experiments. Error is the standard error. The fold change in binding between RRM2-4 and RRM3 Mt for each RNA is shown at the right. (c) Acrylamide gel image showing competition of ERV509 RNA with 32P-labeled A-Repeat for binding to Spen RRM2-4. Increasing amounts of unlabeled ERV509 competitor RNA (0.5x, 1x, 5x, and 10x the amount of labeled A-Repeat) was added while the protein and A-Repeat concentrations were kept constant. The higher band depicts Spen-bound A-Repeat, while the lower band shows the unbound A-repeat RNA.
Figure 6 with 3 supplements
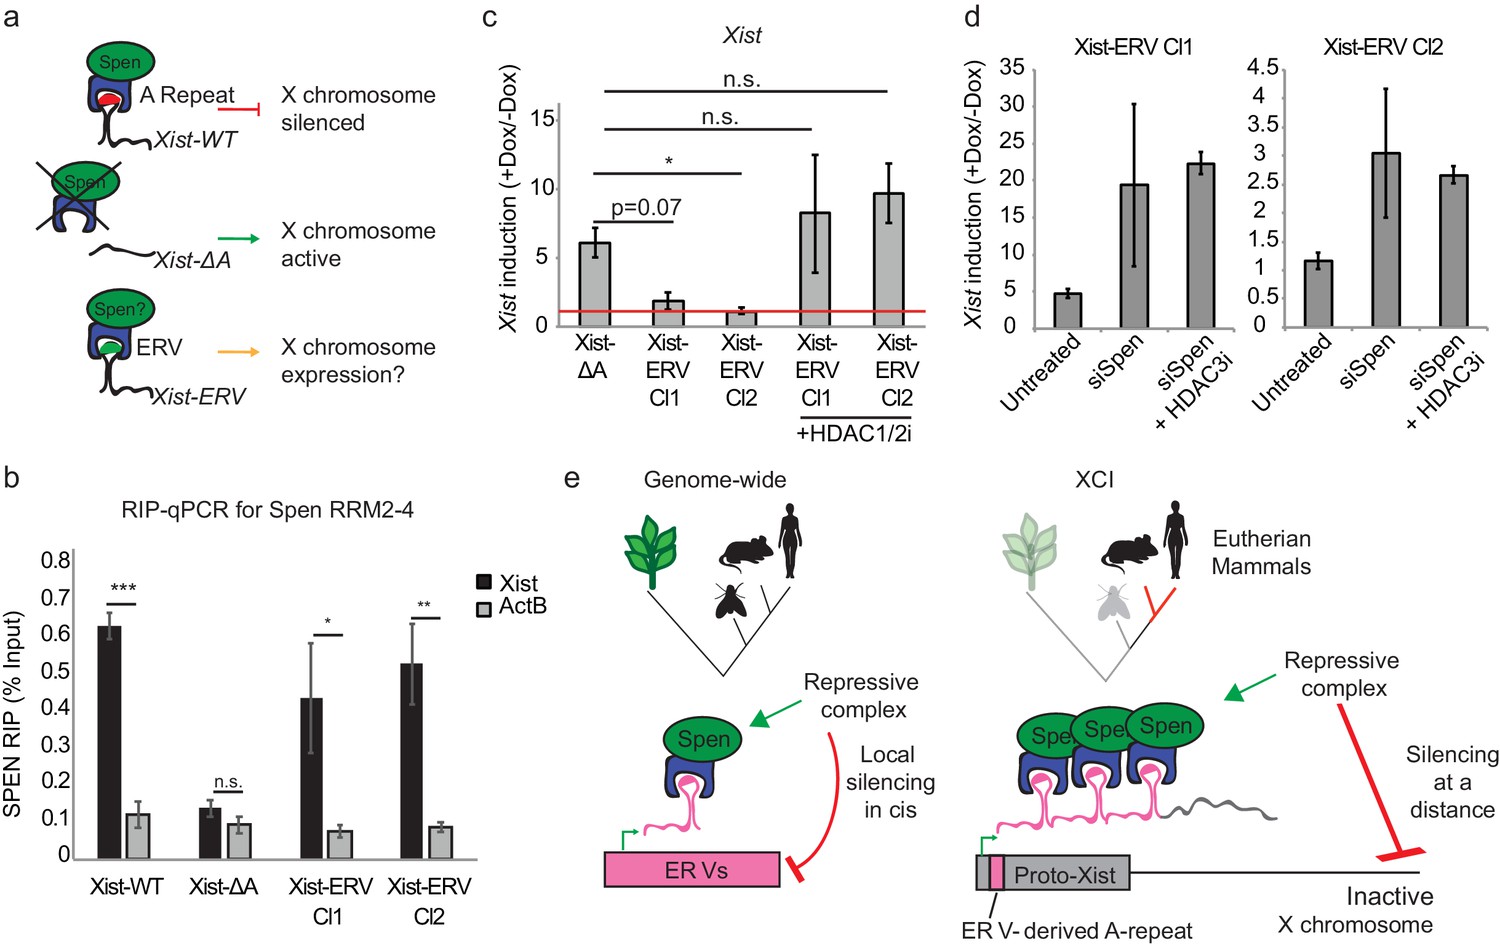
Insertion of an ERV element in place of A-repeat restores Spen binding and local Xist silencing.
(a) Diagram showing the experimental rationale for replacing the A-Repeat with a 9x tandem insert of an ERV-derived Spen binding site. (b) Xist-ERV restores Spen recruitment. RIP-qPCR for Xist and ActB in Xist-WT, Xist-ΔA, and Xist-ERV clones 1 and 2 mESCs. qRT-PCR values are normalized to input samples. Error bars represent standard error for four independent biological replicates. p values are derived from two-tailed t-test. (c) Xist-ERV causes epigenetic silencing of the Xist locus. Xist expression level in +Dox compared to –Dox conditions for Xist-ΔA mESCs and Xist-ERV mESCs with and without HDAC1/2 inhibitor treatment. Xist levels are first normalized to ActB and then to –Dox levels. The red line is drawn at y = 0, representing no increase in expression of Xist with the addition of doxycycline. For each condition, four independent experiments were conducted. p values are derived from two-tailed T test. (d) Xist-ERV silencing requires Spen and HDAC3. Xist expression level in +Dox compared to –Dox conditions for Xist-ΔA mESCs and Xist-ERV mESCs with and without siRNA-mediated knockdown of Spen or siRNA-mediated knockdown of Spen + HDAC3 inhibition. For each condition, four independent experiments were conducted. (e) Model for how Spen evolved to bind Xist through its ERV binding mechanism in eutherian mammals.
Figure 6—figure supplement 1
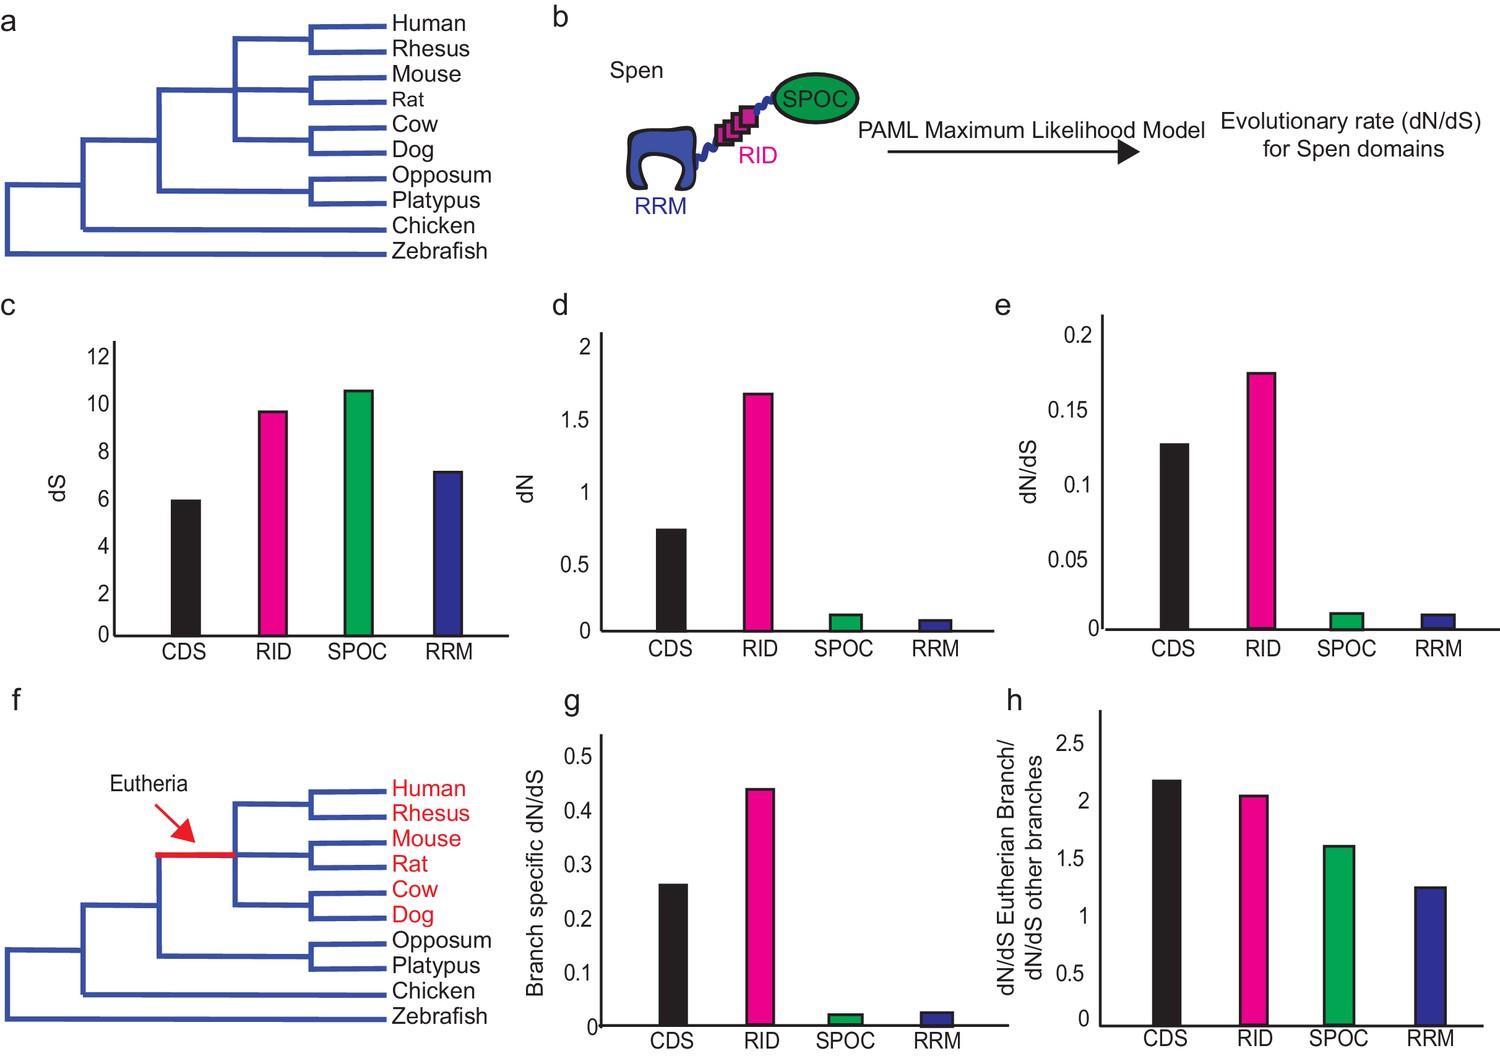
Spen’s RRM domains have not evolved specifically in the Eutherian lineage.
(a) Diagram of the phylogenetic relationship (not to scale) of eutherian mammals, non-eutherian mammals, chicken, and zebrafish. (b) Diagram showing how the evolutionary rate (dN/dS), which shows the ratio of non-synonymous to synonymous changes in the protein, is calculated using a PAML maximum likelihood model for each of the Spen protein domains including the RNA binding domains (RRM), Receptor interaction domain (RID), and protein-interaction domain (SPOC). For each set, the entire coding sequence (CDS) is also included. (c) dS for the four illustrated Spen domains during evolution from zebrafish to human. (d) dN for the four illustrated Spen domains during evolution from zebrafish to human. (e) dN/dS for the four illustrated Spen domains during evolution from zebrafish to human. (f) Diagram showing the eutherian branch which is used to calculate whether there is branch-specific evolution in the Spen protein in eutherian mammals. (g) Branch specific dN/dS for the eutherian branch for the four illustrated domains of Spen. (h) Ratio of the evolutionary rate in the eutherian branch to the evolutionary rate of the other branches. The RRM does not evolve more quickly in this line.
Figure 6—figure supplement 2
Insertion of an ERV element in the A-Repeat locus.
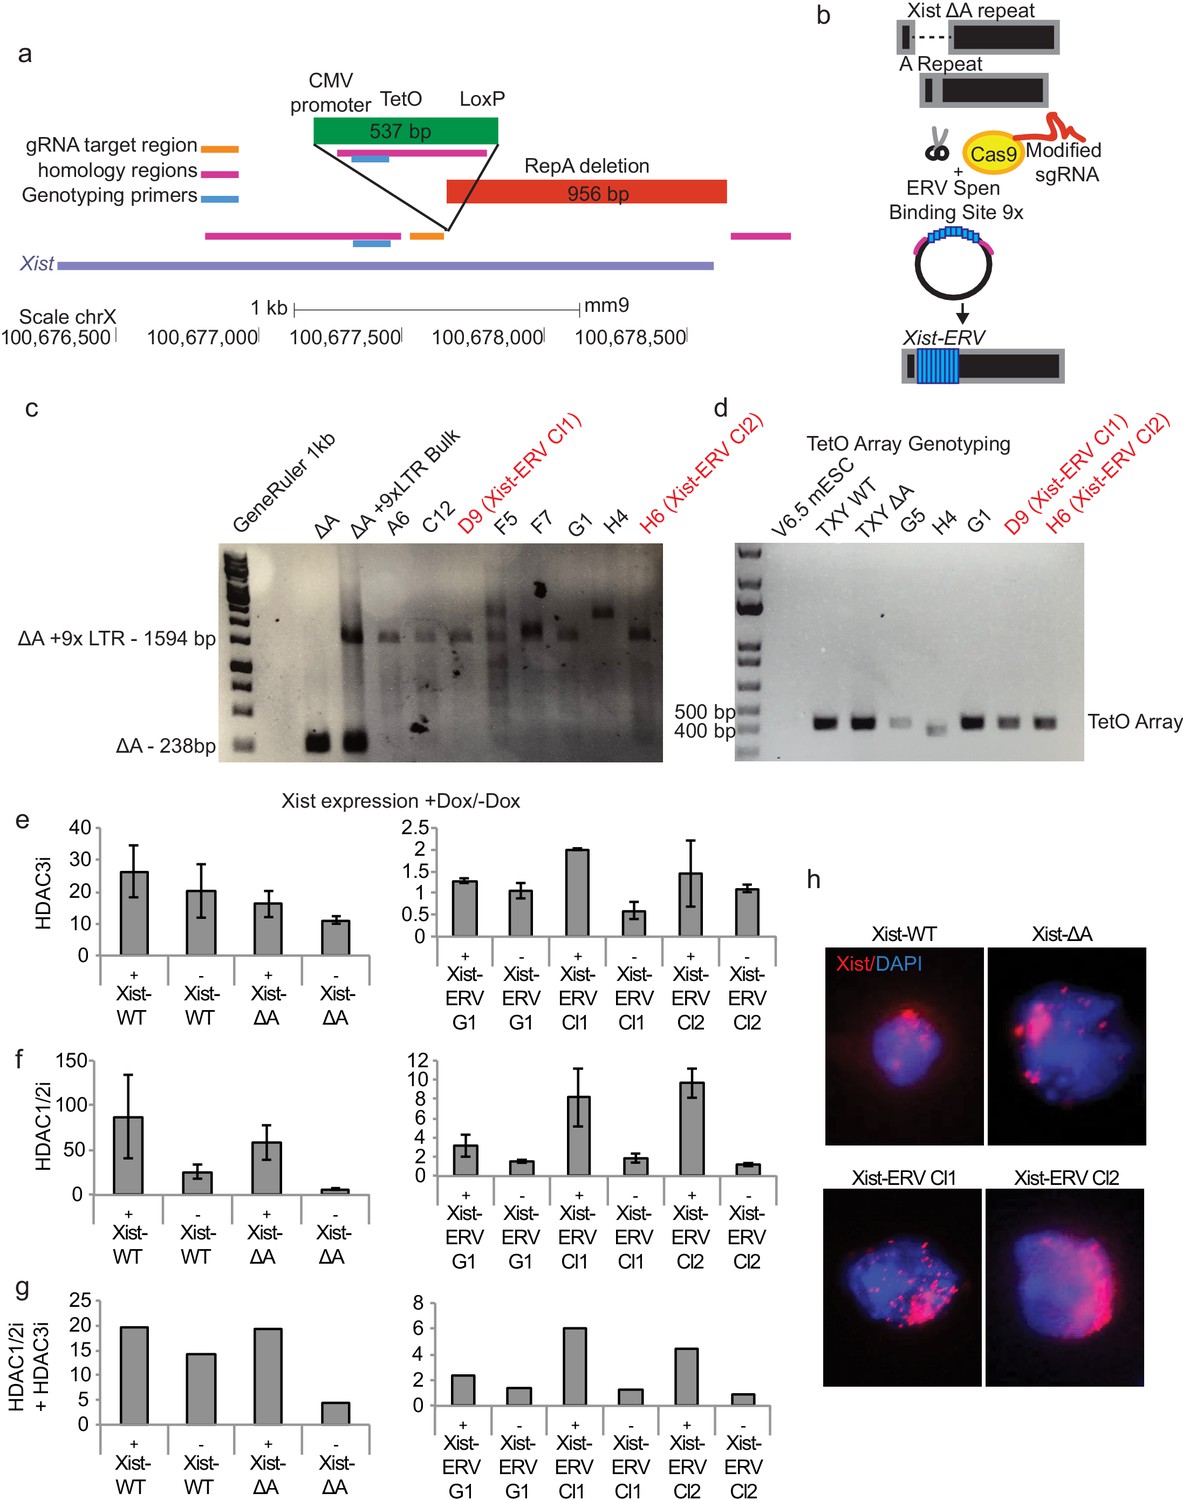
(a) Diagram of the Xist 5’ end showing the location of the A-Repeat deletion (Wutz et al., 2002), the CMV promoter and TetO array, and the gRNA target region, homology regions, and genotyping primers for CRISPR-Cas9-directed HDR experiments. (b) Diagram of the HDR strategy for inserting a 9x ERV repeat into the A-Repeat locus. Briefly, we used Cas9 to cut at the site where the A-Repeat has been deleted. We then added a donor plasmid containing two homology arms to this site flanking a 9x ERV Spen binding site (154 bp per repeat). (c) Genotyping showing the insertion of the 9x ERV repeat into the Xist locus. Clones shown in red (D9 Xist-ERV Cl1 and H6 Xist-ERV Cl2) are used for further analysis. (d) Genotyping results for PCR of the TetO array in 9x ERV knock-in cell lines. The band is at the size of the TetO array knocked into the Xist-WT and Xist-ΔA cell lines. All clones used in this study show a preserved TetO array, indicating that there has not been recombination at this locus. One clone showed a band at a lower height (H4), indicating recombination, but was not used for further analysis. Primers span from the CMV promoter across the TetO array. (e) qPCR data showing Xist expression in +Dox relative to –Dox conditions for Xist-WT, Xist-ΔA and Xist-ERV cell lines treated with or without HDAC3i for 24 hr before doxycycline addition. Data is normalized to ActB and then to –Dox. Error bars represent the standard deviation across four independent replicates. + and – below the graph refer to whether the cells were treated with HDAC inhibitor. DMSO was used as a control for –HDACi conditions. (f) Same as in e for HDAC1/2 inhibitor. (g) Same as in e for combined HDAC1/2i and HDAC3i. two replicates were analyzed in this experiment. (h) FISH for Xist RNA in Xist-WT, Xist-ΔA, and Xist-ERV cell lines. Representative nuclei from each cell line are shown. Xist FISH signal is in red and DAPI in blue.
Figure 6—figure supplement 3
Characterization of Xist-ERV function.
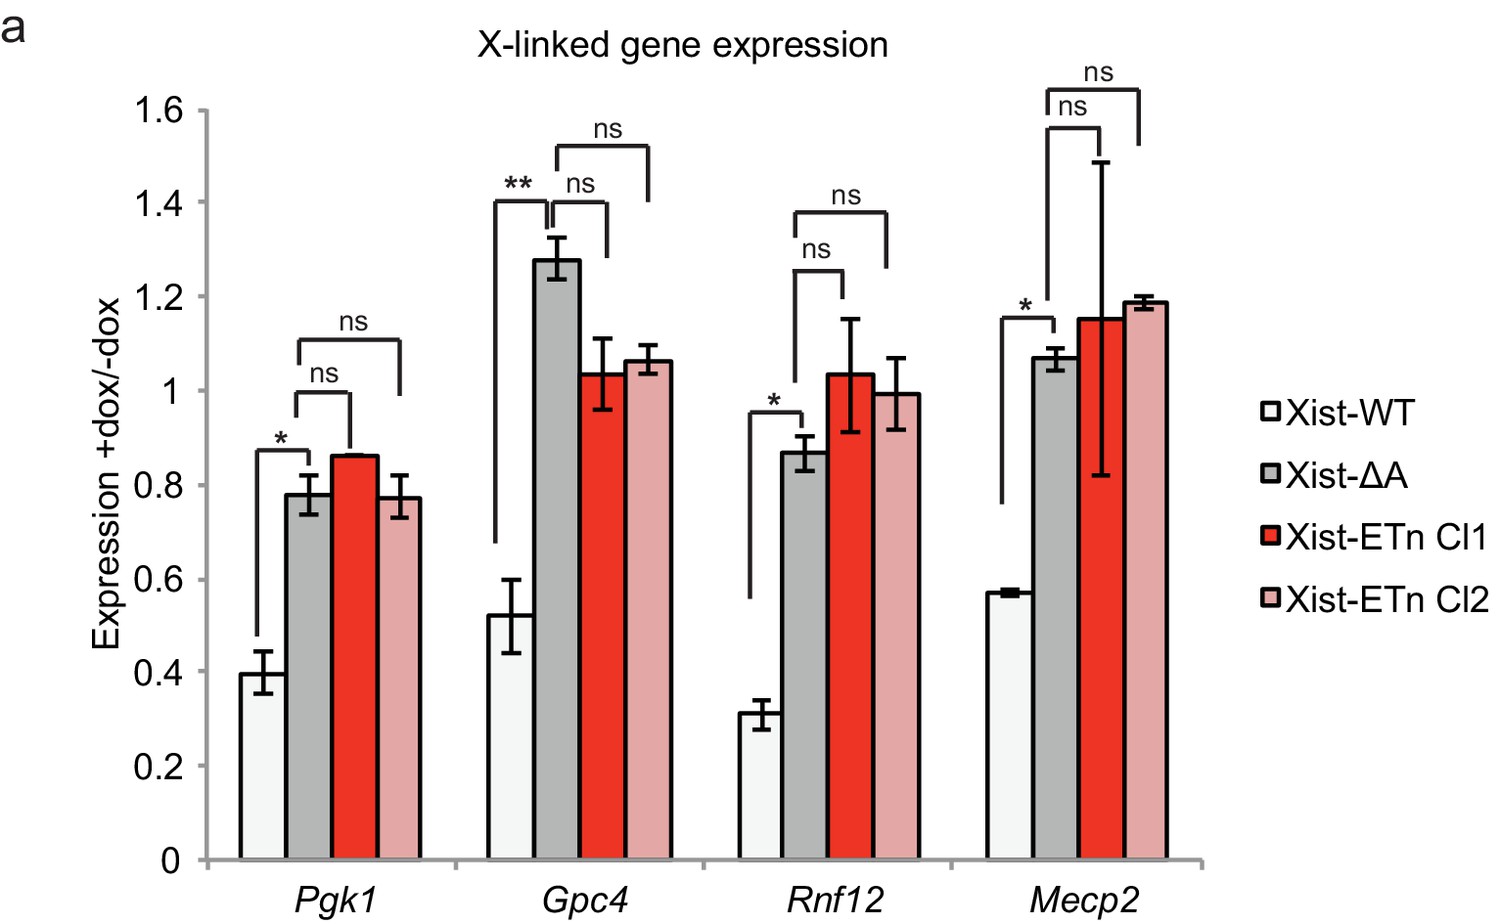
(a) qPCR data showing the silencing of X-linked genes upon Xist expression in Xist-WT, Xist-ΔA and Xist-ERV cell lines. All experiments were performed in the presence of HDAC1/2 inhibitor. Expression is normalized first to ActB and then to Xist level in –dox samples. Error bars show the standard error for three replicates.
Author response image 1
Relationship between expression and Spen RRM binding for ERV RNAs.
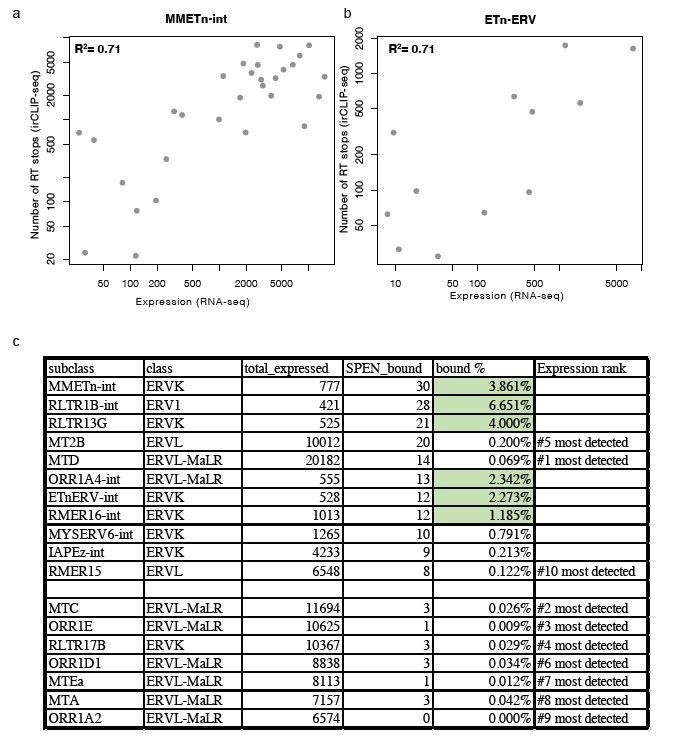
(a) Scatter plot showing the number of RT stops from irCLIP-seq vs. the expression from RNA-seq for all expressed MMETn-int elements. (b) Same as in a for all ETnERV elements. (c) Table displaying the ERV elements that are expressed in WT or Spen KO mESCs. Columns display the number of expressed elements, the number bound by Spen, the percentage bound by Spen, and the expression rank amongst all ERV families.
Author response image 2
Spen RRM RIP-qPCR results with and without outlier correction (related to Figure 6b).
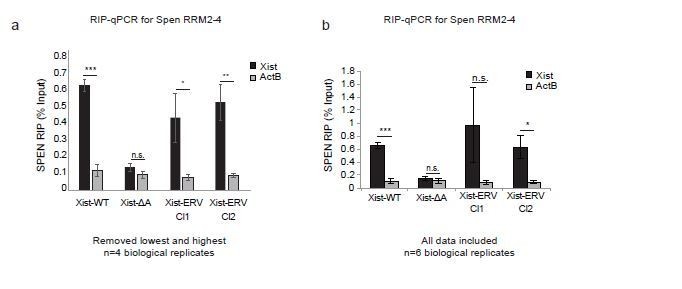
(a) RIP-qPCR for Xist and ActB in Xist-WT, Xist-ΔA, and Xist-ERV clones 1 and 2 mESCs. qRT-PCR values are normalized to input samples. Error bars represent standard error for 4 independent biological replicates. The highest and lowest values for each sample were removed due to noise. P-values are derived from two-tailed t-test. (b) RIP-qPCR for Xist and ActB in Xist-WT, Xist-ΔA, and Xist-ERV clones 1 and 2 mESCs. qRT-PCR values are normalized to input samples. Error bars represent standard error for 6 independent biological replicates. No values were excluded from the analysis. P-values are derived from two-tailed t-test.
Tables
Key resources table
| Reagent type (species) or resource | Designation | Source or reference | Identifiers | Additional information |
|---|---|---|---|---|
| Gene (mouse) | Spen | RefSeq | NM_019763.2 | |
| Cell line (mouse) | TXY WT and TXY deltaA | Dr. Edith Heard | Xist-WT and Xist-deltaA | Cell lines have a doxycycline inducible Xist gene + / - the A repeat region |
| Cell line (mouse) | HATX WT and HATX Spen KO | Dr. Anton Wutz | WT, Spen KO | KO cells have a deletion of the majority of the Spen gene. They also have a doxycycline inducible Xist transgene on the X chromosome |
| Antibody | Goat polyclonal Anti-Oct4 | Santa Cruz | Sc-8629 | 7.5 ug/ChIP |
| Antibody | Rabbit polyclonal Anti-H3K27Ac | Active Motif | 39133 | 5 ug/ChIP |
| Antibody | Rabbit polyclonal Anti-SHARP(Spen) | Bethyl | A301-119A | Antibody to endogenous Spen |
| Antibody | Mouse monoclonal Anti-FLAG M2 | Sigma | F3165 | Antibody against FLAG tag on Spen RRM2-4 |
| Antibody | Rabbit polyclonal Anti-H3K9me3 | abcam | AB8898 | 5 ug/ChIP |
| Antibody | Rabbit polyclonal Anti-H3K4me3 | Active Motif | 39159 | 5 ug/ChIP |
| Sequence-baed reagent | mXist 570 RNA FISH probe set | Stellaris | SMF-3011–1 | 125 nM concentration |
| Commercial assay or kit | Nextera DNA prep kit | Illumina | FC-131–1002 | Used for ATAC-seq and for ChIP-seq library preparation. |
| Chemical compound, drug | HDAC1/2 inhibitor, BRD6688 | Cayman Chemical | 1404562-17-9 | Inhibitor of HDAC1 and 2. Used at 10 uM. |
| Chemical compound, drug | HDAC3 inhibitor, RGFP966 | Sigma | SML1652 | Inhibitor of HDAC3. Used at 10 uM. |
| Sequence-based reagent | Xist Primers | Dr. Edith Heard | 5’GCTGGTTCGTCTATCTTGTGGG3’ 5’CAGAGTAGCGAGGACTTGAAGAG3’ |
Additional files
-
Supplementary file 1
irCLIP-seq clusters identified on mRNA, lncRNA, and TEs.
- https://cdn.elifesciences.org/articles/54508/elife-54508-supp1-v2.xlsx
-
Transparent reporting form
- https://cdn.elifesciences.org/articles/54508/elife-54508-transrepform-v2.pdf
Download links
A two-part list of links to download the article, or parts of the article, in various formats.
Downloads (link to download the article as PDF)
Open citations (links to open the citations from this article in various online reference manager services)
Cite this article (links to download the citations from this article in formats compatible with various reference manager tools)
Spen links RNA-mediated endogenous retrovirus silencing and X chromosome inactivation
eLife 9:e54508.
https://doi.org/10.7554/eLife.54508


