Increase of circulating IGFBP-4 following genotoxic stress and its implication for senescence
- Department of Experimental Medicine, Biotechnology and Molecular Biology Section, University of Campania “Luigi Vanvitelli,”, Italy
- ASL Napoli 1 Centro P.S.I. Napoli Est - Barra, Italy
- Department of Medical, Surgical, Neurological, Metabolic Sciences, and Aging, 2nd Division of Neurology, Center for Rare Diseases and InterUniversity Center for Research in Neurosciences, University of Campania 'Luigi Vanvitelli', Italy
- Research Institute of Terrestrial Ecosystems (IRET), CNR, Italy
- Sbarro Institute for Cancer Research and Molecular Medicine, Center for Biotechnology, Temple University, United States
Figures
Figure 1 with 1 supplement
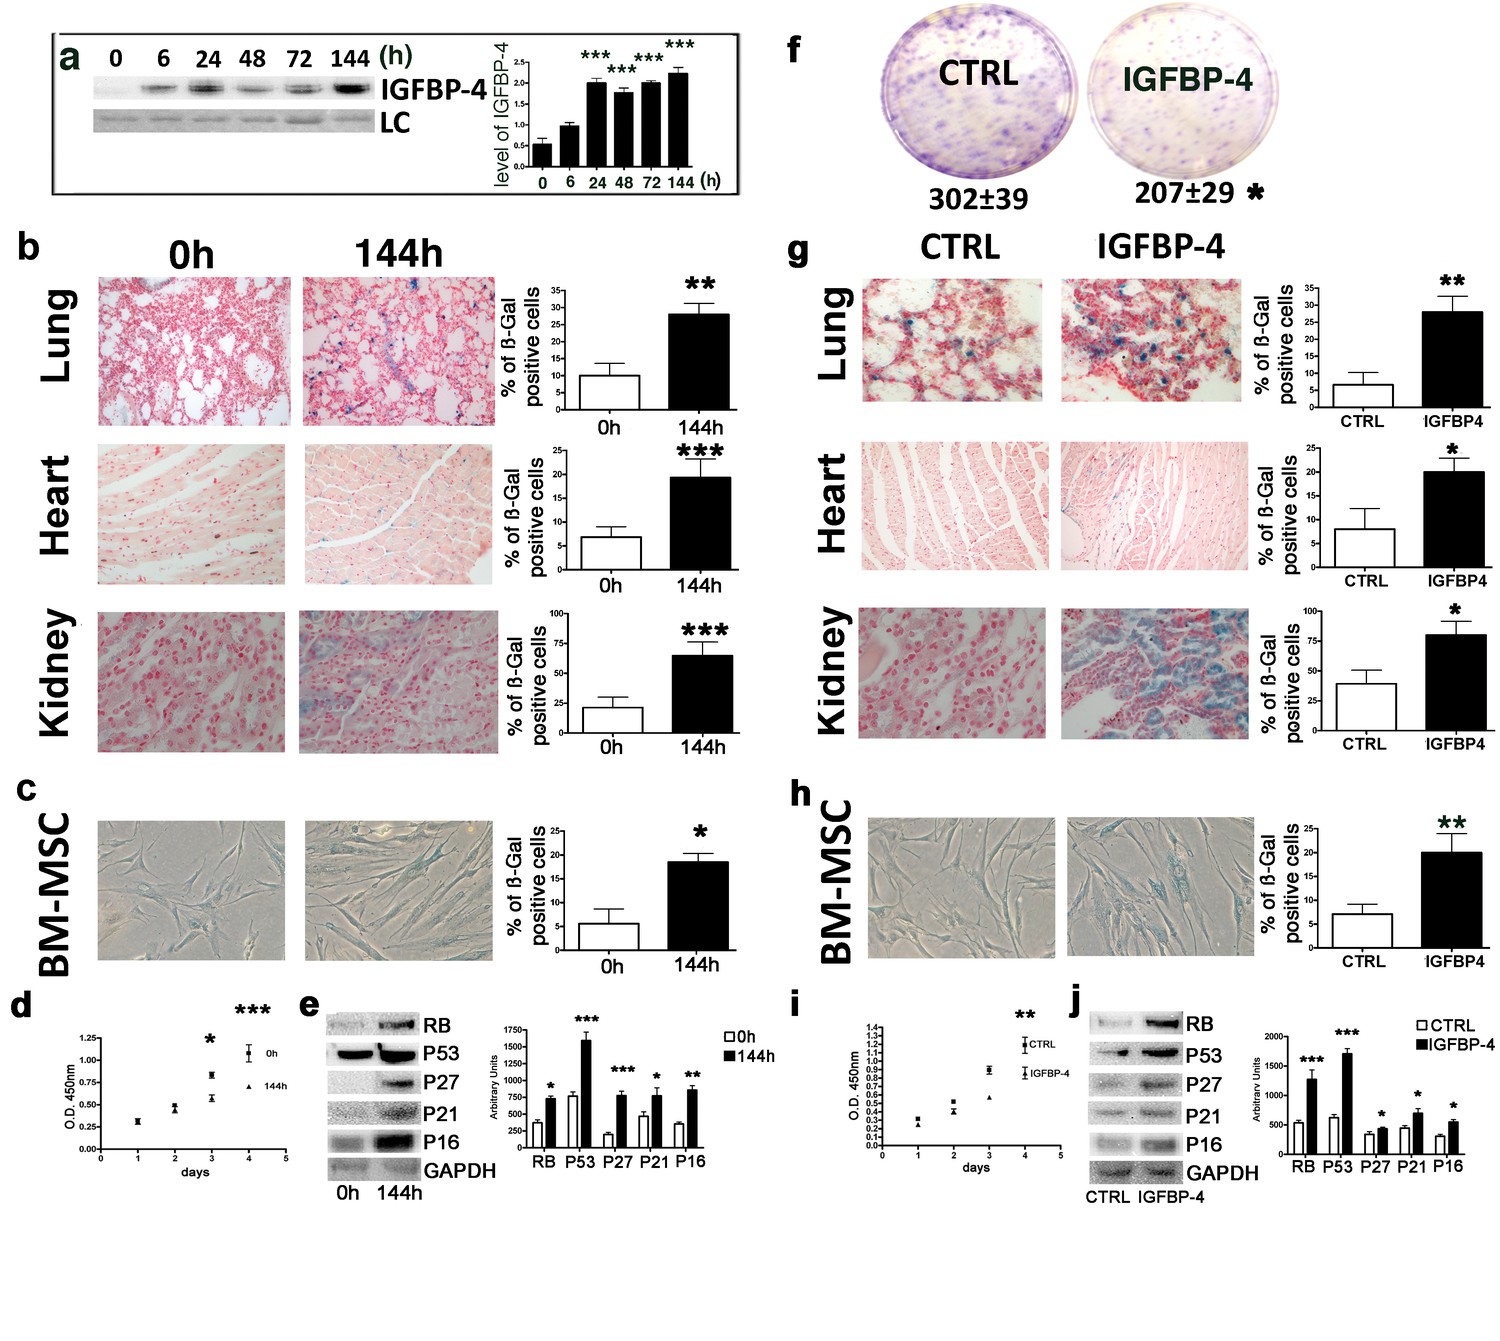
Genotoxic stress and IGFBP-4.
Panel a - Western blot analysis of IGFBP-4 in the sera of mice treated with 100 mGy X ray. The sera were collected at different time points following irradiation. Membrane staining with Ponceau S acid red was used as a loading control (LC). The graph shows a representative densitometric analysis of the IGFBP-4. We compared the untreated mice (0 hr) with all of the other experimental conditions, and the statistical differences are indicated with ***p<0.01. The data are expressed in arbitrary units. For each time point, we used three irradiated mice and three controls. Panel b - In situ acid beta galactosidase analysis on the histological sections obtained from mice 144 hr after X ray irradiation. The picture shows representative sections of the lungs, hearts and kidneys. The senescent cells are shown in blue. We used three irradiated mice and three controls. The graphs represent the percentage of beta-galactosidase-positive cells determined on at least five histological sections. The statistical differences are indicated with the ** (p<0.01) and *** (p<0.001) symbols. For experimental group we used three mice. Panel c -The picture shows a representative image of the acid-beta galactosidase assay on the bone marrow MSCs (passage 1) obtained from the control and irradiated animals (144 hr post treatment). We used three irradiated mice and three controls. The statistical difference is indicated with the * (p<0.05) symbol. Panel d – Cell proliferation of bone marrow MSCs (passage 1) was determined by Cell Counting Kit-8 (CCK-8) colorimetric assay. The graph shows data coming from control and irradiated animals. The symbols * and *** denote p<0.05 and p<0.001, respectively. Panel e – Western blot analysis of senescence-related proteins in bone marrow MSCs (passage 1) obtained from irradiated and control animals. GAPDH expression was used as the loading control. The graph shows the densitometric analysis and the statistical differences are indicated with *p<0.05 or **p<0.01 or ***p<0.001. The data are expressed in arbitrary units. Panel f – The CFU assay performed on the bone marrow MSCs (passage 1) obtained from the control and the IGFBP-4-treated animals. The number of CFU clones per 1000 plated cells is reported. The statistical difference (p<0.05) is indicated with the * symbol. For experimental group we used three mice. Panel g – In situ acid beta galactosidase analysis on the histological sections obtained from mice after two months of treatment with IGFBP-4 (intraperitoneally injected twice per week). The picture shows representative sections of the lungs, heart, and kidneys in the control and the IGFBP-4 treated animals. The senescent cells are shown in blue. The graphs represent the percentage of beta-galactosidase-positive cells determined on at least five histological sections. The statistical differences are indicated with the * (p<0.05) and ** (p<0.01) symbols. For experimental group we used three mice. Panel h -The picture shows a representative image of the acid-beta galactosidase assay on the bone marrow MSCs (passage 1) obtained from the control and IGFBP-4 treated animals. For experimental group we used three mice. Panel i – Cell proliferation of bone marrow MSCs (passage 1) was determined by Cell Counting Kit-8 (CCK-8) colorimetric assay. The graph shows data coming from control and IGFBP-4 treated animals. The symbols ** indicates p<0.05. Panel j – Western blot analysis of senescence-related proteins in bone marrow MSCs (passage 1) obtained from control and IGFBP-4 treated animals. GAPDH expression was used as the loading control. The graph shows the densitometric analysis and the statistical differences are indicated with *p<0.05 or ***p<0.001. The data are expressed in arbitrary units.
-
Figure 1—source data 1
Original image data (gels and micrographs) for Figure 1.
- https://cdn.elifesciences.org/articles/54523/elife-54523-fig1-data1-v3.zip
-
Figure 1—source data 2
Numerical data for Figure 1.
- https://cdn.elifesciences.org/articles/54523/elife-54523-fig1-data2-v3.xlsx
Figure 1—figure supplement 1
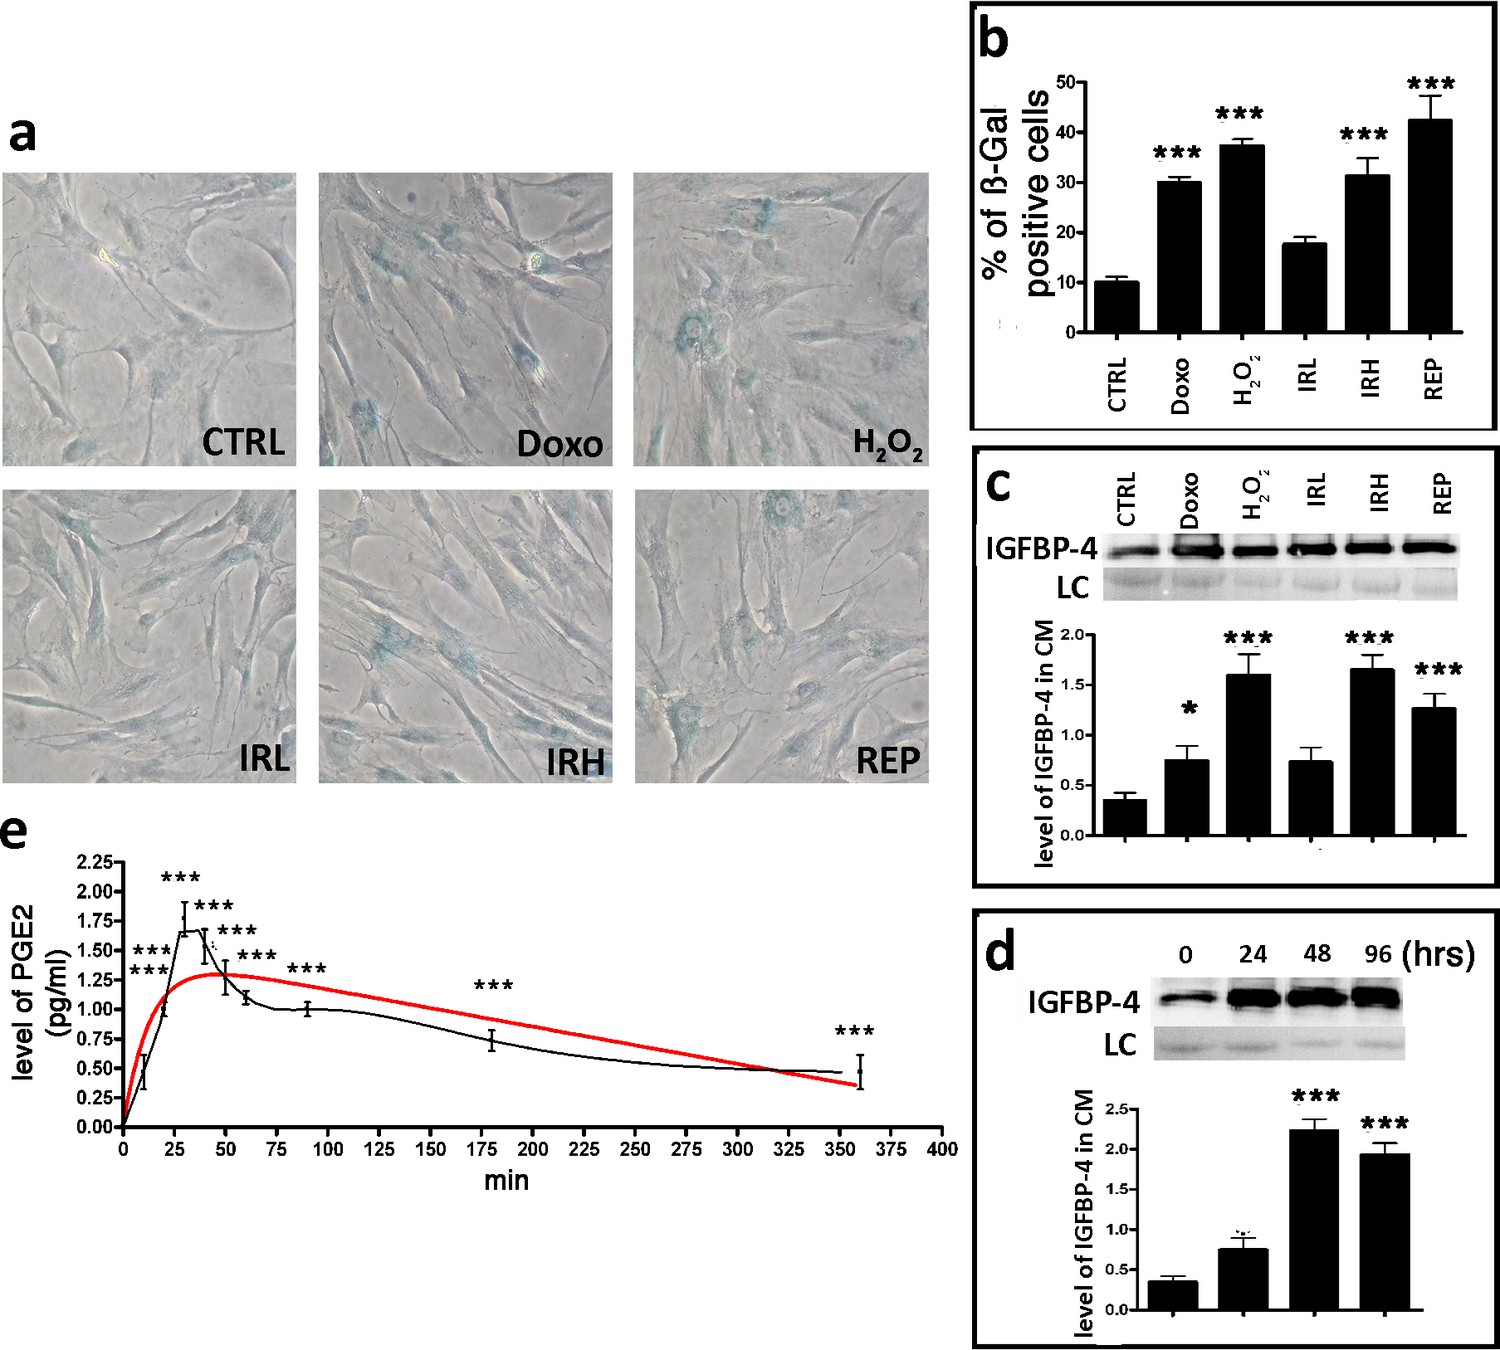
Senescence induced by exogenous stressors and IGFBP-4 release.
Panel a - Representative microscopic fields of acid beta-galactosidase (blue) in doxorubicin (Doxo), peroxide hydrogen (H2O2) low X ray (IRL) and high X ray (IRH) treated cells. REP and CTRL indicate the replicative senescence and control cultures, respectively. Panel b - The graph shows the mean percentage value of the senescent cells 48 hr following stressor treatment and after 30 days in vitro for REP. In the different experimental conditions, the changes in the senescence levels were compared with CTRL ( ± SD, n = 3, **p<0.01; ***p<0.001). Panel c – Western blot analysis of IGFBP-4 in the conditioned media of MSCs 48 hr following Doxo, H2O2 IRL and IRH treatment. For REP cultures, the conditioned medium was collected at 30 days in vitro. Membrane staining with Ponceau S acid red was used as a loading control (LC). The graph shows the densitometric analysis of the IGFBP-4 level. The data are expressed as arbitrary units. In the different experimental conditions, the changes in the IGFBP-4 levels were compared with CTRL ( ± SD, n = 3, **p<0.01, ***p<0.001). Panel d – Western blot analysis of the IGFBP-4 release in the conditioned media of MSCs 24, 48, and 72 hr (hrs following H2O2 treatment). Membrane staining with Ponceau S acid red was used as a loading control (LC). The graph shows the densitometric analysis of the IGFBP-4 level. The data are expressed as arbitrary units. Protein release at different time points was compared with time zero. ( ± SD, n = 3, **p<0.01). Panel e – ELISA analysis of PGE2 levels in the media of MSC cultures 10, 20, 30, 40, 50, 60, 90, 180, and 360 min following the H2O2 treatment. The data are expressed in pg/ml. The PGE2 release at different time points was compared with time zero ( ± SD, n = 3, ***p<0.01).
-
Figure 1—figure supplement 1—source data 1
Original image data (gels and micrographs) for Figure 1—figure supplement 1.
- https://cdn.elifesciences.org/articles/54523/elife-54523-fig1-figsupp1-data1-v3.zip
-
Figure 1—figure supplement 1—source data 2
Numerical data for Figure 1—figure supplement 1.
- https://cdn.elifesciences.org/articles/54523/elife-54523-fig1-figsupp1-data2-v3.xlsx
Figure 2

Low dose of X ray induced increase in serum level of IGFBP-4.
The picture shows the western blot analysis of IGFBP-4 in the sera of 10 patients before and 48 hr after abdominal CT scan. Membrane staining with Ponceau S acid red was used loading control (LC). The graph shows the densitometric analysis of the IGFBP-4 level. Each patient is indicated with a number. For each patient the data are expressed as arbitrary units ( ± SD, n = 3 technical replicates) and the significant difference between samples harvested before and after CT is indicated with ** (p<0.01) or *** (p<0.001).
-
Figure 2—source data 1
Original image data (gels and micrographs) for Figure 2.
- https://cdn.elifesciences.org/articles/54523/elife-54523-fig2-data1-v3.zip
-
Figure 2—source data 2
Numerical data for Figure 2.
- https://cdn.elifesciences.org/articles/54523/elife-54523-fig2-data2-v3.xlsx
Figure 3
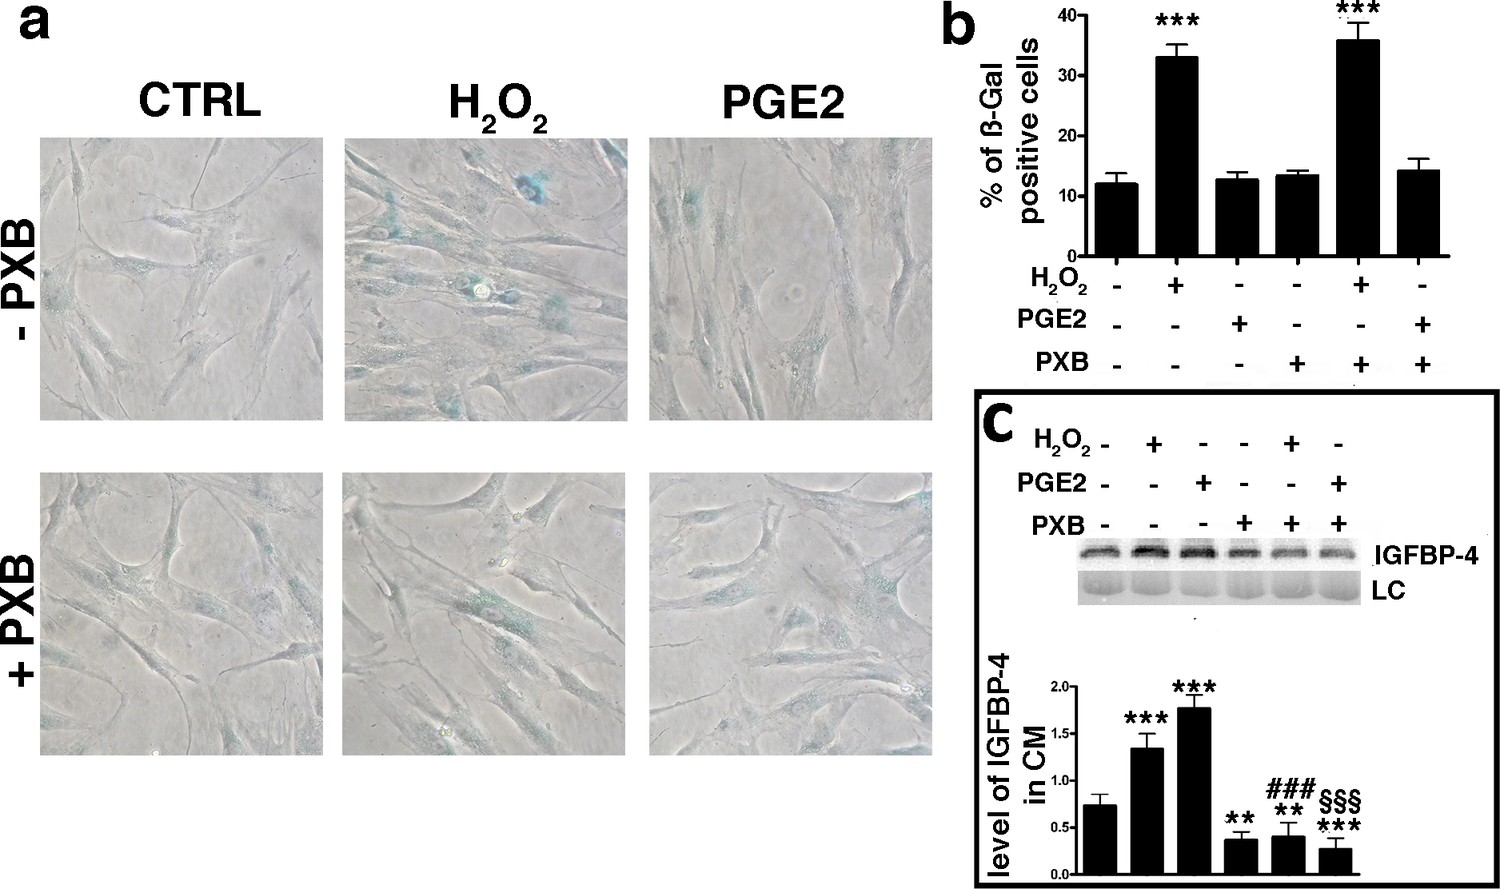
PGE2 effect on senescence and IGBP4 release.
Panel a – Acid beta galactosidase assay in control, H2O2-treated and PGE2 treated cells. The experiments were carried out with or without 200 μM Parecoxib (PXB). The data were obtained 48 hr after genotoxic stress. The picture shows representative samples. Panel b – The graph shows the mean percentage of the senescent cells compared with the control ( ± SD, n = 3). Anova analysis and post-hoc test identified several statistical differences among the samples. In the picture, we indicated only differences between the untreated cells (first column) and the other experimental conditions (***p<0.001). Panel c – Western blot analysis of IGFBP-4 in the conditioned media of MSC cultures 48 hr following treatments. Experiments were carried out either in the presence of H2O2 or PXB or PGE2. Membrane staining with Ponceau S acid red was used loading control (LC). The graph shows the densitometric analysis of the IGFBP-4 level. The differences between untreated cells (first column) and the other experimental conditions are indicated with ** (p<0.01) or *** (p<0.001). The symbol ### indicates statistical differences (p<0.001) between H2O2 (second column) and H2O2/PXB (fifth column) treated cells. The symbol §§§ indicates statistical differences (p<0.001) between PGE2 (third column) and PGE2/PXB (sixth column) treated cells. The data are expressed as arbitrary units ( ± SD, n = 3).
-
Figure 3—source data 1
Original image data (gels and micrographs) for Figure 3.
- https://cdn.elifesciences.org/articles/54523/elife-54523-fig3-data1-v3.zip
-
Figure 3—source data 2
Numerical data for Figure 3.
- https://cdn.elifesciences.org/articles/54523/elife-54523-fig3-data2-v3.xlsx
Figure 4 with 1 supplement
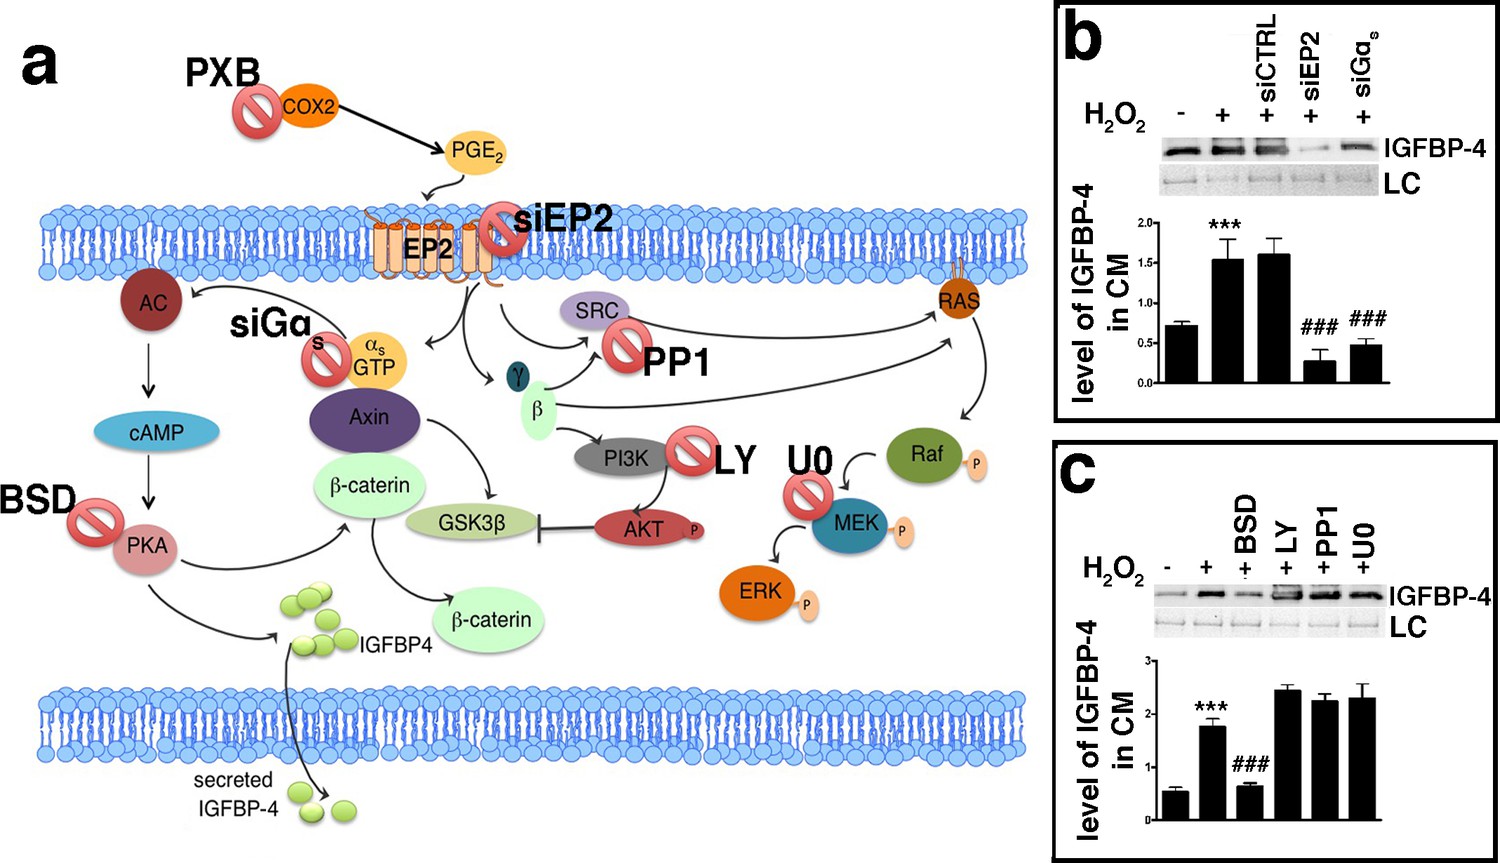
PGE2 signaling pathways.
Panel a - PGE2 can bind the EP2 receptor. This stimulates Gαs, which activates adenylyl cyclase (AC), which produces cyclic AMP (cAMP). This nucleotide induces protein kinase A (PKA) activation. The PGE2 binding to the EP2 receptor determines the release of Gβγ subunits, which stimulate AKT through phosphatidylinositol 3-kinase (PI3K). EP2 can also promote the activation of the RAS-RAF-MEK pathway through the SRC protein. In the cartoon are depicted the drugs and inhibitors of some key factors belonging to the PGE2 signaling pathways. siEP2: siRNA against EP2 mRNA; siGαs: siRNA against Gαs; PP1: SRC specific inhibitor; LY294002 (LY): PI3K inhibitor; bisindolylmaleimide IX (BSD): PKA inhibitor; U0126 (U0): MEK1/2 specific inhibitor. COX2: cyclooxygenase 2; PXB: parecoxib. Panel b – The IGFBP-4 release following EP2 or Gαs silencing. The picture shows the IGFBP-4 levels in the MSC-conditioned medium 48 hr following H2O2 treatment in the presence of either siRNA against EP2 (siEP2) or against Gαs (siGαs). Control siRNAs were indicated as siCTRL. Membrane staining with Ponceau S acid red was used loading control (LC). The graph shows the densitometric analysis of the IGFBP-4 level. The data are expressed in arbitrary units. The statistical difference (p<0.001) between untreated cells (first column) with sample treated with H2O2 (second column) is indicated with *** symbol. Statistical differences (p<0.001) among H2O2 treated cells (second column) with those treated with different siRNAs (third, fourth, fifth column) are indicated with ### symbol. Panel c – The picture shows the IGFBP-4 levels in MSC conditioned medium 48 hr following H2O2 treatment in presence of either Bisindolylmaleimide IX (BSD) (PKA ⊥), or LY294002 (LY) (PI3K ⊥), or PP1 (SRC ⊥) or U0126 (U0) (MEK1/2 ⊥). Membrane staining with Ponceau S acid red was used loading control (LC). The graph shows the densitometric analysis of the IGFBP-4 level. The data are expressed in arbitrary units. The statistical difference (p<0.001) between untreated cells (first column) with sample treated with H2O2 (second column) is indicated with *** symbol. The statistical differences (p<0.001) among H2O2 treated cells (second column) with those treated with different drugs (from third to sixth column) are indicated with ### symbol.
-
Figure 4—source data 1
Original image data (gels and micrographs) for Figure 4.
- https://cdn.elifesciences.org/articles/54523/elife-54523-fig4-data1-v3.zip
-
Figure 4—source data 2
Numerical data for Figure 4.
- https://cdn.elifesciences.org/articles/54523/elife-54523-fig4-data2-v3.xlsx
Figure 4—figure supplement 1

Expression level of EP2 receptors and functional tests to evaluate the effectiveness of drugs inhibiting the signaling pathway related to the IGFBP-4 release.
Panel a - Quantitative RT-PCR analysis of the EP receptor expression in MSCs. The mRNA levels were normalized to GAPDH mRNA expression, which was selected as an internal control. The data are expressed as arbitrary units with standard deviation. Panels b, c - Quantitative RT-PCR analysis of EP2 and Gαs expression in MSCs treated with siRNA either against EP2 (siEP2) or against Gαs (siGαs). siCTRL indicates cells incubated with control siRNA. The mRNA levels were normalized to GAPDH mRNA expression, which was selected as an internal control. The data are expressed as arbitrary units with standard error ( ± SD, n = 3, **p<0.01, ***p<0.001). Panel d – Test to evaluate PP1, an inhibitor of SRC activity. We incubated cells with 1 μM PP1 for 24 hr and then collected protein lysates for the western blot analysis. The inhibitory activity of PP1 was evaluated by determining the decrease in PI3K phosphorylation. The picture shows global and phosphorylated PI3K in the basal condition and after the PP1 treatment. Panel e - Test to evaluate U0126, an inhibitor of MEK1/2 activity. We incubated cells with 1 μM U0126 for 24 hr and then collected protein lysates for the western blot analysis. The inhibitory activity of U0126 was evaluated by determining the decrease in ERK phosphorylation. The picture shows the global and phosphorylated ERK in the basal condition and after the U0126 treatment. Panel f - Test to evaluate LY294002, an inhibitor of PI3K activity. We incubated cells with 5 μM LY294002 (LY) for 24 hr and then collected protein lysates for the western blot analysis. The inhibitory activity of LY was evaluated by determining the decrease in AKT phosphorylation. The picture shows the global and phosphorylated AKT in the basal condition and after the LY treatment. Panel g - Test to evaluate Bisindolylmaleimide IX (BSD), an inhibitor of PKA activity. We incubated cells with 5 nM BSD for 24 hr and then collected protein lysates for the western blot analysis. The inhibitory activity of BSD was evaluated by determining the decrease in MEK phosphorylation. The picture shows the global and phosphorylated MEK in the basal condition and after the BSD treatment. Panel h – Test to evaluate the specificity of antibodies against human IGF-IR and IGF-IIR. We performed the western blot analysis on protein lysates obtained from human immortal keratinocyte cells (HACAT) and MSCs. The picture shows the western blot films with unique signals corresponding to the expected bands, either for IGF-IR or IGF-IIR.
-
Figure 4—figure supplement 1—source data 1
Original image data (gels and micrographs) for Figure 4—figure supplement 1.
- https://cdn.elifesciences.org/articles/54523/elife-54523-fig4-figsupp1-data1-v3.zip
-
Figure 4—figure supplement 1—source data 2
Numerical data for Figure 4—figure supplement 1.
- https://cdn.elifesciences.org/articles/54523/elife-54523-fig4-figsupp1-data2-v3.xlsx
Figure 5
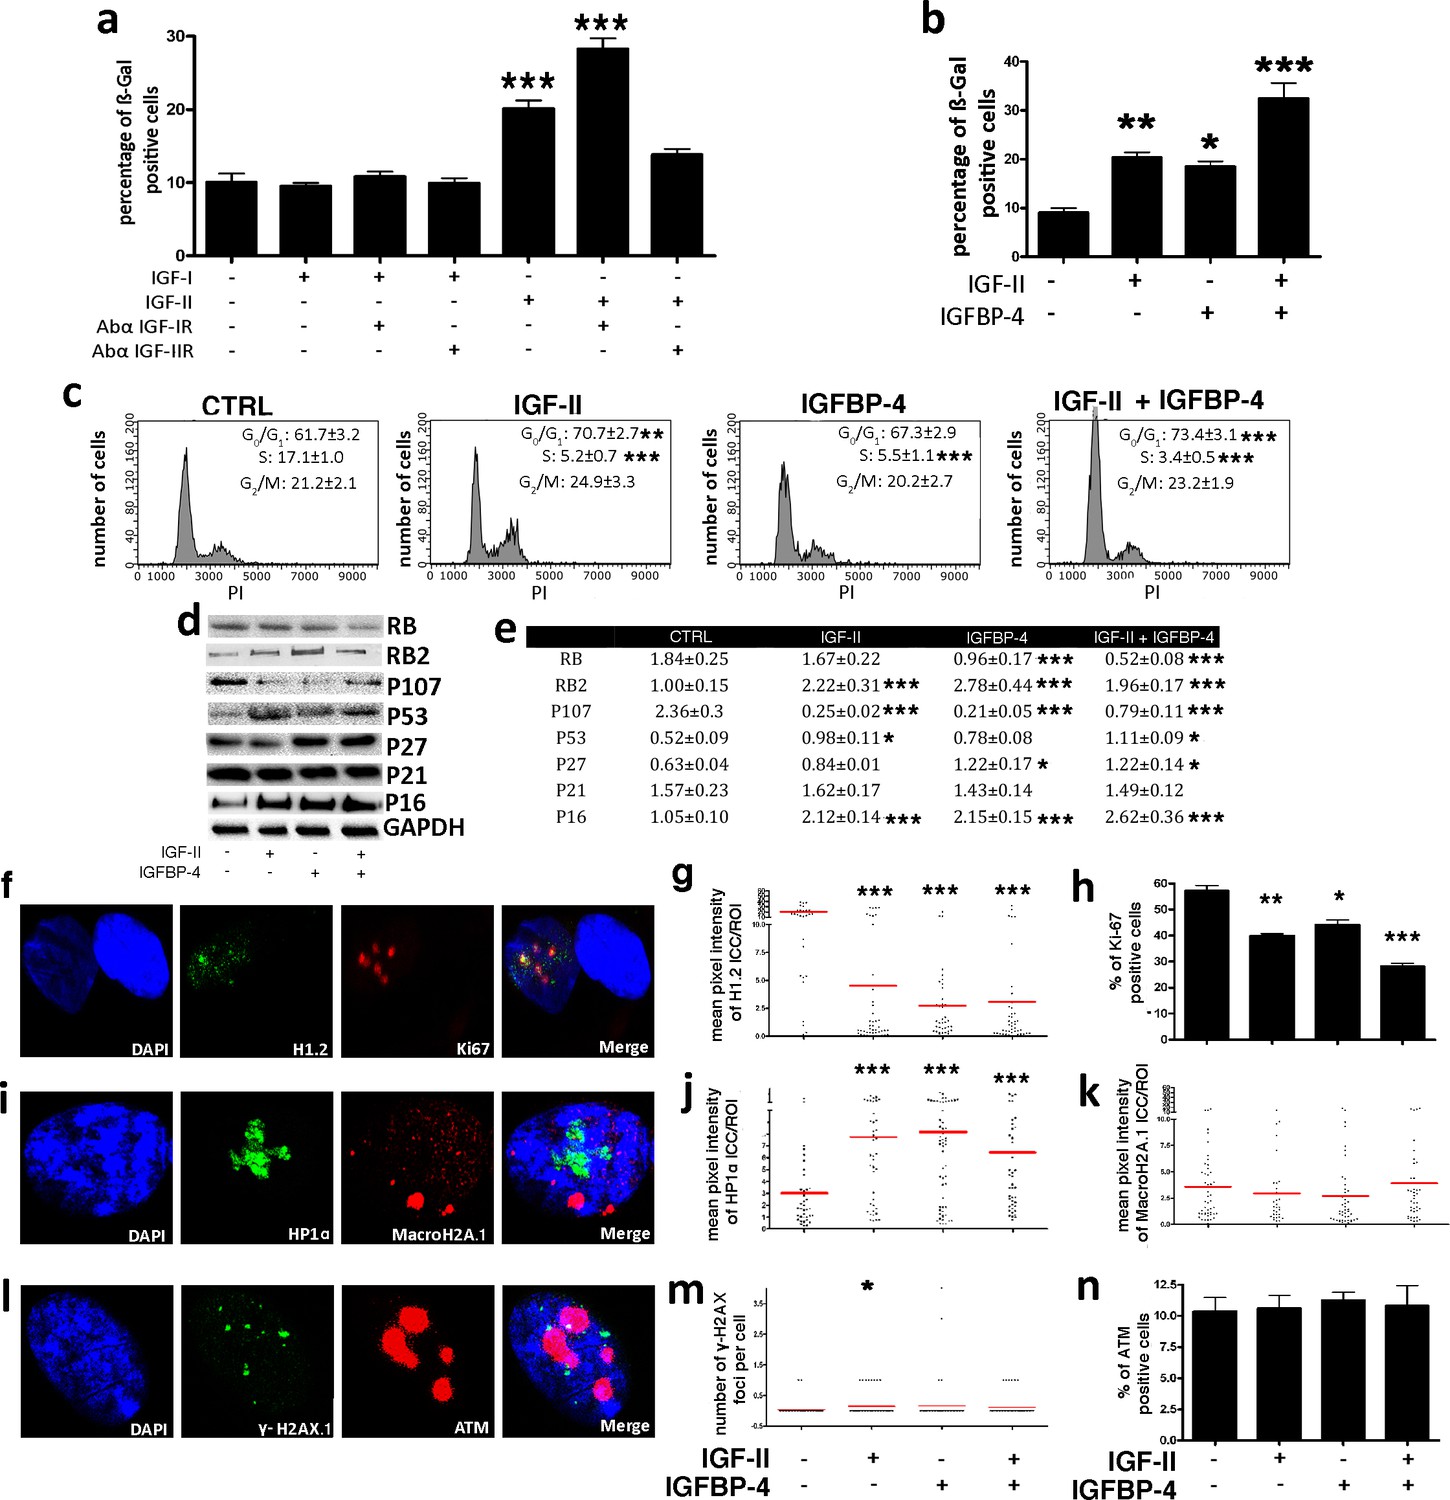
IGF-II and IGFP4 effects on senescence.
Panel a - The histogram shows the mean percentage value of the senescent cells 48 hr following the addition of 25 ng/ml IGF-I or IGF-II to the culture medium, in the presence or absence of 2 μg/ml anti-IGF-IR or anti-IGF-IIR. The data are expressed ± SD, n = 3. We compared the untreated cells (first column) with all the other experimental conditions and statistical differences are indicated with ***p<0.001. Panel b – The graph depicts the cell senescent level in the MSC cultures 48 hr after the media supplementation with 25 ng/ml IGF-II and/or 35 ng/ml IGFBP-4. The data are expressed as ± SD, n = 3. We compared the untreated cells (first column) with all the other experimental conditions and statistical differences are indicated with *p<0.05 or ***p<0.001. Panel c - The picture shows representative FACS analysis of the MSCs grown in the presence of IGF-II and/or IGFBP-4. The experiments were conducted in triplicate for each condition. The percentages of different cell populations (G1, S, and G2/M) are indicated. The data are expressed with standard deviation (n = 3). We compared the untreated cells (CTRL) with all the other experimental conditions and the statistical differences are indicated with *p<0.05 or **p<0.01 or ***p<0.001. Panel d – Western blot analysis of senescence-related proteins in MSC treated with IGF-II and/or IGFBP-4. GAPDH expression was used as the loading control. Panel e - The graph shows the densitometric analysis of the proteins depicted in panel d. We compared the untreated cells (CTRL) with all of the other experimental conditions, and the statistical differences are indicated with *p<0.05 or **p<0.01 or ***p<0. The data are expressed in arbitrary units. Panel f - Representative microscopic field of H1.2 (green) and Ki-67 (red) in MSC cultures. The nuclei were counterstained with DAPI (blue). Panel g – The graph displays the pixel intensity of anti-H1.2 immunostaining per ROI (region of interest). Each dot corresponds to the intensity detected in a single cell. The red bar represents the mean intensity value in the different experimental conditions. We compared the untreated cells (IGF-II-/IGFBP-4-) with all the other experimental conditions and the statistical difference are indicated with **p<0.01 or ***p<0.001. The data are expressed in arbitrary units. Panel h - The histogram shows the percentage of Ki-67(+) cycling cells in the MSC cultures in different experimental conditions. We compared the untreated cells (IGF-II-/IGFBP-4-) with all of the other experimental conditions, and the statistical differences are indicated with *p<0.05 or ***p<0.001. Panel i - Representative microscopic field of HP1 (green) and MacroH2A (red) in the MSC cultures. The nuclei were counterstained with DAPI (blue). Panel j – The graph displays the pixel intensity of anti-HP1 immunostaining per ROI (region of interest). Each dot corresponds to the intensity detected in a single cell. The red bar represents the mean intensity value. We compared the untreated cells (IGF-II-/IGFBP-4-) with all of the other experimental conditions, and the statistical differences are indicated with **p<0.01. The data are expressed in arbitrary units. Panel k – The graph displays the pixel intensity of anti-Macro H2A immunostaining per ROI (region of interest). Each dot corresponds to the intensity detected in a single cell. The red bar represents the mean intensity value. The data are expressed in arbitrary units. Panel l - Representative microscopic field of γH2AX (green) and ATM (red) in the MSC cultures. The nuclei were counterstained with DAPI (blue). Panel m - The graph shows the degree of H2AX phosphorylation (γH2AX). This was evaluated by counting the number of γH2AX immunofluorescent foci per cell. The foci number was determined for 200 cells. Each dot represents an individual cell. The red bars indicate the mean value for each category (n = 3). Panel n - The histogram shows the percentage of ATM(+) cells in the MSC cultures in different experimental conditions. The data are expressed with standard deviation, n = 3.
-
Figure 5—source data 1
Original image data (gels and micrographs) for Figure 5.
- https://cdn.elifesciences.org/articles/54523/elife-54523-fig5-data1-v3.zip
-
Figure 5—source data 2
Numerical data for Figure 5.
- https://cdn.elifesciences.org/articles/54523/elife-54523-fig5-data2-v3.xlsx
Figure 6

IGFBP-4 delays IGF-II degradation and modulates its pro-senescence activity.
Panel a - We incubated 25 ng/ml of IGF-II in DMEM supplemented with 10% FBS for several time points. The graph shows the western blot analysis of the IGF-II levels following 10, 20, 30, 60, 90, 120, 240, 480, and 1080 min incubation either in the presence or absence of 35 ng/ml of IGFBP-4. The data are expressed as arbitrary units ± SD, n = 3. In the graph, the best fit curves are shown. For each time point, we compared the IGF-II levels in the samples either containing or not containing IGFBP-4. For each couple of corresponding samples, the statistical differences are indicated with ***p<0.001. Panel b – The graph depicts the cell senescent level in the MSC cultures 48 hr after the media supplementation with 25 ng/ml IGF-II and/or 35 ng/ml IGFBP-4. In some experimental conditions, we also added 2 μg/ml of anti-PAPP-A neutralizing antibody. The data are expressed as ± SD, n = 3. We compared the untreated cells (first column) with those incubated with IGF-II and/or IGFBP-4 (second, third and fourth column). The statistical differences are indicated with *p<0.05 or ***p<0.001. Each treatment was compared with the corresponding experimental condition in the presence of anti-PAPP-A neutralizing antibodies. For each couple of corresponding samples, the statistical differences are indicated with # p<0.05 or ## p<0.01.
-
Figure 6—source data 1
Numerical data for Figure 6.
- https://cdn.elifesciences.org/articles/54523/elife-54523-fig6-data1-v3.xlsx
Figure 7 with 1 supplement
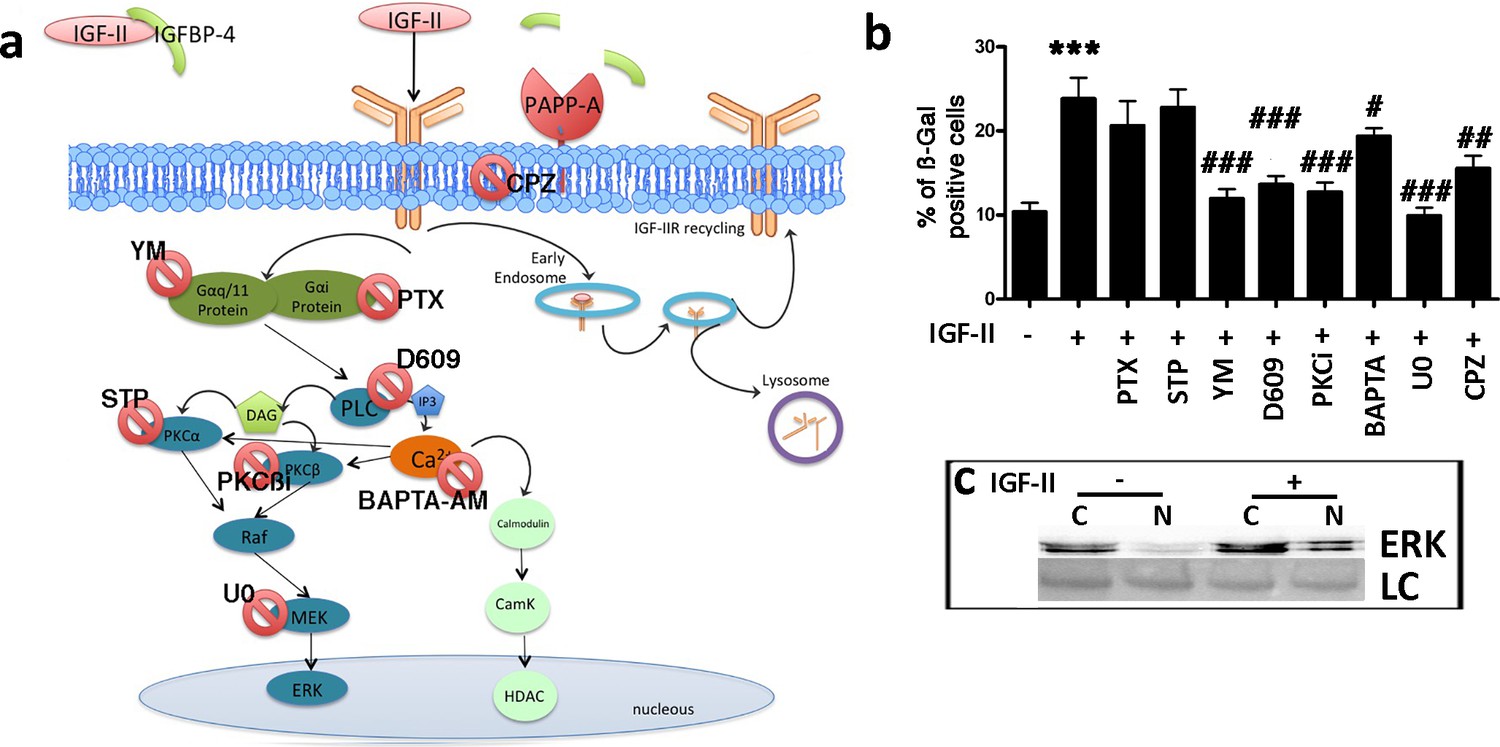
IGF-II signaling in senescence.
Panel a – Following the degradation of IGFBP-4 by PAPP-A protease, IGF-II can bind IGF-IIR. The IGF-II/IGF-IIR complex could be internalized via clathrin-coated pits and delivered to endosomes for redistribution of IGF-IIR to the cell surface (recycling). Endosomes may also release their cargo into lysosomes for degradation. The IGF-II/IGF-IIR complex can activate an alternative pathway that is associated with the G protein and phospholipase C (PLC). The result of the PLC activity is the production of diacylglycerol (DAG) and inositol triphosphate (IP3), which in turn, can activate protein kinase C (PKC) and the RAF/MEK/ERK pathway. BAPTA-AM: 1,2-bis-(2-aminophenoxy) ethane-N,N,N',N'-tetraacetic acid tetra (acetoxymethyl) ester; CPZ: chlorpromazine; D609: tricyclodecan-9-yl-xanthogenate; PKCβi: anilino monoindolylmaleimide; PTX: pertussis toxin; STP: 1,2,3,4-tetrahydrostaurosporine; YM: YM-254890. Panel b - Graph depicts the cell senescent level in the MSC cultures 48 hr after the media supplementation with 25 ng/ml IGF-II with or without several drugs. The data are expressed as ± SD, n = 3. We compared the untreated cells (first column) with those incubated with IGF-II (second column) and statistical differences is indicated with ***p<0.01. The statistical differences among IGF-II treated cells (second column) with those treated with different drugs (from third to tenth column) are indicated with the # (p<0.05) or ## (p<0.01) or ### (p<0.001) symbols. Panel c – Western blot analysis of ERK levels in cytoplasmic (C) and nuclear fractions (N) of cells treated or not treated with IGF-II. Membrane staining with Ponceau S acid red was used as a loading control (LC).
-
Figure 7—source data 1
Original image data (gels and micrographs) for Figure 7.
- https://cdn.elifesciences.org/articles/54523/elife-54523-fig7-data1-v3.zip
-
Figure 7—source data 2
Numerical data for Figure 7.
- https://cdn.elifesciences.org/articles/54523/elife-54523-fig7-data2-v3.xlsx
Figure 7—figure supplement 1

Functional tests to evaluate the effectiveness of drugs inhibiting the signaling pathway related to IGF-II.
Panel a – Test to evaluate pertussis toxin (PTX), an inhibitor of Gαi. The cellular cAMP level was determined by the ELISA assay on the MSC cultures treated or not treated with 100 nM PTX. The graph shows the cAMP level in the control (CTRL) and PTX-treated cells. The data are expressed as arbitrary units ± SD, n = 3. The statistical difference (p<0.01) is indicated with the ** symbol. Panel b – Test to evaluate YM-254890 (YM), a Gαq/11 inhibitor. The ELISA assay evaluated PLC on the MSC cultures treated with 1 μM YM. The graph shows the level of PLC selective fluorogenic substrate that emits a bright green emission upon cleavage. The Control and YM-254890-treated cells are indicated with CTRL and YM, respectively. The data are expressed as arbitrary units ± SD, n = 3. The statistical difference (p<0.01) is indicated with the ** symbol. Panel c – Test to evaluate D609, a PLCβ inhibitor. The western blot shows the total and phosphorylated P62 protein levels. The control and D609-treated cells are indicated with CTRL and D609, respectively. Panel d – Test to evaluate PKCβi (Santa Cruz Biotech, TX, USA), a PKCβ inhibitor. The western blot shows the total and phosphorylated P38 protein levels. The control and PKCβi-treated cells are indicated with CTRL and PKCβi, respectively. Panel e – Test to evaluate 1,2,3,4-tetrahydrostaurosporine (STP), a PKCα inhibitor. The western blot shows the total and phosphorylated P38 protein levels. The control and STP-treated cells are indicated with CTRL and STP, respectively. Panel f - Test to evaluate BAPTA-AM (BPT), a cell permeable calcium chelator. The western blot shows the total and phosphorylated CAMKII protein levels. The control and BAPTA-AM-treated cells are indicated with CTRL and BPT, respectively. Panel g – Test to evaluate chlorpromazine (CPZ), an endocytosis inhibitor. The flow cytometry assay shows the number of cells that were positive to green fluorescent fatty acid (BODIPY FL C16) either in the control cells (BodiPy) or in those treated with CPZ (BodiPy + CPZ). Panel h – Test to evaluate the effectiveness of the nuclear (N) cytoplasmic (C) separation procedure. WB analysis with anti-GAPDH, as a cytoplasmic marker, and anti-H1.2, as a nuclear marker to determine the purity of the N/C fractions. The experiments were carried out on cell lysates obtained from the MSCs cultivated with or without IGF-II.
-
Figure 7—figure supplement 1—source data 1
Original image data (gels and micrographs) for Figure 7—figure supplement 1.
- https://cdn.elifesciences.org/articles/54523/elife-54523-fig7-figsupp1-data1-v3.zip
-
Figure 7—figure supplement 1—source data 2
Numerical data for Figure 7—figure supplement 1.
- https://cdn.elifesciences.org/articles/54523/elife-54523-fig7-figsupp1-data2-v3.xlsx
Additional files
-
Supplementary file 1
Data from statistical analyses.
For each figure the results from ANOVA and post hoc tests are provided in a separate file. We do not insert it here since it is a 40 pages document.
- https://cdn.elifesciences.org/articles/54523/elife-54523-supp1-v3.docx
-
Supplementary file 2
Power size calculation.
- https://cdn.elifesciences.org/articles/54523/elife-54523-supp2-v3.docx
-
Supplementary file 3
List of primers used for RT-PCR.
- https://cdn.elifesciences.org/articles/54523/elife-54523-supp3-v3.docx
-
Transparent reporting form
- https://cdn.elifesciences.org/articles/54523/elife-54523-transrepform-v3.docx
Download links
A two-part list of links to download the article, or parts of the article, in various formats.
Downloads (link to download the article as PDF)
Open citations (links to open the citations from this article in various online reference manager services)
Cite this article (links to download the citations from this article in formats compatible with various reference manager tools)
Increase of circulating IGFBP-4 following genotoxic stress and its implication for senescence
eLife 9:e54523.
https://doi.org/10.7554/eLife.54523


