Dietary sugar inhibits satiation by decreasing the central processing of sweet taste
- The Neuroscience Graduate Program, The University of Michigan, United States
- Department of Molecular, Cellular and Developmental Biology, College of Literature, Science, and the Arts, The University of Michigan, United States
- The Undergraduate Program in Neuroscience, College of Literature, Science, and the Arts, The University of Michigan, United States
Figures
Figure 1
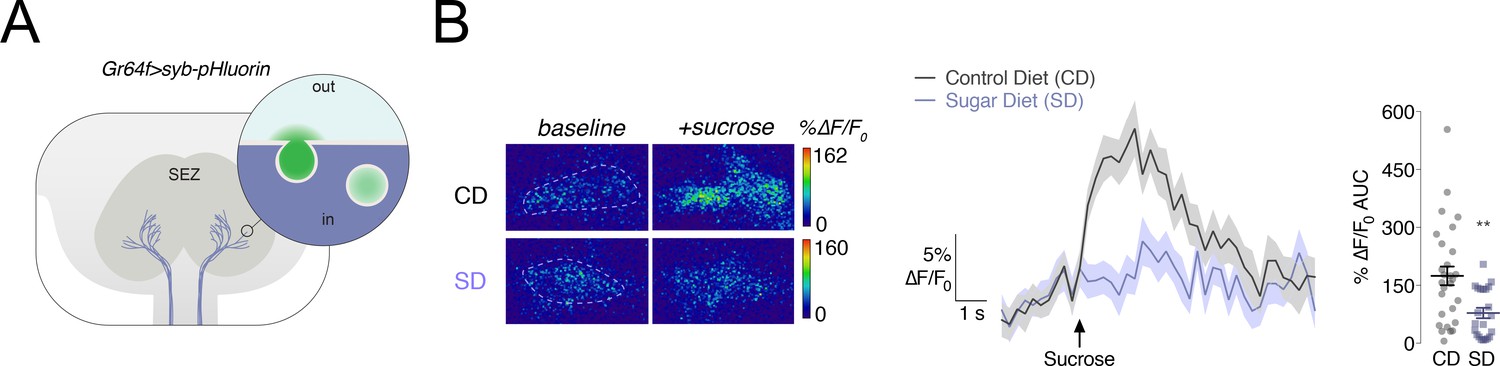
Vesicular release from the Gr64f+ taste neurons in response to a sucrose stimulus is decreased in flies fed a high sugar diet.
(A) Schematic of the subesophageal zone (SEZ), highlighting the Gr64f+ neuron terminals in lavender. Popout bubble demonstrates increased fluorescence upon vesicular release. (B) Left, Representative frames just prior (‘baseline’) and during (‘+sucrose’) 30% sucrose stimulation from flies fed a control (CD) or sugar diet (SD). ROIs marked with dashed lines. Center, Mean %∆F/F0 response traces, and Right, Area-under-the-curve (AUC) value of %∆F/F0 responses when Gr64f > syb pHluorin flies fed a CD (grey) or SD (lavender) were stimulated with 30% sucrose on the labellum. n = 22–28; shading and error bars depict the standard error of the mean. Mann-Whitney test; **p<0.001.
Figure 2 with 1 supplement
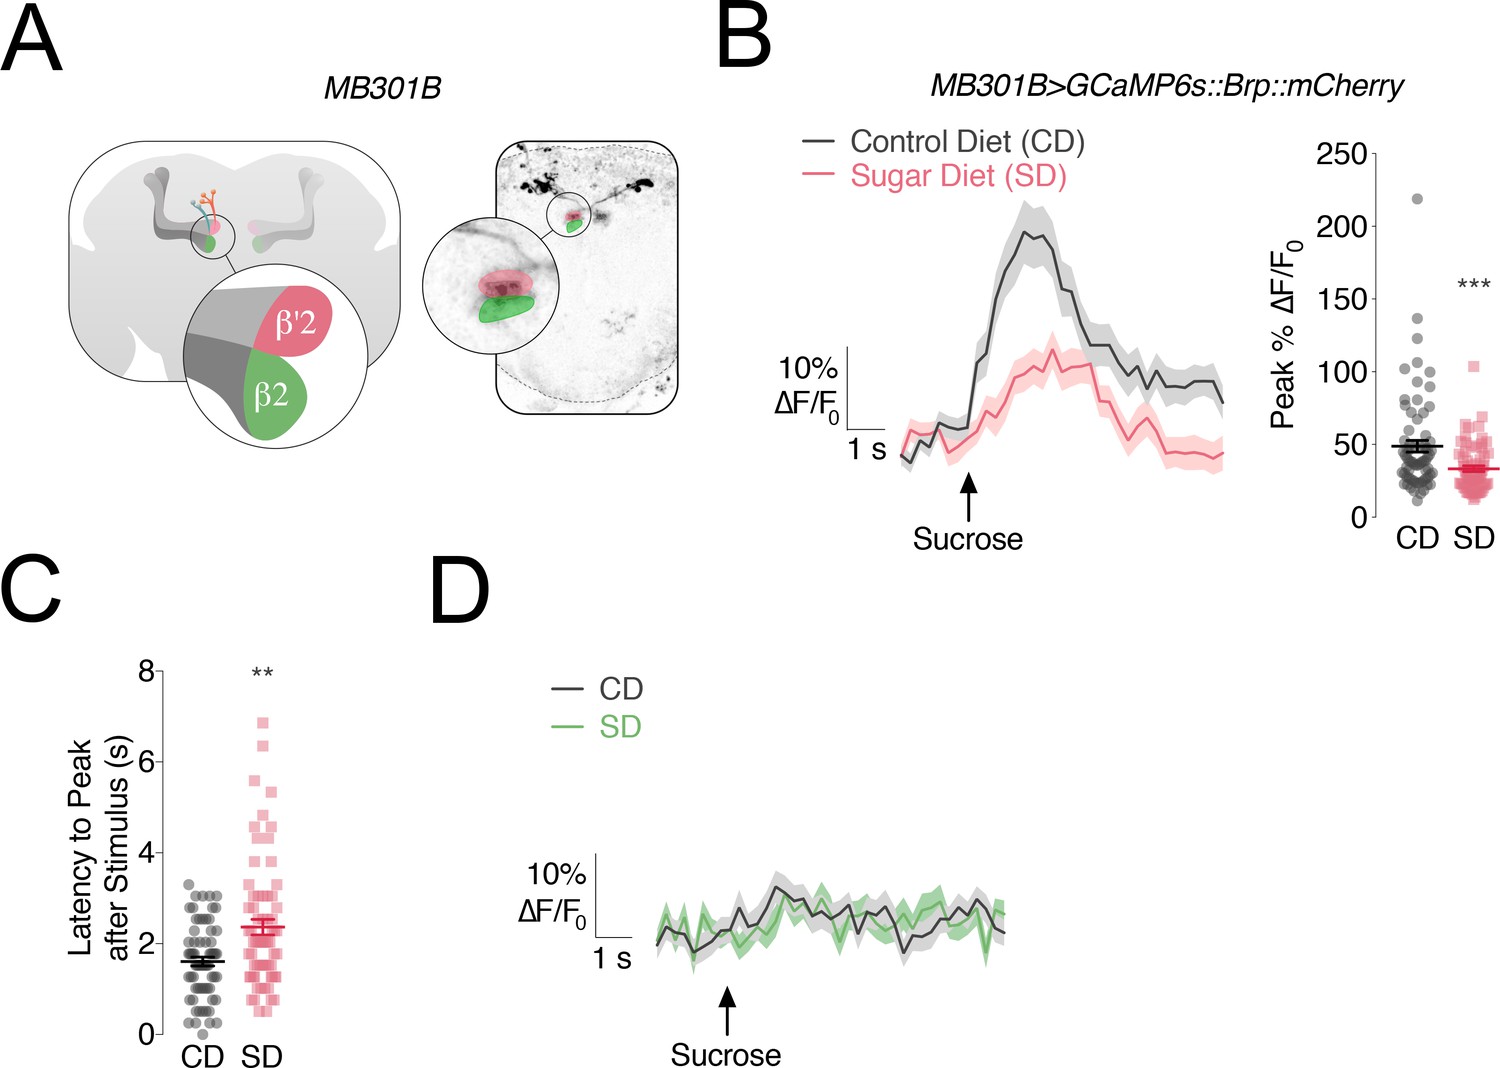
The responses of PAM-β’2 neurons to sweet stimuli change in flies fed a high sugar diet.
(A) Left, Anatomy of the Mushroom Body (MB) of the Drosophila melanogaster brain, with α/β, α’/β’ lobes in greys, and MB301B neurons in rose and green; popout bubble, schematic showing the β’2 (rose) and β2 (green) compartments in their respective MB lobes. Right, confocal image of MB301B neurons with β’2 (rose) and β2 (green) compartment expression. (B) Left, Mean %∆F/F0 traces, and Right, quantification of the maximum peak %∆F/F0 responses to 30% sucrose stimulation of the labellum in the β’2 compartment of MB301B > GCaMP6s::Brp::mCherry flies fed a control (CD, grey) and sugar diet (SD, rose). Shading and error bars are standard error of the mean. n = 67–70; Mann-Whitney test; ***p<0.001. (C) The delay in the calcium responses quantified as latency in seconds (s) to maximum peak ∆F/F0 from the animals in B. n = 67–70; Mann-Whitney test; **p<0.01. (D) Mean %∆F/F0 traces for the responses to 30% sucrose stimulation of the labellum in the β2 compartment of MB301B > GCaMP6s::Brp::mCherry flies fed a control (CD, grey) and sugar diet (SD, green). n = 67–70; shading is standard error of the mean.
Figure 2—figure supplement 1
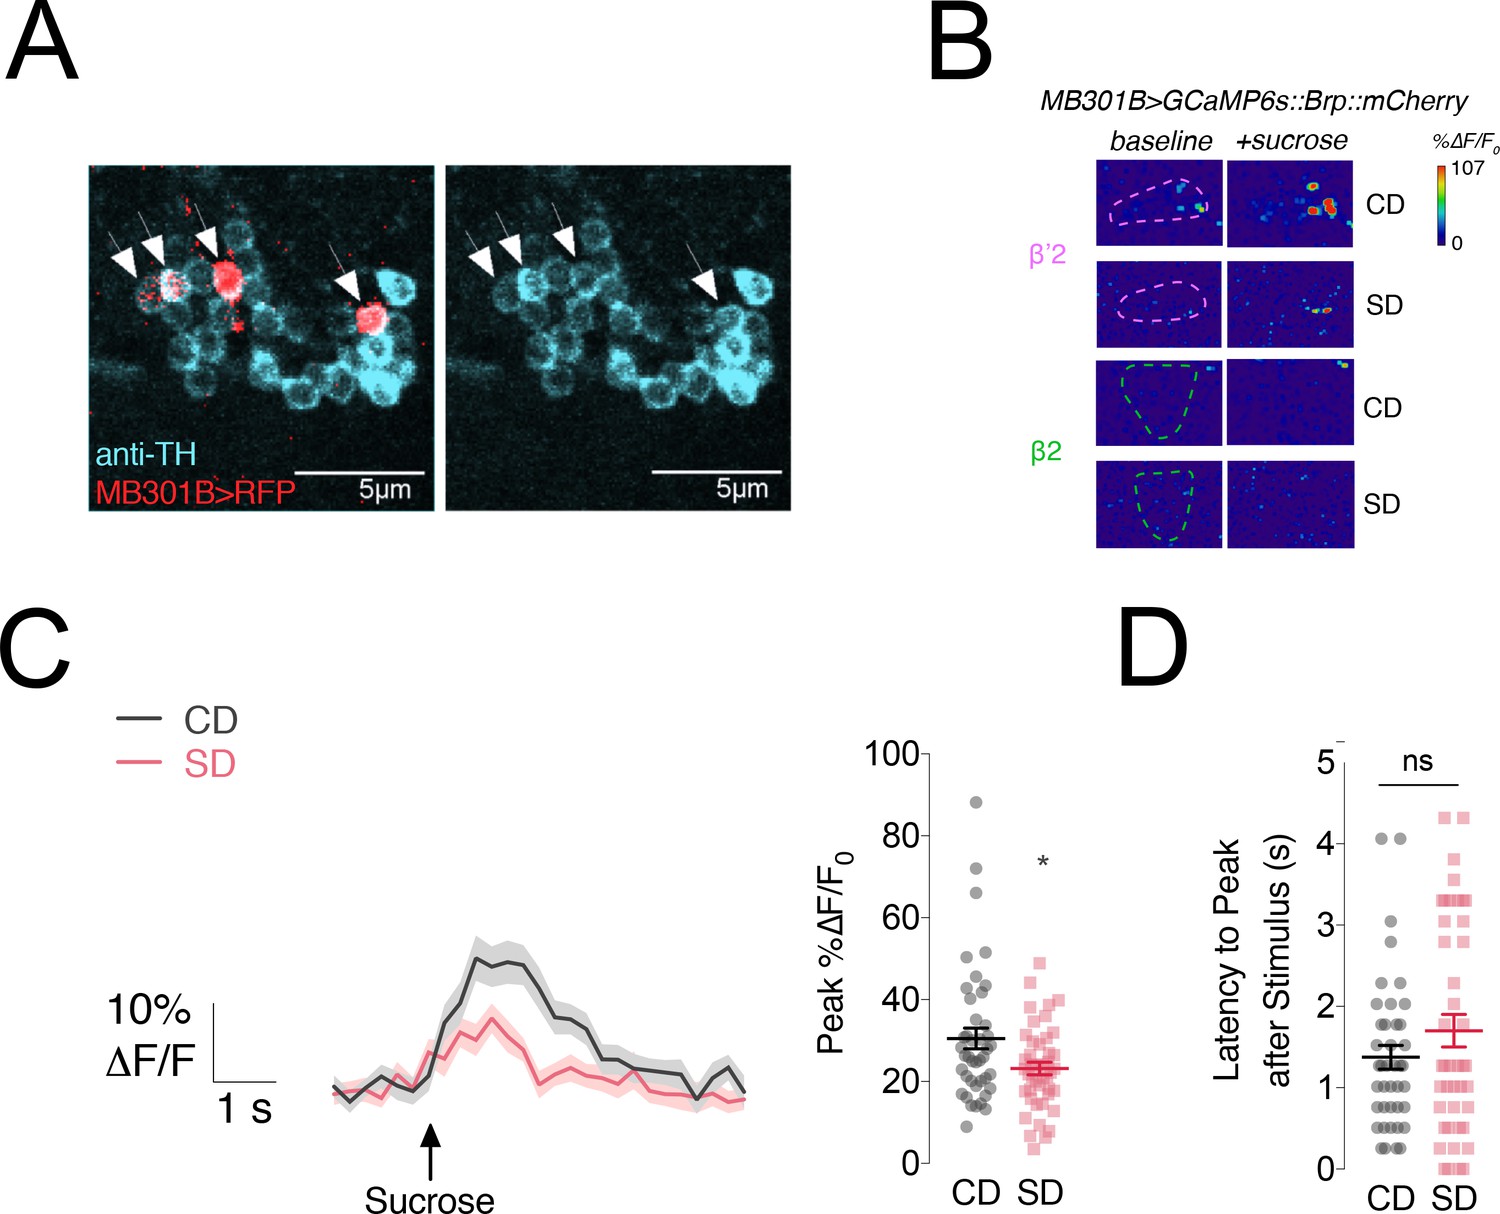
MB301B neurons are dopaminergic and respond to different concentrations of sucrose presentation to the labellum.
(A) Confocal fluorescence image of the PAM cluster neurons stained with an antibody against tyrosine hydroxylase (TH, cyan) in MB301B > RFP flies. Arrows indicate MB301B cell bodies (red) which are also positive for TH. Scale bar = 5 µm. (B) Representative frames before (‘baseline’) and during a (‘+sucrose’) 30% sucrose stimulation from flies fed a control (CD) or sugar diet (SD) in the β’2 (rose) and β2 (green) compartments. ROIs are marked with dashed lines. (C) Left, Mean %∆F/F0 traces and Right, quantification of the maximum peak %∆F/F0 responses to 5% sucrose stimulation of the labellum in the β’2 compartment of MB301B > GCaMP6s::Brp::mCherry flies fed a control (CD, grey) and sugar diet (SD, rose). Shading and error bars are standard error of the mean. n = 20–22; Mann-Whitney test; *p<0.05. (D) The delay in the calcium responses in C quantified as latency in seconds (s) to maximum peak ∆F/F0 from the animals in B. n = 20–22; error bars are standard error of the mean; Mann-Whitney test; no significance.
Figure 3 with 2 supplements
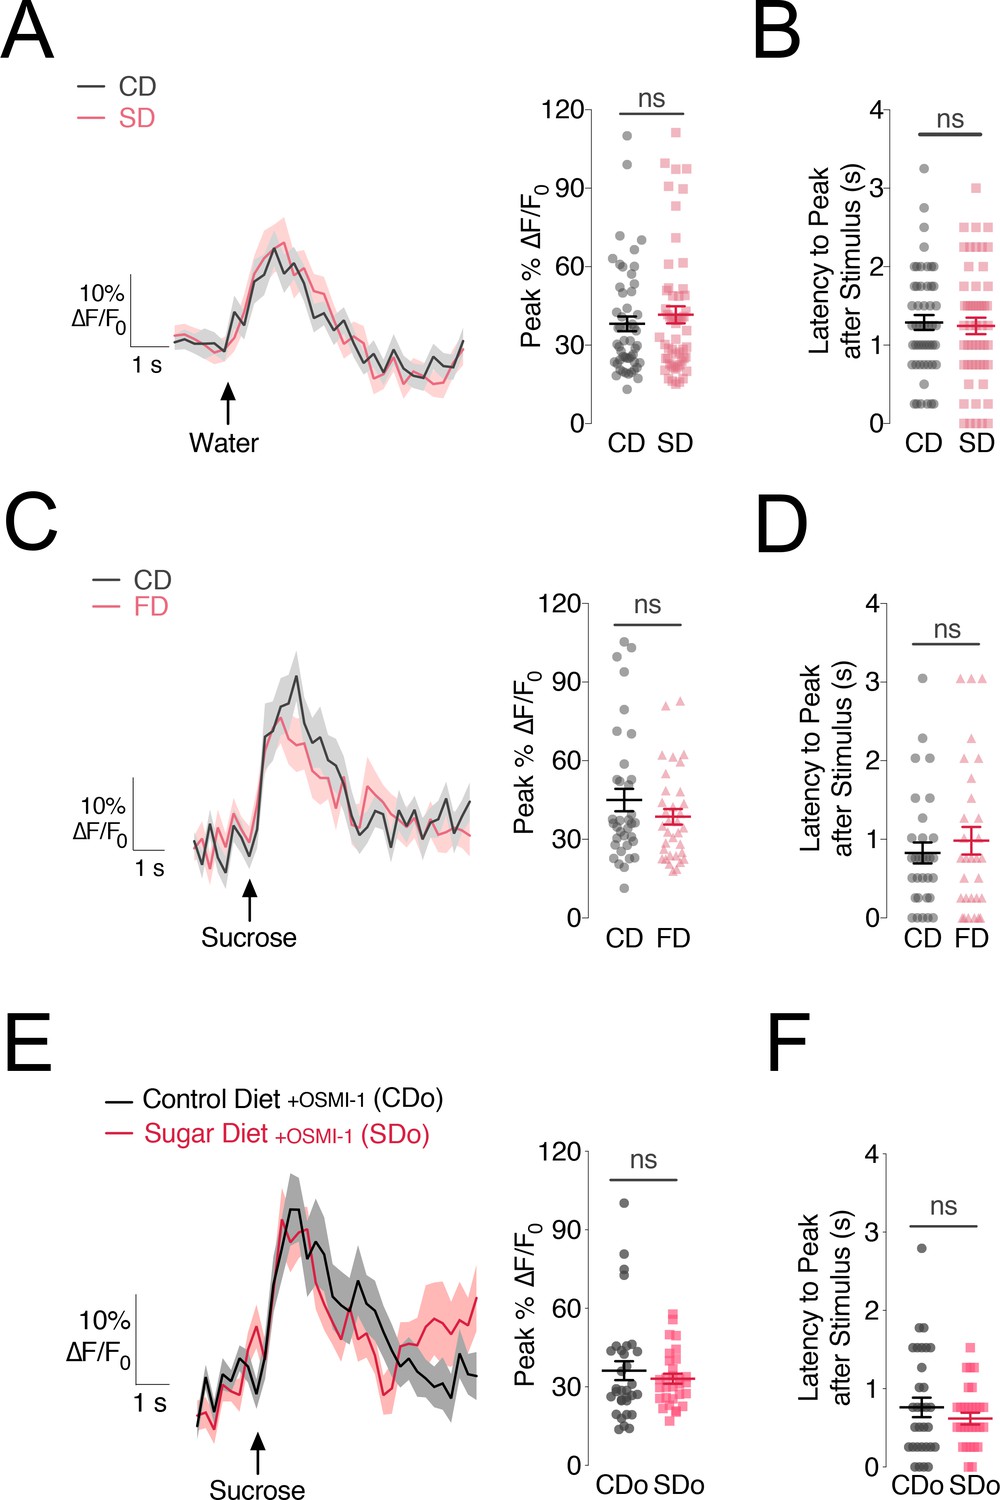
The changes in PAM-β’2 activity are specific to sugar stimuli and caused by deficits in sweet sensation.
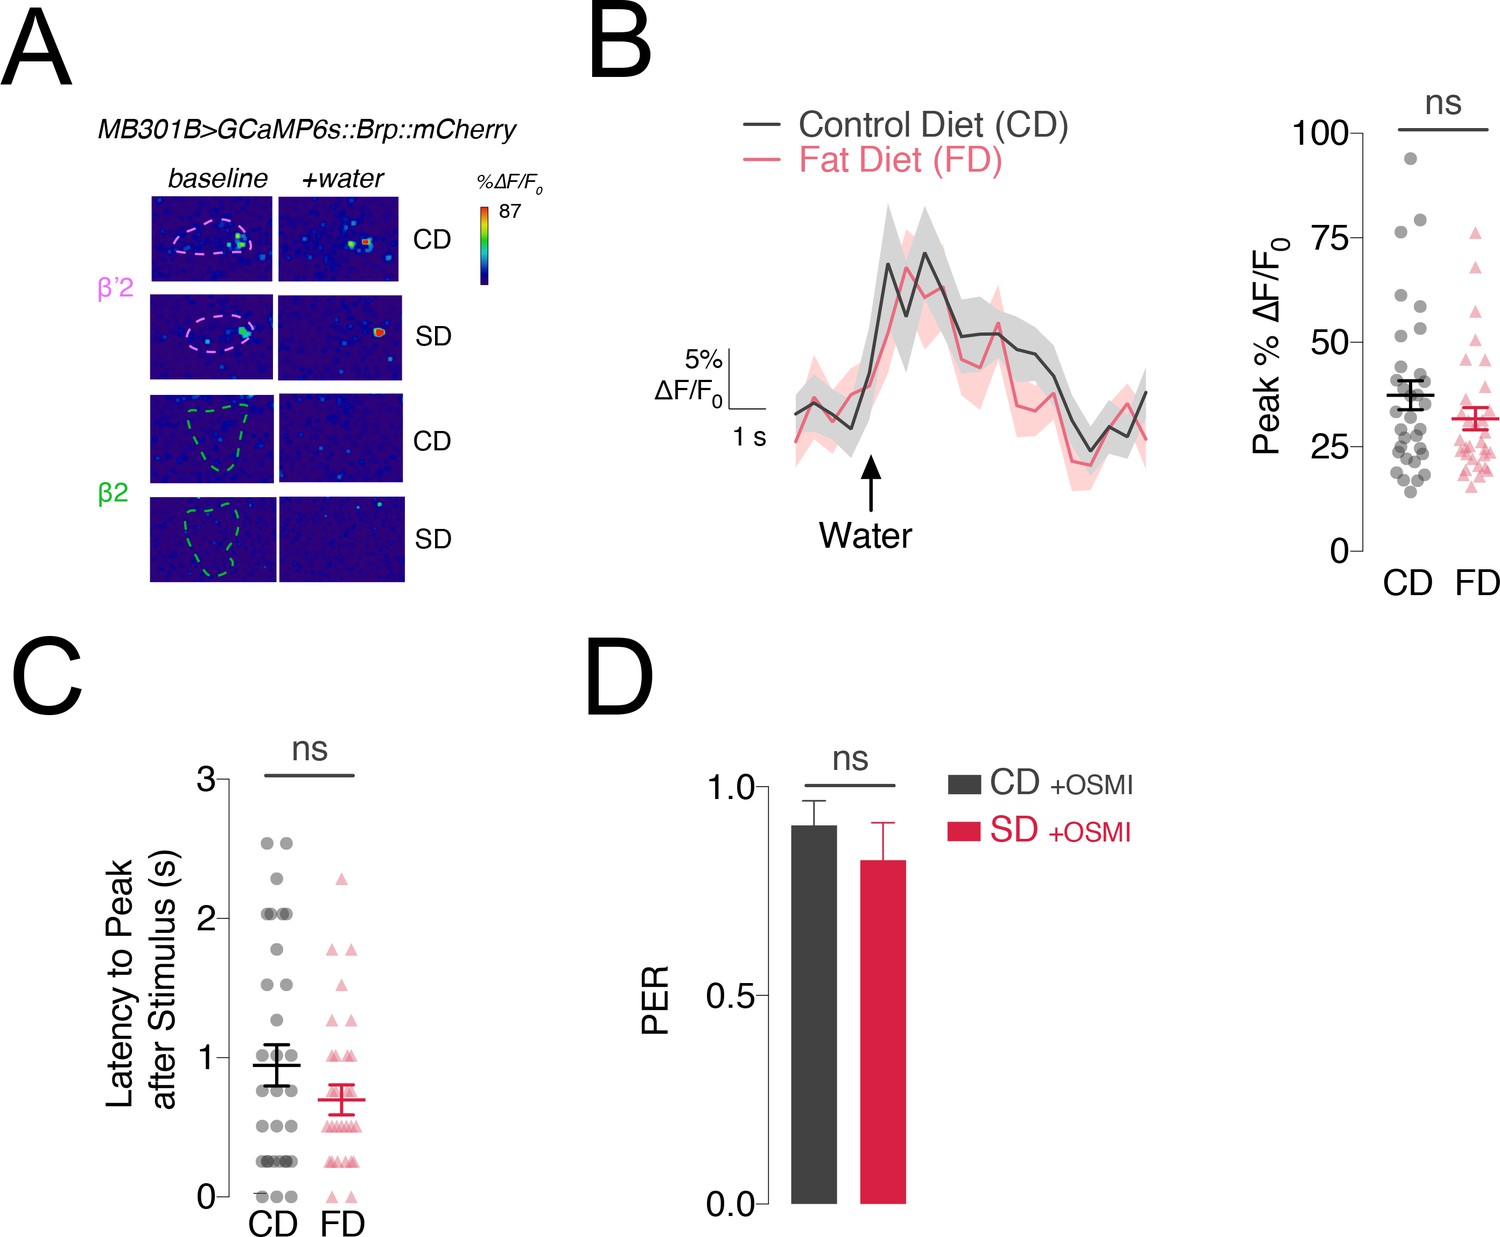
(A) Left, Mean %∆F/F0 traces and Right, quantification of the maximum peak %∆F/F0 responses to water stimulation of the labellum in the β’2 compartment of MB301B > GCaMP6s::Brp::mCherry flies fed a control (CD, grey) and sugar diet (SD, rose), same animals as in Figure 2. n = 67–70; shading and error bars are standard error of the mean. Mann-Whitney test; no significance. (B) The delay in the calcium responses quantified as latency in seconds (s) to maximum peak ∆F/F0 response from the animals in A. n = 67–70; error bars are standard error of the mean. Mann-Whitney test; no significance. (C) Left: Mean %∆F/F0 response traces and Right, quantification of the maximum peak %∆F/F0 responses to 30% sucrose stimulation of the labellum in the β’2 compartment of MB301B > GCaMP6s::Brp::mCherry flies fed a control (CD, grey) or high fat diet (FD, rose) n = 31–32; shading and error bars are standard error of the mean. Mann-Whitney test; no significance. (D) Latency-to-peak response times for the animals in C. n = 31–32; error bars are standard error of the mean. Mann-Whitney test; no significance. (E) Left, Mean %∆F/F0 traces and Right, quantification of the maximum peak %∆F/F0 responses to sucrose stimulation of the labellum in the β’2 compartment of MB301B > GCaMP6s::Brp::mCherry flies fed a control (CD, charcoal) and sugar diet (SD, red) supplemented with 75 µM OSMI-1. n = 30–32; shading and error bars are standard error of the mean. Mann-Whitney test; no significance. (F) The delay in the calcium responses quantified as latency in seconds (s) to maximum peak ∆F/F0 response from the animals in E. n = 30–32; error bars are standard error of the mean. Mann-Whitney test; no significance.
Figure 3—figure supplement 1
Water responses are unchanged in animals fed a high fat diet.
(A) Representative frames before (‘baseline’) and during (‘+water’) water stimulation from flies fed a control (CD) or sugar diet (SD) in the β’2 (rose) and β2 (green) compartments. ROIs are marked with dashed lines. (B) Left, Mean %∆F/F0 traces and Right, quantification of the maximum peak %∆F/F0 responses to stimulation of the labellum with water in the β’2 compartment of MB301B > GCaMP6s::Brp::mCherry flies fed a control (CD, grey) and high fat diet (FD, rose). n = 31–32; shading and error bars are standard error of the mean. Mann-Whitney test; no significance. (C) Latency-to-peak response times for the animals in A. n = 31–32; error bars are standard error of the mean. Mann-Whitney test; no significance. (D) Mean score of Proboscis Extension Response (PER) to stimulation of the labellum with 30% sucrose in male w1118CS flies, fed a control (CD, charcoal) and high sugar (SD, red), supplemented with 75 µM OSMI-1 (OSMI-1). n = 18 per group; error bars are standard error of the mean. Mann-Whitney test; no significance.
Figure 3—figure supplement 2
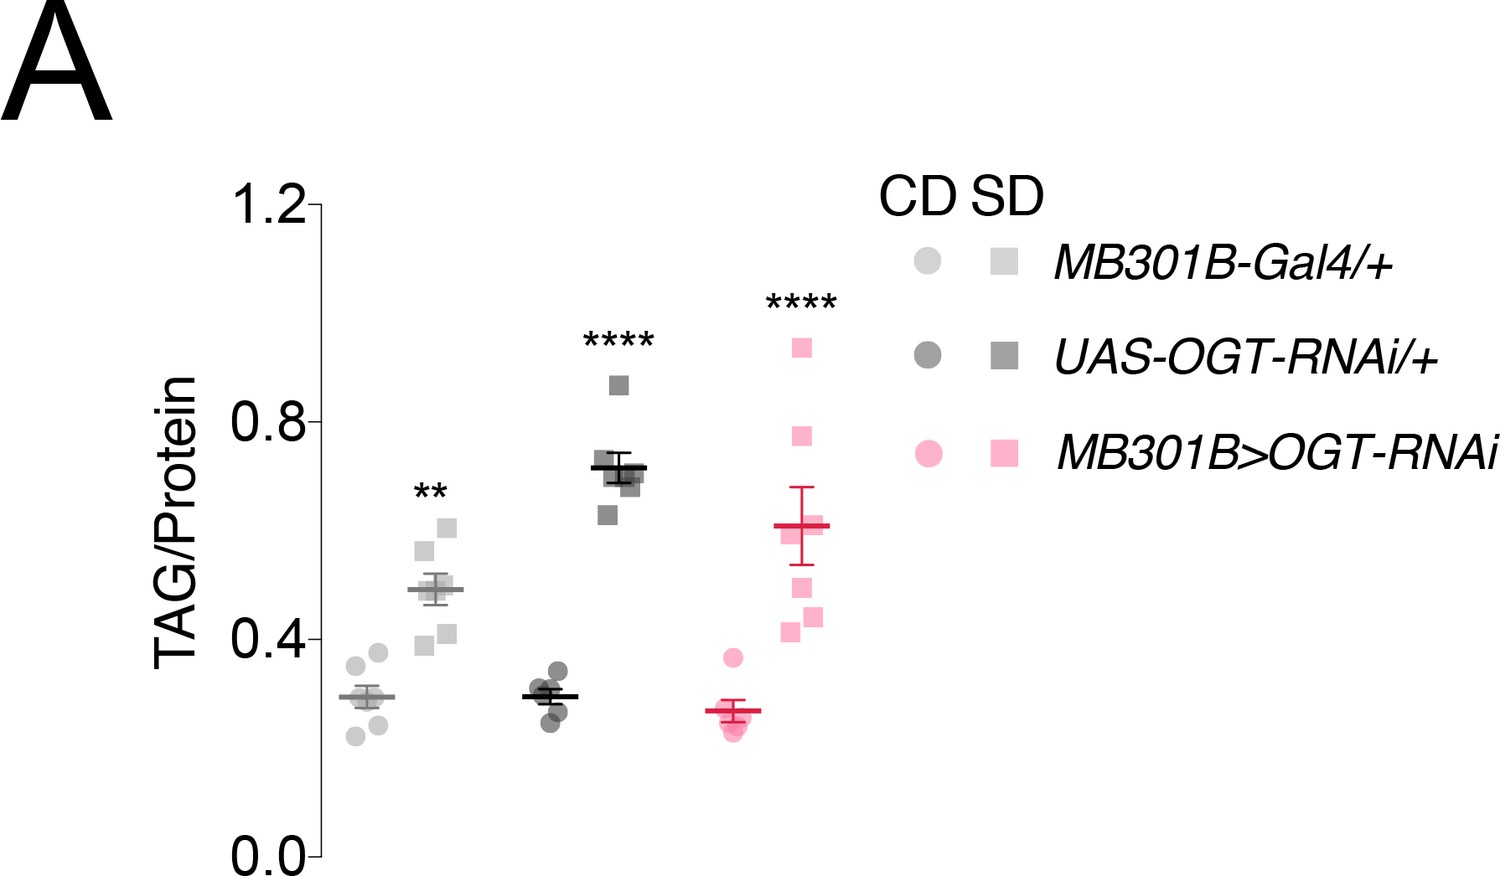
Knockdown of OGT in MB301B neurons has no effect on fat accumulation.
(A) Fat accumulation as measured by triacylglycerides (TAG) normalized to protein in flies with OGT knockdown in MB301B neurons (red) or transgenic controls (greys) fed control (CD, circles) or sugar diets (SD, squares) for 7 days. n = 6–8 per group; error bars are standard error of the mean. Two-way ANOVA with Sidak’s multiple comparison’s test; **p<0.01, ****p<0.001, comparisons to CD within genotype.
Figure 4 with 2 supplements

Closed-loop optogenetic activation of PAM-β’2 neurons corrects meal size and duration in flies fed a high sugar diet.
(A) Left: Conceptual schematic for the closed-loop optogenetic FLIC (optoFLIC), wherein a fly feeding on the 20% sucrose food triggers delivery of the red light during the food interaction. Right: Mean number of food interactions per day for MB301B > ReaChR flies fed 20% sucrose on the optoFLIC. Closed-loop light delivery was started on day 3 (indicated with red light bulbs). Control flies were not fed retinal (-ATR, rose), while experimental animals were fed retinal food before starting the experiment on the optoFLIC (+ATR, peach). n = 8–11; shading is standard error of the mean. Two-way Repeated Measure (RM) ANOVA; ****p<0.0001, Time by Retinal-treatment interaction. (B) The size of the evening meal measured as the number of food interactions per meal for animals in A. n = 8–11; shading is standard error of the mean. Two-way RM ANOVA; ****p<0.0001, Time by Retinal-treatment interaction. (C) The duration of the evening meal for animals in A. n = 8–11; shading is standard error of the mean. Two-way RM ANOVA; ****p<0.0001, Time by Retinal-treatment interaction. (D) Left, schematic of an evening meal, and Right, mean duration of the portion of the evening meal after the peak (satiation) in animals from A. n = 8–11; shading is standard error of the mean. Two-way RM ANOVA; ****p<0.0001, Time by Retinal-treatment interaction.
Figure 4—figure supplement 1

The effects of activating different PAM neurons on diet-induced obesity.
(A) Mean proboscis extension response (PER) to sucrose stimulation of the labellum (30%, 5%, and 1%) in MB301B > NaChBac flies following 7 days of exposure to a control (CD, left) or sugar diet (SD, right). n = 27 per condition; error bars are standard error of the mean. Kruskal-Wallis with Dunn’s multiple comparisons, no significance. (B) Mean feeding interactions per day of MB301B > ReaChR flies fed 5% sucrose on the optoFLIC with (red) or without (yellow) 60 Hz closed-loop light stimulation, UAS transgenic control in grey. n = 22–24 per genotype and light stimulation condition; error bars are standard error of the mean. Two-way Repeated Measures ANOVA with Tukey’s multiple comparisons test; *p<0.05, comparison to non-stimulated group within genotype with days averaged together. (C) Mean triacylglyceride (TAG) content normalized to protein of MB301B > NaChBac flies and single transgenic control male flies fed a CD or SD for 7 days. n = 8 per condition; error bars are standard error of the mean. Two-way ANOVA with Sidak’s multiple comparisons test; ****p<0.0001, comparison to CD within genotype. (D) Mean TAG content normalized to protein of male flies with expression of UAS-NaChBac in different subsets of PAM neurons innervating β’two or γ4 regions of the mushroom body. n = 5–8; error bars are standard error of the mean. Two-way ANOVA with Sidak’s multiple comparisons test; **p<0.01, ***p<0.001, ****p<0.0001, comparison to CD within genotype. Legends are on the right of the figure. (E) Mean TAG content normalized to protein of male flies with expression of UAS-NaChBac in nutrient-reward PAM neurons which innervate the β2 compartment of the mushroom body. n = 8 per condition; error bar is standard error of the mean. Two-way ANOVA with Sidak’s multiple comparisons test; no significance, comparison to CD within genotype.
Figure 4—figure supplement 2
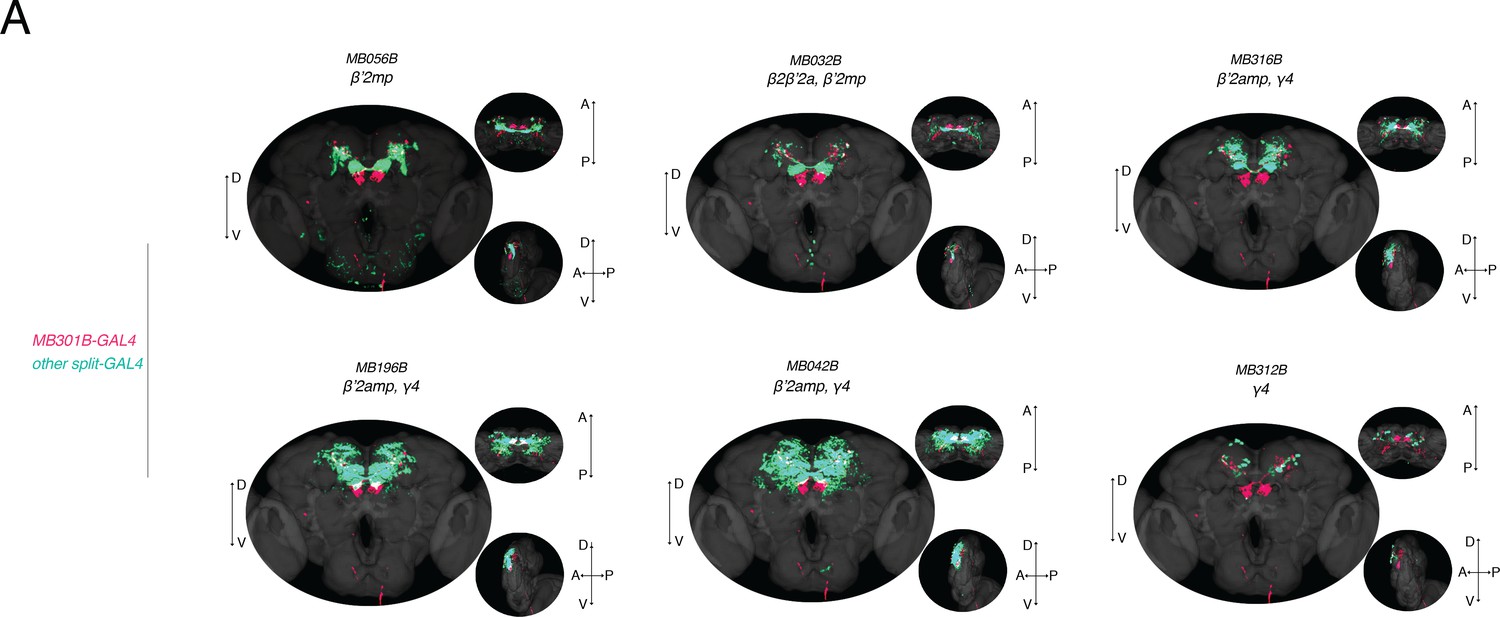
Anatomical comparison of a subset of PAM neurons.
(A) Overlay of expression patterns of MB301B (fuchsia) and other GAL4 lines (mint) that also innervate β’2. Colocalization visualized in white. D, dorsal; V, ventral; A, anterior; P, posterior.
Figure 5

Feeding rate is modulated by a high sugar diet and controlled by the activity of PAM-β’2 neurons.
(A) The mean of total feeding events per meal in MB301B > ReaChR flies with (- ATR, rose) or without (+ATR, peach) retinal pretreatment. A feeding event is calculated as the number of consecutive licks above and below the signal threshold (see Materials and methods). n = 8–11; shading is standard error of the mean. Two-way Repeated Measures (RM) ANOVA; ****p<0.0001, Time by Retinal-treatment interaction. (B) The feeding rate per meal, calculated as the mean number of events per hour of mealtime in the animals from A. n = 8–11; shading is standard error of the mean. Two-way RM ANOVA; ****p<0.0001, Time by Retinal-treatment interaction. (C) Quantification of the mean feeding rate after the peak of the meal in animals from A. n = 8–11; shading is standard error of the mean. Two-way RM ANOVA; ****p<0.0001, Time by Retinal-treatment interaction. (D) Quantification of the mean feeding rate before and including the peak of the meal from flies in A. n = 8–11; shading is standard error of the mean. Two-way RM ANOVA; ****p<0.0001, Time by Retinal-treatment interaction. (E) Model of the sweet taste and PAM DAN circuit changes when flies are fed a control (left) or high sugar diet (right): a decrease in the output of the Gr64f+ neurons (lavender axons, arrows) contributes to a decrease (yellow rays) and a delay (hourglass) in the central processing of sweet taste information in the PAM-β’2 terminals (rose), promoting higher feeding.
Tables
Key resources table
| Reagent type (species) or resource | Designation | Source or reference | Identifiers | Additional information |
|---|---|---|---|---|
| Genetic reagent (D. melanogaster) | Gr64f-GAL4 | H. Amrein; Kwon et al., 2011 | RRID:BDSC_57669 | Flybase symbol: P{Gr64f-GAL4.9.7}5 |
| Genetic reagent (D. melanogaster) | UAS-n-Syb-pH (pHluorin) | B. Ye; Poskanzer et al., 2003 | n/a | n/a |
| Genetic reagent (D. melanogaster) | MB301B-GAL4 | BloomingtonDrosophilaStock Center; Aso et al., 2014b | RRID:BDSC_68311 | Flybase symbols: P{y[+t7.7] w[+mC]=R71D01-p65.AD}attP40; P{y[+t7.7] w[+mC]=R58 F02-GAL4.DBD}attP2 |
| Genetic reagent (D. melanogaster) | UAS-GCaMP6S::Brp::mCherry | BloomingtonDrosophilaStock Center; Kiragasi et al., 2017 | RRID:BDSC_77131 | Flybase symbol: P{w[+mC]=UAS-GCaMP6s.brpS.mCherry}2 |
| Genetic reagent (D. melanogaster) | UAS-ReaChR | BloomingtonDrosophilaStock Center; Inagaki et al., 2014 | RRID:BDSC_53741 | Flybase symbol: P{y[+t7.7] w[+mC]=UAS-ReaChR}attP40 |
| Genetic reagent (D. melanogaster) | UAS-NaChBac | Nitabach, 2006 | RRID:BDSC_9469 | Flybase symbol: P{UAS-NaChBac}2 |
| Genetic reagent (D. melanogaster) | MB032B-GAL4 | BloomingtonDrosophilaStock Center; Aso et al., 2014b | RRID:BDSC_68302 | Flybase symbols: P{y[+t7.7] w[+mC]=R30 G08-p65.AD}attP40; P{y[+t7.7] w[+mC]=ple-GAL4.DBD}attP2 |
| Genetic reagent (D. melanogaster) | MB042B-GAL4 | BloomingtonDrosophilaStock Center; Aso et al., 2014b | RRID:BDSC_68303 | Flybase symbols: P{y[+t7.7] w[+mC]=R58E02-p65.AD}attP40/CyO; P{y[+t7.7] w[+mC]=R22E04-GAL4.DBD}attP2 |
| Genetic reagent (D. melanogaster) | MB056B-GAL4 | BloomingtonDrosophilaStock Center; Aso et al., 2014b | RRID:BDSC_68276 | Flybase symbols: P{y[+t7.7] w[+mC]=R76 F05-p65.AD}attP40; P{y[+t7.7] w[+mC]=R80 G12-GAL4.DBD}attP2 |
| Genetic reagent (D. melanogaster) | MB109B-GAL4 | BloomingtonDrosophilaStock Center; Aso et al., 2014b | RRID:BDSC_68261 | Flybase symbols: P{y[+t7.7] w[+mC]=R76 F05-p65.AD}attP40; P{y[+t7.7] w[+mC]=R23 C12-GAL4.DBD}attP2 |
| Genetic reagent (D. melanogaster) | MB196B-GAL4 | BloomingtonDrosophilaStock Center; Aso et al., 2014b | RRID:BDSC_68271 | Flybase symbols: P{y[+t7.7] w[+mC]=R58E02-p65.AD}attP40/CyO; P{y[+t7.7] w[+mC]=R36B06-GAL4.DBD}attP2 |
| Genetic reagent (D. melanogaster) | MB312B-GAL4 | BloomingtonDrosophilaStock Center; Aso et al., 2014b | RRID:BDSC_68314 | Flybase symbols: P{y[+t7.7] w[+mC]=R58E02-p65.AD}attP40/CyO; P{y[+t7.7] w[+mC]=R10 G03-GAL4.DBD}attP2 |
| Genetic reagent (D. melanogaster) | MB316B-GAL4 | BloomingtonDrosophilaStock Center; Aso et al., 2014b | RRID:BDSC_68317 | Flybase symbols: P{y[+t7.7] w[+mC]=R58E02-p65.AD}attP40/CyO; P{y[+t7.7] w[+mC]=R93 G08-GAL4.DBD}attP2 |
| Genetic reagent (D. melanogaster) | UAS-mCD8-RFP,LexAop-mCD8-GFP | BloomingtonDrosophilaStock Center; Pfeiffer et al., 2010 | RRID:BDSC_32229 | Flybase symbols: P{y[+t7.7] w[+mC]=10XUAS-IVS-mCD8::RFP}attP18; P{y[+t7.7] w[+mC]=13XLexAop2-mCD8::GFP}su(Hw)attP8 |
| Genetic reagent (D. melanogaster) | UAS-mCD8-GFP | A.-S. Chiang; Dus et al., 2015 | n/a | |
| Genetic reagent (D. melanogaster) | w1118-CS | A. Simon | n/a | |
| Commercial assay or kit | Pierce BCA Protein Assay Kit | Thermo Scientific | Cat. #23225 | |
| Commercial assay or kit | Triglyceride LiquiColor Test (Enzymatic) | Stanbio | Ref. # 2100–430 | |
| Chemical compound, drug | D-sucrose | Fisher Scientific | BP220-10 | |
| Chemical compound, drug | all-trans-retinal | Sigma-Aldrich | R2500-100MG, CAS: 116-31-4 | |
| Software, algorithm | Olympus FluoView FV1200-ASW 4.2 | Olympus Life Science | RRID:SCR_014215 | |
| Software, algorithm | FLIC Monitor | FLIC support; Ro et al., 2014 | RRID:SCR_018387 | |
| Software, algorithm | RStudio | RStudio, Inc | RRID:SCR_000432 | |
| Software, algorithm | FLIC analysis R code | FLIC support; Ro et al., 2014; May et al., 2019 | RRID:SCR_018386 | |
| Software, algorithm | Fiji | ImageJ | RRID:SCR_002285 |
Additional files
Download links
A two-part list of links to download the article, or parts of the article, in various formats.
Downloads (link to download the article as PDF)
Open citations (links to open the citations from this article in various online reference manager services)
Cite this article (links to download the citations from this article in formats compatible with various reference manager tools)
Dietary sugar inhibits satiation by decreasing the central processing of sweet taste
eLife 9:e54530.
https://doi.org/10.7554/eLife.54530


