Regulation of stem/progenitor cell maintenance by BMP5 in prostate homeostasis and cancer initiation
- Goodman Cancer Research Centre and Department of Biochemistry, McGill University, Canada
Figures
Figure 1 with 3 supplements

Gata3 loss leads to an expansion of prostate basal stem/progenitor cells numbers.
(A) Effect of Gata3 loss and overexpression on in vitro basal stem/progenitor maintenance potential. Organoid-forming potential was assessed by plating equal numbers (105 cells) of sorted basal prostate cells from the indicated genotypes in Matrigel and passaged every 7 days. Shown is the absolute number of cells obtained after each passage for the indicated genotypes. Data are representative of two independent experiments from a pool of prostate cells from a minimum of three mice. (B) Specific deletion of Gata3 in KRT5+ basal cells affect the organoid-forming potential upon passage. Organoid-forming potential was assessed as in (A). Cre activity was induced in vitro by treatment with hydroxy-tamoxifen for the first passage. (C) Gata3 loss increase regenerative capacity in vivo. Different numbers of sorted basal cells from wild type (Pbsn-Cre, Pbsn-Cre Gata3f/f and Krt5CreERT2Gata3f/f) prostate were mixed with UGSM and transplanted under the kidney capsule of immunodeficient mice. All mice contain Rosa26LstopLTdTomato/+ allele and Cre activity was induced in vivo by tamoxifen injection in adult mice 4 weeks prior to organoid propagation potential assessment. Prostate reconstituting units (PRU) frequency of total basal cells was calculated based on growth of TdTomato+ grafts using the Limiting Dilution Analysis software L-Calc (StemCell Technologies) according to Poisson statistics (two-tailed t-test; *p<0.05, **p<0.001). (D) Immunofluorescence staining of lineage-specific markers KRT5 (basal) and KRT8/18 (luminal) in wild type, Pbsn-Cre Gata3f/f and Krt5CreERT2Gata3f/f allografts. Scale bar is representative of 50 μm. See also Figure 1—figure supplements 1–2.
-
Figure 1—source data 1
Statistical analysis for Figure 1A–B and Figure 1—figure supplement 2A–B.
- https://cdn.elifesciences.org/articles/54542/elife-54542-fig1-data1-v2.pzfx
-
Figure 1—source data 2
Statistical analysis for Figure 1C.
- https://cdn.elifesciences.org/articles/54542/elife-54542-fig1-data2-v2.xlsx
Figure 1—figure supplement 1
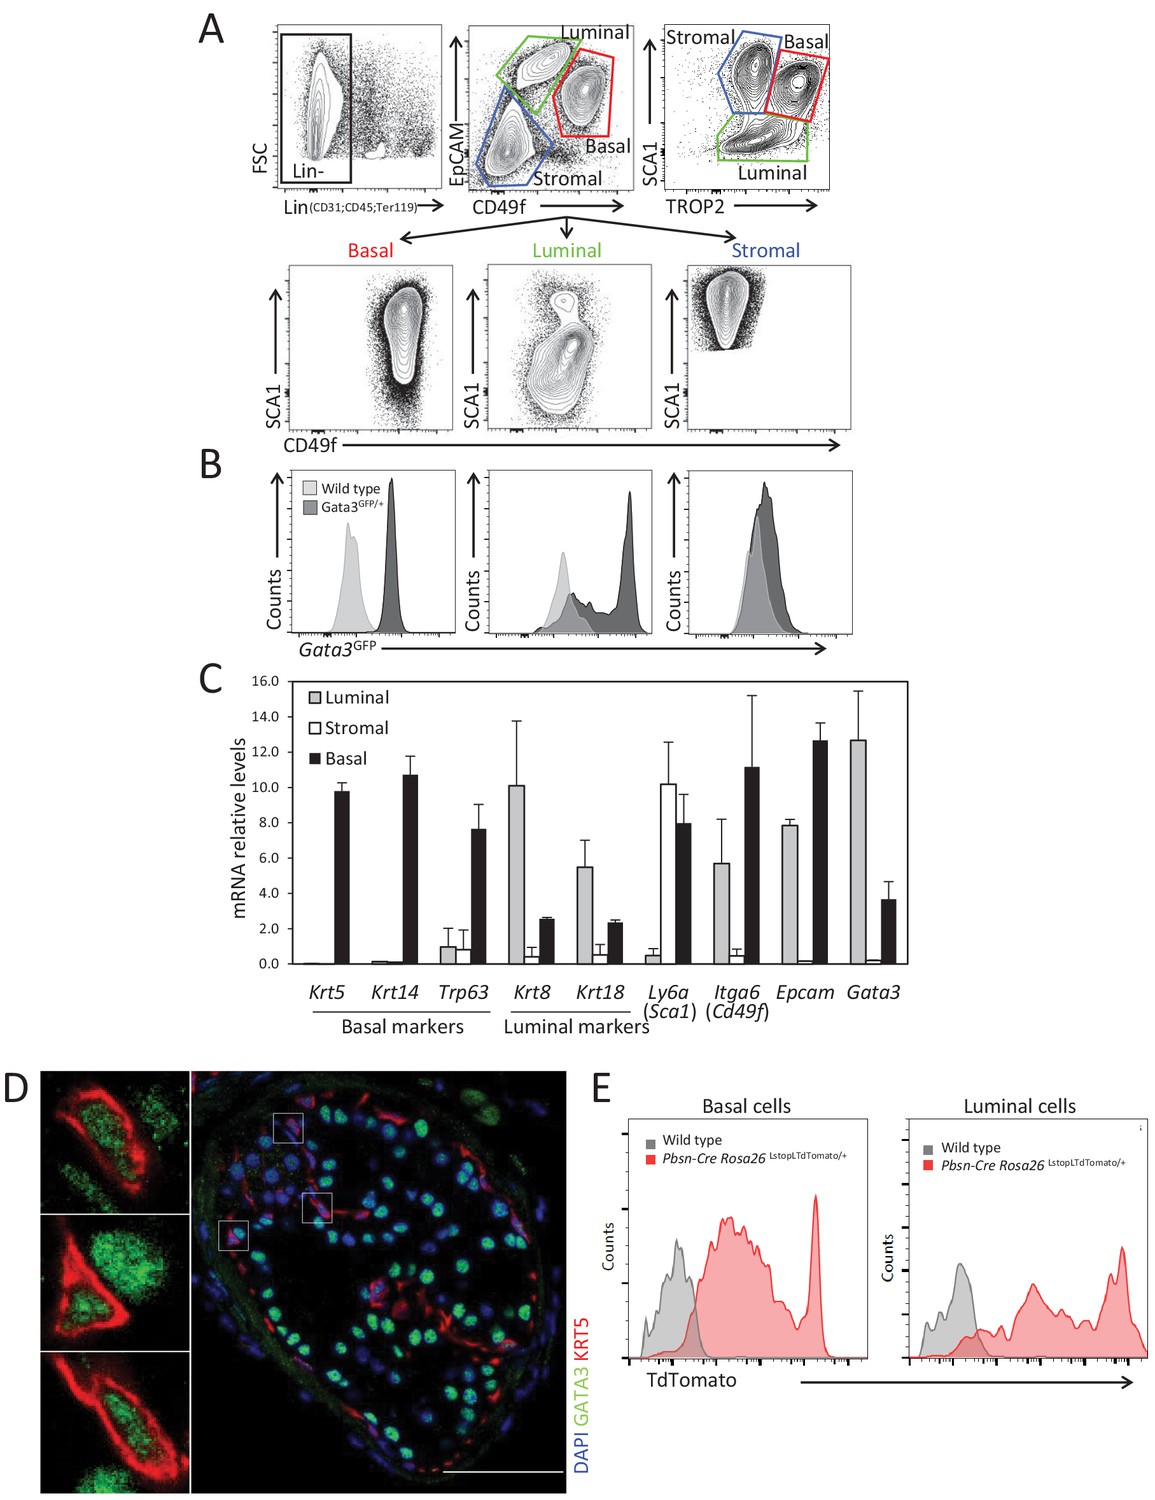
GATA3 is expressed in prostate basal and luminal cells.
(A) Representative fluorescence-activated cell sorting (FACS) strategy to purify stromal, luminal and basal cell populations from adult prostate using antibodies against surface markers: CD45, CD31, TER119, CD49f, EpCAM, SCA1, and TROP2. (B) Histogram of endogenous Gata3-driven GFP reporter expression in the indicated populations in Gata3GFP knock-in and wild-type mice. (C) Expression of specific population markers in FACS sorted stromal, luminal and basal cell populations from adult prostate as assessed by quantitative RT-PCR. Relative mRNA expression levels are normalized to Ppia mRNA levels (Average ± SD, n = 3). (D) Immunofluorescence analysis of GATA3 in prostate tissue from adult wild-type mice. Notice the expression of GATA3 in both basal and luminal cells. Scale bar: 50 μm. (E) Specific activation of Rosa26LstopLTdTomato fluorescent reporter by Pbsn-Cre transgene in basal and luminal populations from adult prostate tissue as assessed by FACS.
-
Figure 1—figure supplement 1—source data 1
Expression levels of differentially expressed genes between populations on Figure 1—figure supplement 1C.
- https://cdn.elifesciences.org/articles/54542/elife-54542-fig1-figsupp1-data1-v2.pzfx
Figure 1—figure supplement 2
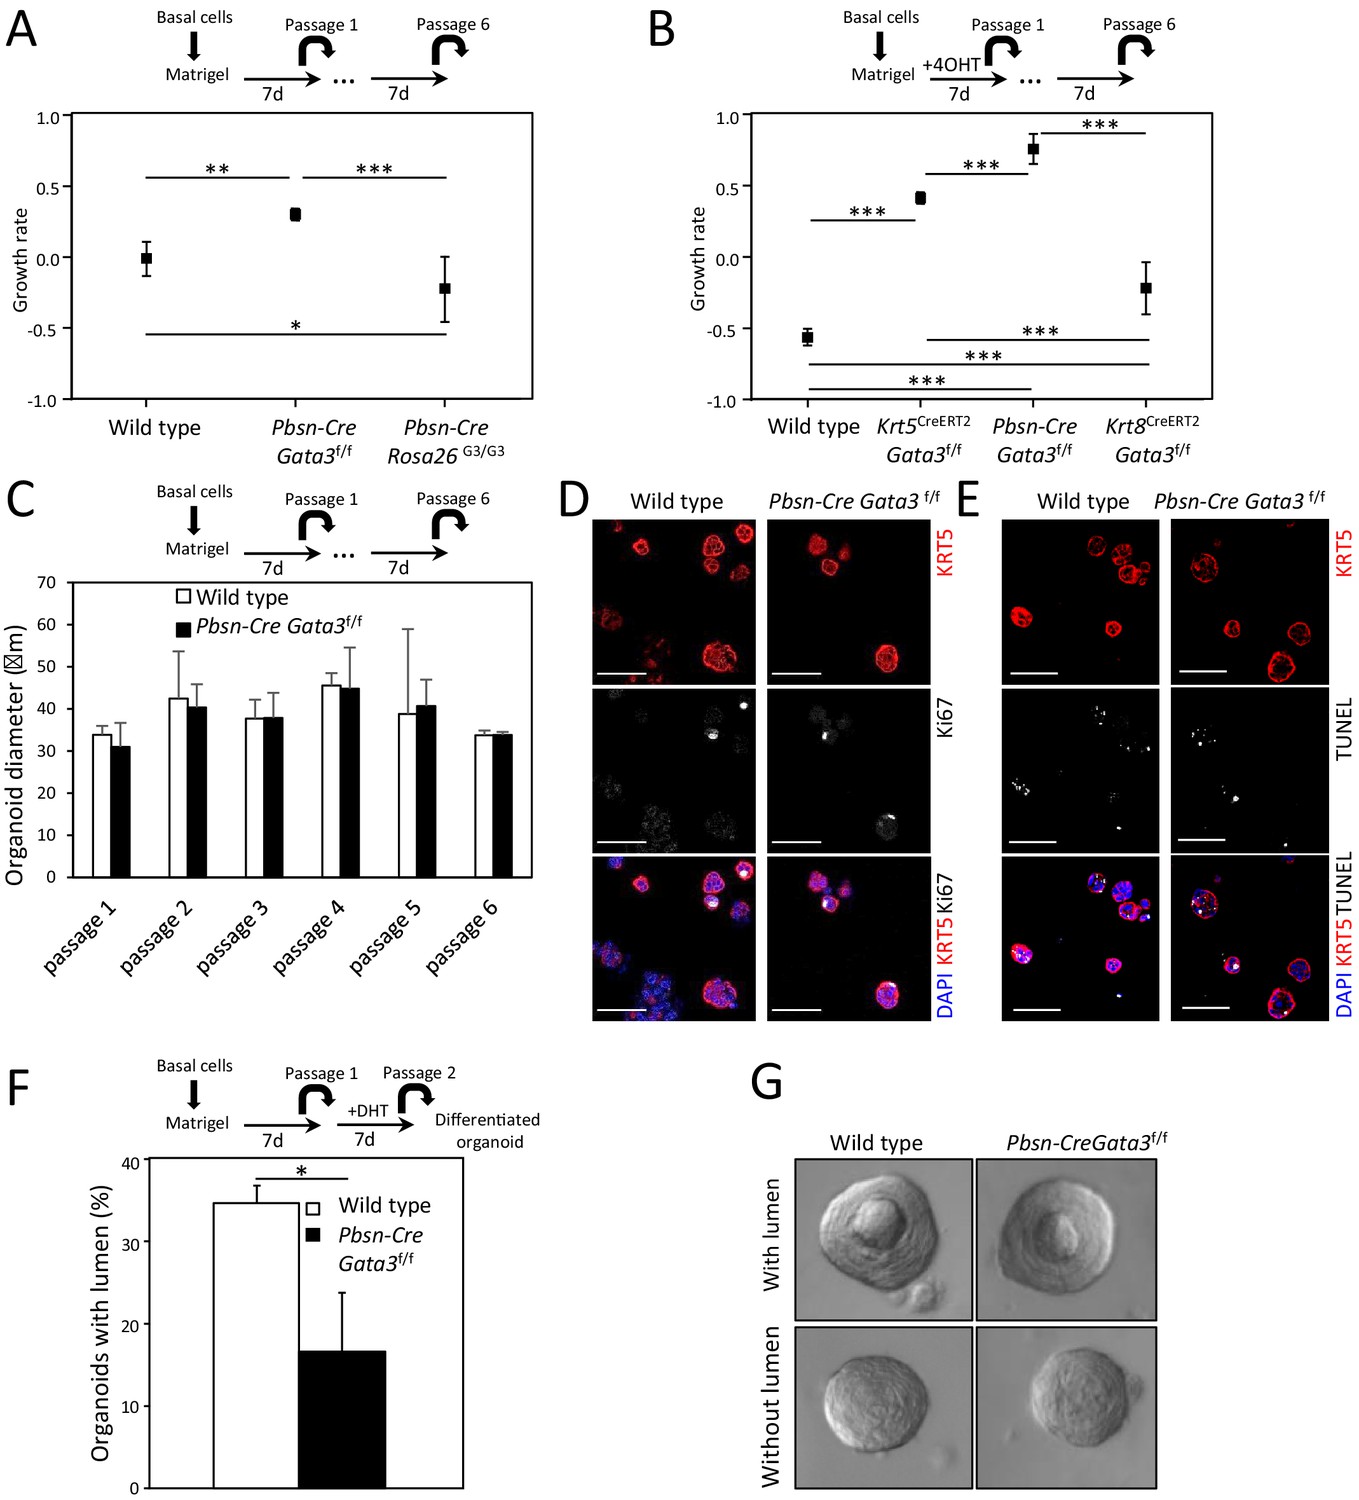
Gata3 is important for propagation and differentiation of organoids.
(A–B) Growth rate of cells upon organoid passage for the indicated genotypes calculated from nonlinear regression curve fit of data from Figure 1A and B, respectively (one-way ANOVA; *p<0.02, **p<0.002, ***p<0.0001). (C) Loss of Gata3 does not affect organoid size over several passages. Shown is the average diameter of wild type and Pbsn-Cre Gata3f/f organoids (Average ± SD). (D–E) Loss of Gata3 in organoids does not affect proliferation or survival. Immunofluorescence staining for KRT5 and Ki67 (D) and TUNEL reaction (E) was done on 4-day-old organoids at passage 2. (F–G) Gata3 loss reduces cell differentiation potential. Organoids from wild type and Pbsn-Cre Gata3f/f grown for 7 days were passaged and differentiated by dihydrotestosterone (DHT) treatment. The average percentage of organoids which form lumen (F) and representative images of organoids with and without lumen (G) for the indicated genotypes (average ± SD, n = 117, two-tailed t-test as compared to wild-type condition; *p<0.0001).
-
Figure 1—figure supplement 2—source data 1
Statistical analysis for Figure 1—figure supplement 2F.
- https://cdn.elifesciences.org/articles/54542/elife-54542-fig1-figsupp2-data1-v2.pzfx
Figure 1—figure supplement 3
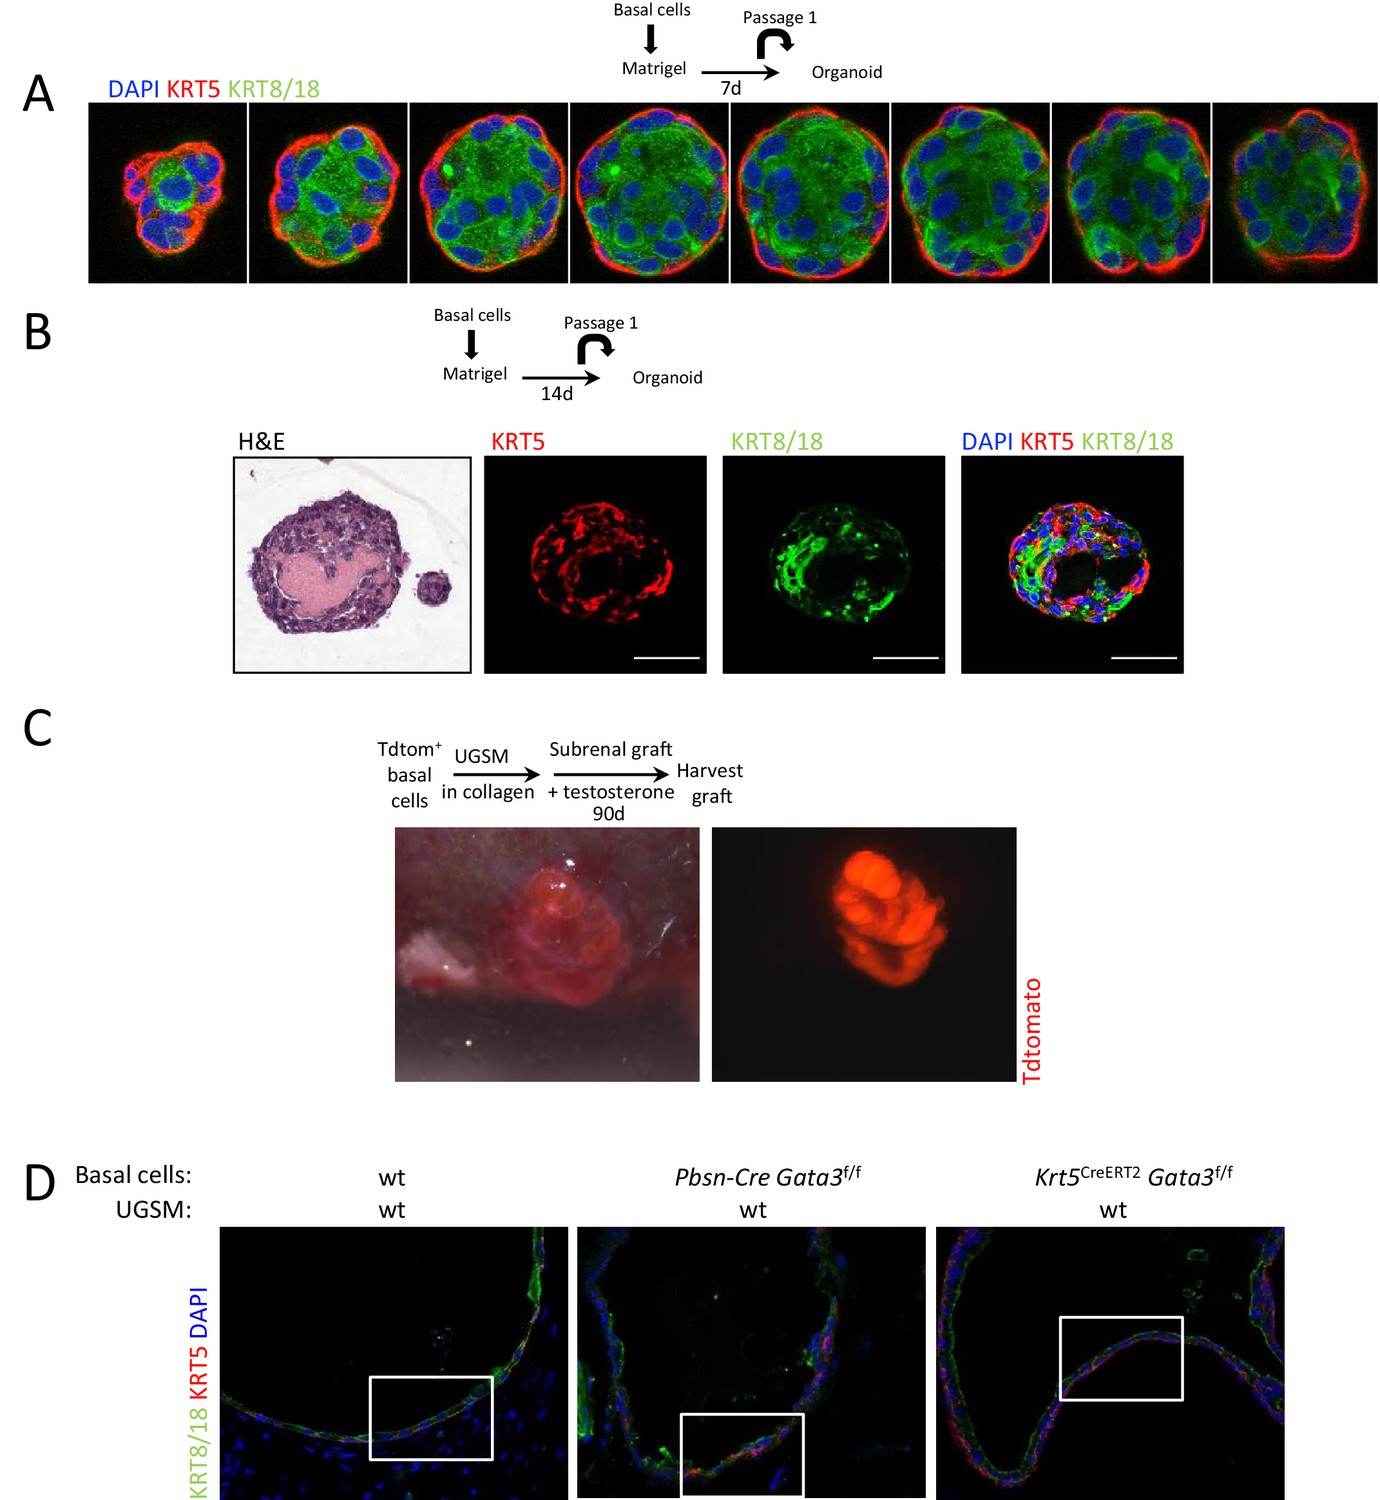
Ductal structures with multiple alveoli and a lumenized epithelial structure in allografts and organoids.
(A–B) KRT5 (basal cells) and KRT8/18 (luminal cell) expression in day 7 (A) and day 14 (B) wild-type prostate organoids. Shown is the H&E staining of a day 14 organoid. (C) TdTomato+ allograft. Purified Lin-SCA1+CD49f+EpCAM+TROP2+ basal prostate cells from Pbsn-Cre Rosa26TdTomato mice were mixed with urogenital sinus mesenchyme cells (UGSM) and transplanted under the kidney capsule of immunodeficient mice. Shown is the brightfield (left) as well as the fluorescent (right) picture of the allograft tissue after 90 days. (D) Immunofluorescence analysis of lineage specific markers KRT5 and KRT8/18 in wild type, Pbsn-Cre Gata3f/f and Krt5CreERT2Gata3f/f allografts. Lower magnification pictures of allograft from Figure 1D.
Figure 2 with 3 supplements

Bmp5 expression in organoids is regulated by Gata3.
(A) Schematic of RNA-seq strategy. mRNA was isolated from 4 days old wild type and Pbsn-Cre Gata3f/f organoids at passages P0, P2, P3 and P4. (B) Deletion of exon four in Pbsn-Cre Gata3f/f samples increases with passages. Shown are the read counts from RNAseq assigned to the Gata3 locus in samples isolated from wild type and Pbsn-Cre Gata3f/f prostate tissue at passage P0, P2, P3 or P4. (C) Venn diagram of genes differentially expressed between wild type and Pbsn-Cre Gata3f/f prostate organoids using likelihood-ratio test with q-value <0.01. (D) Heatmap of log2 transformed mRNA read counts of differentially expressed genes between wild type and Pbsn-Cre Gata3f/f organoids and whose expression pattern follows Gata3 loss with passages. (E) Bmp5 mRNA expression levels as assessed by quantitative RT-PCR in both wild type and Pbsn-Cre Gata3f/f organoids over passages. Data represent the average ± SD from three independent cDNA obtained from a pool of prostate cells from a minimum of three mice. Relative mRNA expression levels are normalized to Ppia mRNA levels (two-tailed t-test as compared to wild-type condition; *p<0.01, **p<0.005). See also Figure 2—figure supplements 1–2.
-
Figure 2—source data 1
Expression levels of differentially expressed genes between wild type and Pbsn-Cre Gata3f/f associated with Figure 2C.
- https://cdn.elifesciences.org/articles/54542/elife-54542-fig2-data1-v2.xlsx
-
Figure 2—source data 2
Expression value for Figure 2D.
- https://cdn.elifesciences.org/articles/54542/elife-54542-fig2-data2-v2.xlsx
-
Figure 2—source data 3
Statistical analysis for Figure 2E.
- https://cdn.elifesciences.org/articles/54542/elife-54542-fig2-data3-v2.pzfx
Figure 2—figure supplement 1
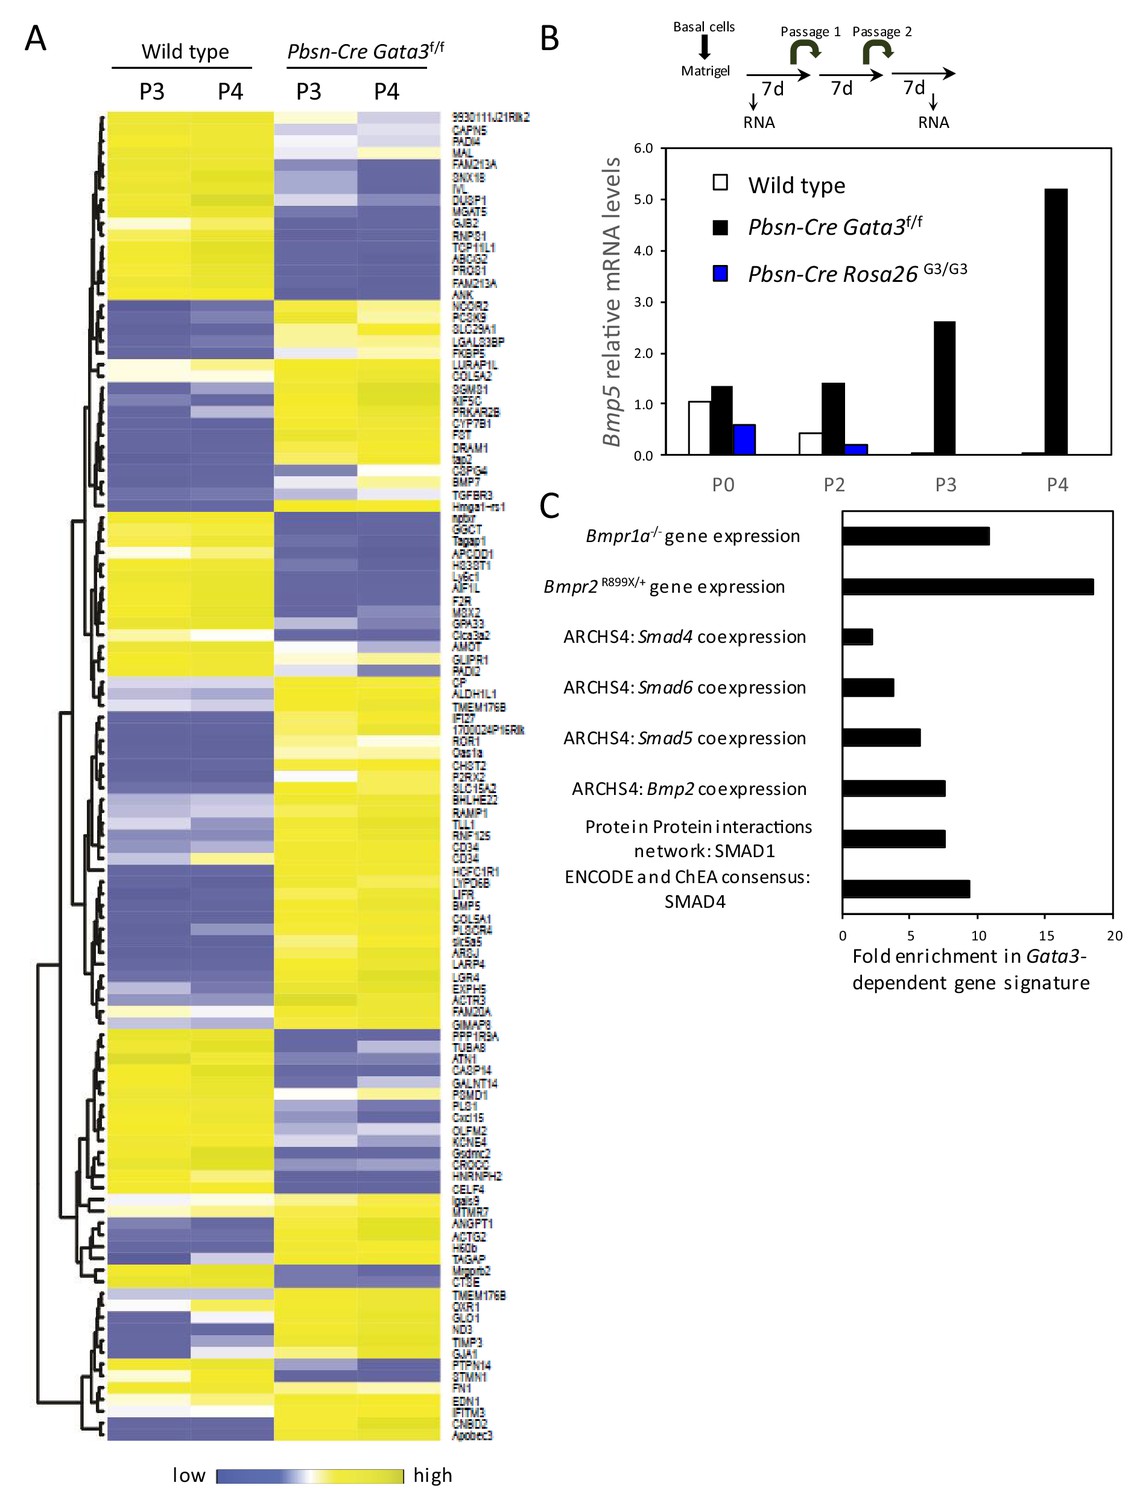
Gata3-dependent gene signature.
(A) Heatmap of log2 transformed mRNA read counts of genes differentially expressed between wild type and Pbsn-Cre Gata3f/f organoids at passages 3 and 4 using likelihood-ratio test (q-value <0.01). (B) Overexpression of GATA3 in organoids reduces Bmp5 expression. Shown is the relative expression levels of Bmp5 as assessed by RNAseq from 4-day-old organoids of the indicated passages and genotypes. Data are presented as fold expression over wild-type levels at passage 0. (C) Gata3-dependent gene signature is enriched (A) in genes associated with BMP signaling from different libraries using Enrichr software: targets computed from ENCODE and ChEA project ChIP-seq datasets (ENCODE and ChEA consensus), protein-protein interactions network (PPIs), genes coexpressed with transcription factors (ARCHS4) and genes affected by gene mutation from Gene Expression Omnibus datasets (GEO).
-
Figure 2—figure supplement 1—source data 1
Expression levels of differentially expressed genes between wild type and Pbsn-Cre Gata3f/f displayed on Figure 2—figure supplement 1A and enrichment analysis from Figure 2—figure supplement 1C.
- https://cdn.elifesciences.org/articles/54542/elife-54542-fig2-figsupp1-data1-v2.xlsx
Figure 2—figure supplement 2

Bmp5 expression is specifically affected in Gata3-deficient basal cells.
(A) The expression of Bmp5 in sorted basal, luminal and stromal cells from wild type and Pbsn-Cre Gata3f/f prostates. Relative expression levels normalized to Ppia and wild-type basal cells as assessed by quantitative RT-PCR (Average ± SD, n = 3), (two-tailed t-test as compared to wild-type condition; *p<0.0001). (B) ChIP-seq data from the Gene transcription regulation database (GTRD) showing regions of the Bmp5 (mouse, upper pannel) and BMP5 (human, lower pannel) locus bound by GATA3 protein. (C) Bmp5 locus is bound by GATA3 protein in prostate cells. Crosslinked extract from Gata3bio/bio Rosa26BirA/BirA prostate tissue were subjected to BioChIP pulldown and amplification of the indicated locus was done by quantitative PCR. Shown is the fold enrichment of streptavidin bead over Igg control beads (average ± SD, two-tailed t-test as compared to Cdh1 promoter; *p<0.001, **p<0.0001).
-
Figure 2—figure supplement 2—source data 1
Statistical analysis for Figure 2—figure supplement 2A.
- https://cdn.elifesciences.org/articles/54542/elife-54542-fig2-figsupp2-data1-v2.pzfx
-
Figure 2—figure supplement 2—source data 2
Statistical analysis for Figure 2—figure supplement 2C.
- https://cdn.elifesciences.org/articles/54542/elife-54542-fig2-figsupp2-data2-v2.xlsx
Figure 2—figure supplement 3
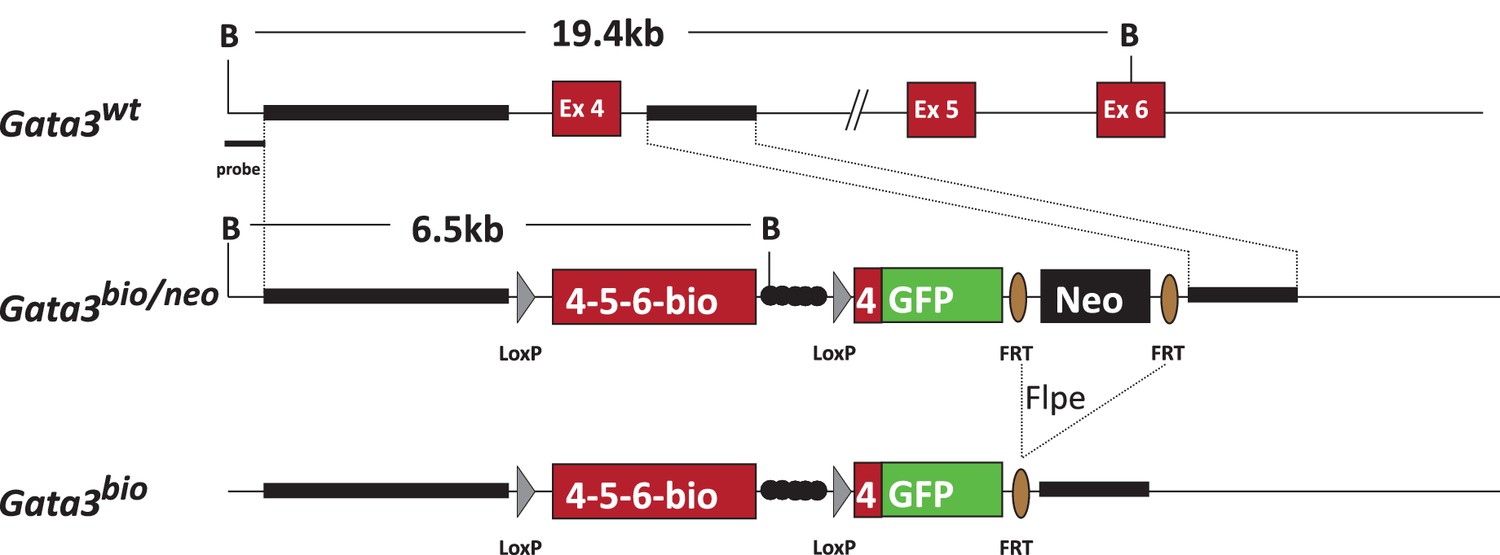
Generation strategy of Gata3bio allele.
Figure 3 with 3 supplements
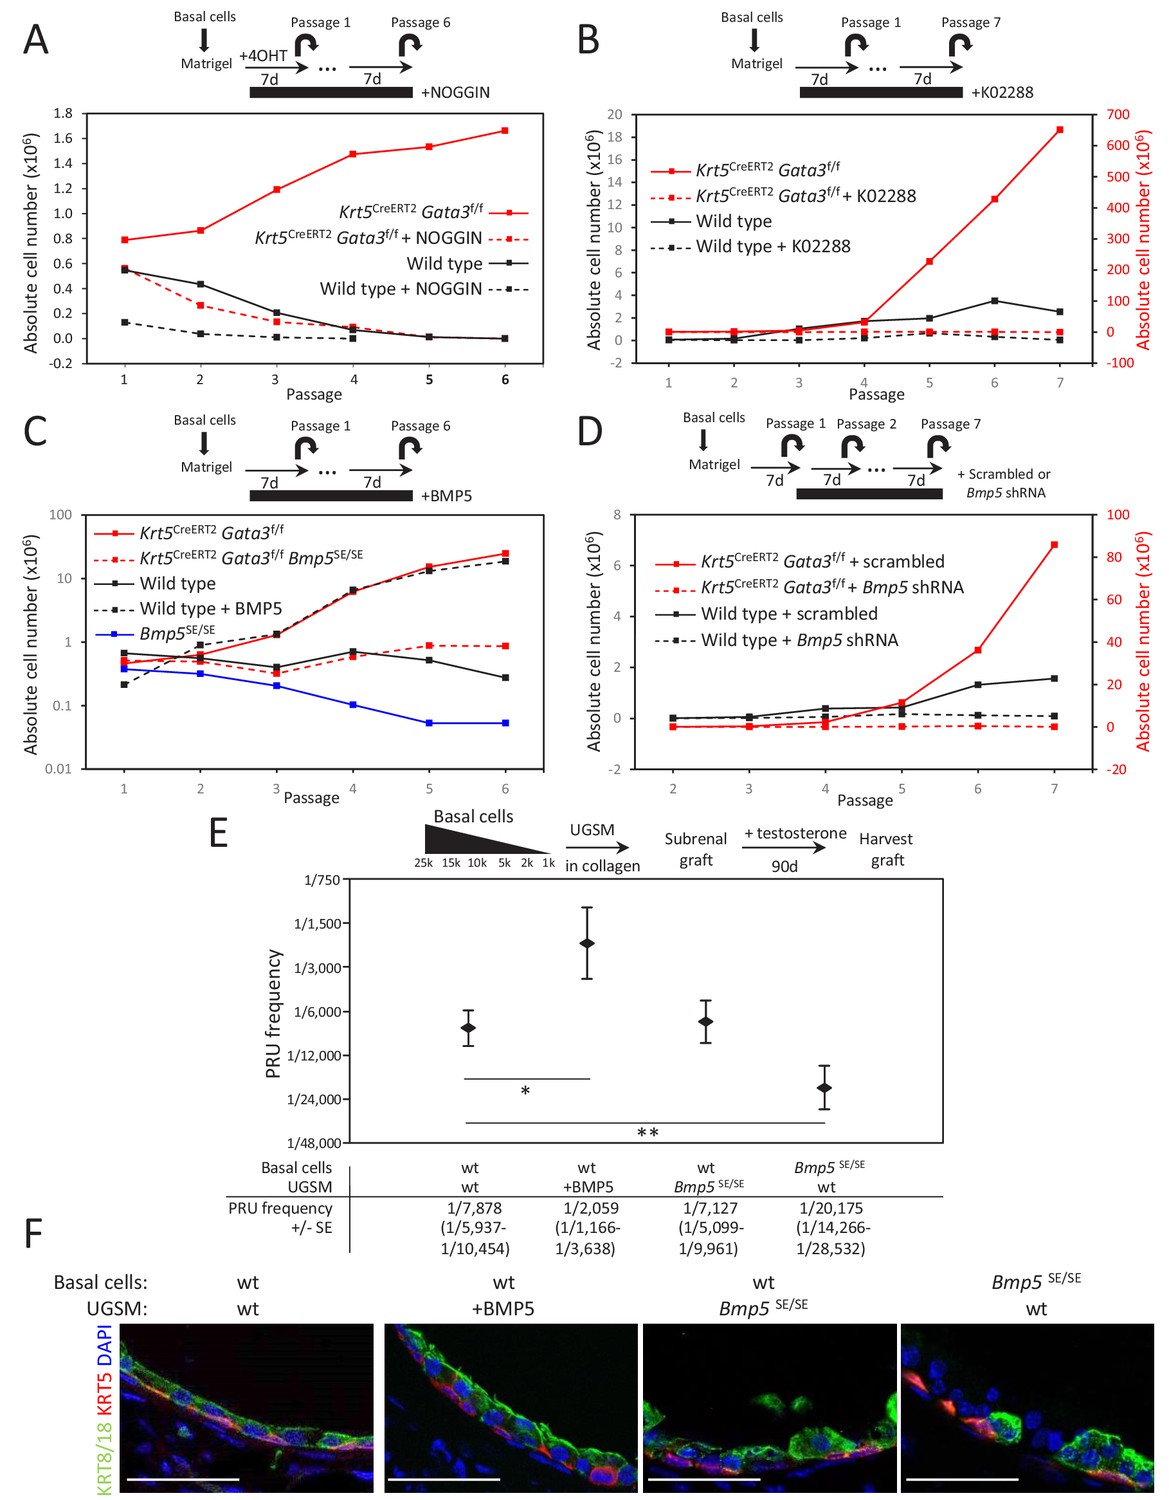
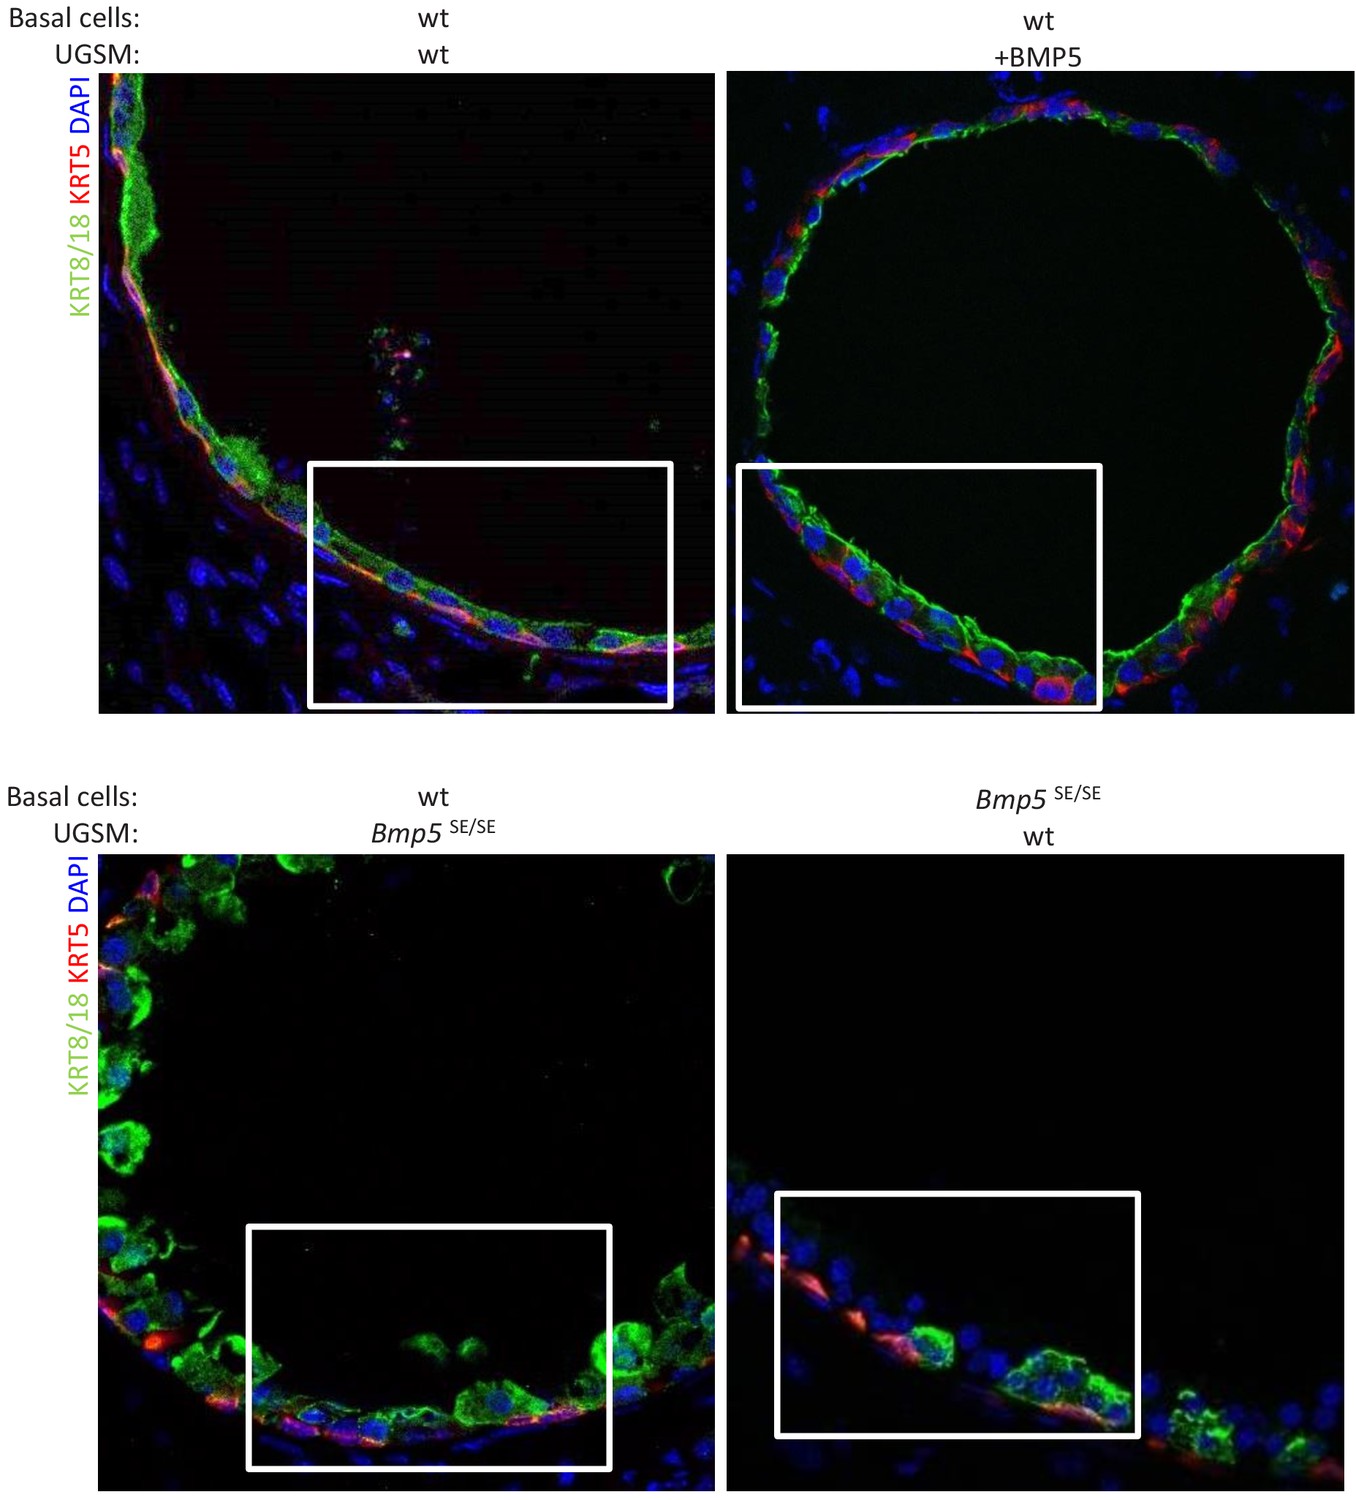
BMP5 increases the propagation potential of basal stem/progenitor cells.
(A–B) Organoid-forming capacity is abrogated by both BMP and BMPR-SMAD1/5/8 inhibitors treatment. Sorted basal cells from wild type or Krt5CreERT2Gata3f/f prostate were grown in presence or absence of NOGGIN (A) or small inhibitor K02288 (B) for six passages. Cre activity was induced by hydroxy-tamoxifen treatment in vitro for the first passage (A) or by tamoxifen injection in vivo 4 weeks prior to culture (B). Organoid-forming potential was assessed as in Figure 1A. (C) Bmp5 loss reduces organoid-forming activity in vitro, while propagation potential capacity of wild type cells is increased by BMP5 treatment. Basal cells (105) from wild type, Bmp5SE/SE, Krt5CreERT2Gata3f/f or Krt5CreERT2Gata3f/f Bmp5SE/SE mice were grown for six passages. Exogenous BMP5 was added to culture media where indicated. Cre activity was induced in vivo as in (B). (D) Bmp5 silencing specifically affects organoid-forming activity in vitro. ShRNA against Bmp5 or scrambled were electroporated in first passage organoid from wild type and Krt5CreERT2Gata3f/f basal cells and grown for seven passages. Cre activity was induced in vivo as in (B). (E) Bmp5 levels affects regenerative potential in vivo. Different numbers of sorted basal prostate cells from Rosa26LTdTomato (control) or Bmp5SE/SERosa26LTdTomato were transplanted with UGSM either wild type, ectopically expressing BMP5 or derived from Bmp5SE/SE mice. Limiting dilution analysis was done as in Figure 1C. Notice that the loss of Bmp5 in basal cells but not in UGSM affects prostate reconstituting units (PRU) frequency (two-tailed t-test as compared to wild-type condition; **p<0.02, *p<0.04). (F) Immunofluorescence of allografts show presence of prostatic ducts expressing both KRT5 and KRT8/18. Scale bar is representative of 50 μm. See also Figure 3—figure supplements 1–2.
-
Figure 3—source data 1
Statistical analysis for Figure 3A–D and Figure 3—figure supplement 2A–D.
- https://cdn.elifesciences.org/articles/54542/elife-54542-fig3-data1-v2.pzfx
-
Figure 3—source data 2
Statistical analysis for Figure 3E.
- https://cdn.elifesciences.org/articles/54542/elife-54542-fig3-data2-v2.xlsx
Figure 3—figure supplement 1
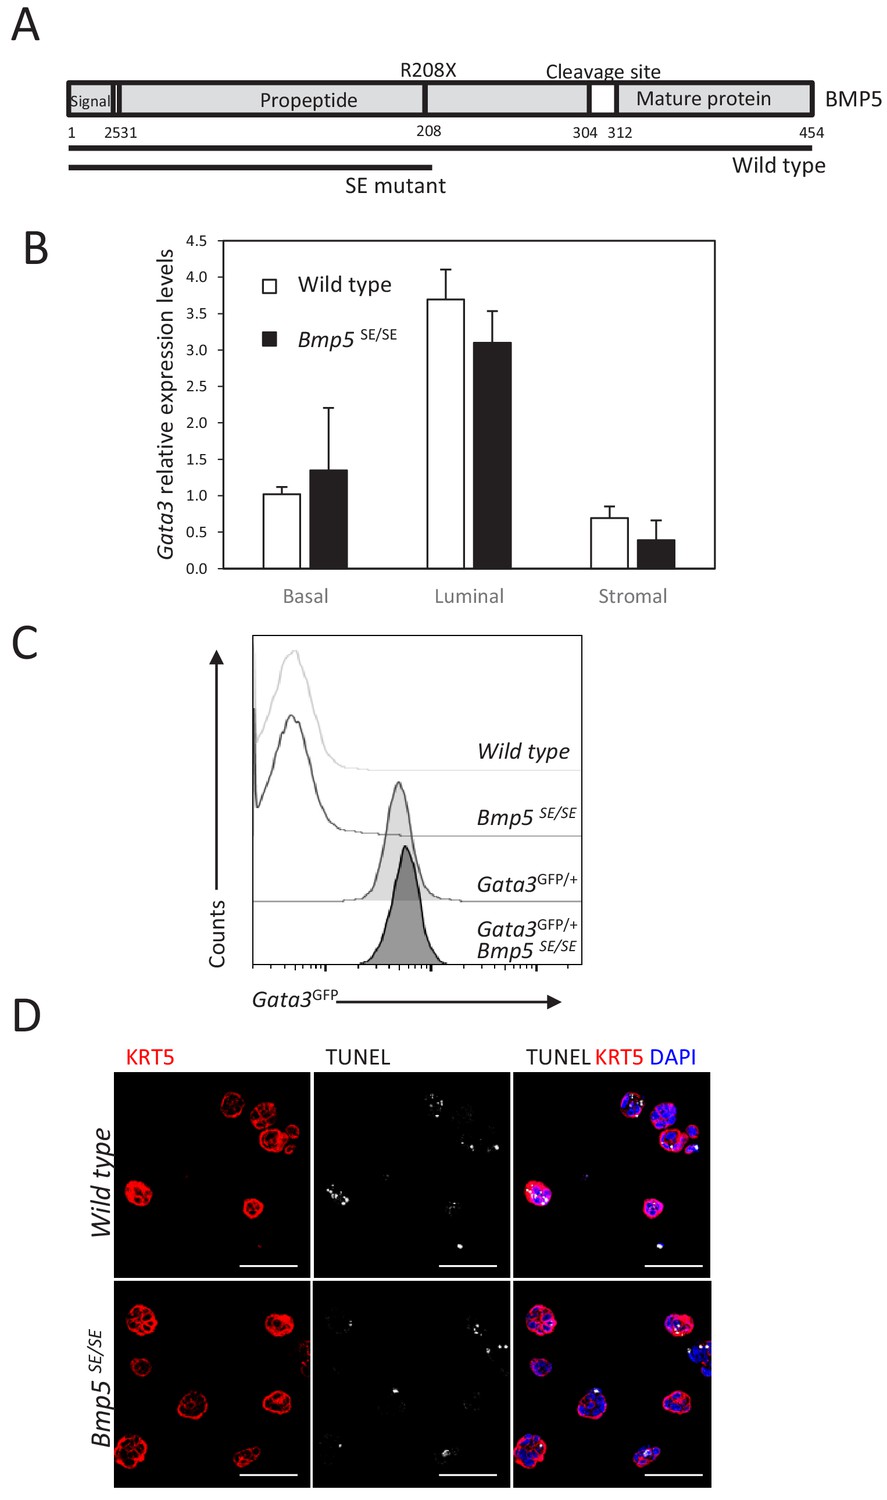
GATA3 expression is not regulated by Bmp5 expression in the prostate.
(A) Schematic of BMP5 protein showing the Small Ear (SE) mutation which lead to the introduction of an early stop codon in the propeptide region. (B) Gata3 levels are not affected by Bmp5 loss. Relative expression levels of Gata3 was normalized as in Figure 2E. (C) Representative histogram of endogenous Gata3-driven GFP reporter expression in the basal population of whole prostate from the indicated genotype. (D) Immunofluorescence staining for KRT5 and TUNEL reaction was done on wild type and Bmp5SE/SE 4-day-old organoids at passage 2. Scale bar is representative of 50 μm.
-
Figure 3—figure supplement 1—source data 1
Expression levels of Gata3 between wild type and Bmp5SE/SE associated with Figure 3—figure supplement 1B.
- https://cdn.elifesciences.org/articles/54542/elife-54542-fig3-figsupp1-data1-v2.pzfx
Figure 3—figure supplement 2
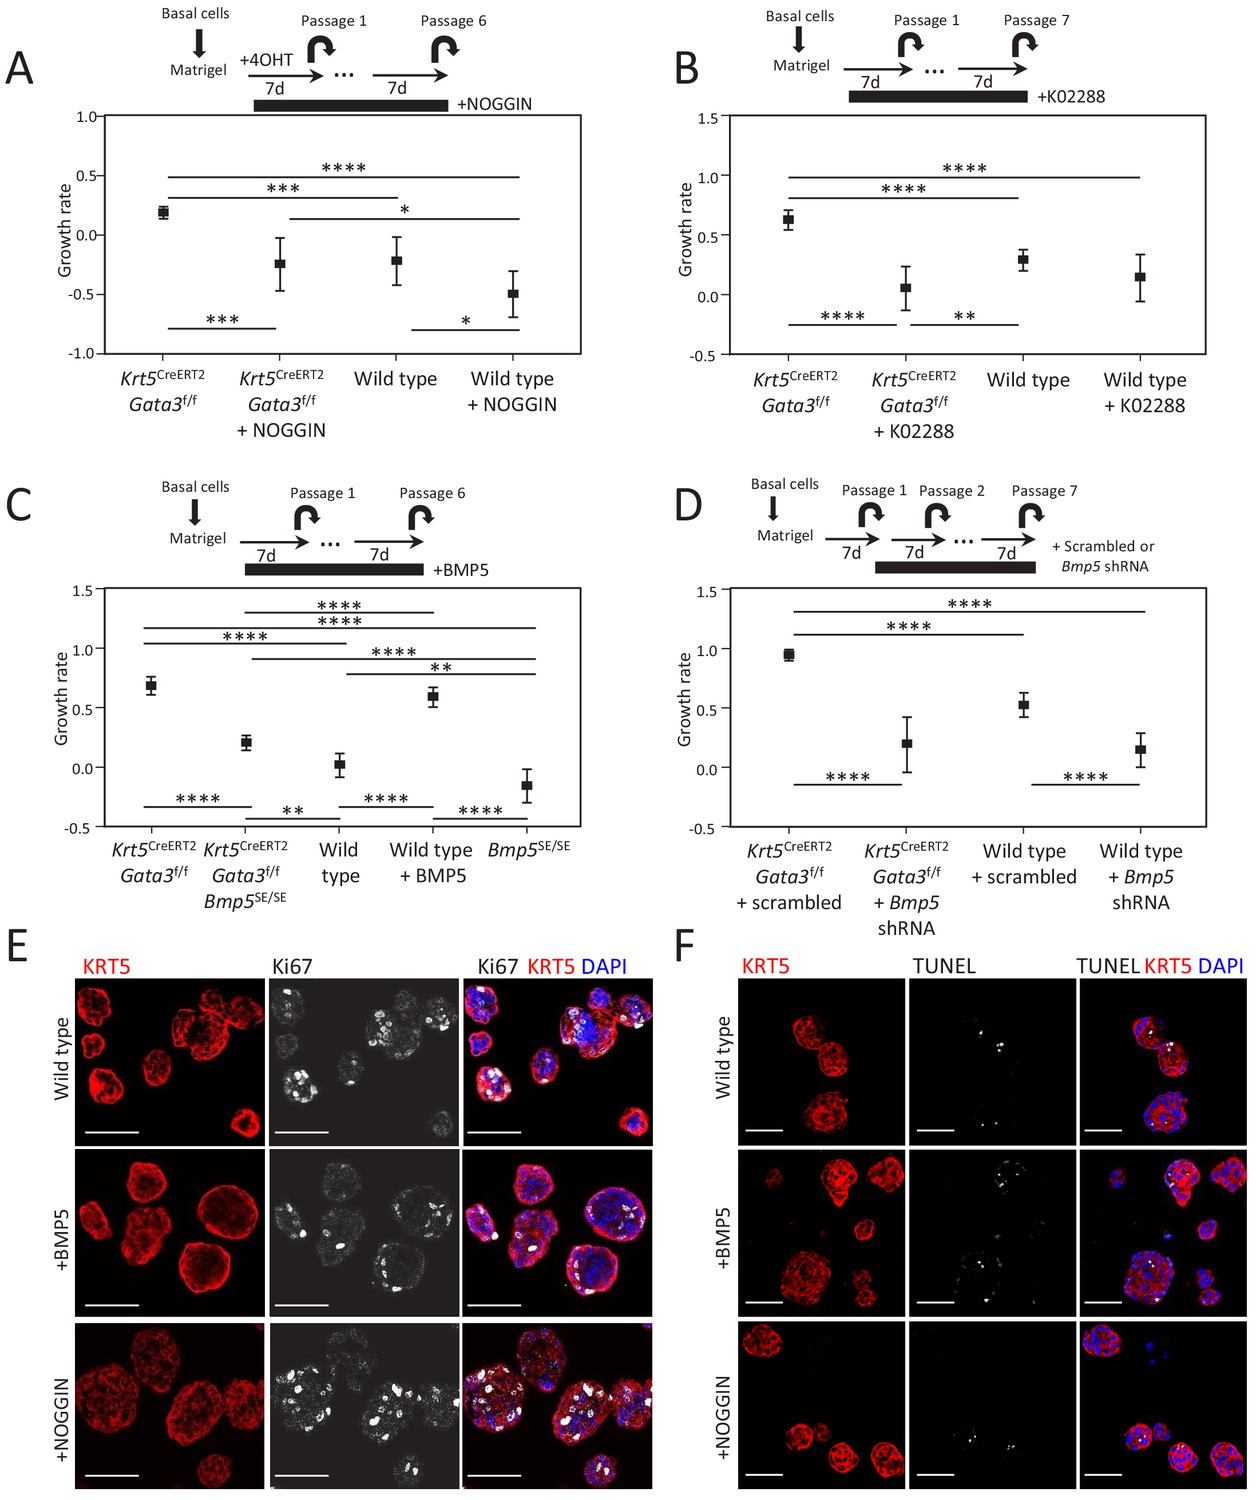
BMP5 treatment does not affect proliferation nor survival in organoid.
(A–D) Growth rate of cells upon organoid passage for the indicated genotypes and treatment calculated from nonlinear regression curve fit of data from Figure 3A–D, respectively (one-way ANOVA; *p<0.02, **p<0.005, ***p<0.0005, ****p<0.0001). (E–F) Treatment of organoids with BMP5 or NOGGIN does not affect proliferation nor apoptosis. Immunofluorescence staining for KRT5 and Ki67 (E) or TUNEL reaction (F) were done on wild-type 4-day-old organoids treated or not with BMP5 or NOGGIN at passage 2. Scale bar is representative of 50 μm.
Figure 3—figure supplement 3
Allografts form well-organized ductal structures with both basal and luminal lineages.
Immunofluorescence analysis of lineage-specific markers KRT5 and KRT8/18 in indicated allografts. Lower magnification pictures of allograft from Figure 3D.
Figure 4 with 2 supplements
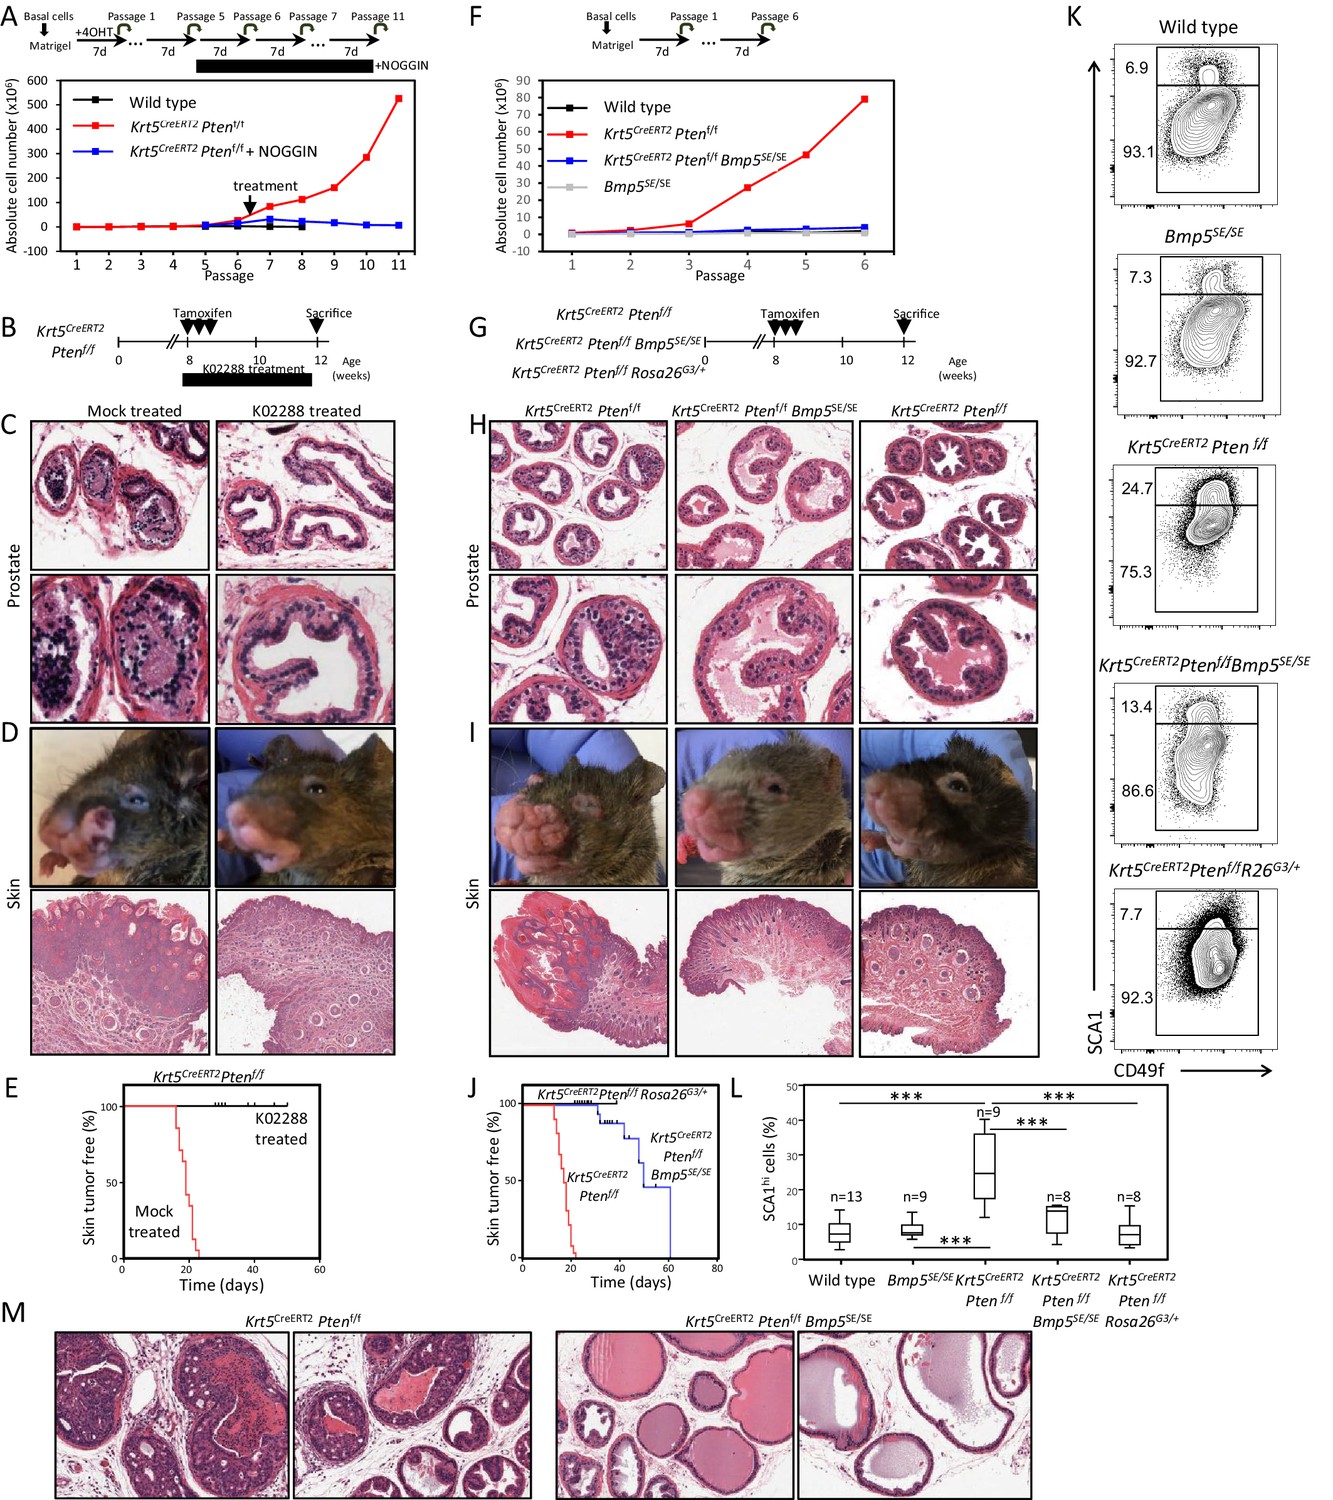
BMP inhibition reduces Pten-deficient propagation potential and inhibits skin and prostate tumor initiation.
(A) The aberrant organoid-forming capacity of Pten-deficient basal cells is abrogated by BMP inhibitor (NOGGIN) treatment. Cre activity was induced in vitro by treatment with hydroxy-tamoxifen for the first passage of organoid derived from basal cells of Krt5CreERT2Ptenf/f mice. From passage 5, organoids were cultured in presence or absence of NOGGIN. Organoid-forming potential was assessed as in Figure 1A. (B) Krt5CreERT2Ptenf/f tamoxifen-treated mice were injected with either K02288 or PBS for 4 weeks. (C–D) Representative histological sections of prostate tissue (C) and skin tissue (D) stained with H&E showing an absence of PIN and skin hyperplasia in K02288-treated as compared to mock-treated mice. (E) Kaplan-Meier skin tumor free survival curves of tamoxifen-induced Krt5CreERT2Ptenf/f treated or not with K02288 (log-rank (Mantel-Cox) test; p<0.0001, n = 7 and n = 14, respectively). Tick-marks represent sacrificed animals. (F) Bmp5 loss rescues the aberrant organoid-forming capacity of Pten-deficient basal cells. Cre activity was induced in vivo by tamoxifen injection in adult mice 4 weeks prior to organoid propagation potential assessment. (G–L) Eight-week-old mice were treated with tamoxifen and sacrificed 4 weeks later. (H–I) Bmp5 loss and Gata3 overexpression rescues Pten-deficient prostate and skin hyperplasia. Shown are representative H&E pictures of prostate (H) and skin (I) tissues. (J) Kaplan-Meier skin tumor free survival curves of tamoxifen-induced Krt5CreERT2Ptenf/f, Krt5CreERT2Ptenf/fBmp5SE/SE and Krt5CreERT2Ptenf/fRosa26G3/+ mice (log-rank (Mantel-Cox) test; p<0.0001, n = 22, n = 17 and n = 9, respectively). Tick-marks represent sacrificed animals. (K–L) Representative FACS phenotype (K) and percentage of SCA1hi cells (L) in the luminal compartment as defined by Lin(CD45, CD31, TER119)-EpCAM+CD49fMed of total prostate (one-way ANOVA; ***p<0.0001). (M) Representative H&E pictures of prostate tissues of Krt5CreERT2Ptenf/f and Krt5CreERT2Ptenf/fBmp5SE/SE mice sacrificed 9 weeks after tamoxifen treatment. See also Figure 4—figure supplements 1,2.
-
Figure 4—source data 1
Statistical analysis for Figure 4A–F and Figure 4—figure supplement 2A; Figure 4—figure supplement 2B.
- https://cdn.elifesciences.org/articles/54542/elife-54542-fig4-data1-v2.pzfx
-
Figure 4—source data 2
Statistical analysis for Figure 4E–J.
- https://cdn.elifesciences.org/articles/54542/elife-54542-fig4-data2-v2.pzfx
-
Figure 4—source data 3
Statistical analysis for Figure 4L.
- https://cdn.elifesciences.org/articles/54542/elife-54542-fig4-data3-v2.pzfx
Figure 4—figure supplement 1
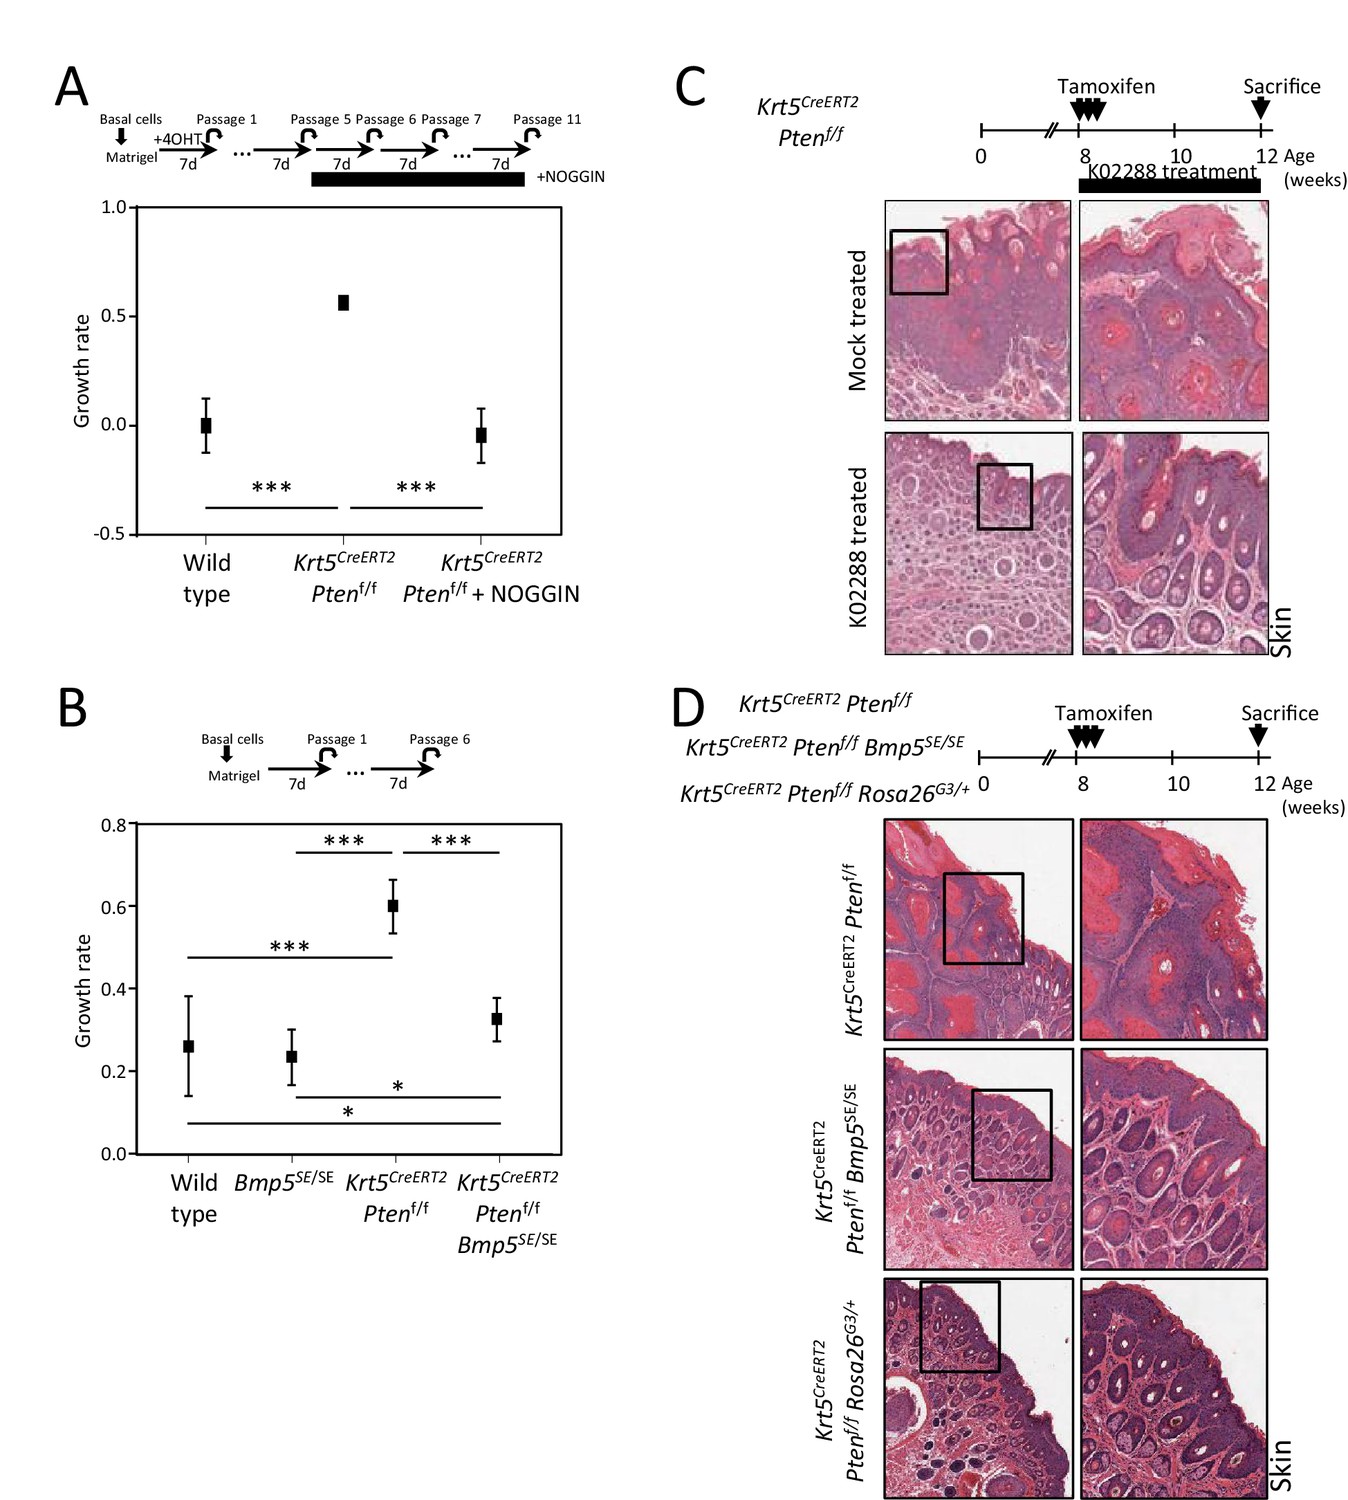
BMP inhibition corrects Pten-deficient tumor phenotypes.
(A–B) Growth rate of cells upon organoid passage for the indicated genotypes and treatment calculated from nonlinear regression curve fit of data from Figure 4A and B, respectively (one-way ANOVA; *p<0.05, **p<0.005, ***p<0.0001). (C–D) Higher magnification H&E staining pictures of skin tissue from Figure 4D and I.
Figure 4—figure supplement 2

K02288 acts downstream of AKT pathway.
(A–B) BMPR inhibition affect the growth of Pten-deficient cell lines. Shown is the growth curve (A) and protein and phosphorylation levels of AKT (B) in CaP2 and CaP8 culture treated or not with K02288 at the indicated concentration (one-way ANOVA; p<0.0001).
-
Figure 4—figure supplement 2—source data 1
Statistical analysis for Figure 4—figure supplement 2A.
- https://cdn.elifesciences.org/articles/54542/elife-54542-fig4-figsupp2-data1-v2.xlsx
-
Figure 4—figure supplement 2—source data 2
Full unedited gels for Figure 4—figure supplement 2B.
- https://cdn.elifesciences.org/articles/54542/elife-54542-fig4-figsupp2-data2-v2.pdf
Author response image 1
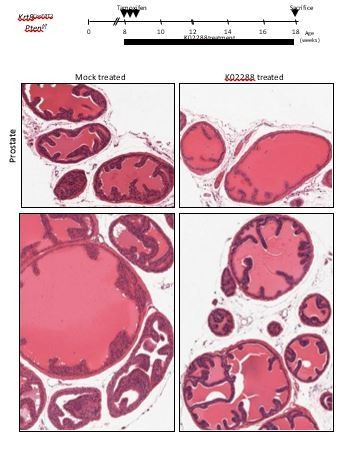
Krt8CreERT2Ptenf/f tamoxifen-treated mice were injected with either K02288 or PBS for 10 weeks.
Showed are representative histological sections of prostate tissue stained with H&E showing an absence of PIN in K02288-treated as compared to mock-treated mice.
Tables
Appendix 1—key resources table
| Reagent type (species) or resource | Designation | Source or reference | Identifiers | Additional information |
|---|---|---|---|---|
| Strain, strain background (Mus musculus) | ARR2-PB-Cre (Pbsn-Cre), C57BL/6 (Mus musculus) | Wu et al., 2001 | RRID:IMSR_JAX:026662 | (Mus musculus; male) |
| Strain, strain background (Mus musculus) | Gata3flox, C57BL/6 (Mus musculus) | Grote et al., 2006 | (Mus musculus; male) | |
| Strain, strain background (Mus musculus) | Gata3GFP, C57BL/6 (Mus musculus) | Grote et al., 2006 | (Mus musculus; male) | |
| Strain, strain background (Mus musculus) | Rosa26GATA3, C57BL/6 (Mus musculus) | Grote et al., 2006 | (Mus musculus; male) | |
| Strain, strain background (Mus musculus) | Gata3bio, C57BL/6 (Mus musculus) | Dr. Busslinger, IMP, Vienna | (Mus musculus; male) | |
| Strain, strain background (Mus musculus) | Rosa26BirA, C57BL/6 (Mus musculus) | Wood et al., 2016 | RRID:IMSR_JAX:010920 | (Mus musculus; male) |
| Strain, strain background (Mus musculus) | Krt5CreERT2, C57BL/6 (Mus musculus) | Van Keymeulen et al., 2011 | RRID:IMSR_JAX:029155 | (Mus musculus; male) |
| Strain, strain background (Mus musculus) | Krt8CreERT2, C57BL/6 (Mus musculus) | Choi et al., 2012 | (Mus musculus; male) | |
| Strain, strain background (Mus musculus) | Rosa26LstopLTdTomato, C57BL/6 (Mus musculus) | Madisen et al., 2010 | RRID:IMSR_JAX:007909 | (Mus musculus; male) |
| Strain, strain background (Mus musculus) | Ptenflox , C57BL/6 (Mus musculus) | Trotman et al., 2003 | (Mus musculus; male) | |
| Strain, strain background (Mus musculus) | Bmp5SE, C57BL/6 (Mus musculus) | Kingsley et al., 1992 | RRID:IMSR_JAX:000056 | (Mus musculus; male) |
| Strain, strain background (Mus musculus) | SCID-beige, C57BL/6 (Mus musculus) | Charles River | (Mus musculus; male) | |
| Cell line (Mus musculus) | CaP2 (Mus musculus) | Jiao et al., 2007 | male prostate | |
| Cell line (Mus musculus) | CaP8 (Mus musculus) | Jiao et al., 2007 | male prostate | |
| Transfected construct (Human) | BMP5_TRC3 LentiORF puromycin V5 (pLX317) (human) | Sigma-Aldrich | TRCN0000472902 | mouse UGSM |
| Transfected construct (Human) | TRC3 LentiORF puromycin V5 (pLX317) empty (human) | Sigma-Aldrich | mouse UGSM | |
| Antibody | CD45 (30-F11; rat monoclonal) | Biolegend | (1/500) | |
| Antibody | TER119 (TER-119; rat monoclonal) | Biolegend | (1/1,000) | |
| Antibody | CD31 (MEC13; rat monoclonal) | Biolegend | (1/1,000) | |
| Antibody | CD49f (GoH3; rat monoclonal) | Biolegend | (1/2,000) | |
| Antibody | EpCAM (G8.8; rat monoclonal) | Biolegend | (1/500) | |
| Antibody | SCA1 (D7; rat monoclonal) | Biolegend | (1/500) | |
| Antibody | TROP2 (goat polyclonal) | R&D | (1/100) | |
| Antibody | KRT5 (chicken polyclonal) | Biolegend | 905901 | (1/500) |
| Antibody | KRT8/18 (guinea pig polyclonal) | Fitzgerald | 20R-CP004 | (1/200) |
| Antibody | GATA3 (H-48; rabbit polyclonal) | SantaCruz | sc-9009 | (1/100) |
| Antibody | Ki67 (SolA15, rat monoclonal) | eBioscience | 14-5698-82 | (1/200) |
| Antibody | pAKT S473 (rabbit monoclonal) | CST | 4060 | (1/500) |
| Antibody | AKT (rabbit polyclonal) | CST | 9272 | (1/500) |
| Antibody | α-TUBULIN (DM1A; mouse monoclonal) | Sigma | T9026 | (1/2000) |
| Antibody | IRDye 800CW Donkey anti-Rabbit IgG | licor | 926-32213 | (1/10,000) |
| Antibody | IRDye 680RD Donkey anti-Mouse IgG | licor | 926-68072 | (1/10,000) |
| Recombinant DNA reagent | MISSION pLKO.1-Puro shRNA scrambled (mouse) | Sigma-Aldrich | ||
| Recombinant DNA reagent | MISSION pLKO.1-Puro shRNA Bmp5 (mouse) | Sigma-Aldrich | TRCN0000065609 | |
| Recombinant DNA reagent | MISSION pLKO.1-Puro shRNA Bmp5 (mouse) | Sigma-Aldrich | TRCN0000065610 | |
| Recombinant DNA reagent | MISSION pLKO.1-Puro shRNA Bmp5 (mouse) | Sigma-Aldrich | TRCN0000065611 | |
| Sequence-based reagent | Bmp5_Fw | Sigma-Aldrich | TTACTTAGGGGTATTGTGGGCT | |
| Sequence-based reagent | Bmp5_Rv | Sigma-Aldrich | CCGTCTCTCATGGTTCCGTAG | |
| Sequence-based reagent | Gata3_Fw | Sigma-Aldrich | GTGGTCACACTCGGATTCCT | |
| Sequence-based reagent | Gata3_Rv | Sigma-Aldrich | GCAAAAAGGAGGGTTTAGGG | |
| Sequence-based reagent | Krt5_Fw | Sigma-Aldrich | GAGATCGCCACCTACAGGAA | |
| Sequence-based reagent | Krt5_Rv | Sigma-Aldrich | TCCTCCGTAGCCAGAAGAGA | |
| Sequence-based reagent | Krt14_Fw | Sigma-Aldrich | CCTCTGGCTCTCAGTCATCC | |
| Sequence-based reagent | Krt14_Rv | Sigma-Aldrich | TGAGCAGCATGTAGCAGCTT | |
| Sequence-based reagent | Krt18_Fw | Sigma-Aldrich | ACTCCGCAAGGTGGTAGATGA | |
| Sequence-based reagent | Krt18_Rv | Sigma-Aldrich | TCCACTTCCACAGTCAATCCA | |
| Sequence-based reagent | Krt8_Fw | Sigma-Aldrich | CAAGGTGGAACTAGAGTCCCG | |
| Sequence-based reagent | Krt8_Rv | Sigma-Aldrich | CTCGTACTGGGCACGAACTTC | |
| Sequence-based reagent | Trp63_Fw | Sigma-Aldrich | AGCAGCAAGTATCGGACAGC | |
| Sequence-based reagent | Trp63_Rv | Sigma-Aldrich | CGTCTCACGACCTCTCACTG | |
| Sequence-based reagent | Ly6a_Fw | Sigma-Aldrich | CCATCAATTACCTGCCCCTA | |
| Sequence-based reagent | Ly6a_Rv | Sigma-Aldrich | GGCAGATGGGTAAGCAAAGA | |
| Sequence-based reagent | Itga6_Fw | Sigma-Aldrich | CGCTGCTGCTCAGAATATCA | |
| Sequence-based reagent | Itga6_Rv | Sigma-Aldrich | AAGAACAGCCAGGAGGATGA | |
| Sequence-based reagent | Epcam_Fw | Sigma-Aldrich | GCTGTCATTGTGGTGGTGTC | |
| Sequence-based reagent | Epcam_Rv | Sigma-Aldrich | CACGGCTAGGCATTAAGCTC | |
| Sequence-based reagent | Ppia_Fw | Sigma-Aldrich | GTGCCAGGGTGGTGACTTTACACG | |
| Sequence-based reagent | Ppia_Rv | Sigma-Aldrich | TCCCAAAGACCACATGCTTGCCA | |
| Sequence-based reagent | Bactin_Fw | Sigma-Aldrich | TTGCTGACAGGATGCAGAAGGAGA | |
| Sequence-based reagent | Bactin_Rv | Sigma-Aldrich | ACTCCTGCTTGCTGATCCACATCT | |
| Sequence-based reagent | Bmp5_prom_Fw-8450 | Sigma-Aldrich | TCGGGTGGACCAGATTTAAG | |
| Sequence-based reagent | Bmp5_prom_Rv-8390 | Sigma-Aldrich | CAGCCATTCACGAAGTTCTCT | |
| Sequence-based reagent | Bmp5_prom_Fw-5942 | Sigma-Aldrich | TGAAAGTGGAGATGGGGAAG | |
| Sequence-based reagent | Bmp5_prom_Rv-5827 | Sigma-Aldrich | CCCAGTTTTGGAGGTTCAGA | |
| Sequence-based reagent | Bmp5_prom_Fw+11268 | Sigma-Aldrich | AAAGGGAAAAGTGCTCACCA | |
| Sequence-based reagent | Bmp5_prom_Rv+11312 | Sigma-Aldrich | TCCTCCCTCAGCTCAAAGAA | |
| Sequence-based reagent | Bmp5_prom_Fw+11859 | Sigma-Aldrich | TTGGAAGAGTTCCGATGAGG | |
| Sequence-based reagent | Bmp5_prom_Rv+11947 | Sigma-Aldrich | CAGAGTGGGTGGCAACTTCT | |
| Sequence-based reagent | Bmp5_prom_Fw+24561 | Sigma-Aldrich | GTGAGGTGGCTCAGCATGTA | |
| Sequence-based reagent | Bmp5_prom_Rv+24607 | Sigma-Aldrich | CCAGGGATGGATCTCAGGT | |
| Sequence-based reagent | Cyp19a1_prom-322_Fw | Sigma-Aldrich | GCAAATGCTGCTGATGAAAT | |
| Sequence-based reagent | Cyp19a1_prom-207_Rv | Sigma-Aldrich | ACCTTATCATCTCGCCCTTG | |
| Sequence-based reagent | Cdh1_prom-175_Fw | Sigma-Aldrich | GAACGACCGTGGAATAGGAA | |
| Sequence-based reagent | Cdh1_prom-98_Rv | Sigma-Aldrich | TCCTCCACCCCTGTCTGTAG | |
| Sequence-based reagent | R26wt_geno_Fw | Sigma-Aldrich | AAGGGAGCTGCAGTGGAGTA | |
| Sequence-based reagent | R26wt_geno_Rv | Sigma-Aldrich | CCGAAAATCTGTGGGAAGTC | |
| Sequence-based reagent | R26Tomato_Fw | Sigma-Aldrich | CCCCGTAATGCAGAAGAAGA | |
| Sequence-based reagent | R26Tomato_Rv | Sigma-Aldrich | GAGGTGATGTCCAGCTTGGT | |
| Sequence-based reagent | Bmp5wt_geno_Fw | Sigma-Aldrich | TAAGGACAAGGGAAACCCTC | |
| Sequence-based reagent | Bmp5SE_geno_Fw | Sigma-Aldrich | TAAGGACAAGGGAAACCCTT | |
| Sequence-based reagent | Bmp5_geno_Rv | Sigma-Aldrich | GAACCATTTCACCAGCTCCT | |
| Sequence-based reagent | Rosa26Gata3-wt_geno_Fw | Sigma-Aldrich | AAAGTCGCTCTGAGTTGTTAT | |
| Sequence-based reagent | Rosa26Gata3_geno_Rv | Sigma-Aldrich | GCGAAGAGTTTGTCCTCAACC | |
| Sequence-based reagent | Rosa26wt_geno_Rv | Sigma-Aldrich | GGAGCGGGAGAAATGGATATG | |
| Sequence-based reagent | Gata3_flox_geno_Fw | Sigma-Aldrich | GTCAGGGCACTAAGGGTTGTT | |
| Sequence-based reagent | Gata3_flox_geno_Rv | Sigma-Aldrich | TGGTAGAGTCCGCAGGCATTG | |
| Sequence-based reagent | Gata3GFP_geno_Fw | Sigma-Aldrich | GGCCTACCCGCTTCCATTGCT | |
| Sequence-based reagent | Gata3GFP_geno_Rv | Sigma-Aldrich | TATCAGCGGTTCATCTACAGC | |
| Sequence-based reagent | Pten_flox-wt_geno_Fw | Sigma-Aldrich | AAAAGTTCCCCTGCTGATGATTTGT | |
| Sequence-based reagent | Pten_flox-wt_geno_Rv | Sigma-Aldrich | TGTTTTTGACCAATTAAAGTAGGCTG | |
| Sequence-based reagent | Cre_geno_Fw | Sigma-Aldrich | AGGTGTAGAGAAGGCACTTAGC | |
| Sequence-based reagent | Cre_geno_Rv | Sigma-Aldrich | CTAATCGCCATCTTCCAGCAGG | |
| Peptide, recombinant protein | EGF | Peprotech | 315-09 | 10 ng/ml |
| Peptide, recombinant protein | hBMP5 | Aviscera Bioscience | 00013-01-100 | 50 ng/ml |
| Peptide, recombinant protein | hNOGGIN | RayBiotech | 230-00704-100 | 180 ng/ml |
| Peptide, recombinant protein | Collagenase/hyaluronidase | Stemcell Technologies | . 07912 | |
| Peptide, recombinant protein | dispase II | Roche | 4942078001 | (5 U/ml) |
| Peptide, recombinant protein | DNase I | Roche | 11284932001 | 0.1 mg/ml |
| Peptide, recombinant protein | matrigel | Corning | CACB354234 | |
| Peptide, recombinant protein | BPE | Life technologies | 13028014 | 25 ug/ml |
| Peptide, recombinant protein | b27 SUPPLEMENT | Life technologies | 17504044 | |
| Peptide, recombinant protein | collagenase A | Bioshop | COL004 | |
| Peptide, recombinant protein | fibronectin | Sigma-Aldrich | 11051407001 | |
| Peptide, recombinant protein | collagen type I | Corning | 354236 | |
| Peptide, recombinant protein | proteinase K | biobasic | PB0451 | |
| Peptide, recombinant protein | RNase A | Roche | 10109169001 | |
| Commercial assay or kit | In Situ Cell Death Detection Kit | Roche | 12156792910 | |
| Commercial assay or kit | P1 Primary Cell 4D-Nucleofector Kit | Bioscience | V4XP-1024 | |
| Commercial assay or kit | RNeasy micro kit | Qiagen | 74004 | |
| Commercial assay or kit | Green-2-go mastermix | BioBasic | QPCR004 | |
| Commercial assay or kit | TruSeq Stranded Total RNA Sample Preparation Kit | Illumina | ||
| Chemical compound, drug | tamoxifen | Toronto Research Chemicals | T006000 | 3 mg |
| Chemical compound, drug | K02288 | AdooQ Bioscience | A14311 | 10 uM |
| Chemical compound, drug | Y-27632 | ApexBio | A3008 | 10 uM |
| Chemical compound, drug | 4-hydroxy-tamoxifen | Toronto Research Chemicals | H954725 | 500 ng/ml |
| Chemical compound, drug | 5α-dihydrotestosterone | steraloids | A2570-000 | 1nM |
| Chemical compound, drug | phosphatase inhibitor cocktails (Phostop) | Sigma | 4906845001 | |
| Chemical compound, drug | Fixable Viability Dye eFluor 780 | ebioscience | 65-0865-18 | |
| Software, algorithm | Prism 6.0 | GraphPad | ||
| Software, algorithm | ImageJ | Fiji | ||
| Software, algorithm | FlowJo | LLC | ||
| Software, algorithm | DIVA | BD Biosciences | ||
| Software, algorithm | L-calc | Stem cell technologies | ||
| Software, algorithm | matrix2png program | Pavlidis and Noble, 2003 |
Additional files
Download links
A two-part list of links to download the article, or parts of the article, in various formats.
Downloads (link to download the article as PDF)
Open citations (links to open the citations from this article in various online reference manager services)
Cite this article (links to download the citations from this article in formats compatible with various reference manager tools)
Regulation of stem/progenitor cell maintenance by BMP5 in prostate homeostasis and cancer initiation
eLife 9:e54542.
https://doi.org/10.7554/eLife.54542


