Asymmetric clustering of centrosomes defines the early evolution of tetraploid cells
- Department of Biological Sciences and Fralin Life Sciences Institute, Virginia Tech, United States
Figures
Figure 1 with 1 supplement
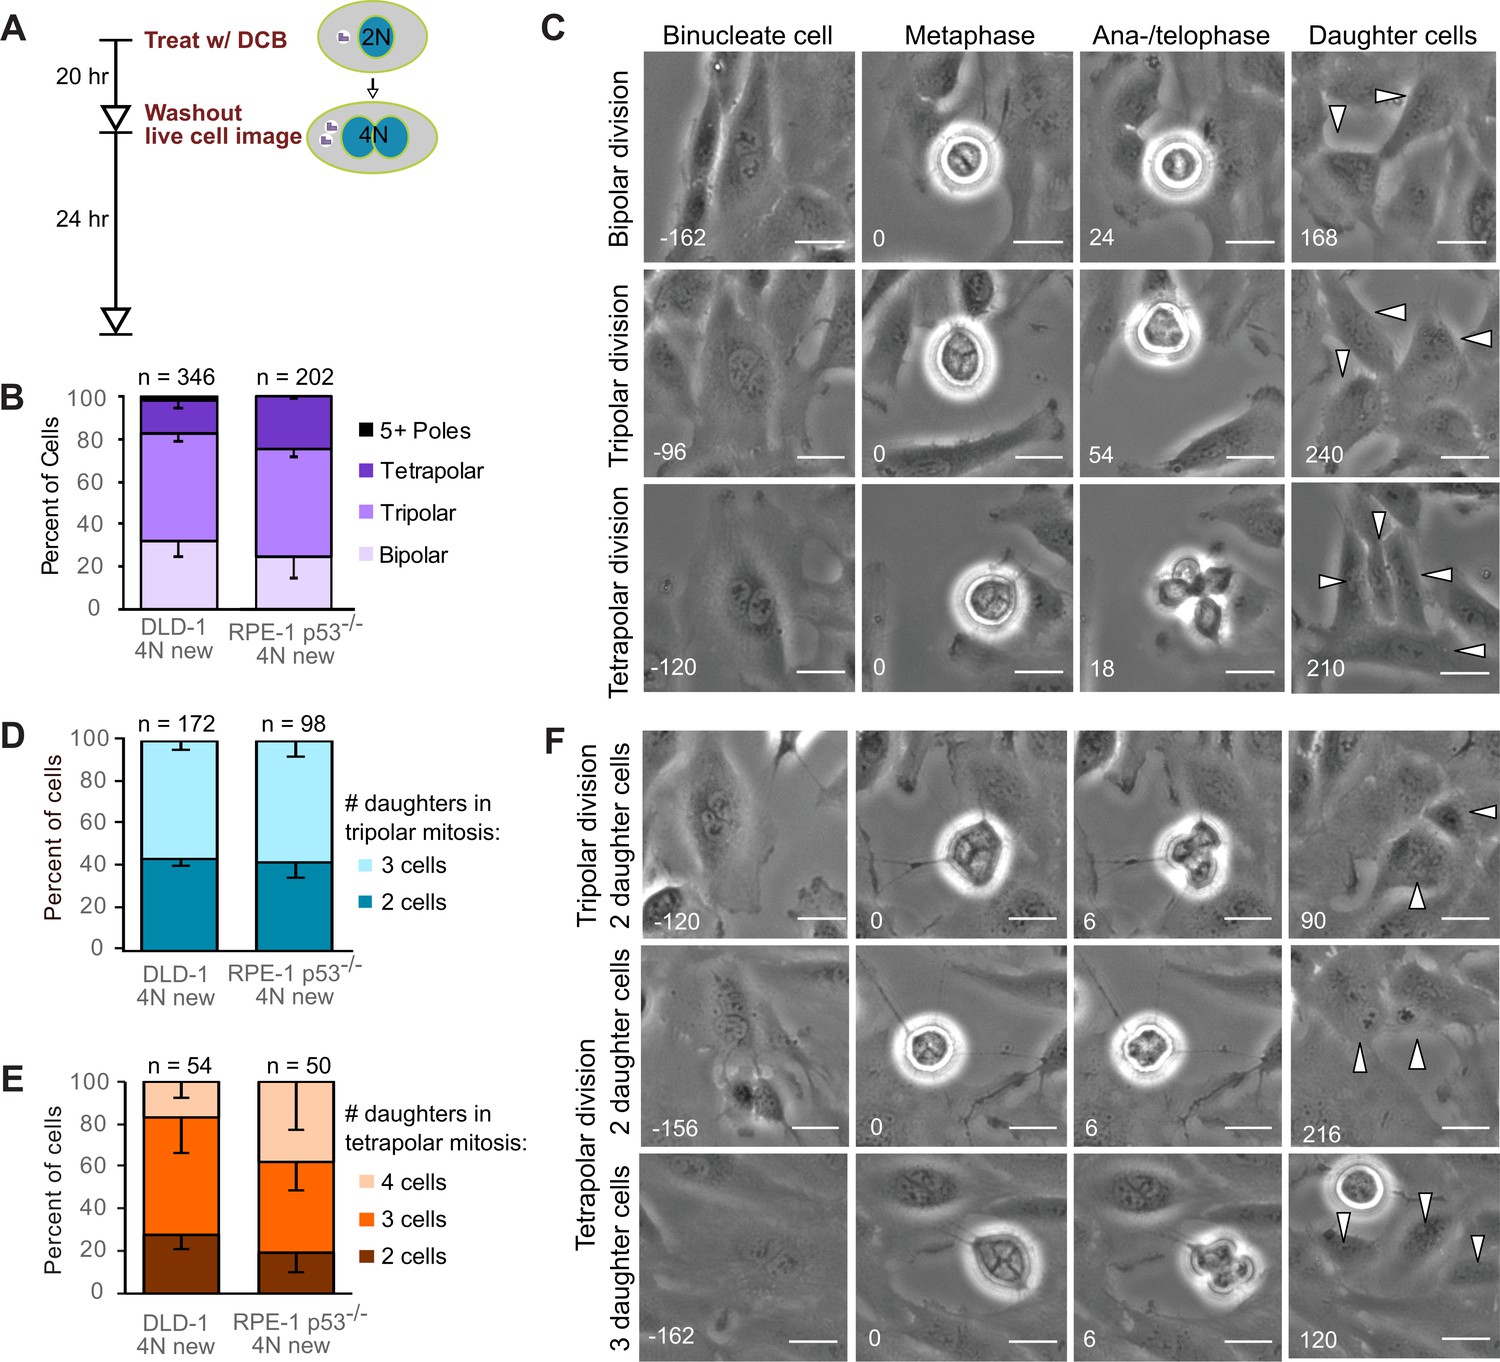
Newly formed tetraploid cells undergo diverse fates in their first mitotic division.
(A) Experimental design for generation of newly formed tetraploid cells, followed by live cell imaging. DCB, dihydrocytochalasin B. (B) Quantification of the types of division observed in the first cell division of newly formed tetraploid cells; characterization was performed at ana-/telophase. (C) Examples of bipolar (top), tripolar (middle), and tetrapolar (bottom) divisions. (D–E) Quantification of incomplete cytokinesis in tripolar (D) and tetrapolar (E) divisions; n-values represent the number of tripolar and tetrapolar mitoses that displayed incomplete cytokinesis out of all the cells analyzed in B). (F) Examples of multipolar divisions with incomplete cytokinesis such that multiple anaphase poles are incorporated into a single daughter cell. Error bars in all graphs represent S.E.M. from three independent experiments. All scale bars, 25 µm. Arrowheads in all images point to individual daughter cells.
-
Figure 1—source data 1
Source data for Figure 1B,D,E.
- https://cdn.elifesciences.org/articles/54565/elife-54565-fig1-data1-v2.xlsx
Figure 1—figure supplement 1
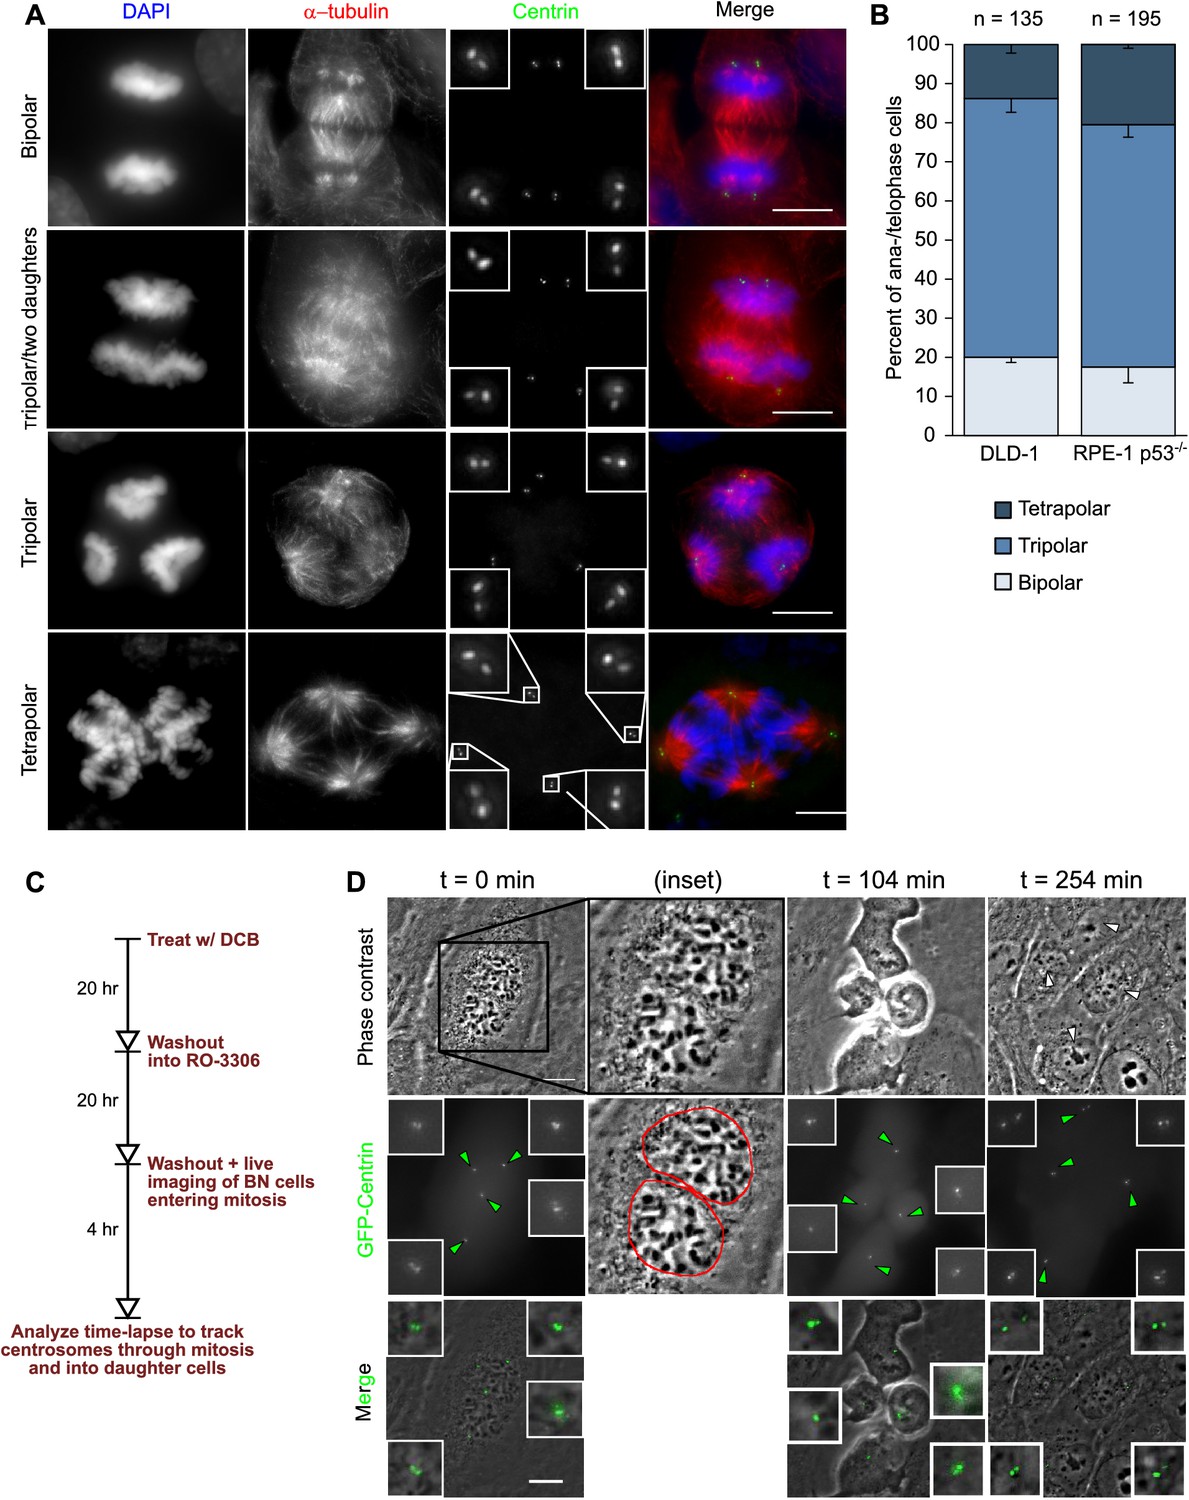
Centrosomes are present at each spindle pole in multipolar ana-/telophase cells.
(A) Examples of bipolar (top row), tripolar (middle two rows) and tetrapolar (bottom row) divisions in fixed RPE-1 p53-/- cells immunolabeled with antibodies against α-tubulin and centrin 3. All multipolar ana-/telophase cells observed displayed centrioles associated with the supernumerary spindle poles. The cell in the second row shows a tripolar mitosis in which the proximity of two spindle poles will likely lead to the formation of only two daughter cells instead of three. Insets represent 4X enlarged views of the centrosomes. Scale bars, 10 µm. (B) Quantification of the proportion of bipolar, tripolar, and tetrapolar ana-/telophases in fixed cell samples. Error bars represent S.E.M. from three independent experiments. (C) Experimental design for short-term live cell imaging of binucleate cells expressing GFP-labeled centrin. Cells were tracked through their first cell division after induction of cytokinesis failure. (D) Example of RPE-1 p53-/- cell showing chromosome segregation in four directions, each defined by the presence of a centrosome. In all RPE-1 p53-/- cells (n = 31) in which centrosomes could be observed throughout mitosis, chromosomes segregated to locations that contained one or more centrosomes. Scale bar, 10 µm. This analysis also showed that for all the newly formed tetraploid cells analyzed (DLD-1, n = 44; RPE-1 p53-/-, n = 37), the total number of centrosomes in the daughter cells equaled the number of centrosomes in the tetraploid mother cell.
-
Figure 1—figure supplement 1—source data 1
Source data for Figure 1—figure supplement 1B,D.
- https://cdn.elifesciences.org/articles/54565/elife-54565-fig1-figsupp1-data1-v2.xlsx
Figure 2 with 1 supplement
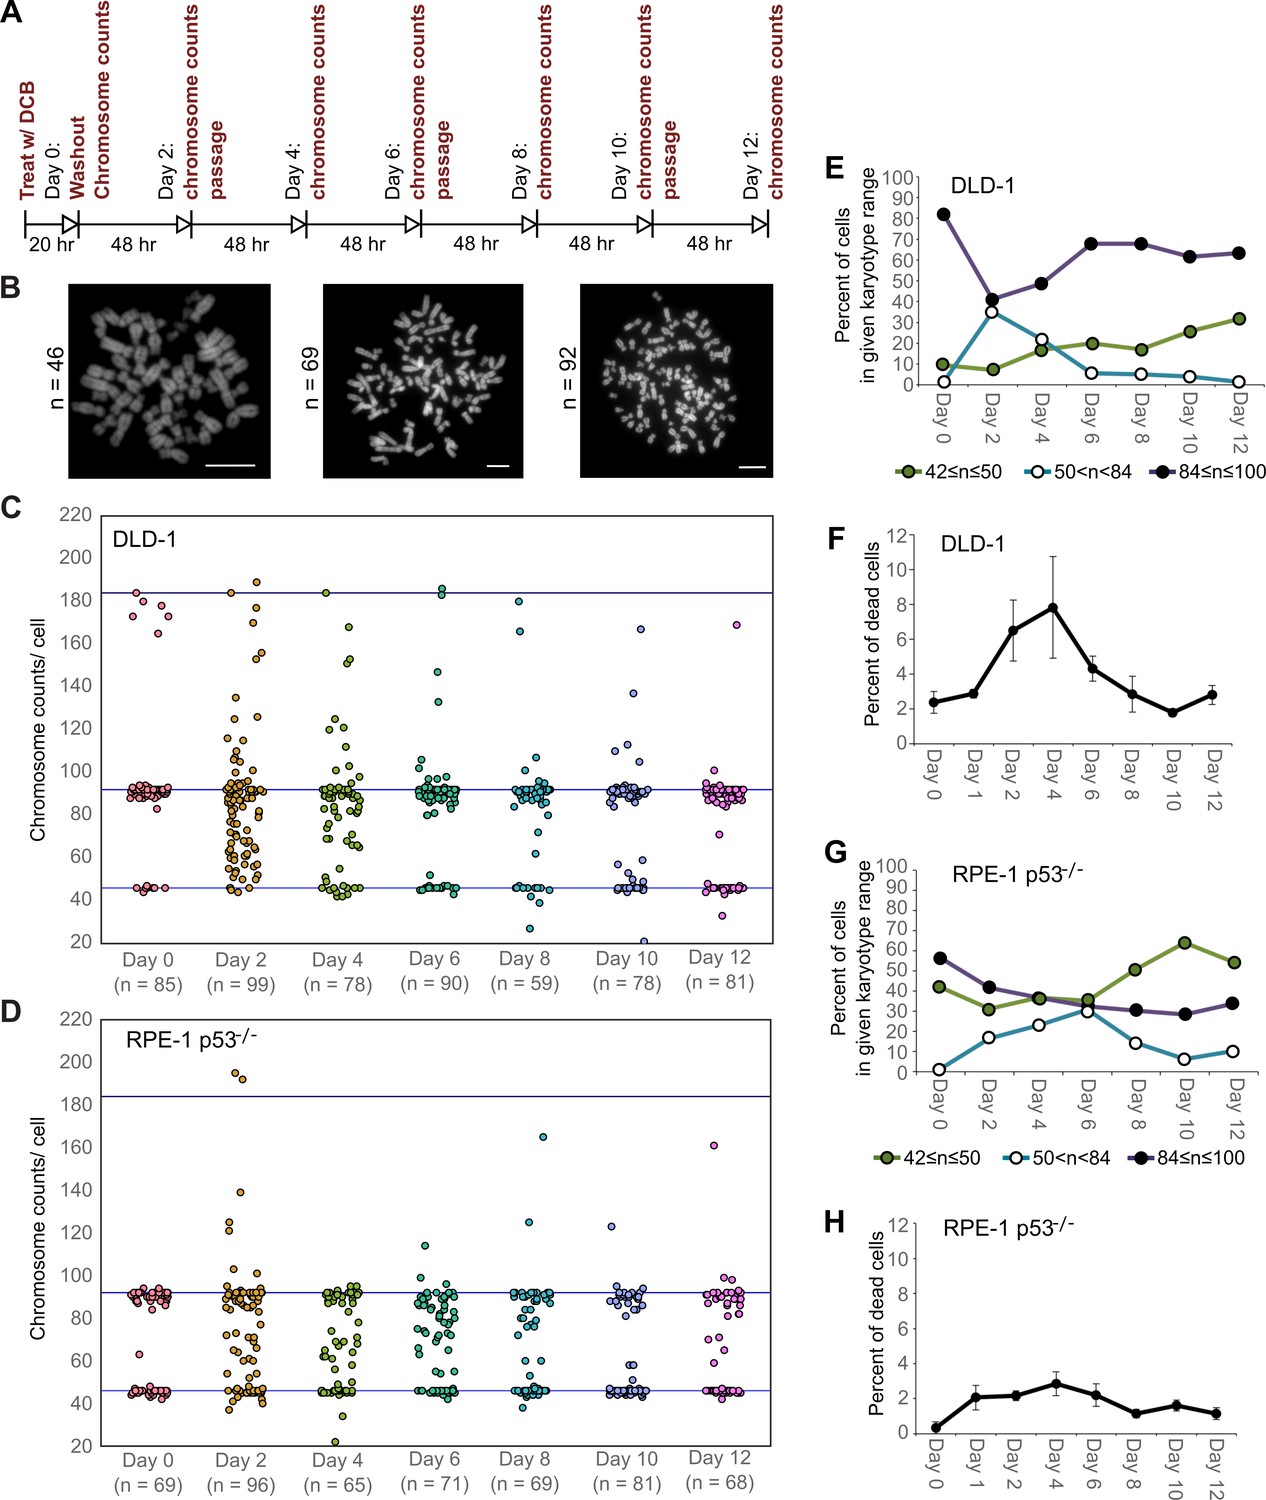
High degrees of aneuploidy appear and rapidly disappear following tetraploidization.
(A) Experimental design for time course experiments to analyze chromosome number evolution over a 12 day time period after experimental induction of tetraploidization by dihydrocytochalasin B (DCB). (B) Example chromosome spreads from cells with diploid (left), highly aneuploid (middle), and tetraploid (right) chromosome numbers. Scale bars, 10 µm. (C–D) 12 day time course analysis of chromosome numbers in DLD-1 (C) and RPE-1 p53-/- (D) cell populations after induction of tetraploidization. (E) Quantification (from the data in C) of the fraction of cells that are near-diploid (green), highly aneuploid (blue/white), or near-tetraploid (purple/black). (F) Time course analysis of cell death in DLD-1 cell populations with newly formed tetraploid cells. (G) Quantification (from the data in D) of the fraction of cells that are near-diploid (green), highly aneuploid (blue/white), or near-tetraploid (purple/black). (H) Time course analysis of cell death in RPE-1 p53-/- cell populations with newly formed tetraploid cells. Chromosome number data were obtained from two independent experiments. Error bars in (F, H) represent S.E.M. from three independent experiments.
-
Figure 2—source data 1
Source data for Figure 2C–H.
- https://cdn.elifesciences.org/articles/54565/elife-54565-fig2-data1-v2.xlsx
Figure 2—figure supplement 1
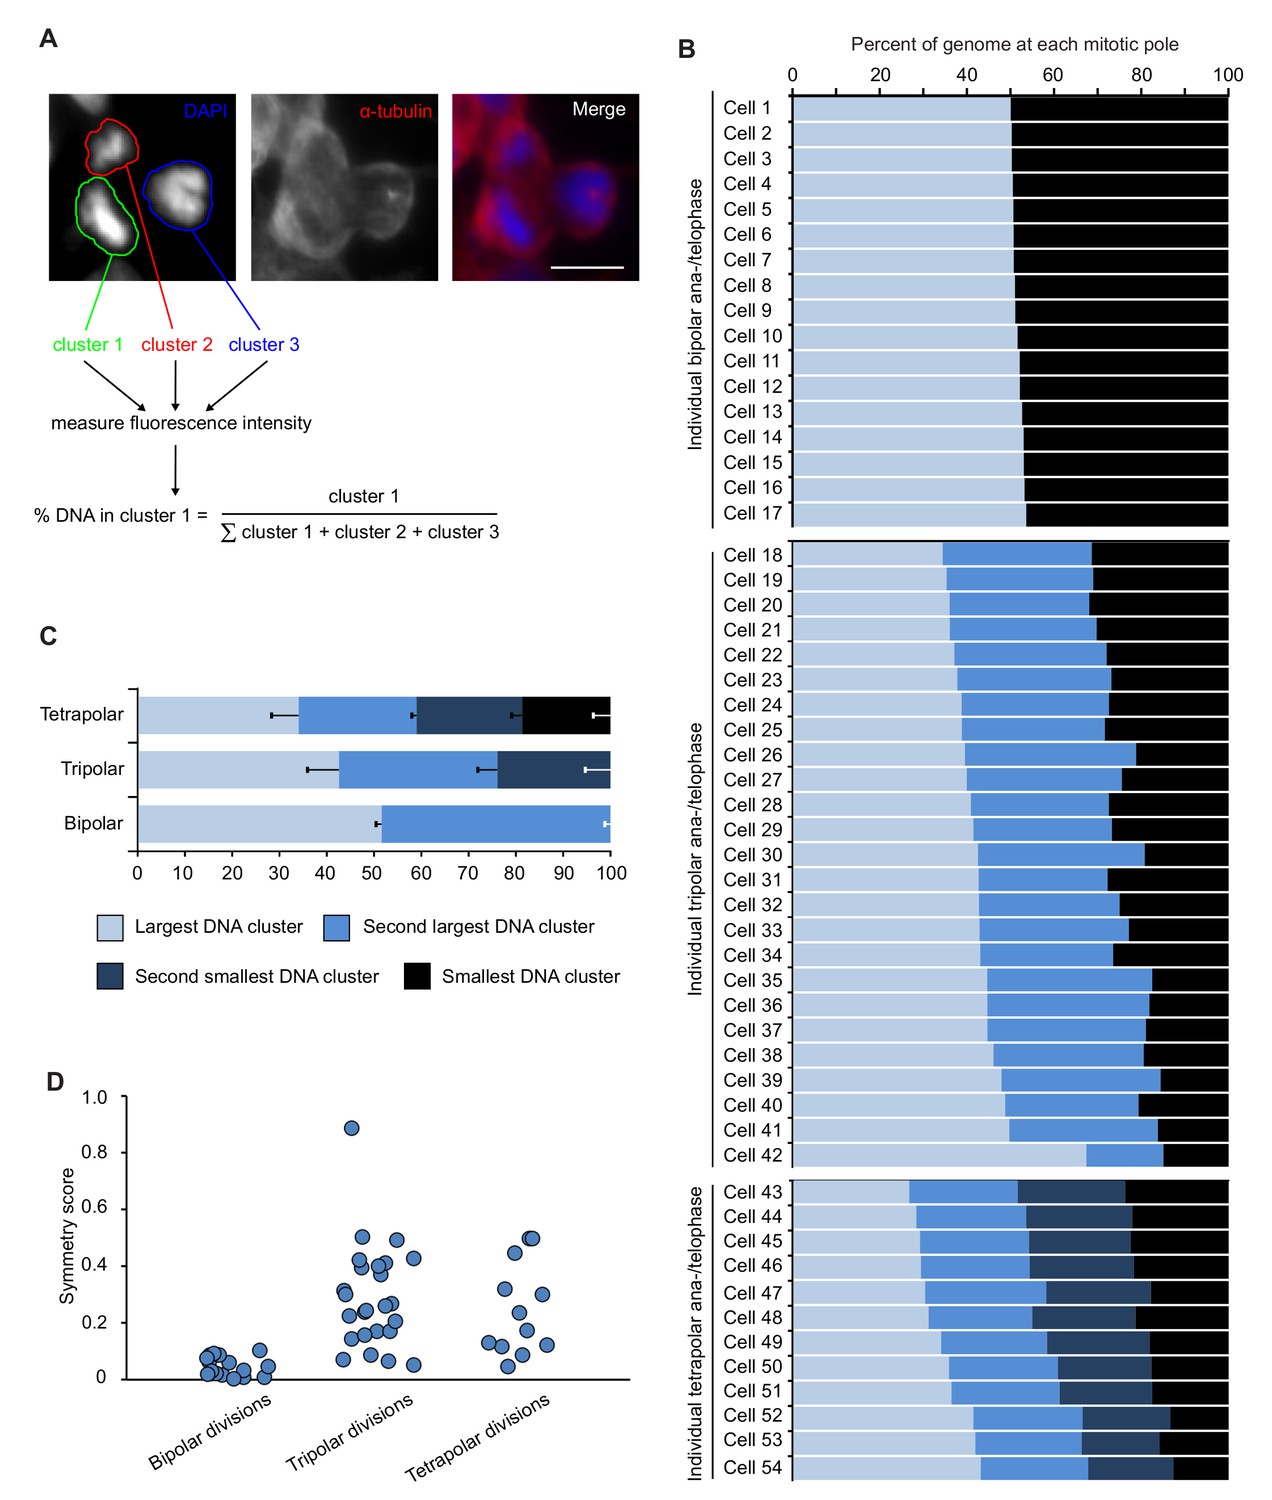
DNA can be distributed unevenly to the three (tripolar) or four (tetrapolar) poles of multipolar divisions.
(A) Example showing how amount of DNA in each chromosome cluster was quantified based on DAPI fluorescence intensity in ana-/telophase cells (see materials and methods for further details). Shown is a tripolar cell in telophase in which the fluorescence intensity for the three DNA clusters was quantified as indicated. (B) Quantification of DAPI fluorescence intensity at the poles of individual bipolar (top), tripolar (middle), and tetrapolar (bottom) divisions. (C) DAPI fluorescence intensity in DNA clusters averaged for the bipolar, tripolar and tetrapolar divisions. Error bars represent S.E.M. (D) A symmetry score was assigned to each division analyzed (see materials and methods for details). A symmetry score of zero indicates perfect symmetry, whereas scores greater than zero indicate uneven DNA distribution among the poles.
-
Figure 2—figure supplement 1—source data 1
Source data for Figure 2—figure supplement 1B,C.
- https://cdn.elifesciences.org/articles/54565/elife-54565-fig2-figsupp1-data1-v2.xlsx
Figure 3 with 1 supplement
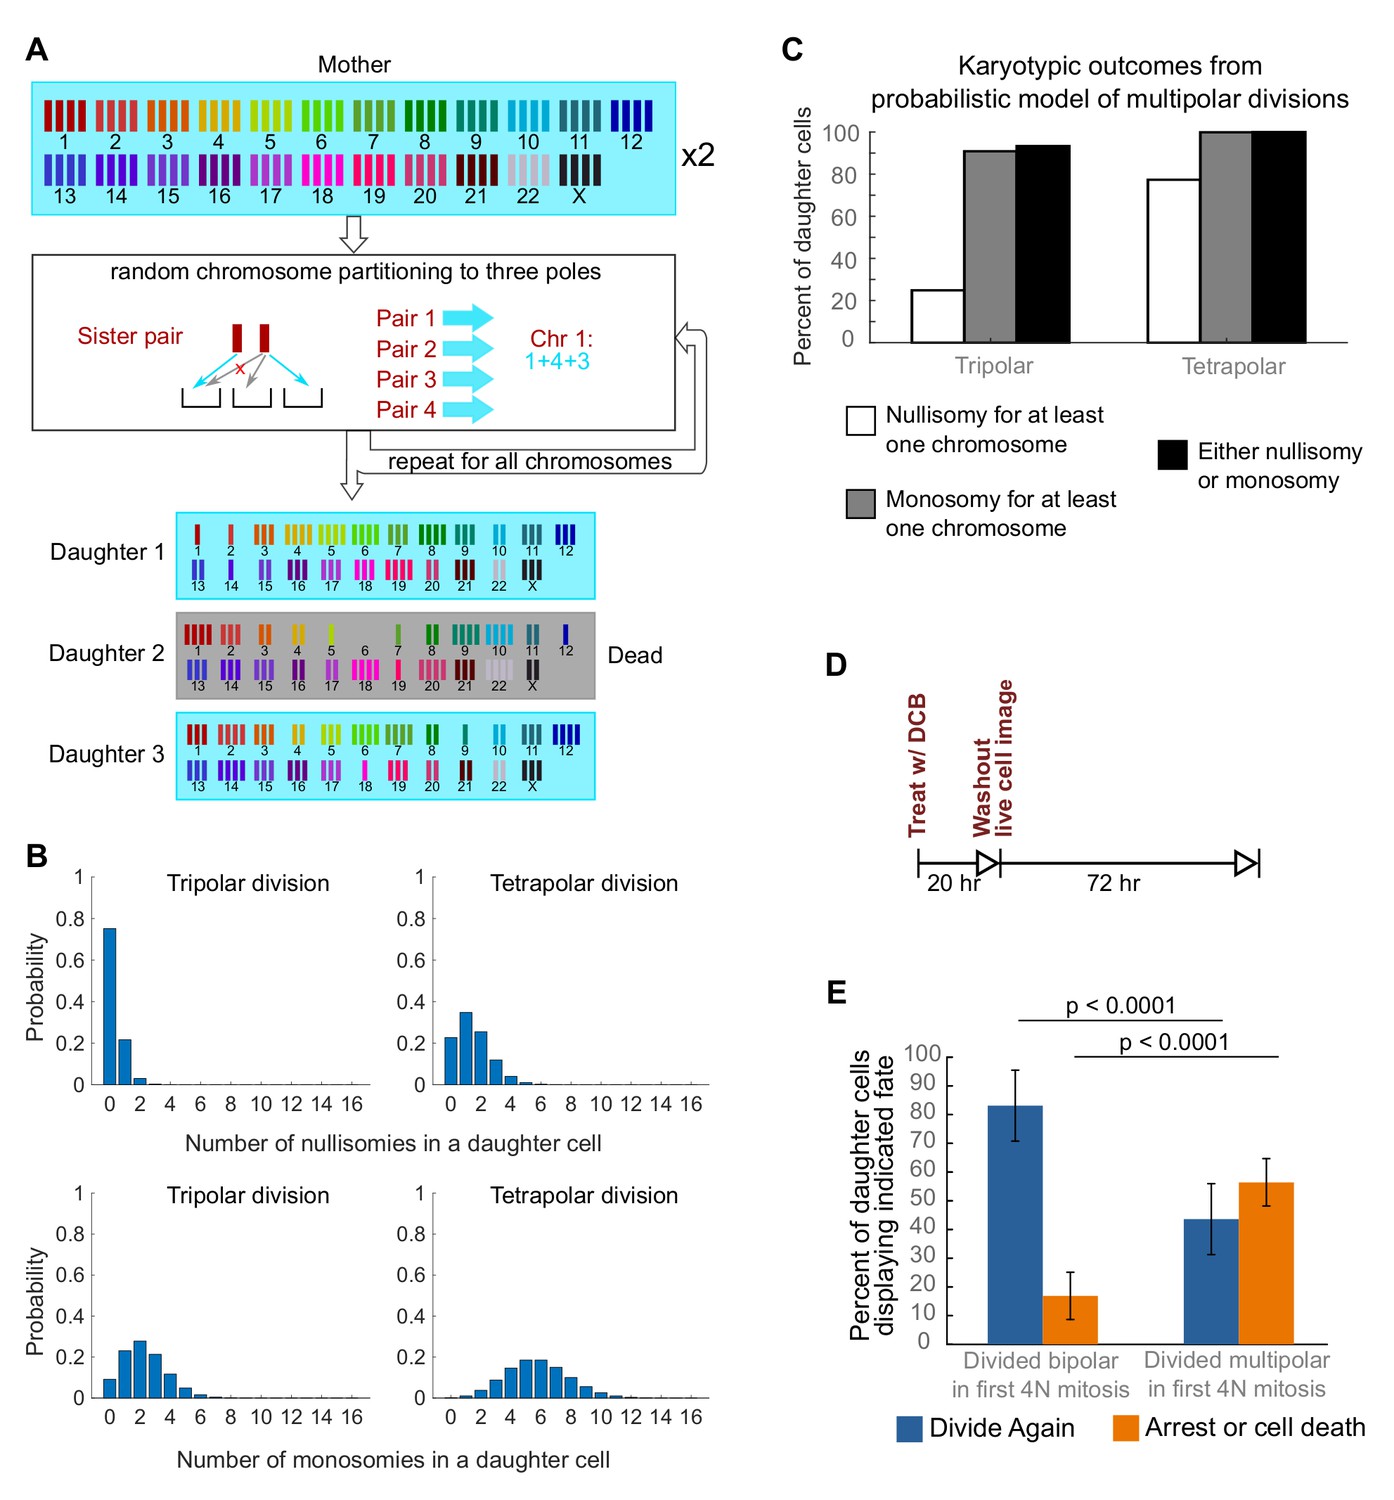
Daughters of multipolar divisions are likely to bear nullisomies or monosomies and are more likely to die or arrest over the subsequent 48 hr compared to the daughters of bipolar divisions.
(A) Probabilistic model for random partitioning of chromosomes in multipolar divisions. An example is shown for how chromosome partitioning occurs in the model in a tripolar division of a tetraploid cell. Chromosomes are randomly partitioned to three poles (cyan small arrows), with sister chromatids to different poles (red cross eliminating the case with two sisters to the same pole). Daughter 2 is dead due to nullisomy of Chromosome 6. (B) Model predicted probability distributions of the number of nullisomies (top) or monosomies (bottom) in a daughter cell from tripolar (left) or tetrapolar (right) division of a tetraploid mother cell. Analytic formulas of the probabilities are given in Sections 1.1 and 1.2 of the Modeling Methods. (C) Model predicted probabilities of nullisomy and/or monosomy for at least one chromosome in daughter cells of tetraploid cells undergoing multipolar division. Note, there may be nullisomy for one chromosome and monosomy for another chromosome within the same cell. (D) Experimental design for live cell imaging to analyze the first two mitotic divisions of newly formed tetraploid cells. (E) Quantification of the fate of daughter cells derived from either a bipolar or a multipolar mitosis during the first tetraploid cell division. Error bars represent weighted S.E.M. from three independent experiments (weighted based on the number of cells analyzed in each experiment).
-
Figure 3—source data 1
Source data for Figure 3E and Figure 3—figure supplement 1.
- https://cdn.elifesciences.org/articles/54565/elife-54565-fig3-data1-v2.xlsx
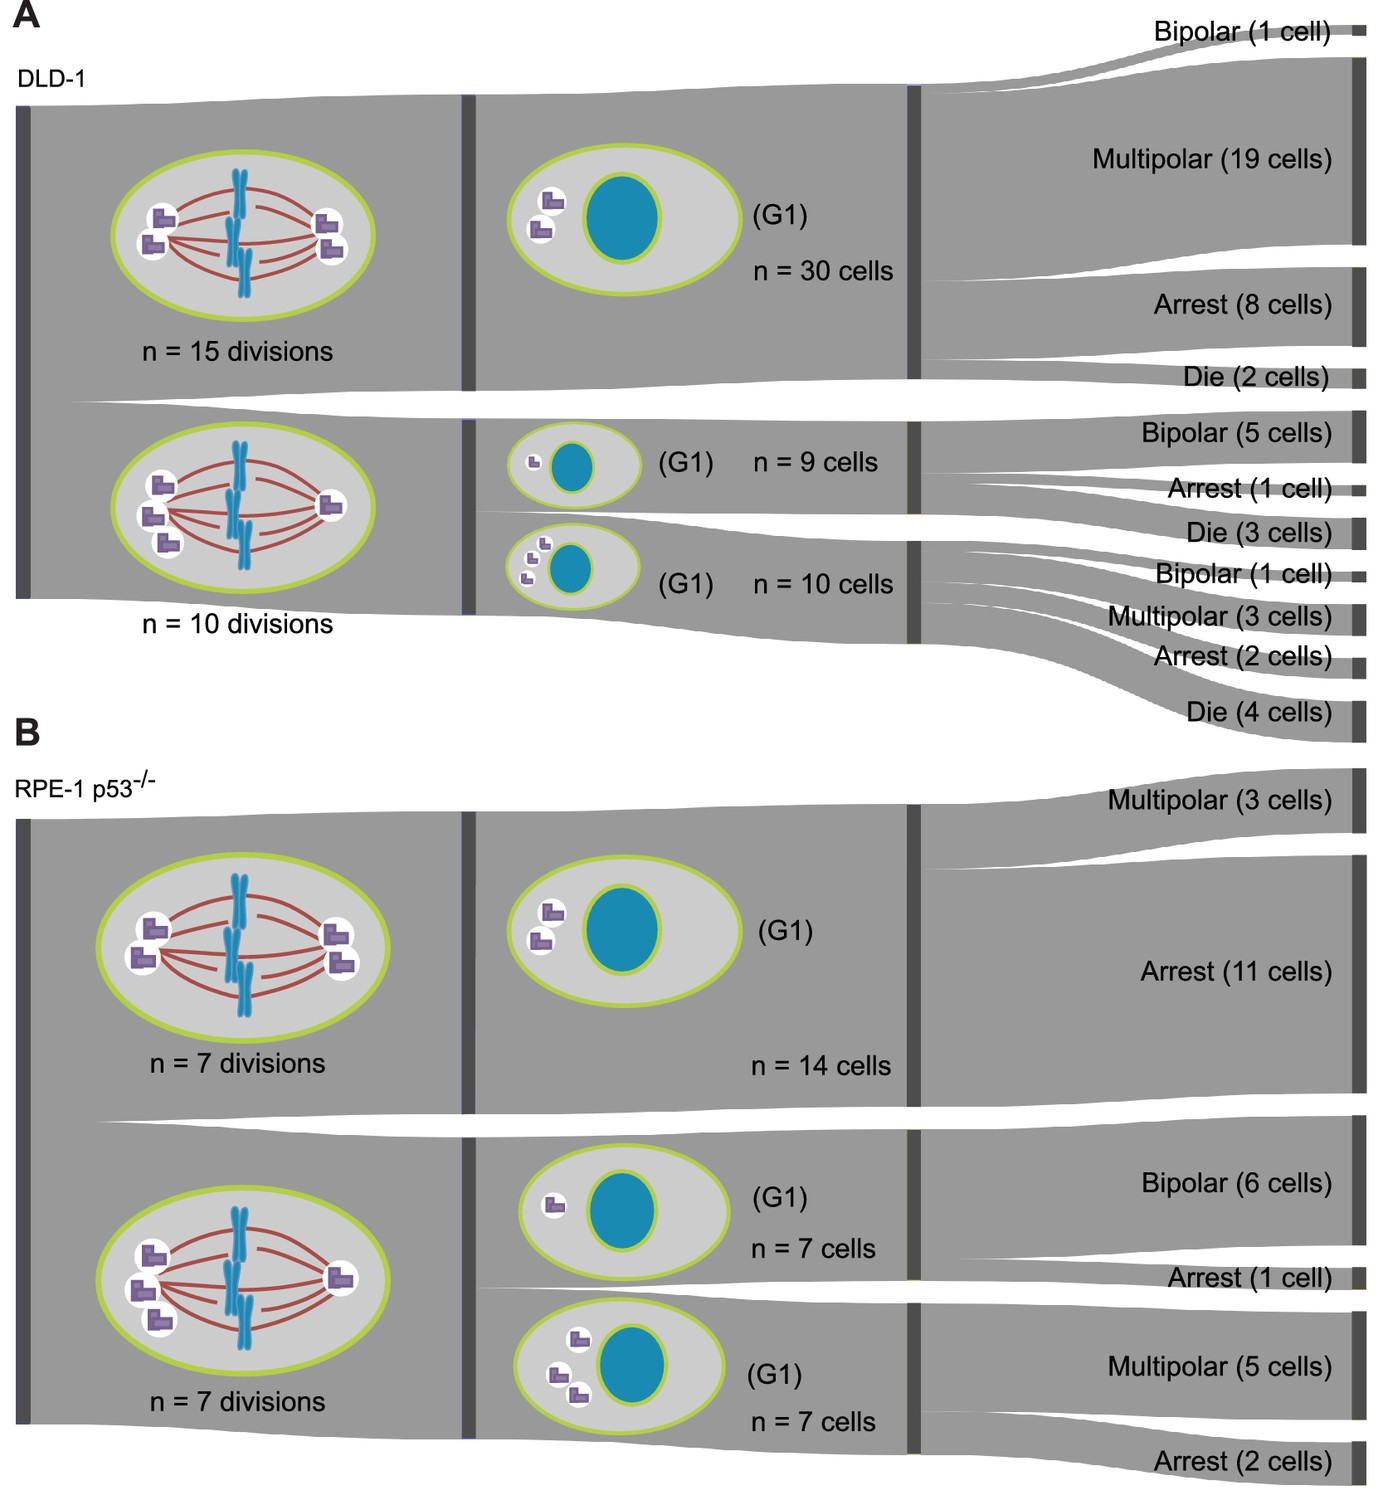
Figure 3—figure supplement 1
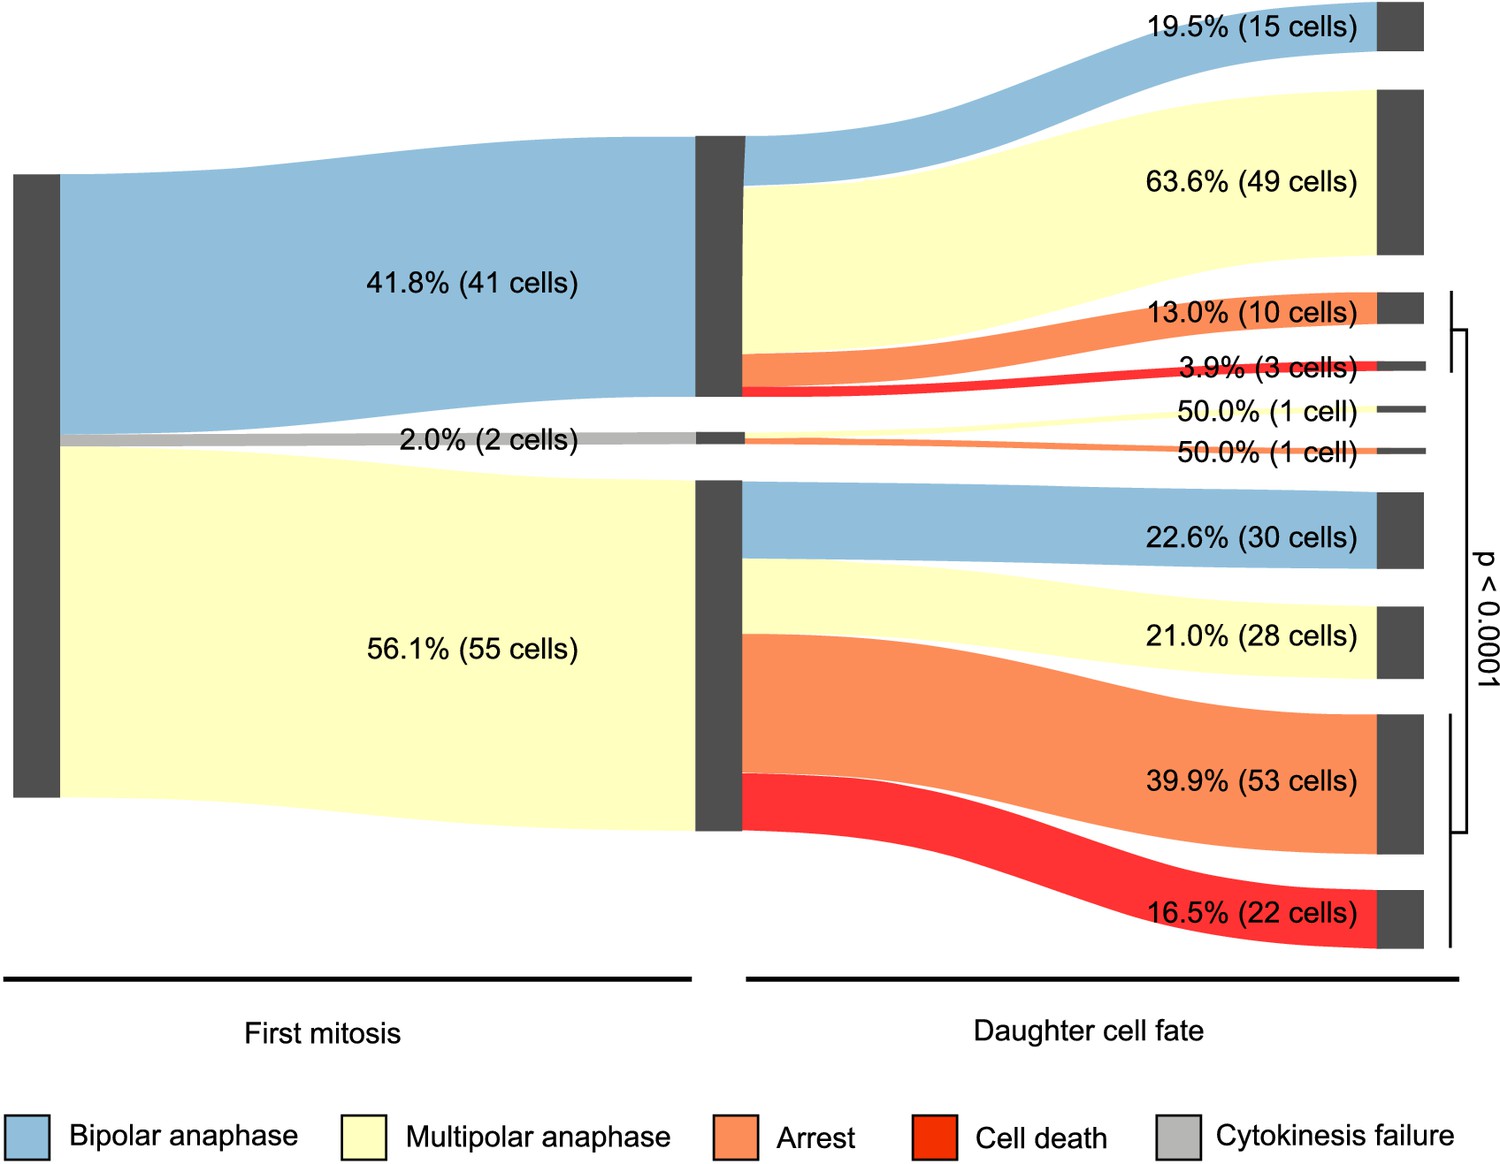
Fates of newly formed tetraploid cells tracked for the first 72 hr post-cytokinesis failure.
Sankey diagram showing pooled data from three independent 72 hr live cell imaging experiments in which newly formed DLD-1 tetraploid cells were followed through two consecutive cell divisions. Note, the total number of cells that could be analyzed for a second round of division does not equal the number of daughters produced during the first round of division because some cells moved out of the field of view during the course of the experiment.
Figure 4
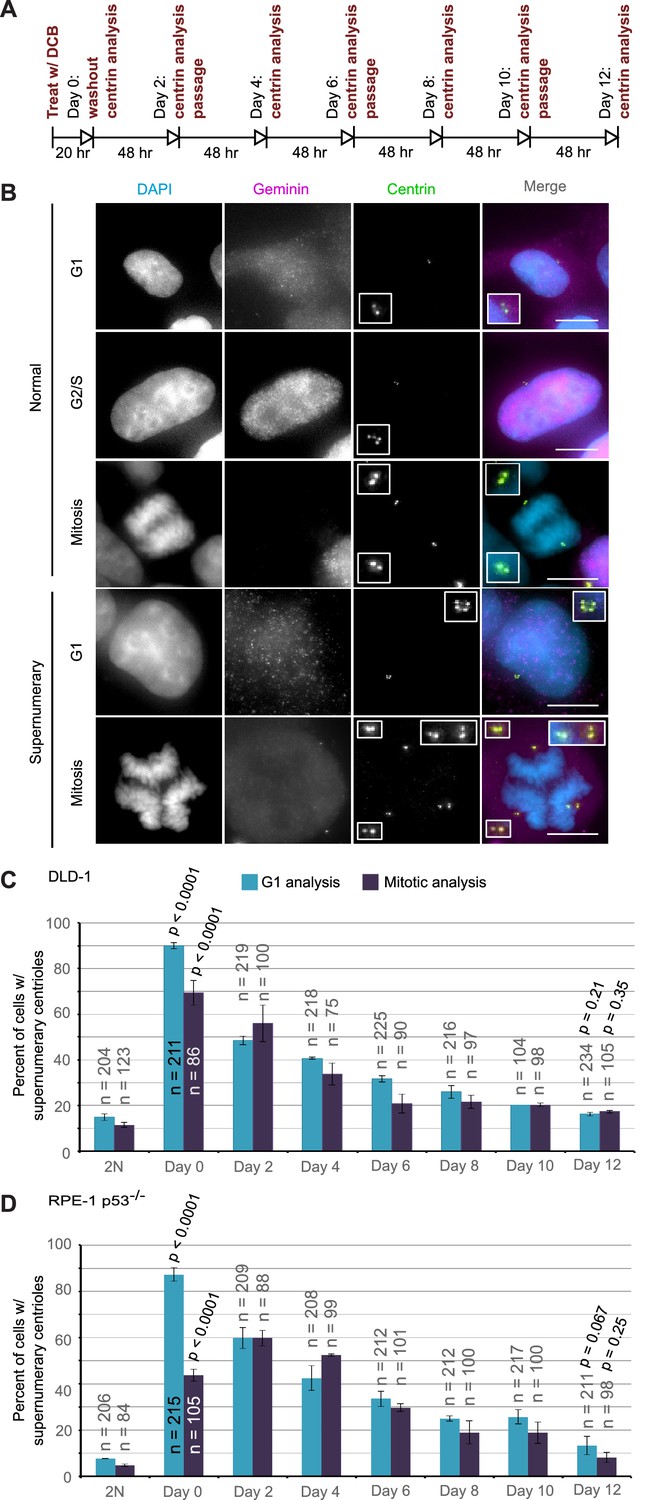
Extra centrosomes are rapidly lost from the cell population after tetraploidization.
(A) Experimental design for time course experiments to analyze centrosome number in cell populations evolving over a 12 day period after induction of tetraploidization. DCB, dihydrocytochalasin B. (B) Examples of interphase and mitotic cells with normal centrosome number (top) or supernumerary (bottom) centrosomes. Scale bars, 10 µm. (C–D) 12 day time course analysis of centrosome number in mitotic and G1 (cells negative for nuclear geminin staining) DLD-1 (C) and RPE-1 p53-/- (D) cells after induction of tetraploidization. Centrosome number data are reported as mean ± S.E.M. from two independent experiments in which the total number of cells reported on each bar was analyzed. The reported p-values refer to comparison between individual data point and the corresponding data in the parental 2N cell line by two-sided Fisher’s exact test.
-
Figure 4—source data 1
Source data for Figure 4C–D.
- https://cdn.elifesciences.org/articles/54565/elife-54565-fig4-data1-v2.xlsx
Figure 5 with 4 supplements
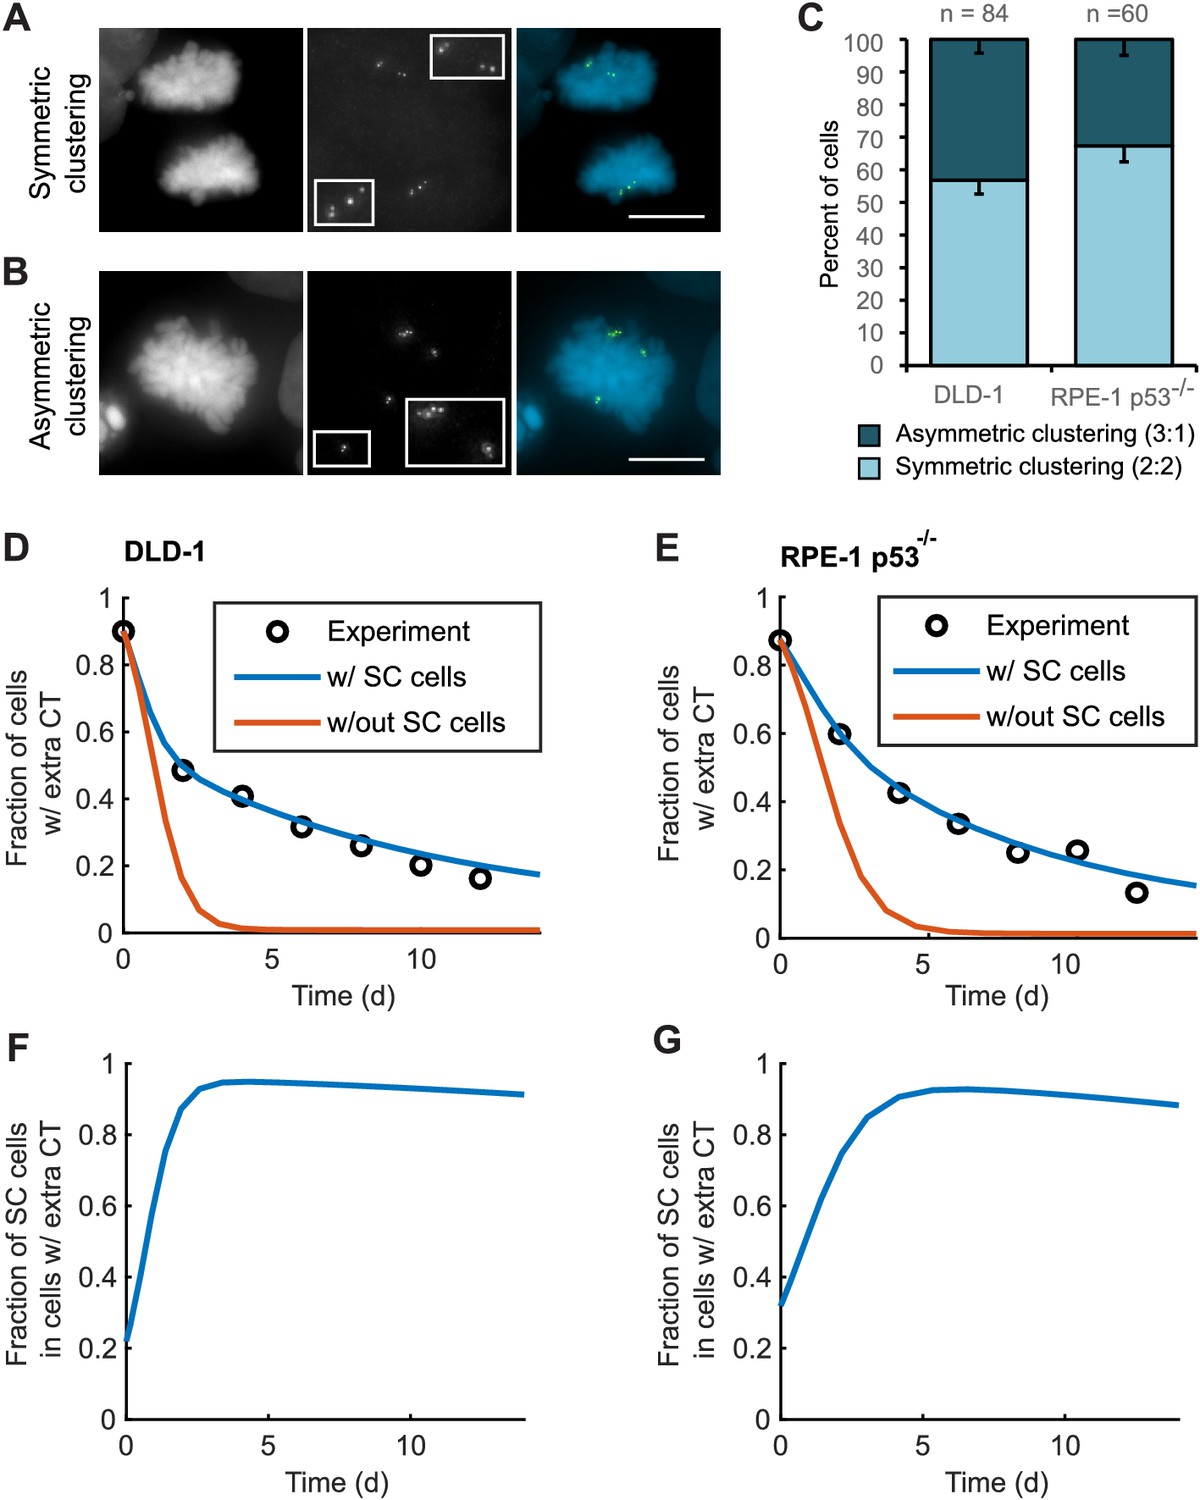
Asymmetric clustering of centrosomes in bipolar divisions can explain the formation of tetraploid cells with a normal centrosome number.
(A) Example of anaphase cell with supernumerary centrosomes clustered symmetrically into a bipolar configuration, such that two centrosomes (four centrioles) are associated with each of the anaphase chromosome masses. (B) Example of a late prometaphase cell with supernumerary centrosomes clustered asymmetrically into a bipolar configuration, such that one centrosome (two centrioles) is at one side of the chromosome mass and three centrosomes (six centrioles) are on the other side of the chromosome mass. Scale bars, 10 µm. (C) Quantification of symmetric vs. asymmetric centrosome clustering in newly formed tetraploid DLD-1 and RPE-1 p53-/- mitotic cells with bipolar configuration. Data are reported as mean ± S.E.M. from at least three independent experiments. (D–E) Modeling results for centrosome evolution in DLD-1 (D) and RPE-1 p53-/- (E) cells based on Model I, without the added assumption that a fraction of cells clusters their extra centrosomes with high efficiency (‘w/out SC cells,’ orange) or Model II, with the added assumption that a subset of cells displays high centrosome clustering efficiency (‘w/ SC cells,’ blue). The modeling results are superimposed on the mean values of the experimental data (circles) from Figure 4C–D. When available, experimentally measured parameter values were used (see modeling methods for further details and Table 1 for parameter values). (F–G) Fractions of cells with supernumerary centrosomes that are, over time, SC cells for DLD-1 (F) and RPE-1 p53-/- (G) cells based on Model II (with SC cells).
-
Figure 5—source data 1
Source data for Figure 5C.
- https://cdn.elifesciences.org/articles/54565/elife-54565-fig5-data1-v2.xlsx
Figure 5—figure supplement 1
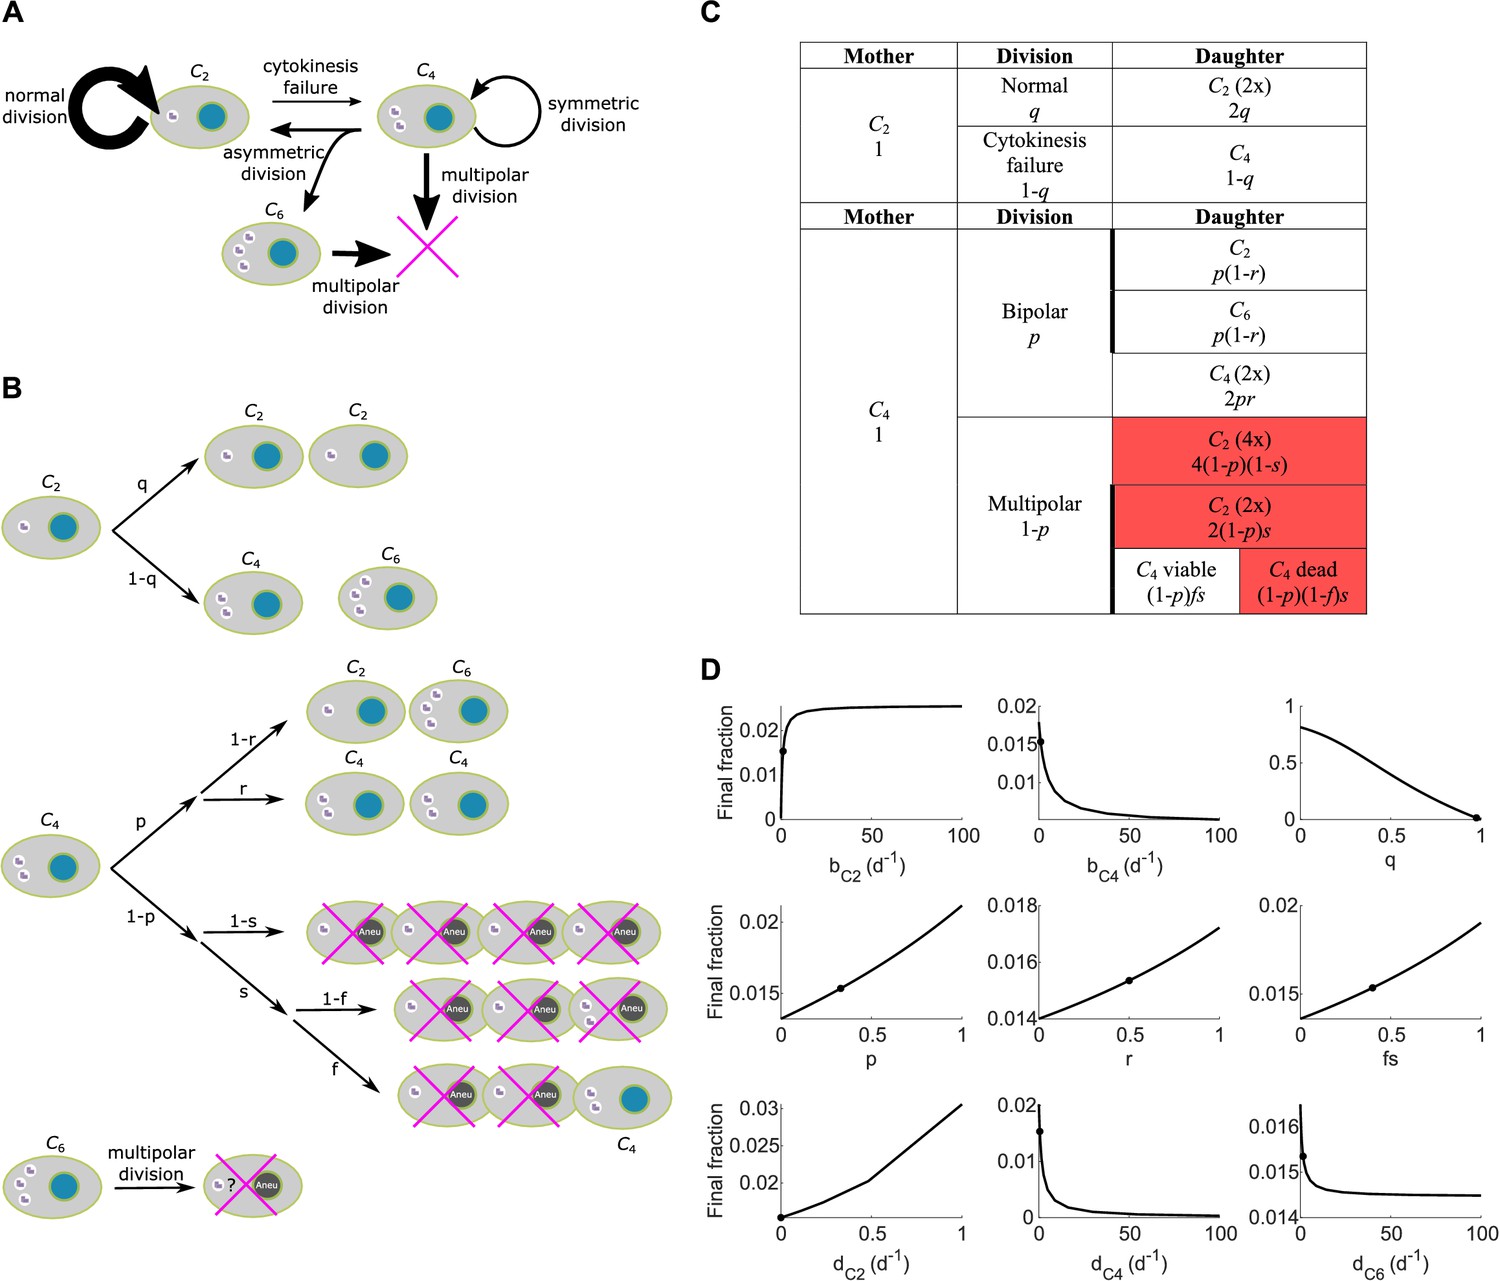
Scheme and parameter sensitivity analysis for Model I.
(A) Simple wiring diagram for Model I, illustrating the major routes of interconversion between different subpopulations. (B) Expanded wiring diagram of Model I, indicating the probabilities of various events and illustrating the fates of cells that inherit different numbers of centrosomes as different types of mother cells undergo different types of cell division. Magenta crosses indicate cell death. (C) Representation of the expanded wiring diagram in table format. Red shade: dead daughter cells. Thick borderlines: daughter cells from the same division. (D) Parameter sensitivity around nominal parameter values in Model I. Vertical axis: final steady state fraction of cells with extra centrosomes. The model parameters correspond to those in Table 1. Dots: nominal parameter values for DLD-1 cells (Table 1).
Figure 5—figure supplement 2
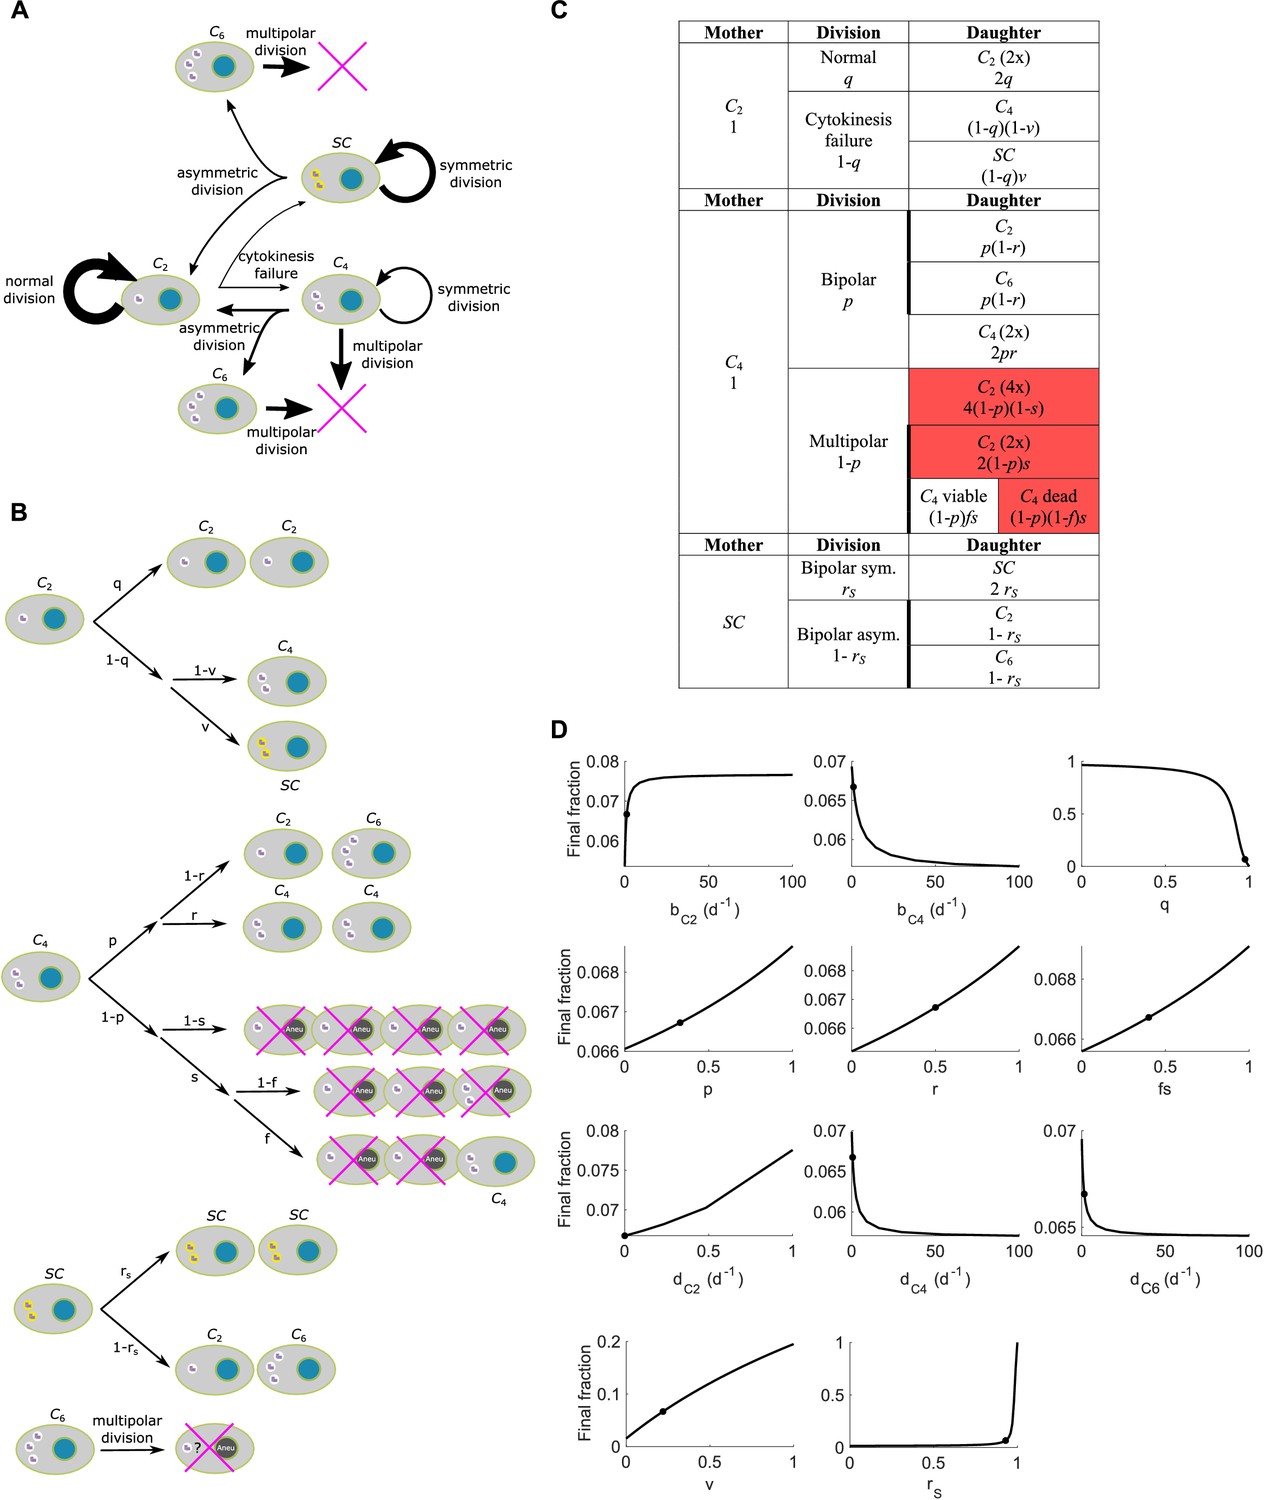
Scheme and parameter sensitivity analysis for Model II.
(A) Simple wiring diagram for Model II, illustrating the major routes of interconversion between different subpopulations. (B) Expanded wiring diagram of Model II, indicating the probabilities of various events and illustrating the fates of cells that inherit different numbers of centrosomes as different types of mother cells undergo different types of cell division. Magenta crosses indicate cell death. (C) Representation of the expanded wiring diagram in table form. Red shade: dead daughter cells. Thick borderlines: daughter cells from the same division. (D) Parameter sensitivity around nominal parameter values in Model II. Vertical axis: final steady state fraction of cells with extra centrosomes. The model parameters correspond to those in Table 1. Dots: nominal parameter values for DLD-1 cells (Table 1).
Figure 5—figure supplement 3
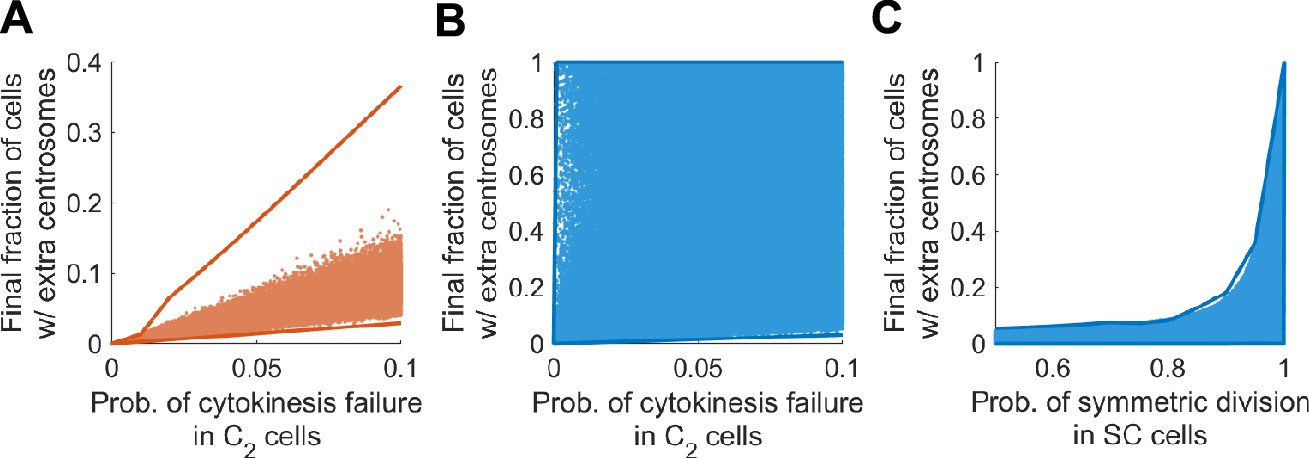
Final steady state fractions of cells with extra centrosomes are strongly constrained by the most sensitive parameters in both models.
Solid lines: upper and lower limits of the final fraction computed through optimization. Scattered dots: final fractions computed over 1 million randomly sampled parameter sets. (A) In Model I, the final fraction of cells with extra centrosomes is strongly constrained by the probability of cytokinesis failure in C2 cells. Note that the upper limit stays far away from the common range of results from random parameter sets. This phenomenon indicates that the upper limit is approached via very stringent conditions on the parameter values, and is likely not robust. The range covered by the scattered dots are robust and hence more realistic. (B) In Model II, the final fraction of cells with extra centrosomes is not constrained by the probability of cytokinesis failure in C2 cells. (C) In Model II, the final fraction of cells with extra centrosome is constrained by the probability of asymmetric division in SC cells. In (A–C), the final (i.e., steady state) fraction of cells with extra centrosomes were computed using the method posited in Theorem 1. Distributions of random parameter sets chosen within physiologically reasonable range: bC2 ~log uniform [0.8, 1.2], bC4 ~log uniform [0.1, 1.5], q ~ uniform [0.9, 1], p~uniform [0. 0.6], r ~ uniform [0, 0.9], fs ~uniform [0, 0.9], dC2 ~log uniform [10−10, 0.3], dC4 ~log uniform [10−10, 1], dC6 ~log uniform [0.5, 2], v ~ uniform [0. 0.6], rS ~uniform [0.5, 1].
Figure 5—figure supplement 4
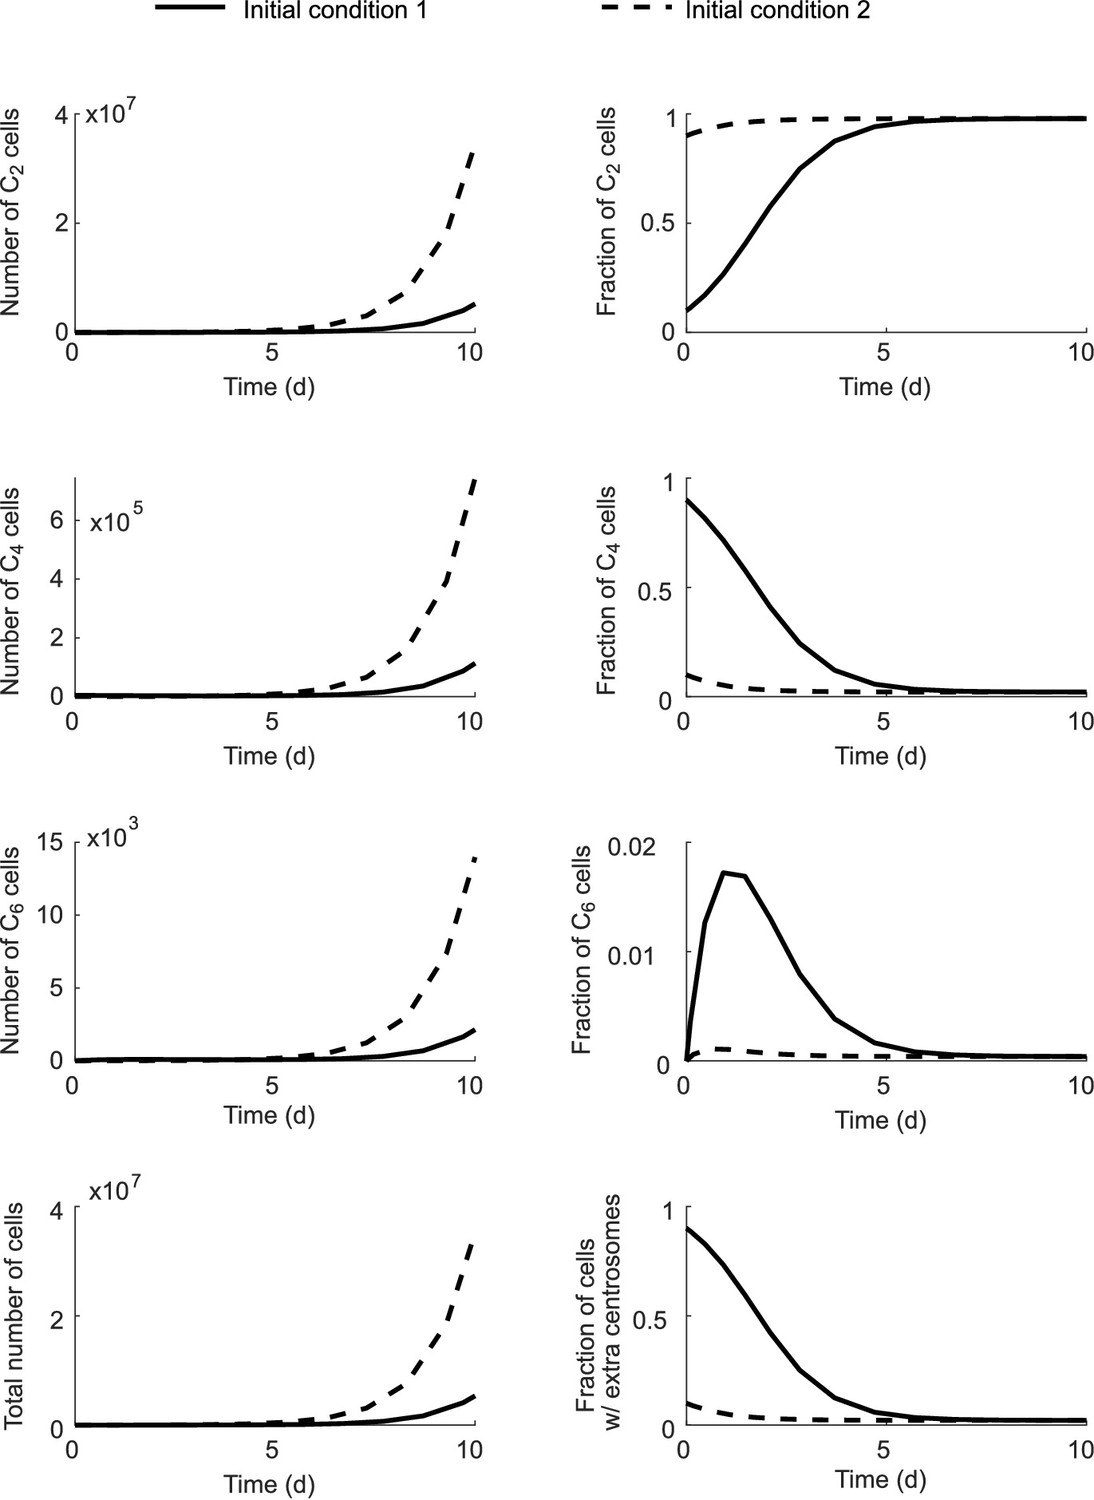
Fractions of each cell type in the total population approach steady state even though the total population size grows infinitely.
Initial condition 1: C2 (0)=0.1N; C4 (0)=0.9N; C6 (0)=0; N = 5000. Initial condition 2: C2 (0)=0.9N; C4 (0)=0.1N; C6 (0)=0; N = 5000. Simulation results with Model I.
Figure 6 with 1 supplement

Cells that inherit a single centrosome or cells with high centrosome clustering ability are favored for continued proliferation.
(A) Experimental design for long-term live cell imaging of cells with GFP-labeled centrin. DCB, dihydrocytochalasin B. (B–C) Quantification of the fraction of cells that undergo bipolar division after inheriting different numbers of centrosomes from DLD-1 (B) or RPE-1 p53-/- (C) tetraploid mother cells. (D) Fractions of bipolar ana-/telophases out of all ana-/telophases with extra centrioles in DLD-1 parental cells (2N Parental), parental cells treated with DCB while arrested in G2 (20 hr RO +DCB; to ensure that the DCB treatment did not, per se, impair centrosome clustering), tetraploid cells immediately after DCB washout (Day 0), and after twelve days of evolution (Day 12). The fraction of ana-/telophase cells with extra centrioles that display a bipolar configuration after 12 days of evolution is similar to such fraction in the parental cell line and significantly greater than such fraction in the Day 0 population. Graphs for (B) and (C) represent data collected from five and four independent experiments, respectively. Error bars represent weighted S.E.M. (weighted based on the number of cells analyzed in each experiment) and p-values were calculated by a two sided Fisher’s exact test comparing the fate of cells that inherit a single centrosome to those that inherit supernumerary (2-3) centrosomes. Graph for (D) represents data from three independent experiments and p-values for the indicated comparisons were calculated by the two sided Fisher’s exact test.
-
Figure 6—source data 1
Source data for Figure 6B–D and Figure 6—figure supplement 1.
- https://cdn.elifesciences.org/articles/54565/elife-54565-fig6-data1-v2.xlsx
Figure 6—figure supplement 1
Fates of daughter cells derived from bipolar mitoses with symmetric or asymmetric centrosome clustering during the first tetraploid cell division.
(A) Data from long-term live cell imaging of newly formed DLD-1 tetraploid cells, expressing GFP-labeled centrin, in which the number of centrosomes inherited by daughter cells of bipolar divisions was tracked. Cells inheriting a single centrosome are significantly more likely to undergo subsequent bipolar mitosis than cells inheriting extra centrosomes (two sided Fisher’s exact test, p=0.0012; see Figure 6B). Diagram represents data collected from five independent experiments. (B) Data from long-term live cell imaging of newly formed RPE-1 p53-/- tetraploid cells, expressing GFP-labeled centrin, in which the number of centrosomes inherited by daughter cells of bipolar divisions was tracked. Cells inheriting a single centrosome are significantly more likely to undergo subsequent bipolar mitosis than cells inheriting extra centrosomes (two sided Fisher’s exact test, p<0.0001; see Figure 6C). Diagram represents data collected from four independent experiments. Note, in some cases the total number of cells that could be analyzed for a second round of division does not equal the number of daughters produced during the first round of division because some cells moved out of the field of view during the experiment.
Figure 7
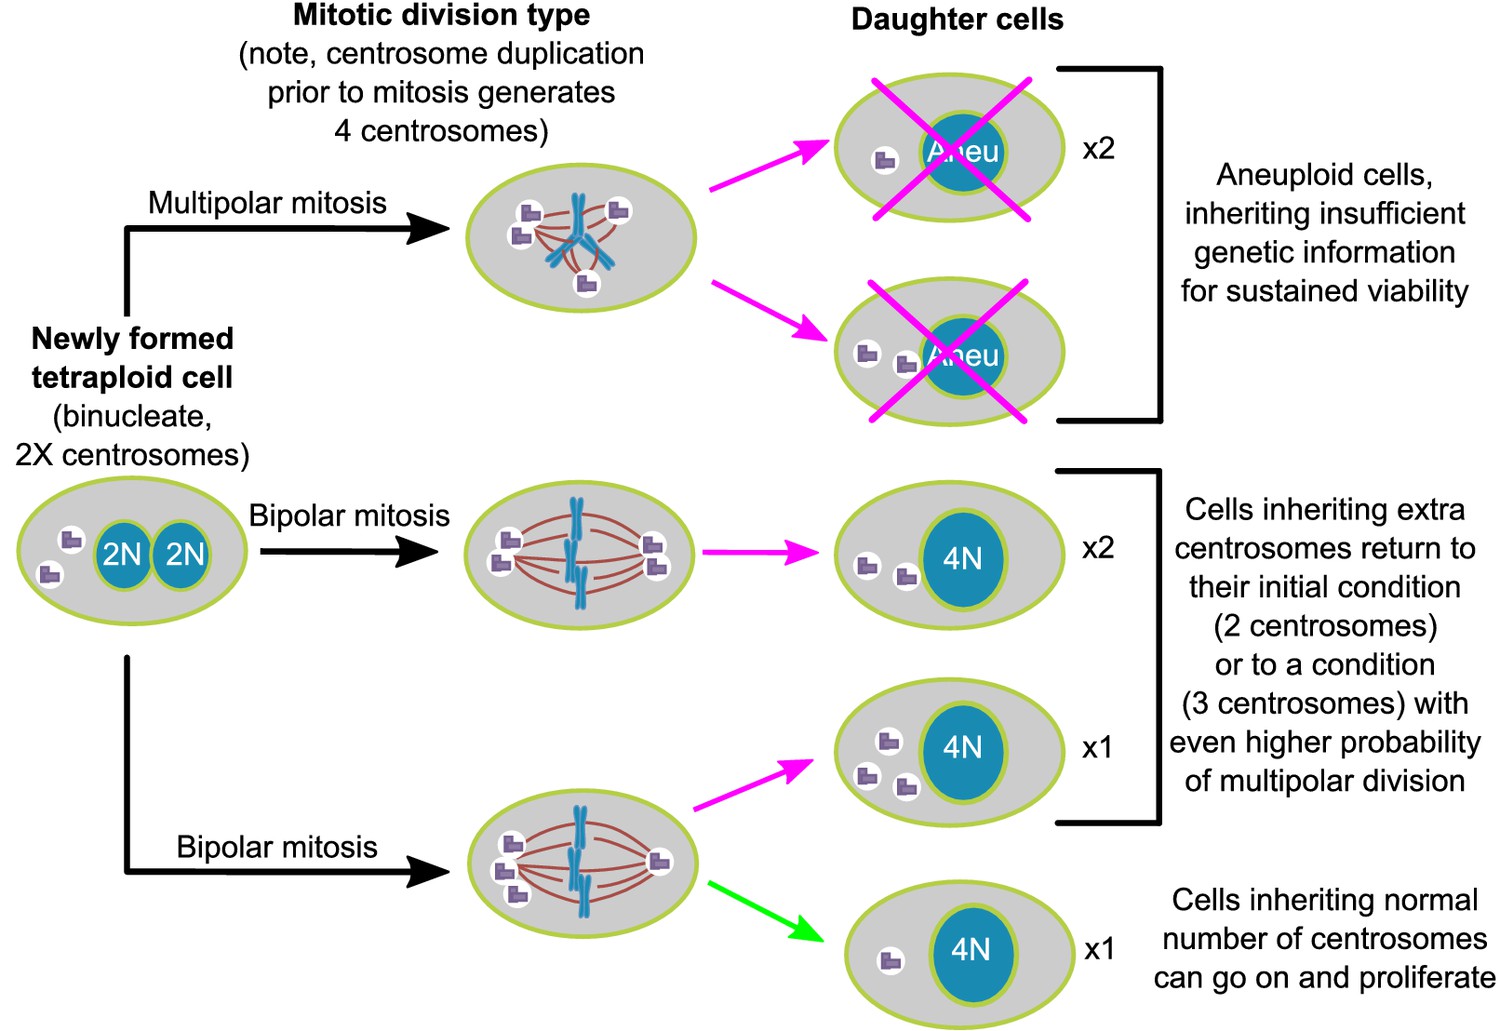
Asymmetric clustering of centrosomes defines the early evolution of tetraploid cells.
The diagram illustrates the possible fates of a newly formed tetraploid cell and the mechanism by which tetraploid cells containing a normal number of centrosomes emerge.
Tables
Table 1
Model parameters for DLD-1 and RPE-1 p53-/- cells.
| Symbols | Description | DLD-1 | RPE-1 p53-/- | Range for data fitting (both models) | Reason/Source of information |
|---|---|---|---|---|---|
| bC2 | Proliferation rate of C2 and SC cells | 1.2 d-1 | 0.94 d-1 | 0.8~1.2 d-1 | Range estimated from growth curves (not shown) |
| bC4 | Proliferation rate of C4 cells | 1 d-1 | 0.6 d-1 | 0.6~1 d-1 | Range estimated from growth curves (not shown) |
| q | Probability of bipolar division in C2 cells | 0.975 | 0.975 | 0.975~1 | 1 - probability of cytokinesis failure (Nicholson et al., 2015) |
| p | Probability that a C4 cell undergoes bipolar division | 0.33 | 0.25 | Fixed | Figure 1B |
| r | Probability of symmetric division in a bipolar division of C4 cell | 0.5 | 0.7 | Fixed | Figure 5C |
| fs | Probability that a C4 cell deriving from a multipolar division of C4 survives | 0.4 | 0.7 | Fixed | Inferred, Figure 3—figure supplement 1 |
| dC2 | Death rate of C2 and SC cells | 0 | 0 | Fixed | Rates of spontaneous cell death are negligible in both cell lines |
| dC4 | Death rate of C4 cells | 0.5 d-1 | 0.12 d-1 | Fixed | Inferred, Figure 2F, H |
| dC6 | Death rate of C6 cells | 1.5 d-1 | 1.5 d-1 | Fixed | Comparable to rate of cell division, because C6 progeny dies due to multipolar division |
| v | Probability of getting SC cell from a cytokinesis failure event | 0.22 | 0.32 | 0~0.6 † | Range suggested by Figure 3—figure supplement 1; value obtained from data fitting (Figure 5D, E) |
| rS | Probability that an SC cell divides symmetrically | 0.93 | 0.90 | 0.5~1 † | Reason for range: the SC subpopulation likely sustains itself via symmetric divisions; value obtained from data fitting (Figure 5D, E) |
-
† Parameters that only apply to Model II.
Key resources table
| Reagent type (species) or resource | Designation | Source or reference | Identifiers | Additional information |
|---|---|---|---|---|
| Strain, strain background (Escherichia coli) | NEB 5α | New England Biolabs, Inc | Cat# C2988J | Chemically competent cells |
| Strain, strain background (Escherichia coli) | NEB Stable | New England Biolabs, Inc | Cat# C3040I | Chemically competent cells |
| Cell line (Homo sapiens) | DLD-1 | ATCC | CCL-221 RRID:CVCL_0248 | |
| Cell line (Homo sapiens) | hTERT RPE-1 p53-/- | Reference 35 | ||
| Cell line (Homo sapiens) | DLD-1 GFP-CETN2 RFP-H2B | This study | Cimini lab, see text for details | |
| Cell line (Homo-sapiens) | hTERT RPE-1 p53-/-GFP-CETN2 RFP-H2B | This study | Cimini lab, see text for details | |
| Cell line (Homo-sapiens) | GP-293 | Clontech | Cat # 631458 RRID:CVCL_WI48 | Viral packaging cell line |
| Antibody | anti-Centrin 3 clone 3E6 (Mouse monoclonal) | Abnova | Cat # H00001070-M01 RRID:AB_464016 | IF(1:100) |
| Antibody | anti-geminin EPR14637 (Rabbit monoclonal) | Abcam | Cat# ab195047 RRID:AB_2832993 | IF(1:100) |
| Antibody | anti-α-tubulin (Rabbit polyclonal) | Abcam | Cat#: ab18251 RRID:AB_2210057 | IF(1:250) |
| Other | DAPI stain | Invitrogen | D1306 | (300 nM) |
| Recombinant DNA reagent | GFP-CETN2 pLNCX2 (plasmid) | This paper | G418 selection. Cimini lab, see text for details | |
| Recombinant DNA reagent | RFP-H2B pBABE (plasmid) | Neil Ganem (Boston University) | Puromycin selection | |
| Recombinant DNA reagent | GFP-Centrin 2 pLL3.7 | Tim Stearns (Standford University) | Origin of GFP-centrin 2 gene for retroviral vector | |
| Sequence-based reagent | GfpCetn_F | This paper | PCR primers | CAATAAAGCGGCCGCATGGTGAGCAAGGGCGAGGAGCTGT |
| Sequence-based reagent | GfpCetn_R | This paper | PCR Primers | GGACTGGTGGTCTGCGTCGACTTAATAGAGGCTGGTCTTTTTCATG |
| Chemical compound, drug | Dihydrocytochalasin B | Sigma Aldrich | D1641 | (1.5 µg/ml) |
| Chemical compound, drug | Colcemid | Invitrogen | Cat # 501003406 | (50 ng/ml) |
| Chemical compound, drug | RO-3306 | Sigma Aldrich | SML0569 | (9 µM) |
| Software, algorithm | NIS elements | Nikon Instruments, Inc | RRID:SCR_014329 | AR 4.60.00 |
| Software, algorithm | FIJI | Reference 65 | RRID:SCR_002285 | |
| Software, algorithm | MATLAB | MathWorks | RRID:SCR_001622 | R2018b |
Additional files
Download links
A two-part list of links to download the article, or parts of the article, in various formats.
Downloads (link to download the article as PDF)
Open citations (links to open the citations from this article in various online reference manager services)
Cite this article (links to download the citations from this article in formats compatible with various reference manager tools)
Asymmetric clustering of centrosomes defines the early evolution of tetraploid cells
eLife 9:e54565.
https://doi.org/10.7554/eLife.54565


