Building the vertebrate codex using the gene breaking protein trap library
- Department of Biochemistry and Molecular Biology, Mayo Clinic, United States
- Translational and Functional Genomics Branch, National Human Genome Research Institute, National Institutes of Health, United States
- Functional & Chemical Genomics Program, Oklahoma Medical Research Foundation, United States
- Department of Genetics, Development and Cell Biology, Iowa State University, United States
- Zebrafish Centre for Advanced Drug Discovery & Keenan Research Centre for Biomedical Science, Li Ka Shing Knowledge Institute, St. Michael's Hospital, Unity Health Toronto & University of Toronto, Canada
- Department of Cardiovascular Medicine, Mayo Clinic, United States
- Department of Embryology, Carnegie Institution for Science, United States
- Department of Clinical Genomics, Mayo Clinic, United States
- Department of Otorhinolaryngology, Mayo Clinic, United States
- Genomics and Molecular Medicine Unit, CSIR–Institute of Genomics and Integrative Biology, India
- Department of Biology, Temple University, United States
- Institute of Zoology, Developmental Biology Unit, University of Cologne, Germany
Figures
Figure 1 with 1 supplement
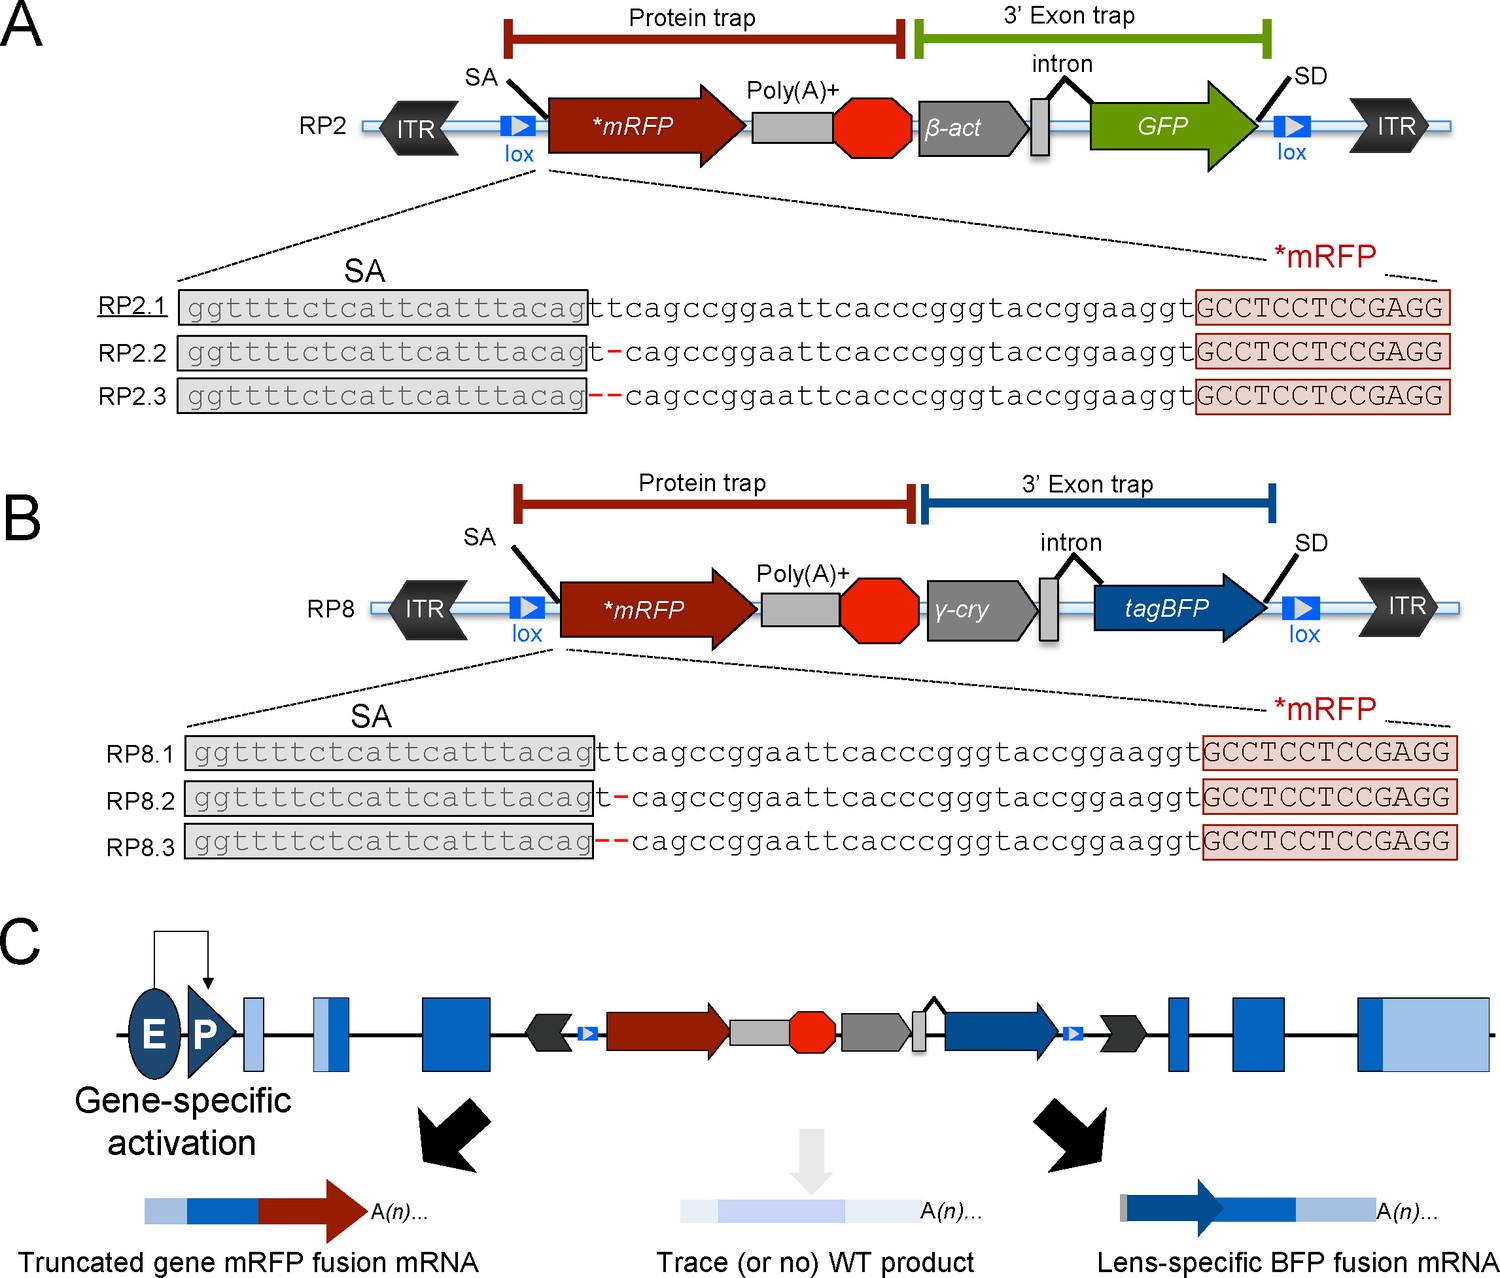
Schematic of the RP2 and RP8 gene-break transposon (GBT) system with all three reading frames of AUG-less mRFP reporter.
(A–C) Schematic of the GBT system, RP2 and RP8 incorporate a protein-trap cassette fused with three reading frames of AUG-less mRFP reporter and a 3’ exon trap cassette with GFP or tagBFP reporters, respectively. (A) RP2 series (RP2.1, RP2.2 and RP2.3). Underline: Previously published vector construct (B–C) RP8 series (RP8.1, RP8.2 and RP8.3) with a schematic RP8 insertion event showing expected transcription off of a locus below (C). ITR: inverted terminal repeat, SA: splice acceptor, lox: Cre recombinase recognition sequence, *mRFP: AUG-less mRFP sequence, poly (A)+: polyadenylation signal, red octagon: extra transcriptional terminator and putative border element, β-act: carp beta-actin enhancer, γ-cry: gamma crystalline promoter, SD: splice donor, E: enhancer, P: promoter, and WT: wild-type.
Figure 1—figure supplement 1
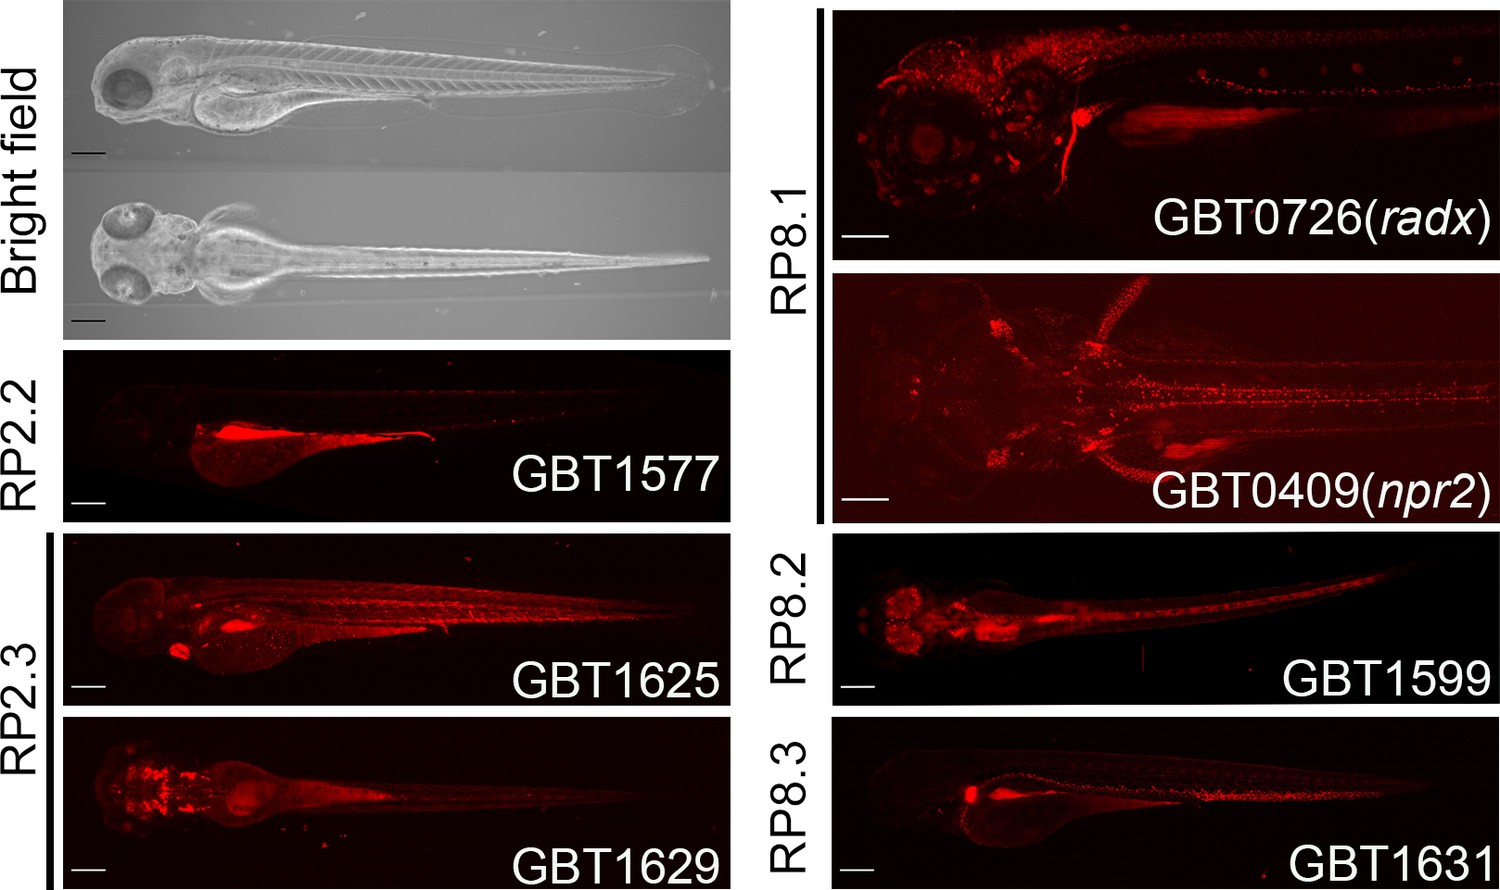
Representative expression patterns of mRFP fusion protein integrated all reading frames of RP2 and RP8.
Lateral and dorsal views of representative bright field images at four dpf and lateral or dorsal views of RFP expression patterns at four dpf in GBT1577 integrated RP2.2, GBT1625 and GBT1629 integrated RP2.3, GBT0409 (npr2) and GBT0726 (radx) integrated RP8.1, GBT1599 integrated RP8.2 and GBT1631 integrated RP8.3. Scale bars = 200 µm.
Figure 2
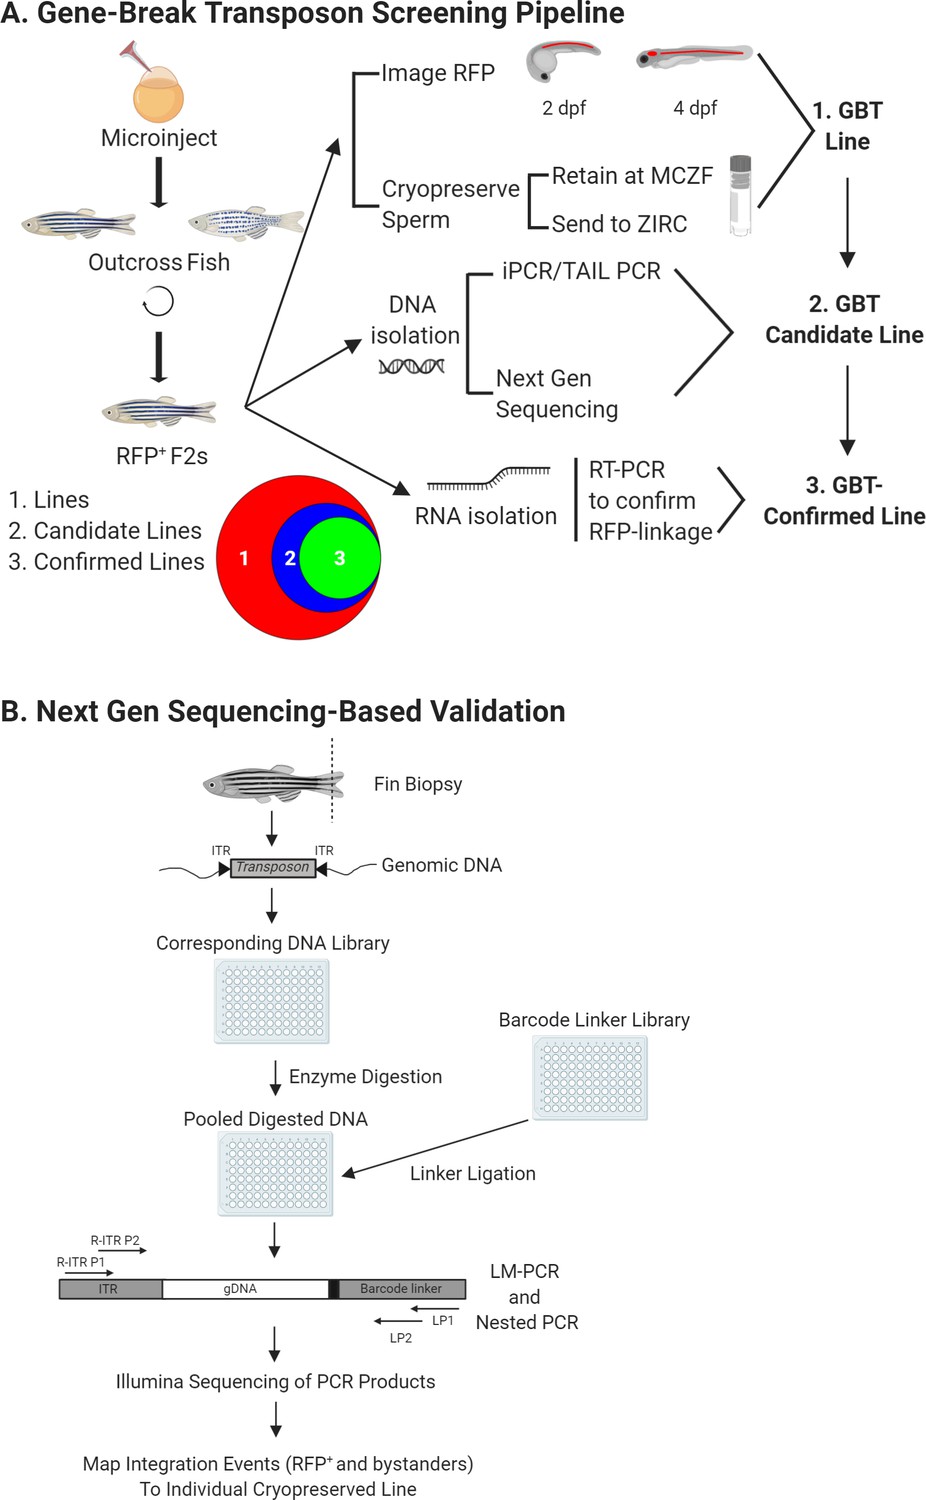
GBT screening pipeline.
(A) Overview of GBT screening pipeline. Wild-type embryos at 1 cell were co-injected with RP plasmid and Tol2 transposase mRNA to create F0 founders. These F0 larvae were screened for non-mosaic RP expression, raised, and outcrossed for two generations. Then, mRFP+ F2 heterozygous larvae were 3-dimensionally imaged at 2 and 4 dpf and this imaging data were uploaded to zfishbook (http://www.zfishbook.org/). Sperm from four F2 males in over 1200 robust mRFP expressing lines were cryopreserved using the Zebrafish International Resource Center (ZIRC) standard protocol and stored at both ZIRC and Mayo Clinic Zebrafish Core Facility (MCZF). DNA and RNA isolated from these four F2 males with cryopreserved sperm was utilized to perform next-generation sequencing and to confirm RFP linkage of candidate lines by manual PCRs (iPCR, TAIL-PCR, 5’ RACE and 3’ RACE). Venn diagram illustrates current library of over 1,200 GBT lines with 204 GBT-confirmed lines out of 348 molecularly analyzed GBT-candidate lines. (B) Next generation sequencing based validation for GBT integration loci. Fin biopsies from four F2 males were utilized as DNA source for the validation process to identify GBT integration loci. Extracted genomic DNA was fragmented, pooled in 96-wells plate, and ligated with barcode linker to identify each single male with cryopreserved sperm. Linker-mediated (LM) PCR with the primers, R-ITR P1 and LP1 and nested PCR with the primers, R-ITR P2 and LP2 were conducted to perform Illumina sequencing the final PCR products. The integration events of individual sperm-cryopreserved male were mapped on zebrafish reference genome sequence with bioinformatics analysis. This figure was created with BioRender.com. The area proportional Venn diagram was produced using BioVenn (http://www.biovenn.nl/).
Figure 3
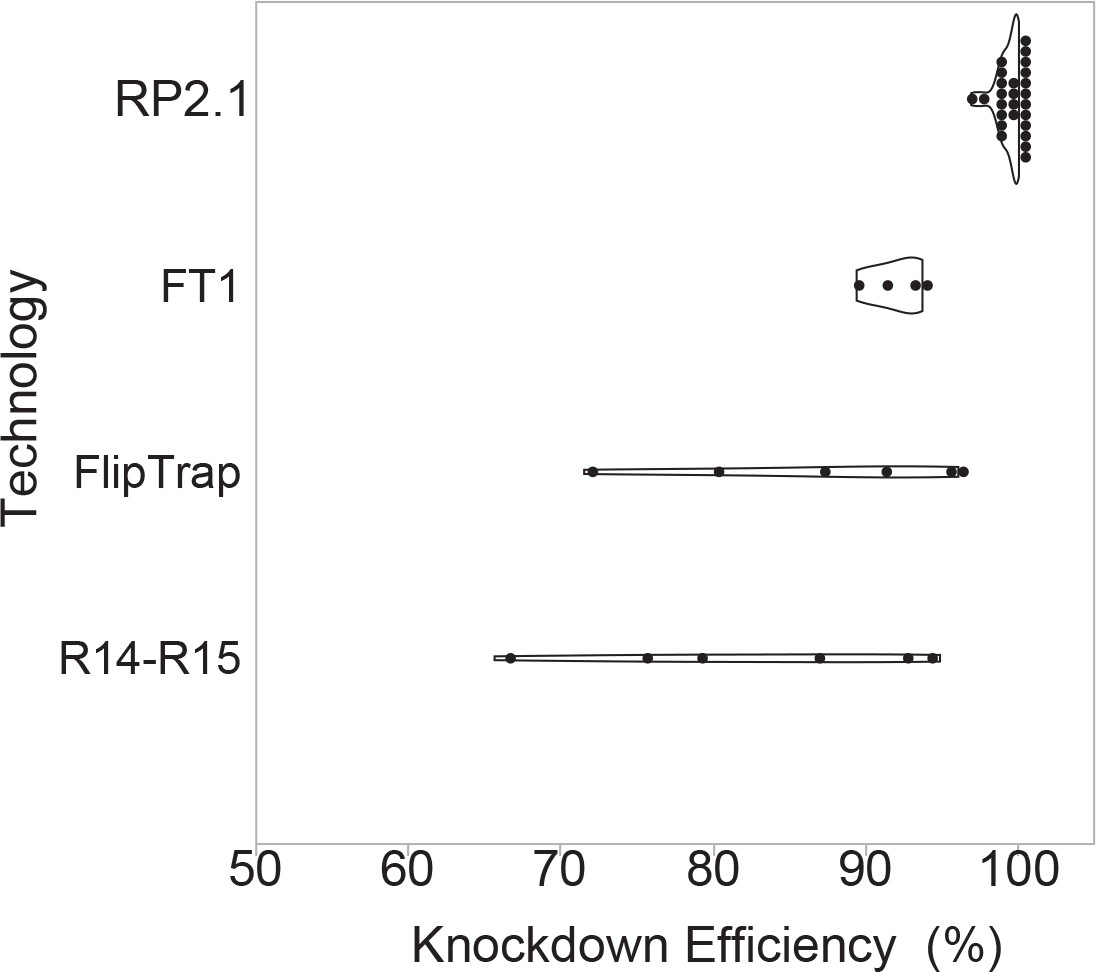
Knockdown efficiency of RP2.1 compared with previous gene-trap systems.
Violin plots comparing percent knockdown efficiency in the analyzed individual lines generated by four protein trap systems. All plots show median. The data of previous protein trap systems were converted from the data in the original articles, R14-R15, our initial R-series protein trap vectors (n = 6), (Clark et al., 2011a; FlipTrap, FlipTrap vectors (n = 6), Trinh et al., 2011; FT1, FT1 vector (n = 4), Ni et al., 2012; RP2.1, RP2.1 vector (n = 26), Clark et al., 2011a; Ding et al., 2013; Ding et al., 2017; El-Rass et al., 2017; Westcot et al., 2015 and unpublished data) (Figure 3—source data 1). The graph was made in JMP14 (SAS, Cary, NC).
-
Figure 3—source data 1
Numeric data analyzing knockdown efficiency in lrpprcmn0235Gt/mn0235Gt.
Source data analyzing relative expression of lrpprc mRNA in six dpf-larvae with RFP expression and dark liver phenotype crossed with heterozyous lrpprc+/mn0235Gt adults. no RT: no reverse transcriptase, RT: with reverse transcriptase, DL: dark liver phenotype, Cq: quantification cycle, d: delta, KD: knockdown, N/A: not applicable.
- https://cdn.elifesciences.org/articles/54572/elife-54572-fig3-data1-v2.xlsx
Figure 4 with 1 supplement
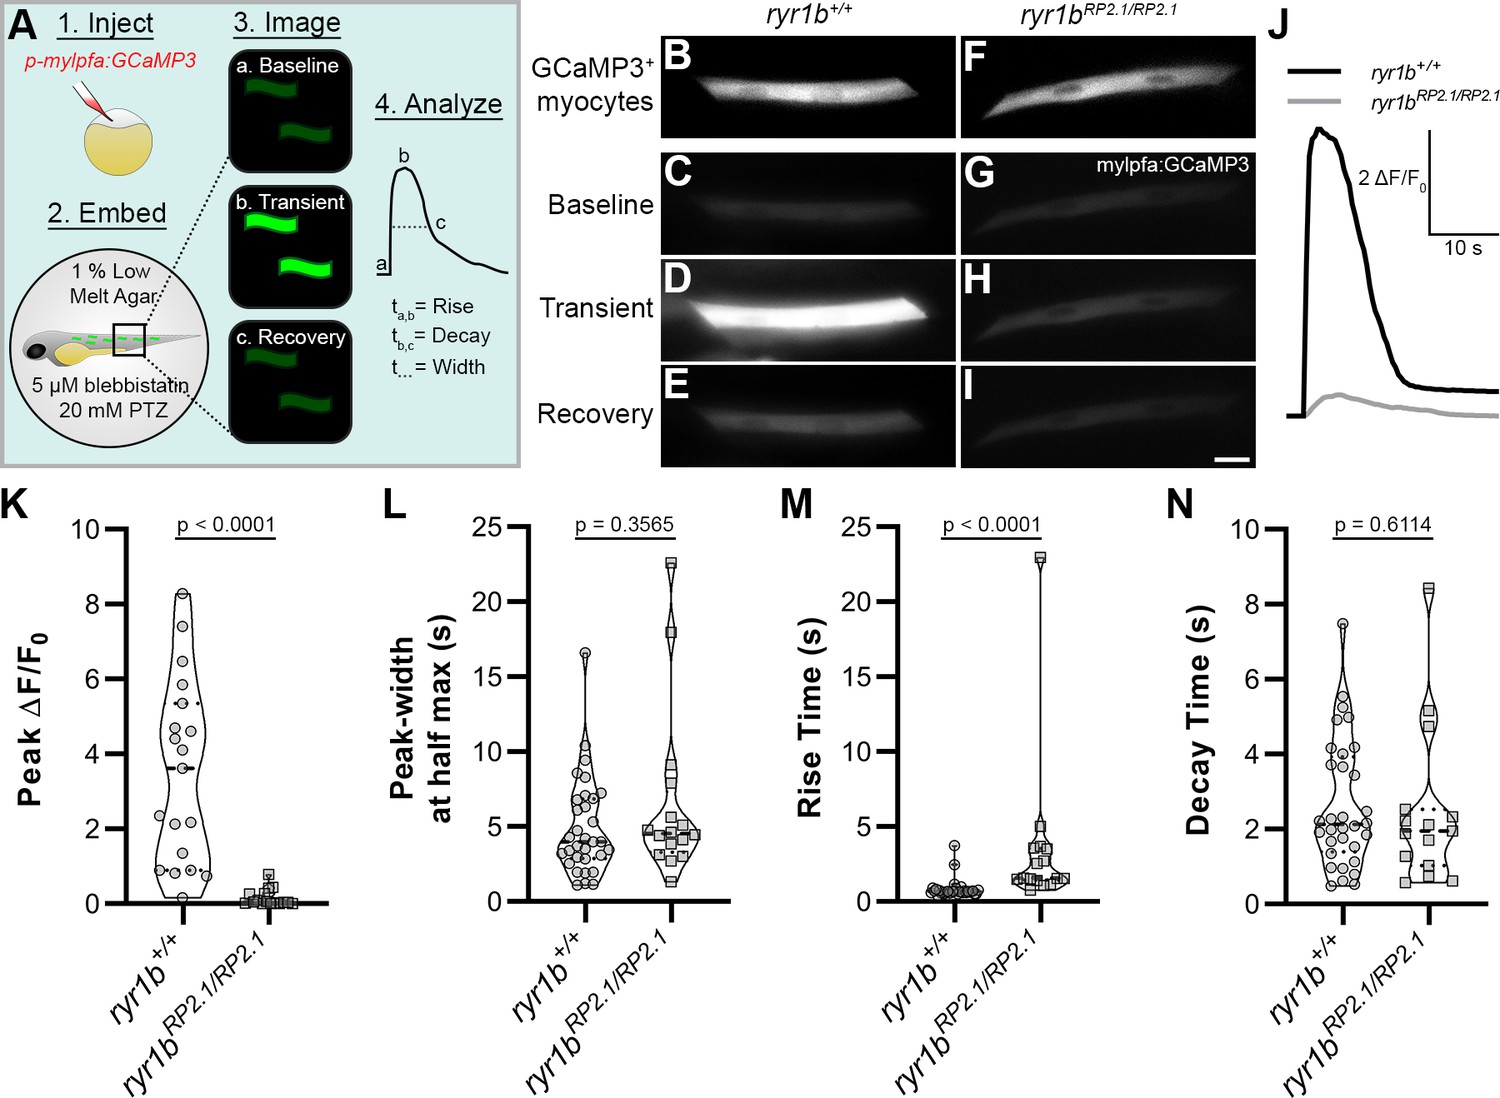
GBT demonstrates that neural disinhibition mediated Ca2+ transients in mylpfa+ myocytes require the ryanodine receptor ryr1b in vivo.
(A) Cartoon showing approach to assay Ca2+ transients in zebrafish myocytes through (1) injection of p-mylpfa:GCaMP3 (Baxendale et al., 2012) at the single cell stage, (2) embedding in 1% low melt agar/20 mM pentylenetetrazole (PTZ)/5 µM (S)-(-)-blebbistatin, (3) imaging for 3 min to record transient-associated changes in myocyte GCaMP3 fluorescence at 2 days post-fertilization, and (4) Ca2+ transient analysis. (B–I) Static images of GCaMP3 expressing myocytes (B, F) and representative GCaMP3 time-series images showing baseline (C, G), transient peak (D, H), and recovery (E, I) in ryr1b+/+ (C–E) and ryr1bmn0348Gt/mn0348Gt (G–I) animals, respectively. Scale bar = 20 µm. (J) Representative ∆F/F0 traces of Ca2+ transients from ryr1b+/+ (black) and ryr1bmn0348Gt/mn0348Gt (gray) myocytes. (K–N) Violin plots comparing transient peak ∆F/F0 (averaged within fish) (K), Ca2+ transient peak-width (L), Ca2+ transient rise (M) and decay (N) time between ryr1b+/+ and ryr1bmn0348Gt/mn0348Gt animals. All plots show median with interquartile range. For (K) nryr1b+/+ = 19 animals, nryr1bmn0348Gt/mn0348Gt = 16 animals. For (L–M) nryr1b+/+ = 32 cells, nryr1bmn0348Gt/mn0348Gt = 16 cells. For (N) nryr1b+/+ = 32 cells, nryr1bmn0348Gt/mn0348Gt = 15 cells. Data are compiled from four independent experiments containing at least two animals in each group. p-values determined using the Mann-Whitney U test. Effect size (Cohen’s d)=1.829 (K) and 0.866 (M). Source data can be found in Figure 4—source data 1 (K, L, M, N) and Figure 4—source data 2 (J).
-
Figure 4—source data 1
Summary data analyzing the parameters of Ca2+ transients in individual tested animals.
wt = ryr1b+/+, gbt348hom = ryr1bmn0348Gt/mn0348Gt, peak = peak ∆F/F0, num = number of transients/responses, totcell = number of cells, width = peak width at half max, rise = 10–90% rise time, and decay = 90–50% decay time.
- https://cdn.elifesciences.org/articles/54572/elife-54572-fig4-data1-v2.xlsx
-
Figure 4—source data 2
Individual ∆F/F0 traces of GCaMP3-fluorescence in both ryr1b+/+ and ryr1bmn0348Gt/mn0348Gt myocytes.
- https://cdn.elifesciences.org/articles/54572/elife-54572-fig4-data2-v2.xlsx
Figure 4—figure supplement 1
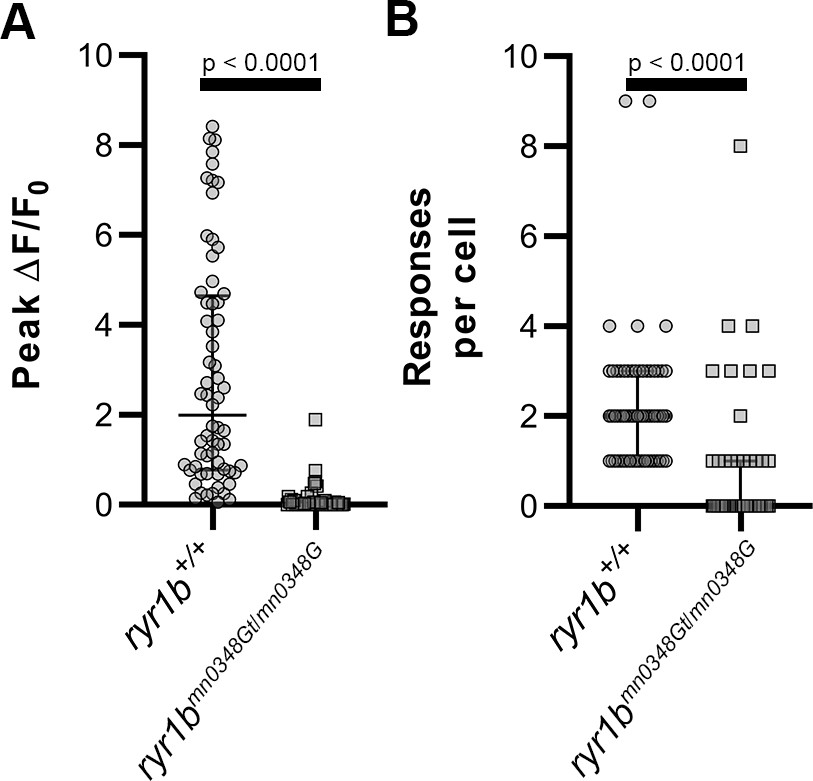
Ca2+ transients in ryr1b+/+ myocytes have higher peak amplitude and are more frequent than in ryr1bmn0348Gt/mn0348Gt myocytes.
(A) Dot plot comparing peak ∆F/F0 responses (averaged within cell) between ryr1b+/+ and ryr1bmn0348Gt/mn0348Gt animals. (B) Dot plot representing the number of responses per cell (≥0.05 ∆F/F0) recorded during the 3 min imaging window in ryr1b+/+ and ryr1bmn0348Gt/mn0348Gt animals. Plots show median with interquartile range. nryr1b+/+ = 64 cells, nryr1bmn0348Gt/mn0348Gt = 48 cells. Data were compiled from four independent experiments containing at least two animals in each group. p-values determined using the Mann-Whitney U test. Effect size (Cohen’s d)=1.445 (A) and 0.931 (B). Source data can be found in Figure 4—figure supplement 1—source data 1.
-
Figure 4—figure supplement 1—source data 1
Summary data analyzing the parameters of Ca2+ transients in individual tested cells.
wt = ryr1b+/+, gbt348hom = ryr1bmn0348Gt/mn0348Gt, peak = peak ∆F/F0, and peaknum = number of transients/responses ≥ 0.05 ∆F/F0.
- https://cdn.elifesciences.org/articles/54572/elife-54572-fig4-figsupp1-data1-v2.xlsx
Figure 5
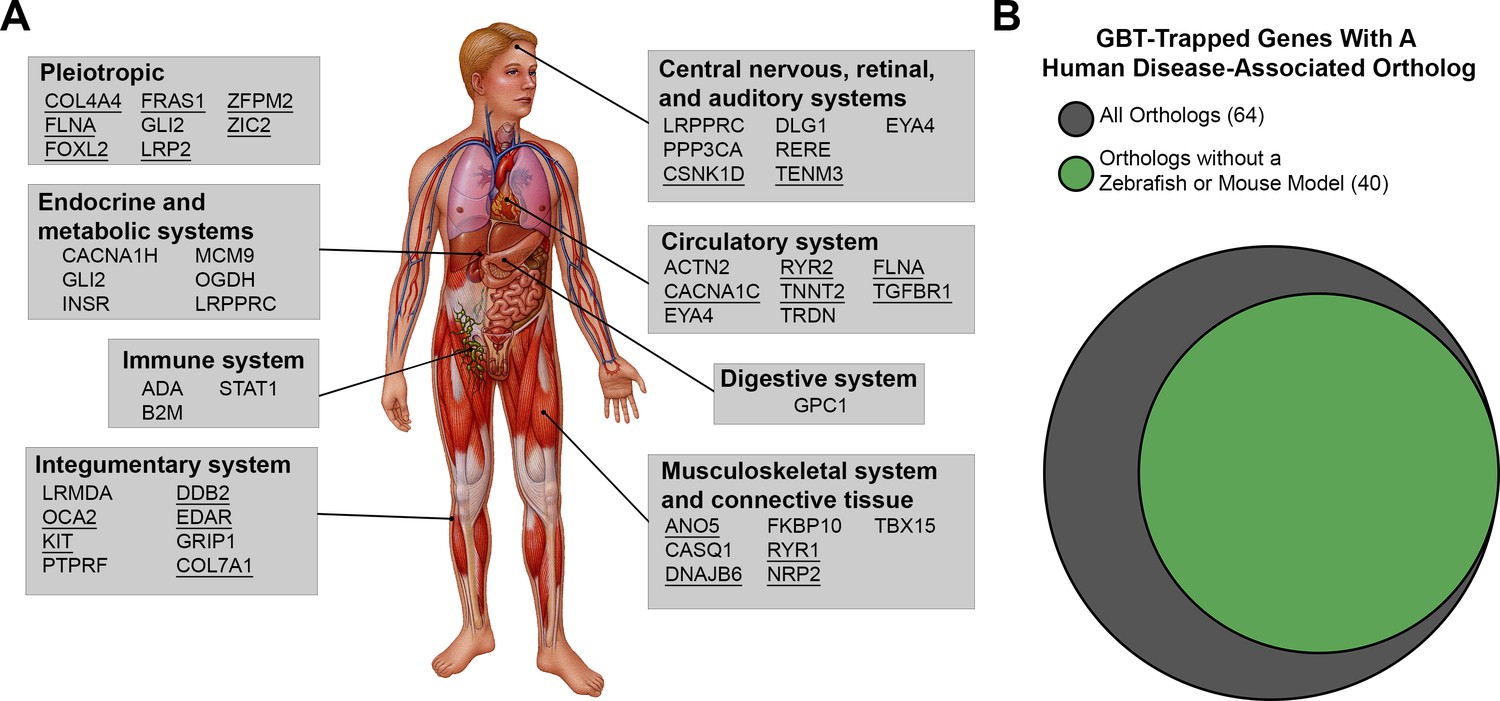
Disease-associated human orthologs of the GBT trapped genes are implicated in human genetic disorders of multiple organ systems.
(A) Representative human orthologs of the GBT-tagged genes are associated with genetic disorders in multi-organ systems. Image provided by Mayo Clinic Media Services. Underline: Disease causative genes with documentations of established disease model in mouse or zebrafish (B) Area proportional Venn diagram of 64 human orthologs tagged that are associated with human genetic disorders. 40 human orthologs of GBT-tagged genes are associated with human genetic disorders without an established disease model in zebrafish or mouse. Area proportional Venn diagram was produced using BioVenn (http://www.biovenn.nl/).
Figure 6 with 1 supplement
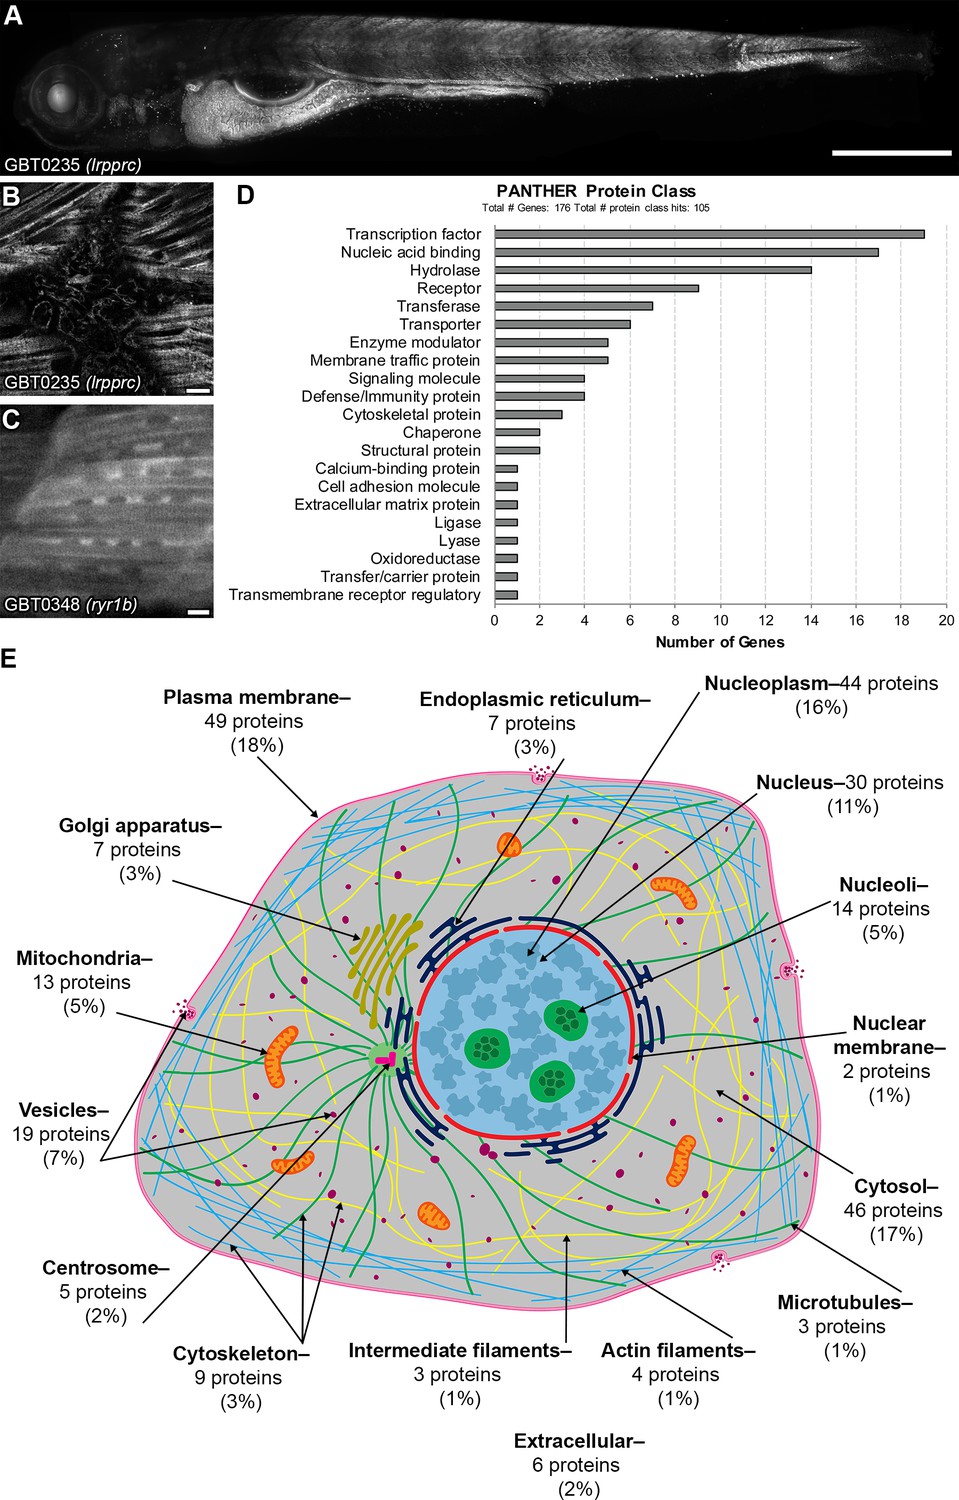
GBT-confirmed lines illuminate and disrupt genes encoding proteins with diverse functions and subcellular localizations.
-
Figure 6—source data 1
PANTHER protein classes of human orthologs tagged in GBT-confirmed lines.
- https://cdn.elifesciences.org/articles/54572/elife-54572-fig6-data1-v2.xlsx
Figure 6—figure supplement 1
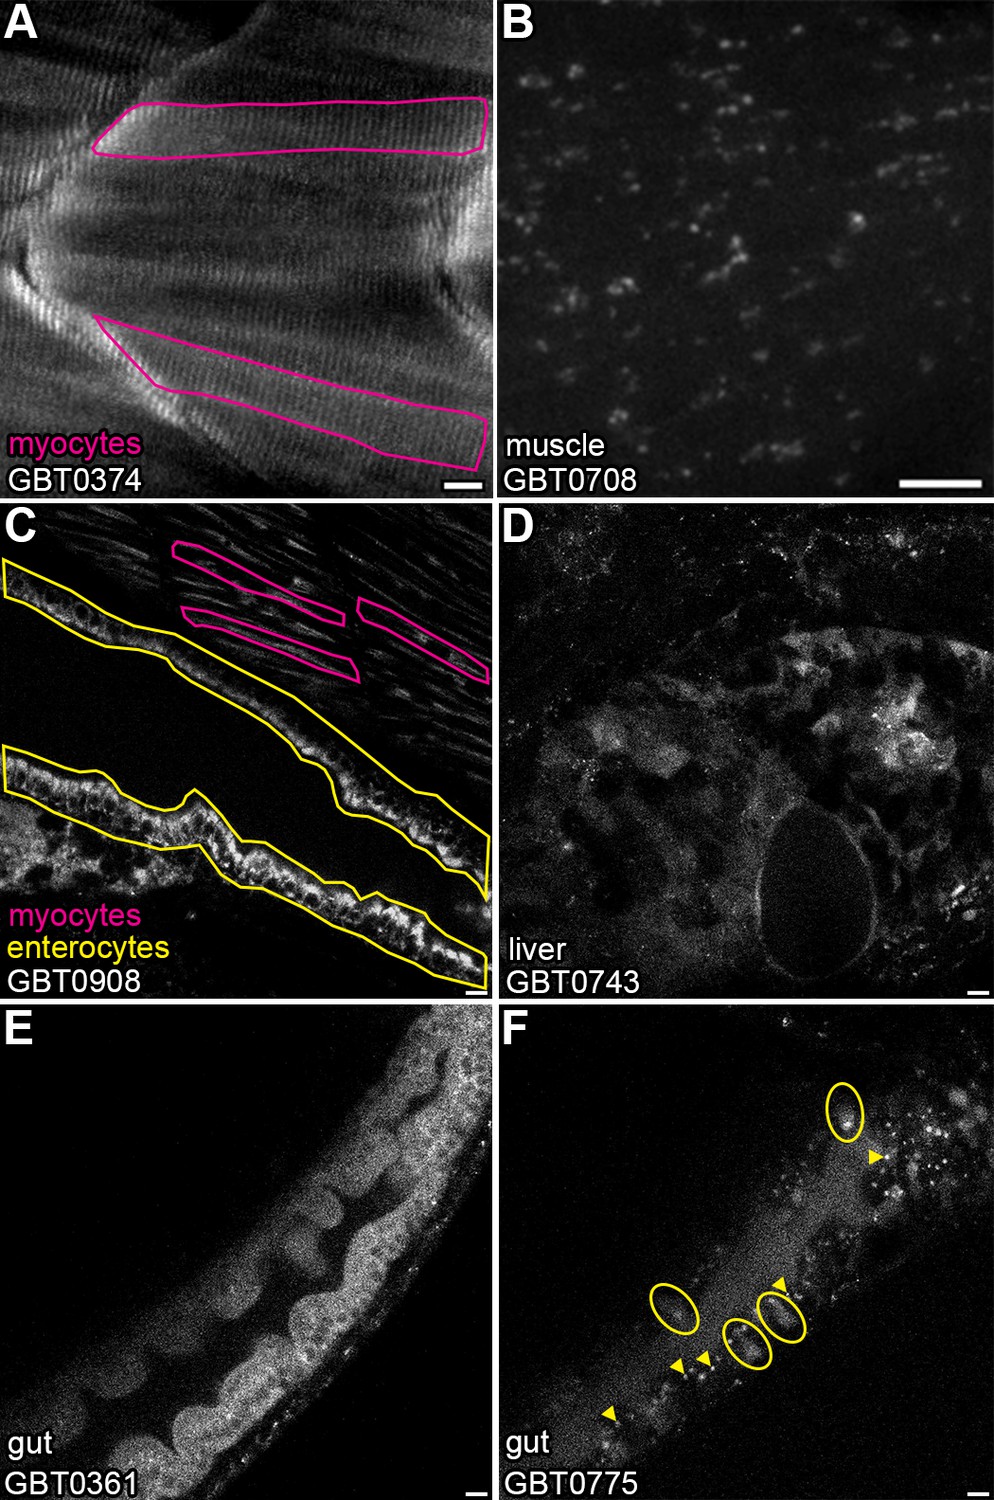
GBT protein traps illuminate diverse subcellular protein localizations.
(A–B) Confocal images demonstrating patterns of subcellular localization seen in muscle with strong banding in GBT0374 (candidate gene = unannotated transcript) (A) and large, diffuse puncta in GBT0708 (candidate gene = adam15) (B). Scale bars = 10 µm. (C) Confocal image of GBT0908 with ubiquitous, cytoplasmic expression. Note apical enrichment in enterocytes. (D) Confocal image of GBT0743 (candidate gene = pole4) with variegated expression in the liver. (E–F) Confocal images of gut expression with cytoplasmic, pan-enterocyte labeling in GBT0361 (E) in contrast with endomembrane puncta and enrichment of mRFP signal in a subset of enterocytes in GBT0775 (candidate gene = cd83) (F).
Figure 7
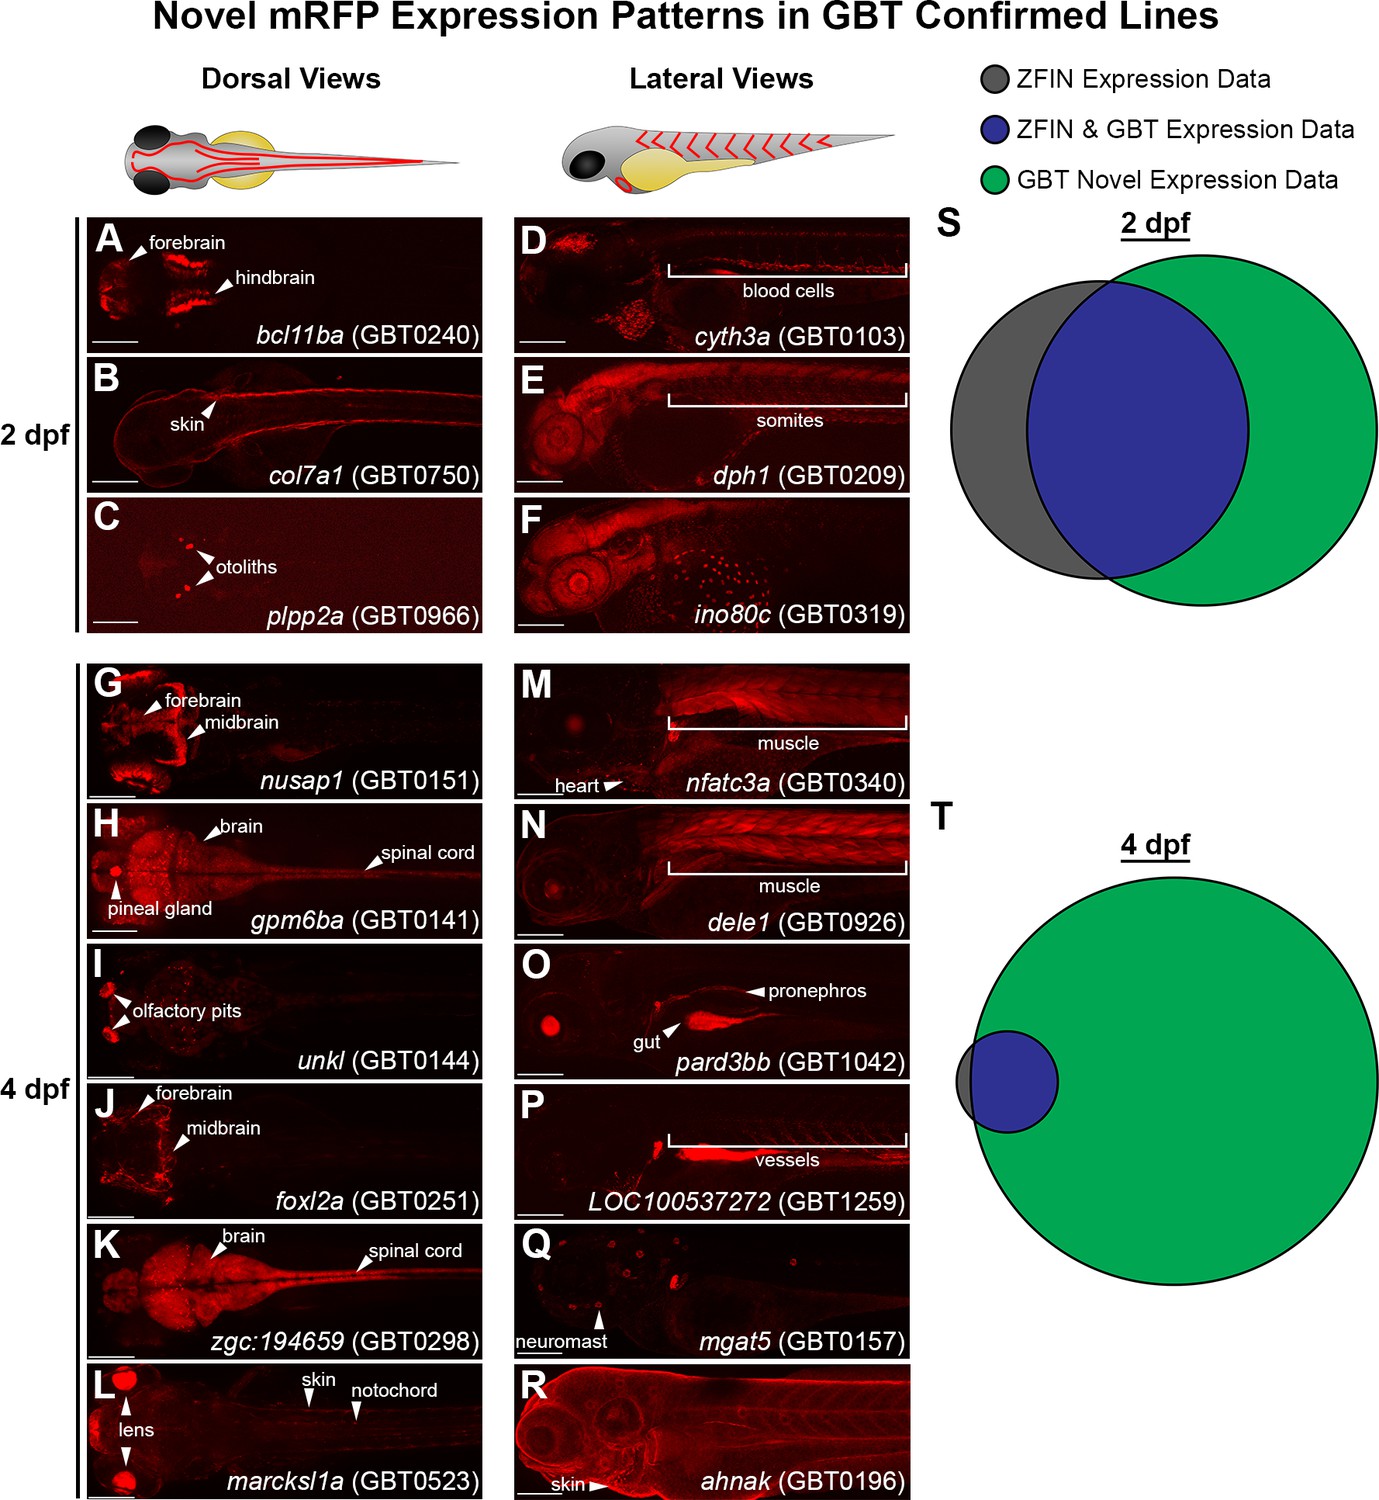
GBT protein trap elucidates novel gene expression patterns in embryonic and larval zebrafish.
(A–C) Dorsal views of 2 days post-fertilization (dpf) embryos with GBT protein trap mRFP expression patterns ranging from bcl11ba in the forebrain and hindbrain (A), to col7a1 in the skin (B), and plpp2a in the otoliths (C). (D-F) Lateral views of 2 dpf embryos with GBT protein trap mRFP expression patterns ranging from cyth3a in blood cells (D), to dph1 in somites (E), and ino80c around the yolk (F). (G–L) Dorsal views of GBT protein trap mRFP expression patterns in 4 dpf larvae including nusap1 in the forebrain and midbrain (G), gpm6ba in the brain, spinal cord, and pineal gland (H), unkl in the olfactory pits (I), foxl2a in the forebrain and midbrain (J), zgc:194659 in the brain and spinal cord (K), and marcksl1a in the lens, skin, and notochord (L). (M–R) Lateral views of GBT protein trap mRFP expression patterns in 4 dpf larvae including nfatc3a in heart and muscle (M), dele1 in muscle (N), pard3bb in the gut and pronephros (O), LOC100537272 in vessels (P), mgat5 in neuromasts (Q), and ahnak in skin (R). Scale bars = 200 µm. (S–T) Area proportional Venn diagrams of 193 genes trapped in GBT-confirmed lines comparing the ZFIN-assembled database with mRFP expression in GBT lines available through zfishbook at two dpf (S) and four dpf (T). 67 (35%) and 174 (90%) of 193 genes trapped in GBT-confirmed lines have no description about wild-type expression at 2 dpf and 4 dpf, respectively.
Tables
Key resources table
| Reagent type (species) or resource | Designation | Source or reference | Identifiers | Additional information |
|---|---|---|---|---|
| Recombinant DNA reagent | pGBT-RP2.1 | Clark et al., 2011a | RRID:Addgene_31828, Genbank: HQ335170 | Figure 1A |
| Recombinant DNA reagent | pGBT-RP2.2 | This paper | Genbank: MT815588 | Figure 1A |
| Recombinant DNA reagent | pGBT-RP2.3 | This paper | Genbank: MT815589 | Figure 1A |
| Recombinant DNA reagent | pGBT-RP8.1 | This paper | Genbank: MT815590 | Figure 1B |
| Recombinant DNA reagent | pGBT-RP8.2 | This paper | Genbank: MT815591 | Figure 1B |
| Recombinant DNA reagent | pGBT-RP8.3 | This paper | Genbank: MT815592 | Figure 1B |
| Recombinant DNA reagent | pGBT-RP7.1 | This paper | An intermediate construct to create pGBT-RP8.1 | |
| Recombinant DNA reagent | pGBT-RP6.1 | This paper | An intermediate construct to create pGBT-RP8.1 | |
| Recombinant DNA reagent | pGBT-RP5.1 | This paper | An intermediate construct of pGBT-RP8.1 | |
| Recombinant DNA reagent | pre(−1)GBT-RP5.1 | This paper | An intermediate construct of pGBT-RP5.1 | |
| Recombinant DNA reagent | pre(−2)GBT-RP5.1 | This paper | An intermediate construct of pGBT-RP5.1 | |
| Recombinant DNA reagent | pre(−3)GBT-RP5.1 | This paper | An intermediate construct of pGBT-RP5.1 | |
| Recombinant DNA reagent | pKTol2-SE | Clark et al., 2011b | ||
| Recombinant DNA reagent | pUC57-I-SceI_LoxP_Splice | This paper | DNA source to create pre(−3)GBT-RP5.1 | |
| Recombinant DNA reagent | pUC57 | Genscript | SD1176 | |
| Recombinant DNA reagent | pKTol2gC-nlsTagBFP | This paper | DNA source to create pre(−2)GBT-RP5.1 | |
| Recombinant DNA reagent | pGBT-R15 | Clark et al., 2011a | RRID:Addgene_31826, Genbank ID: HQ335168 | |
| Recombinant DNA reagent | pGBT-PX | Sivasubbu et al., 2006 | RRID:Addgene_31824, Genbank ID: HQ335166 | |
| Recombinant DNA reagent | pCR4-bactmIntron | This paper | DNA source to create pGBT-RP8.1 | |
| Recombinant DNA reagent | pCR4-bact_I1 | This paper | DNA source of the carp beta-actin intron amplified from pGBT-RP2.1 | |
| Recombinant DNA reagent | pCR4-TOPO | Invitrogen | 450030 | |
| Recombinant DNA reagent | pEXPR-mylpfa:GCaMP3 | Baxendale et al., 2012 | ||
| Chemical compound, drug | phenylthiocarbamide | Sigma-Aldrich | P7629 | |
| Chemical compound, drug | tricaine | Sigma-Aldrich | A5040 | |
| Chemical compound, drug | low melt agarose | Fisher Scientific | BP1360 | |
| Chemical compound, drug | pentylenetetrazole | Sigma-Aldrich | P6500 | |
| Chemical compound, drug | (S)-(-)-blebbistatin | Tocris | 1852 | |
| Chemical compound, drug | β-mercaptoethanol | Sigma-Aldrich | M6250 | |
| Chemical compound, drug | proteinase K | Roche | 3115879001 | |
| Commercial assay or kit | T4 DNA ligase | New England Biolabs | M0202S | |
| Commercial assay or kit | RNeasy Micro Kit | QIAGEN | 74004 | |
| Commercial assay or kit | Stainless steel beads | Next Advance | SSB05 | |
| Commercial assay or kit | MaXtract High Density tubes | QIAGEN | 129056 | |
| Commercial assay or kit | SuperScript II Reverse Transcriptase | Thermo Fisher Scientific | 18064014 | |
| Commercial assay or kit | SensiFAST SYBR Lo-ROX kit | Bioline | BIO-94005 | |
| Commercial assay or kit | QIAquick Gel Extraction Kit | QIAGEN | 28704 | |
| Software, algorithm | GraphPad Prism 8 | GrapgPad | RRID:SCR_002798 | |
| Software, algorithm | R | www.R-project.org | RRID:SCR_001905 | |
| Software, algorithm | R-Studio | www.rstudio.com/ | ||
| Software, algorithm | pwr package | https://CRAN.R-project.org/package=pwr | ||
| Software, algorithm | wilcox.test function | www.R-project.org | ||
| Software, algorithm | coin package | Hothorn et al., 2006, Hothorn et al., 2008 | ||
| Software, algorithm | outliers package | https://CRAN.R-project.org/package=outliers | ||
| Software, algorithm | effsize package | https://CRAN.R-project.org/package=effsize | ||
| Software, algorithm | JMP version 14 | http://www.jmp.com/en_us/software/jmp.html | RRID:SCR_014242 | |
| Software, algorithm | SynFind | https://genomevolution.org/CoGe/SynFind.pl | ||
| Software, algorithm | BLASTP | http://blast.ncbi.nlm.nih.gov/Blast.cgi?PROGRAM=blastp&PAGE_TYPE=BlastSearch&LINK_LOC=blasthome | RRID:SCR_001010 | |
| Software, algorithm | BioMart, Ensembl tool | http://useast.ensembl.org/biomart/martview/ | RRID:SCR_002344 | |
| Software, algorithm | PANTHER version 14.1 | http://www.pantherdb.org/ | RRID:SCR_004869 | |
| Software, algorithm | FIJI | https://fiji.sc/ | RRID:SCR_002285 | |
| Software, algorithm | MetaMorph Microscopy Automation and Image Analysis Software | Molecular Devices | RRID:SCR_002368 | |
| Software, algorithm | Digidata 1440A | Molecular Devices | ||
| Software, algorithm | Clampex 10.3 | Molecular Devices | ||
| Software, algorithm | Integrative Genomics Viewer (version 2.4.19) | Thorvaldsdóttir et al., 2013 | RRID:SCR_011793 | |
| Software, algorithm | Galaxy | https://usegalaxy.org/ | RRID:SCR_006281 | |
| Software, algorithm | BAMtools | Barnett et al., 2011 | RRID:SCR_015987 | |
| Software, algorithm | TopHat | Kim et al., 2013 | RRID:SCR_013035 | |
| Software, algorithm | Zebrafish Information Network (ZFIN) | https://zfin.org/ | RRID:SCR_002560 | |
| Software, algorithm | Ensembl | https://useast.ensembl.org/index.html | RRID:SCR_002344 | |
| Software, algorithm | InParanoid version 8 | http://inparanoid.sbc.su.se/cgi-bin/index.cgi | RRID:SCR_006801 | |
| Software, algorithm | The Human Protein Atlas | www.proteinatlas.org | RRID:SCR_006710 | |
| Software, algorithm | UniProtKB | https://www.uniprot.org/ | RRID:SCR_004426 | |
| Software, algorithm | Online Mendelian Inheritance in Man (OMIM) | https://omim.org/ | RRID:SCR_006437 | |
| Software, algorithm | Mouse Genome Informatics (MGI) | http://www.informatics.jax.org | RRID:SCR_006460 | |
| Software, algorithm | zfishbook | https://zfishbook.org/ | RRID:SCR_006896 | |
| Other | RNA-seq dataset | White et al., 2017 | GRCz10.WTSI.36hpf.1.bam | ftp://ftp.ensembl.org/pub/data_files/danio_rerio/GRCz10/rnaseq/ |
| Other | RNA-seq dataset | White et al., 2017 | GRCz10.WTSI.48hpf.1.bam | ftp://ftp.ensembl.org/pub/data_files/danio_rerio/GRCz10/rnaseq/ |
| Other | RNA-seq dataset | White et al., 2017 | GRCz10.WTSI.4dpf.1.bam | ftp://ftp.ensembl.org/pub/data_files/danio_rerio/GRCz10/rnaseq/ |
Additional files
-
Supplementary file 1
Genes disrupted in GBT-confirmed lines.
Table lists the tagged genes (or unannotated coding sequence) of GBT-confirmed lines, genomic location and orientation of integrated loci, novel expression at 2 and 4 dpf, their human orthologs, and disease associations of their human orthologs. Blue text: published GBT-confirmed line, Red text: Integration locus in unannotated coding sequence, *: RNA sequencing reads mapping on the unannotated loci in at least one public dataset, †; zebrafish paralogs of GBT-tagged genes with one human ortholog, ‡: sequence of single 5’ or 3’ RACE product matched to two separate transcripts, *: integration locus mapped to GRCz11, γ: line previously published as GBT0136, d: denotes replicate genes with distinct integration events.
- https://cdn.elifesciences.org/articles/54572/elife-54572-supp1-v2.xlsx
-
Supplementary file 2
Homozygous phenotypes in GBT-confirmed lines.
List of GBT-confirmed line number, tagged gene, a summary of their established phenotype, and references where more detailed characterization of each line can be found.
- https://cdn.elifesciences.org/articles/54572/elife-54572-supp2-v2.xlsx
-
Supplementary file 3
Publicly available human disease models.
Established models of 32 human genetic disorders associated with 24 human orthologs of the GBT-tagged genes are generated by alternative genetic approaches in zebrafish and mice. This table listed the GBT ID of the tagged genes, both zebrafish tagged genes and their human orthologs, disease association of the human orthologs, disease ontology ID, number of models in zebrafish and mice listed in ZFIN (http://zfin.org/)(Ruzicka et al., 2019) and MGI (http://www.informatics.jax.org)(Bult et al., 2019) databases and references.
- https://cdn.elifesciences.org/articles/54572/elife-54572-supp3-v2.xlsx
-
Supplementary file 4
Subcellular localization of human orthologs tagged in GBT-confirmed lines.
Subcellular localizations of 177 human orthologs tagged in GBT-confirmed lines were listed using experimental data from Human Protein Atlas (www.proteinatlas.org) (Uhlén et al., 2015) and knowledge base data from the UniProt knowledge base (UniProtKB, https://www.uniprot.org/, UniProt Consortium, 2018). *: UniProt annotation data, †: GO – Cellular Component, ‡: sequence of single 5’ or 3’ RACE product matched to two separate transcripts.
- https://cdn.elifesciences.org/articles/54572/elife-54572-supp4-v2.xlsx
-
Supplementary file 5
Oligo names and sequences.
- https://cdn.elifesciences.org/articles/54572/elife-54572-supp5-v2.xlsx
-
Supplementary file 6
The R code and output for sample size estimation and statistical analysis.
Individual worksheets in Figure 4—source data 1 and Figure 4—figure supplement 1—source data 1 represent the individual ‘.csv’ files read into R to perform these analyses and are named accordingly.
- https://cdn.elifesciences.org/articles/54572/elife-54572-supp6-v2.pdf
-
Transparent reporting form
- https://cdn.elifesciences.org/articles/54572/elife-54572-transrepform-v2.docx
Download links
A two-part list of links to download the article, or parts of the article, in various formats.
Downloads (link to download the article as PDF)
Open citations (links to open the citations from this article in various online reference manager services)
Cite this article (links to download the citations from this article in formats compatible with various reference manager tools)
Building the vertebrate codex using the gene breaking protein trap library
eLife 9:e54572.
https://doi.org/10.7554/eLife.54572


