A universal reading network and its modulation by writing system and reading ability in French and Chinese children
- Cognitive Neuroimaging Unit, CEA DRF/I2BM, INSERM, NeuroSpin Center, Université Paris-Saclay, France
- State Key Laboratory of Cognitive Neuroscience and Learning & IDG/McGovern Institute for Brain Research, Beijing Normal University, China
- Université de Paris, LaPsyDÉ, CNRS, France
- Laboratoire de Sciences Cognitives et Psycholinguistique (ENS, CNRS, EHESS), Ecole Normale Supérieure, PSL Research University, France
- Collège de France, Université PSL Paris Sciences Lettres, France
- School of Psychological and Cognitive Sciences, Beijing Key Laboratory of Behavior and Mental Health, Peking University, China
- PekingU-PolyU Center for Child Development and Learning, Peking University, China
Figures
Figure 1 with 1 supplement
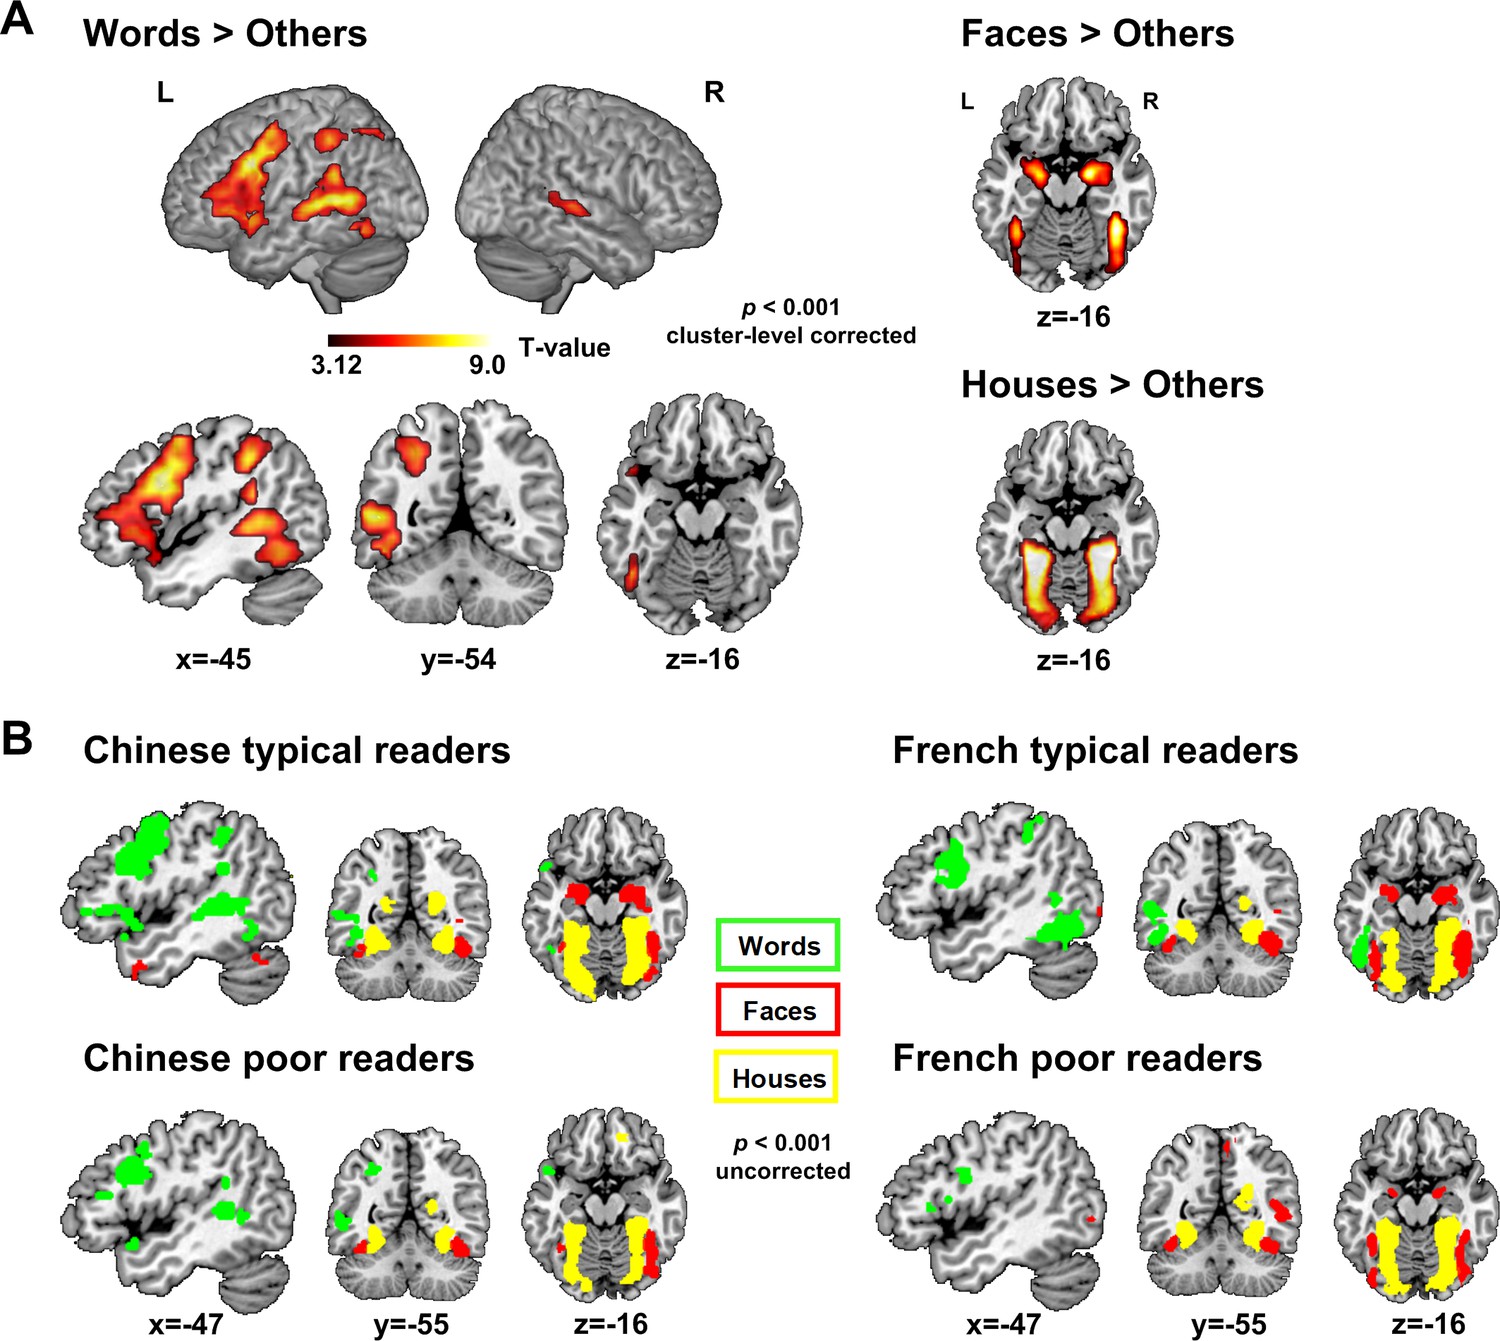
Category-specific circuits.
(A) Category-specific circuits across all participants (voxel-level p<0.001, cluster-level FWE corrected p<0.05). On the left, the reading circuit identified by the contrast Words > [Faces, Houses] and on the right: Face-selective (Faces > [Words, Houses]) and House selective regions (Houses > [Words, Faces]). (B) Category-specific circuits in each of the four groups (voxel-level p<0.001, cluster-level uncorrected). On the left, category-specific activations in Chinese typical readers (above) and Chinese poor readers (below). On the right, category-specific activations in French typical readers (above) and French poor readers (below). Green: regions selectively activated by words (Words > [Face, House]); Red: regions selectively by faces (Face > [Word, House]); Yellow: regions selectively activated by Houses (House > [Word, Face]).
Figure 1—figure supplement 1
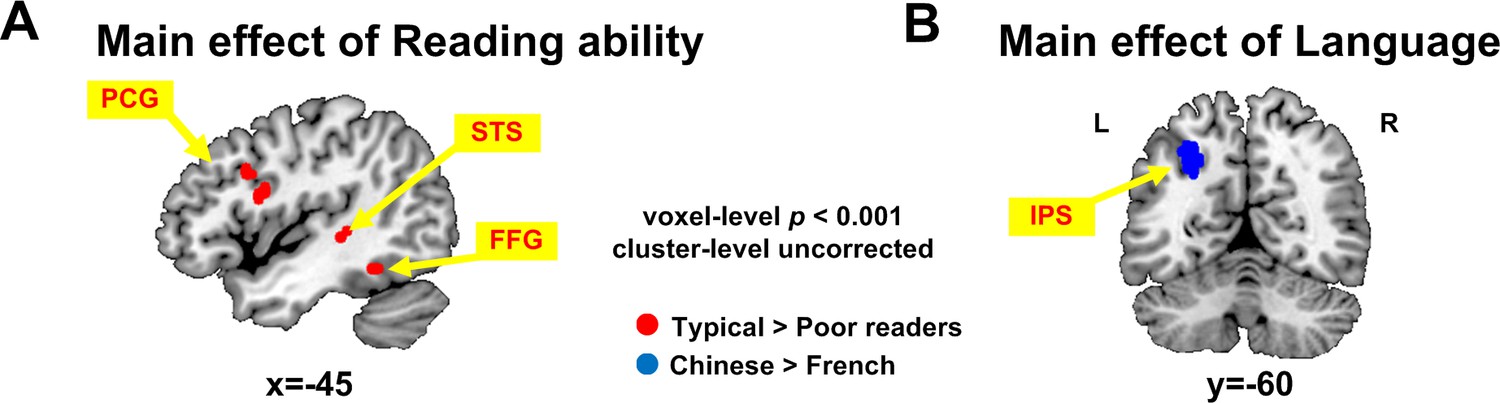
Language × reading ability ANOVA analysis on children's activation to words.
(A) A few voxels in the left fusiform gyrus, left precentral and left superior temporal sulcus reached the voxel threshold (p=0.001) in the 2 × 2 language × reading ability ANOVA analysis. Only the left precentral region survived the multiple comparisons within the mask of word-specific voxels. (B) A main effect of language was observed in the left intra-parietal sulcus (55 voxels, pFWE_corr = 0.004, z = 4.29 at [−30 −60 39]), significant at corrected-level within the mask of word-specific voxels, due to larger activation in Chinese than French children.
Figure 2
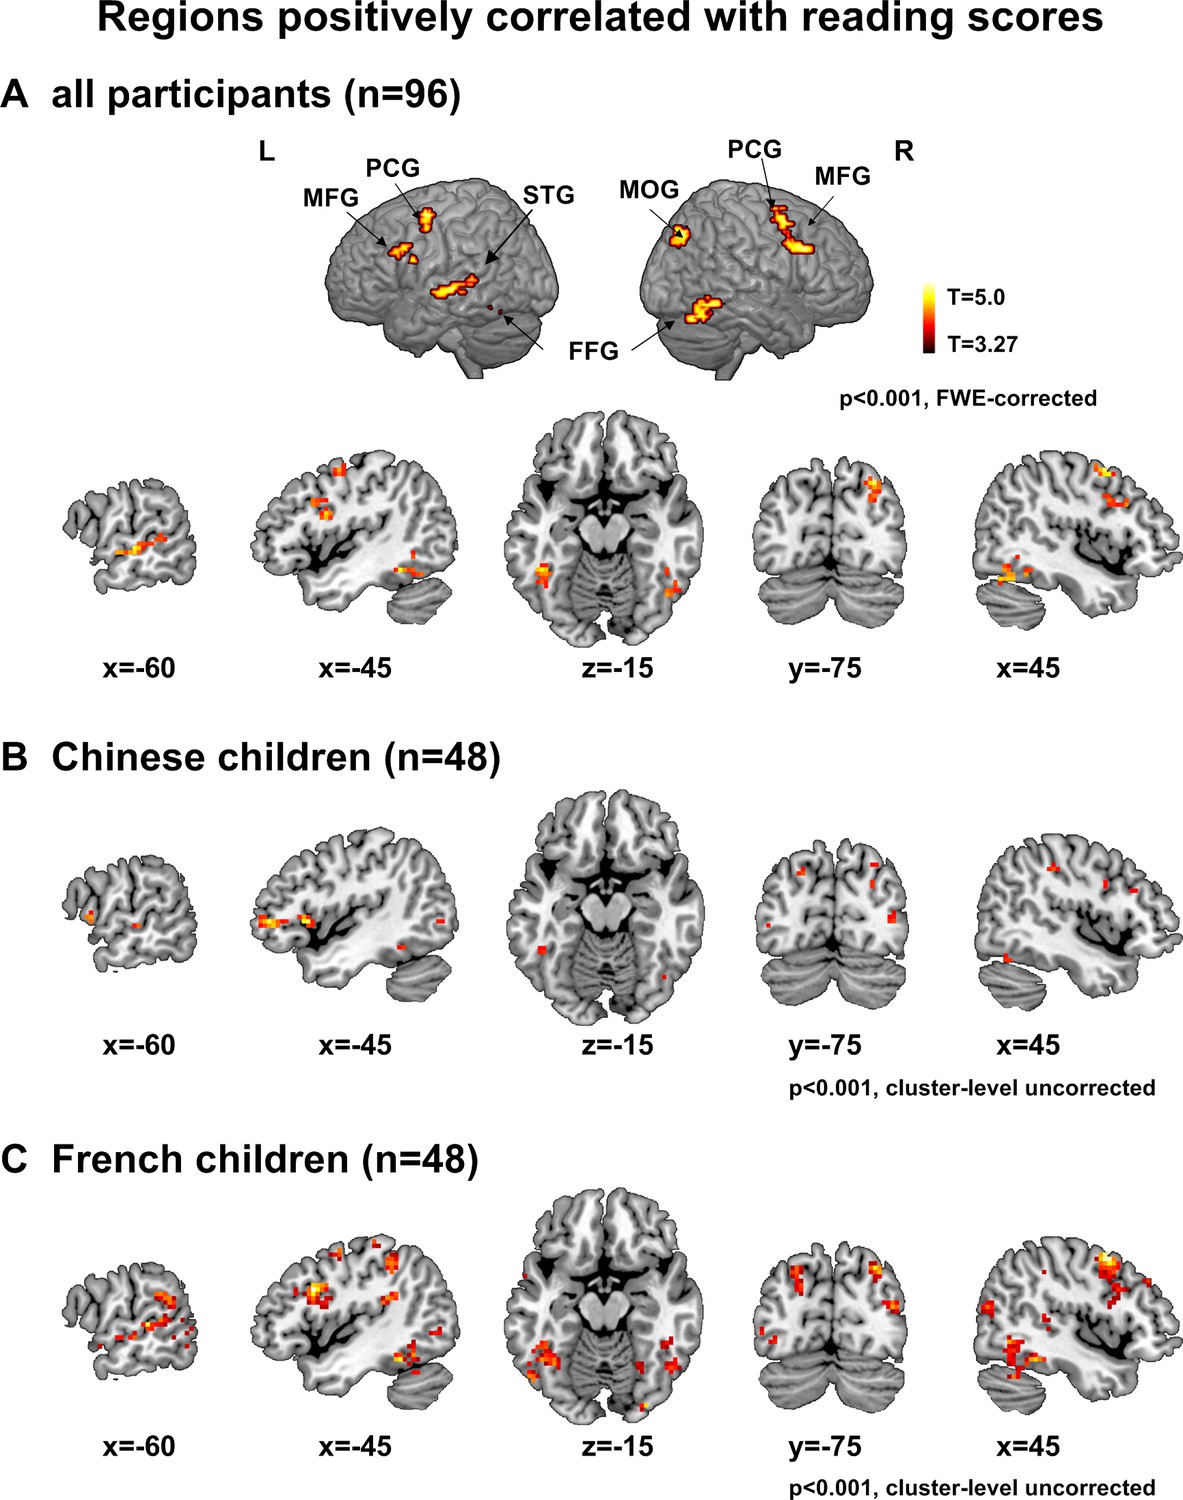
Neural correlates of inter-individual variability in reading scores.
(A) The figure shows the regions whose activation in the words versus fixation contrast was positively correlated with reading scores across all participants at the whole-brain level (voxel-wise p<0.001 and cluster-wise p<0.05 FWE corrected).(B, C) Regions positively correlated with reading scores in Chinese and French children (voxel-wise p<0.001, cluster-level uncorrected).
Figure 3

Regions of interest (ROIs) used to analyze the data.
(A) Each sphere represents a peak reported in the literature; Labels in white background indicate foci reported in meta-analyses of dyslexia in alphabetic languages; Labels in black background indicate foci reported in meta-analyses of Chinese reading. (B) ROIs used in the current study. Coordinates of foci (see the upper graph) belonging to the same functional region were averaged to create 6-mm-radius spheres at the averaged coordinates. Dots are colored according to their correlation with reading scores across all children. Red dots represent ROIs whose activation to words versus fixation were positively correlated with individual children’s reading scores, while gray dots represent non-significant ROIs (pFDR < 0.05). MFG: Middle Frontal Gyrus, PCG: Pre-Central Gyrus, STS: Superior Temporal Sulcus, MTG, Middle Temporal Gyrus, FFG: Fusiform gyrus, IOG: Inferior Occipital Gyrus.
Figure 4 with 1 supplement
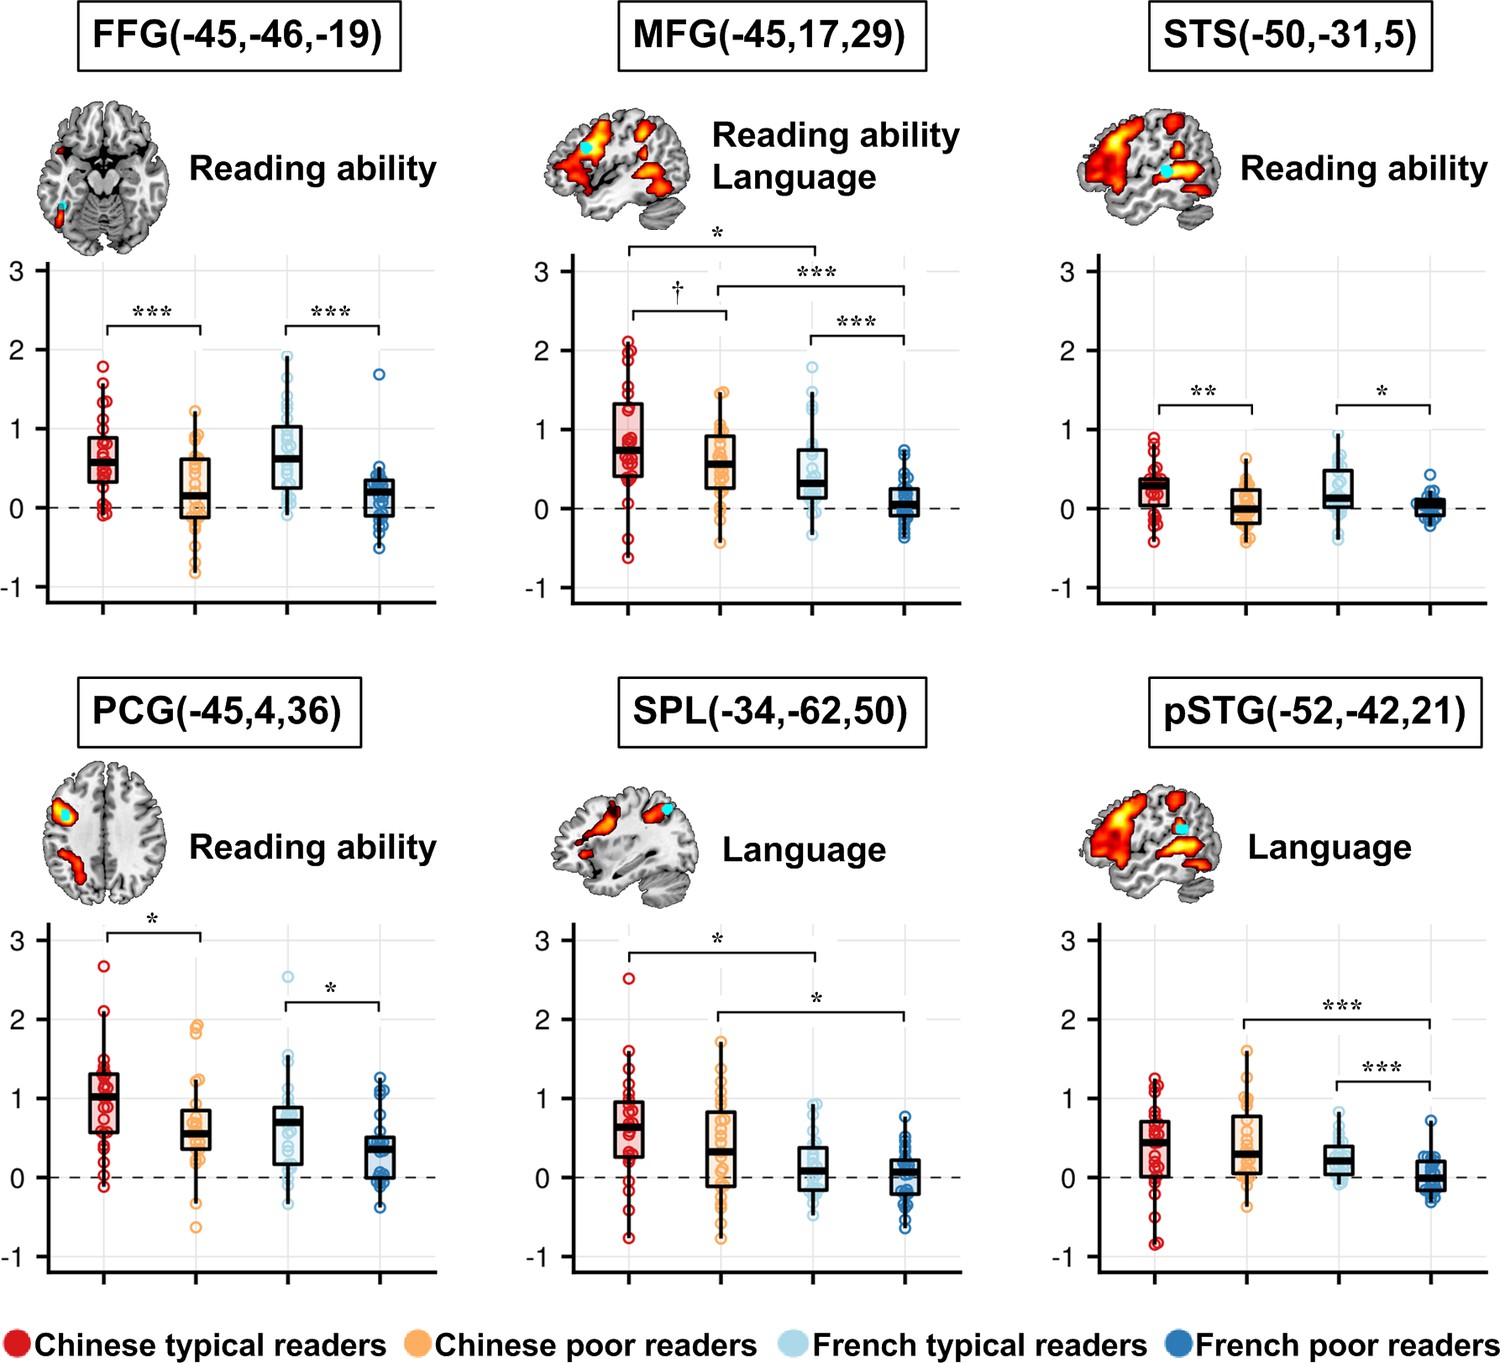
Effects of Reading ability and Language on the words versus fixation contrast in the selected ROIs.
Brain slices showed the literature-based ROIs (cyan) overlaid on the reading circuit (red-yellow) in our participants (Words > [Faces, Houses]). Plots show the mean activation for words > fixation, in each of the four groups and ROIs. The words ‘Reading ability’ and ‘Language’ indicate a significant main effect of reading ability and a main effect of language in the ANOVA (after FDR correction for a total of 13 ROIs). Note that no ROI showed a significant interaction of language × reading ability. Brackets indicate significant post-hoc analyses: **p<0.005, **<0.01, *<0.05, †=0.052.
-
Figure 4—source data 1
Activation to words in each of the four groups and ROIs.
- https://cdn.elifesciences.org/articles/54591/elife-54591-fig4-data1-v2.xlsx
Figure 4—figure supplement 1
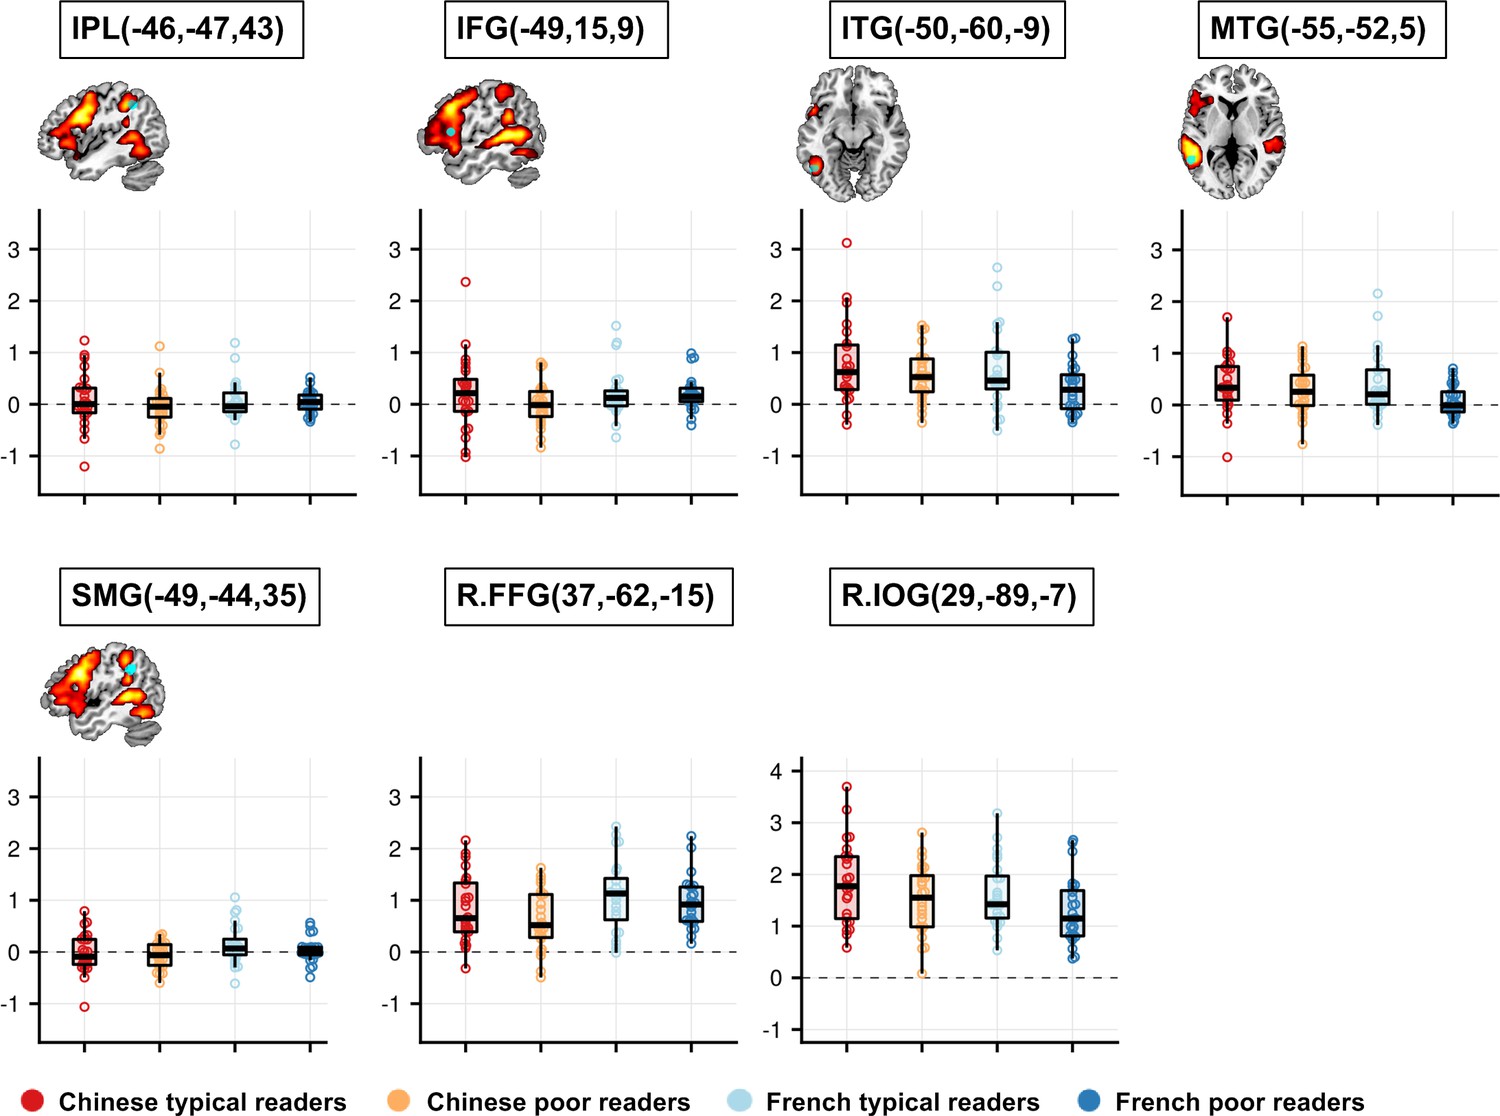
Profile of activation to words (relative to fixation) in ROIs where the ANOVA did not reveal a significant effect.
Two ROIs on the right hemisphere (e.g. R.FFG and R.IOG) were not within the reading circuit identified in our participants. Neither the interaction of language × reading ability nor main effect of reading ability or language was found significant in these ROIs.
Figure 5 with 1 supplement
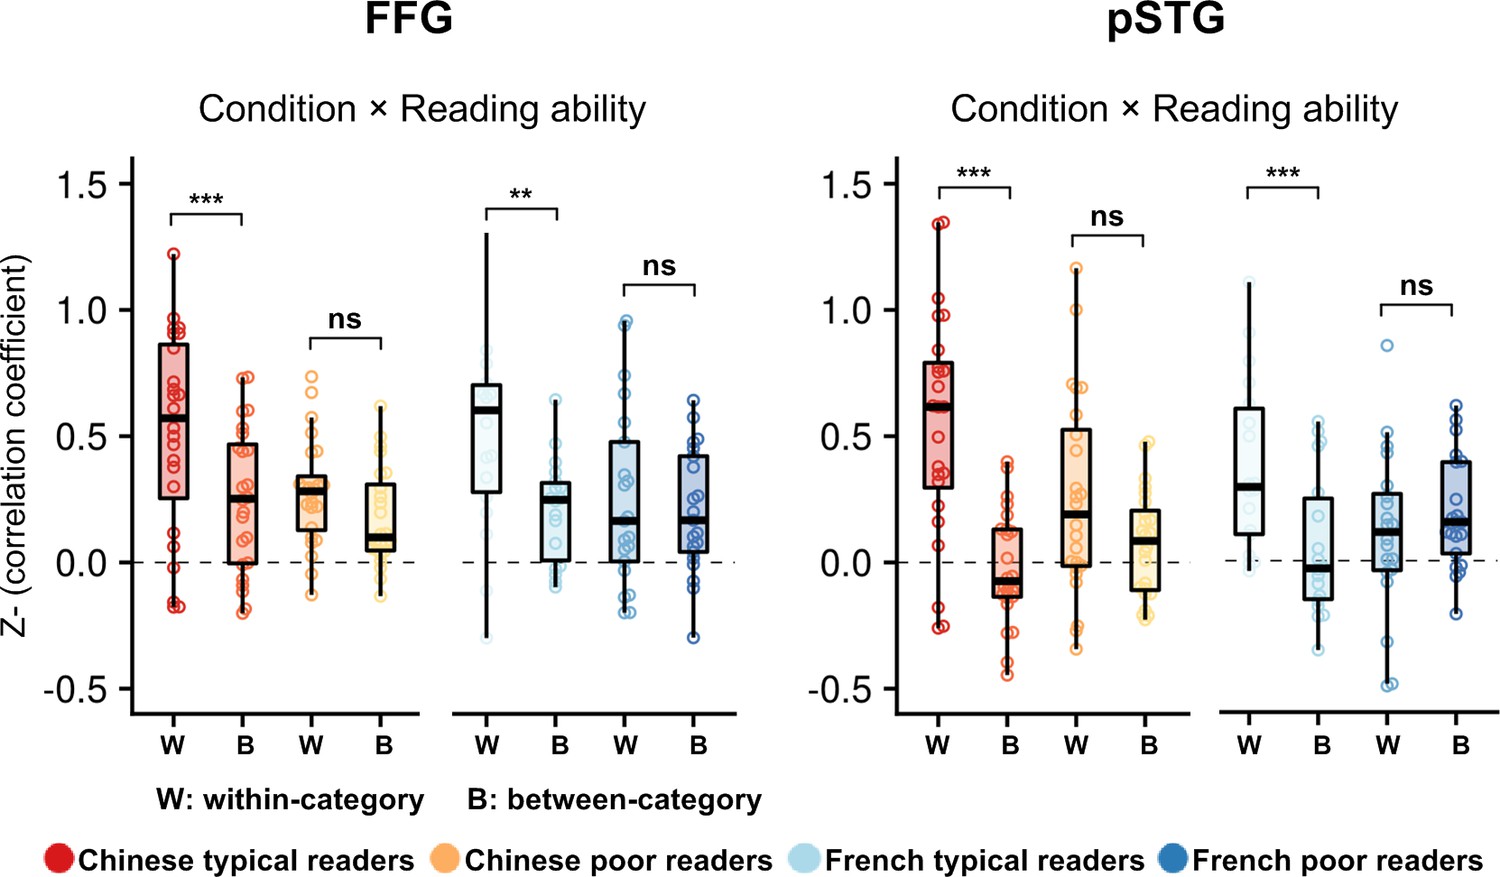
Multivariate pattern analysis indicating that the word-induced activation is less reproducible in poor readers.
Within the designated ROIs, we computed the correlation coefficient of the multivoxel patterns for the word versus fixation contrast in run 1 and in run 2 (within-category correlation). For the between-category coefficient, the plots show the average correlation coefficient between words and faces, words and houses and faces and houses between run 1 and run 2. In each plot, the correlation is presented for the Chinese children on the left of the plot and for French children on the right. The words ‘Condition × Reading ability’ indicate a significant interaction between condition (within vs. between) and the status of children (typical vs. poor readers) (after FDR correction for a total of 13 ROIs). Typical readers, but not poor readers, exhibited a significant similar pattern of activation to words from one run to the next in the left FFG and pSTG, suggesting that the weaker activation for words in poor readers was not due to greater anatomical variability in this group but was related to genuinely less reproducible activation patterns than in typical readers.
-
Figure 5—source data 1
Correlation coefficients for within-category patterns and between-category patterns in each of the four groups and ROIs.
- https://cdn.elifesciences.org/articles/54591/elife-54591-fig5-data1-v2.xlsx
Figure 5—figure supplement 1
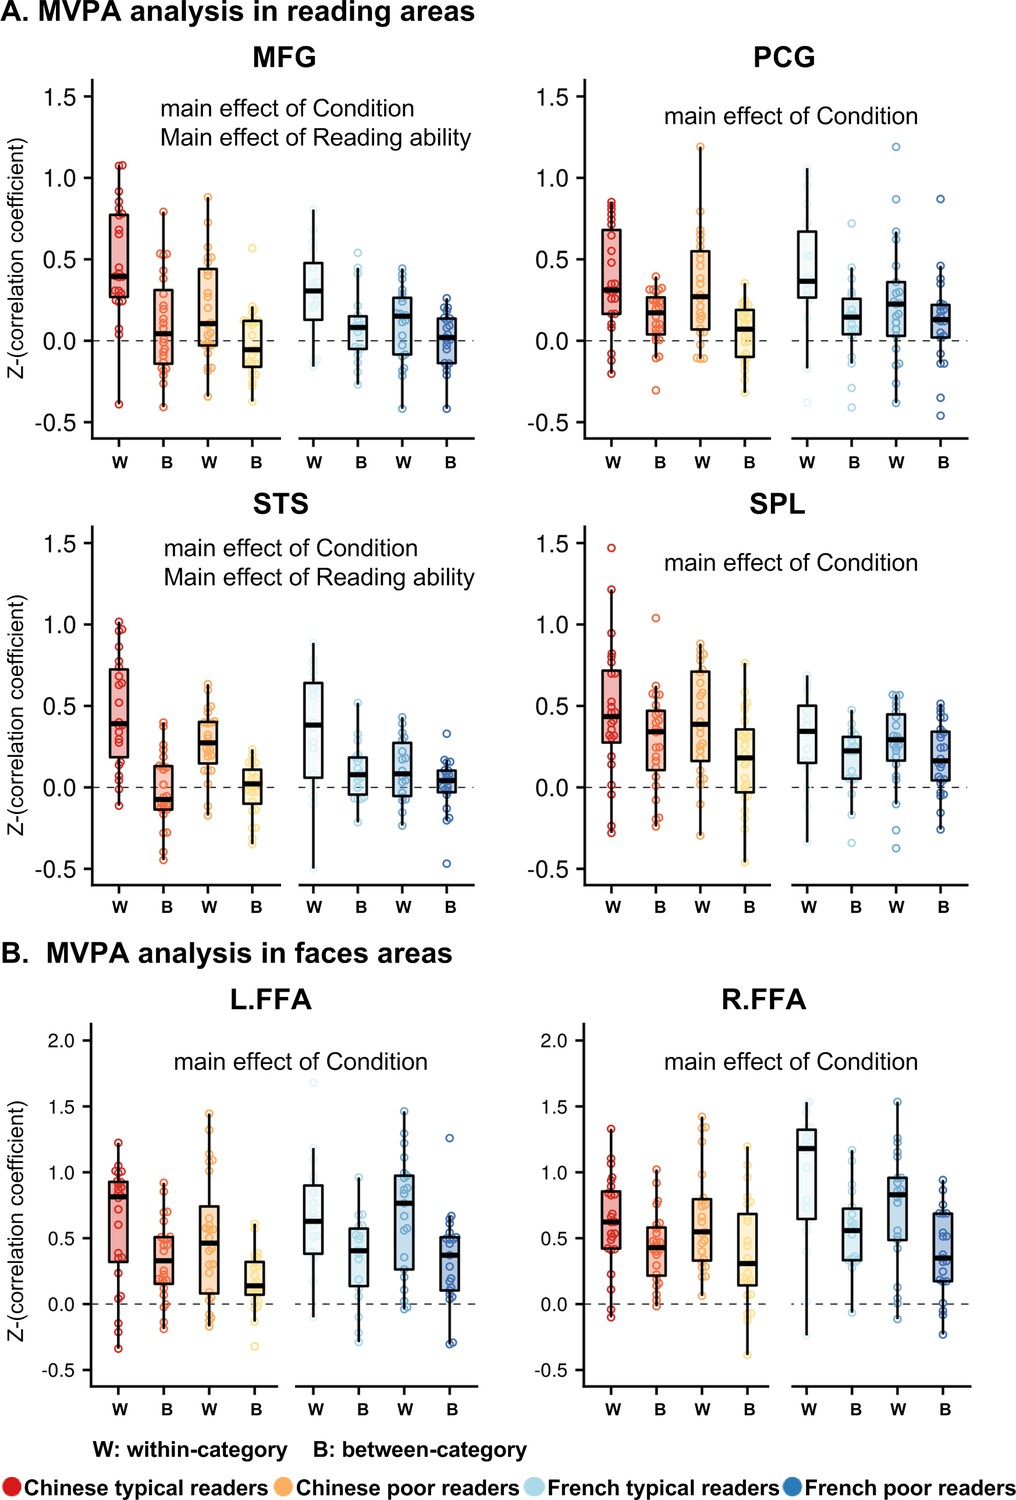
MVPA analyses.
All these regions showed a main effect of condition, with higher correlation coefficients in within-category than between-category. Besides, the left MFG and STS showed a main effect of reading ability, with lower correlation coefficients across runs in poor readers than typical readers. Note that neither the interaction of condition × reading ability nor condition × reading ability × language reached significant in above regions.
Figure 6
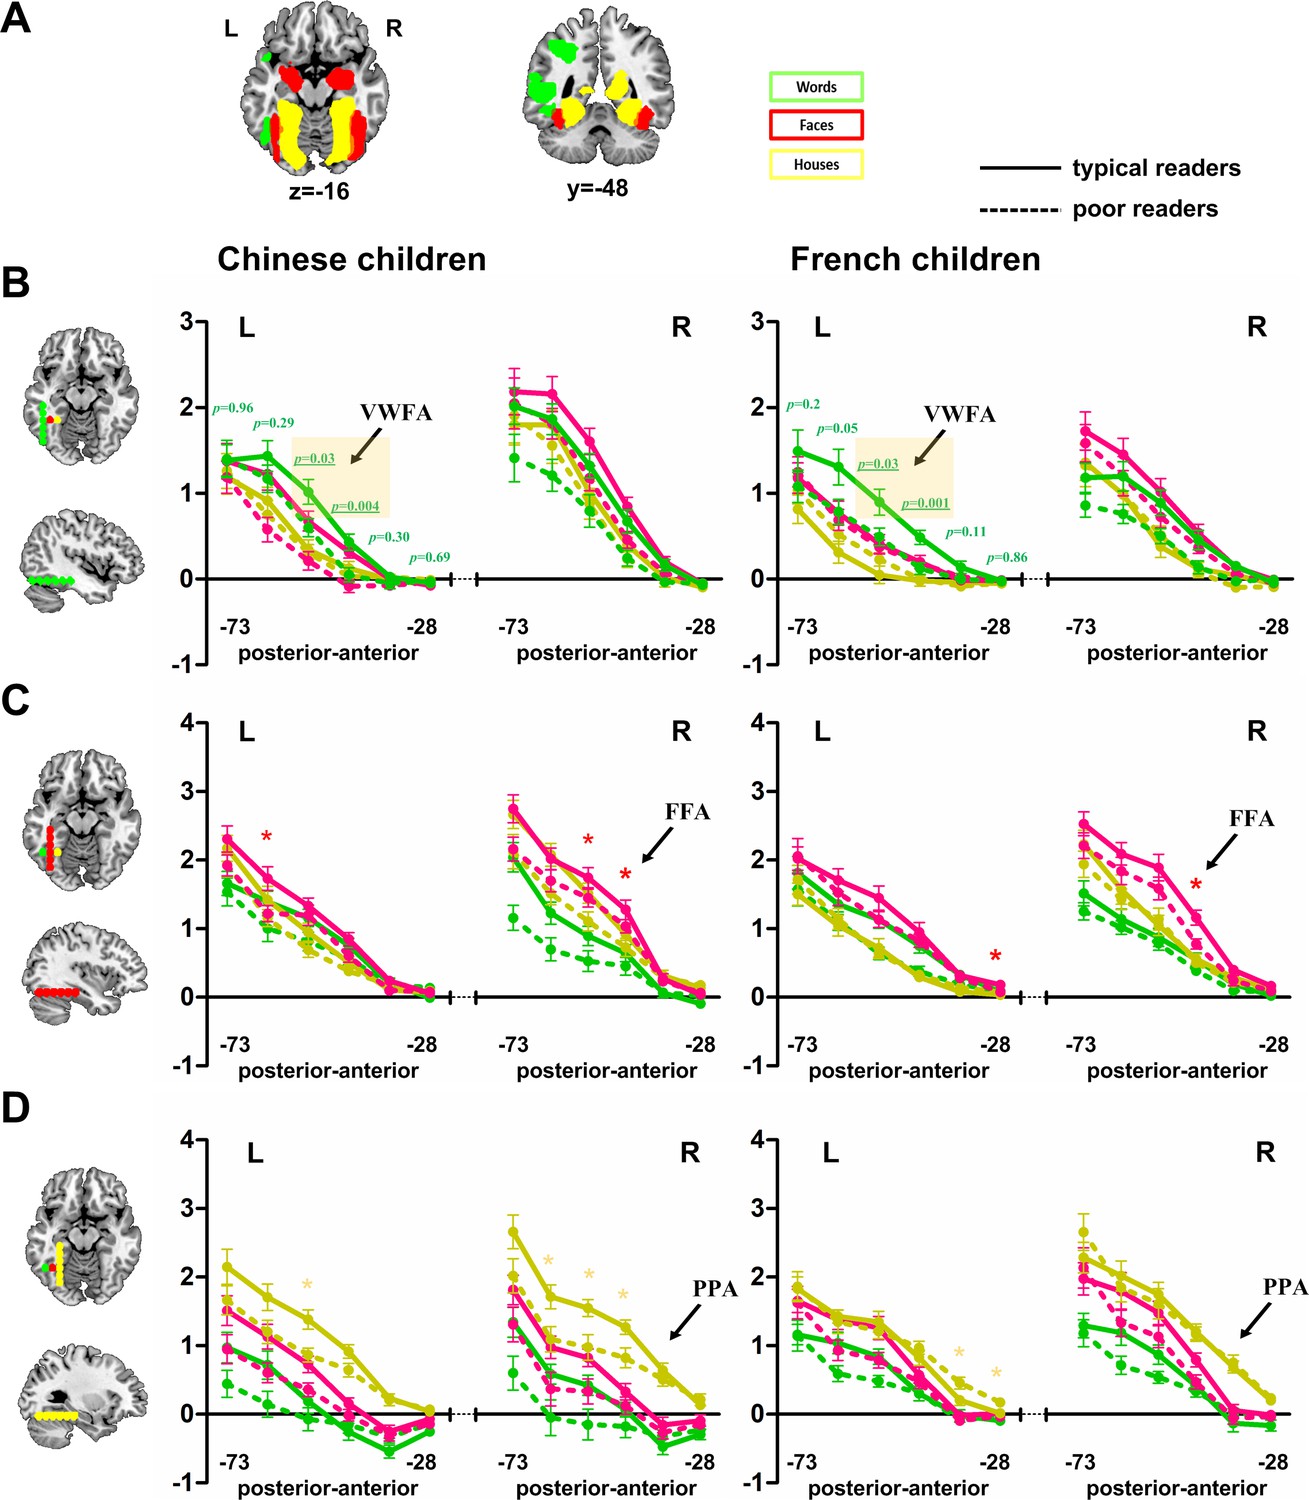
Mosaic of preferences for different visual categories (Words, Faces and Houses) in the ventral visual cortex.
(A) Slices show the activation difference between a given category and the others across all participants. (B) fMRI signal change of Words relative to fixation in both Chinese and French children in successive cortical sites along the y-axis (green dots on the left cortical slices) with constant x = ±48 and z = −16. Both Chinese and French poor readers have significantly lower activations relative to their controls at a specific y site of y = −46 (pFDR_corr = 0.048 and pFDR_corr = 0.012 respectively for Chinese and French children) corresponding to the classical coordinates of the VWFA (Cohen et al., 2002). (C) fMRI signal change of Faces relative to fixation in both Chinese and French children in successive cortical sites along the y-axis (red dots on the left cortical slices) with constant x = ±39 and z = −16. (D) fMRI signal change of Houses relative to fixation in both Chinese and French children in successive cortical sites along the y-axis (yellow dots on the left cortical slices) with constant x = ±30 and z = −16. Additional files.
-
Figure 6—source data 1
Activaions to different categories relative to fixation in ROIs in the ventral visual cortex.
- https://cdn.elifesciences.org/articles/54591/elife-54591-fig6-data1-v2.xlsx
Author response image 1
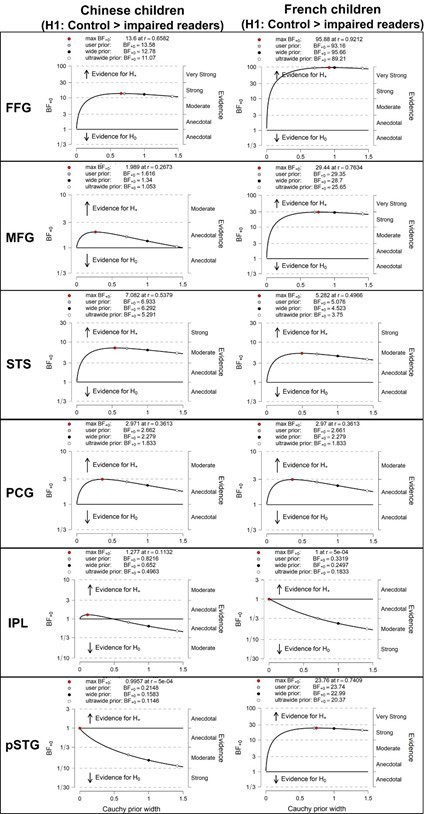
Sensitivity analysis with a variety of priors in the post-hoc pairwise comparisons between controls and impaired-readers in each language (Left: Chinese children; Right: French children).
Author response image 2
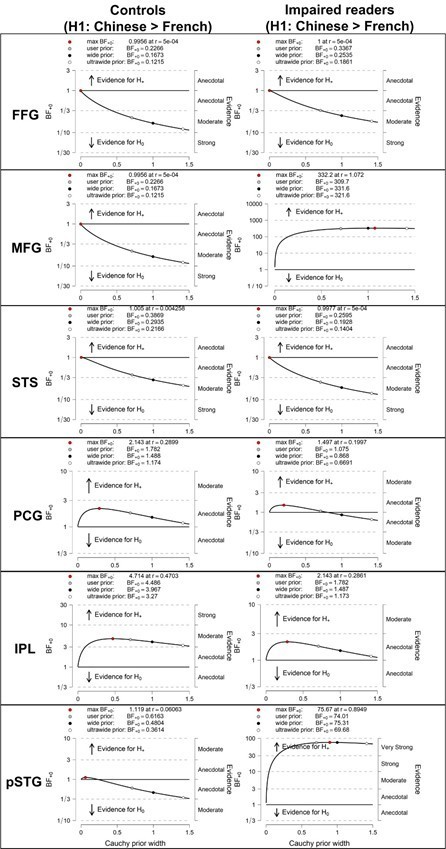
Sensitivity analysis with a variety of priors in the post-hoc pairwise comparisons between Chinese and French children separately in control and impaired-reading children (Left: Controls; Right: impaired-readers).
Tables
Table 1
Characteristics of the four groups.
| Chinese | French | |||
|---|---|---|---|---|
| Typical readers | Poor readers | Typical | Poor readers | |
| Sample size | 24 | 24 | 24 | 24 |
| Age in months (SD) | 123 (11) | 123 (10) | 123 (11) | 123 (10) |
| Sex | 13M/11F | 16M/8F | 13M/11F | 16M/8F |
| Reading ability (CI 95%) | 0.67 (0.49 ~ 0.86) | −1.74 (−1.95 ~ −1.54) | 0.73 (0.39 ~ 1.07) | −2.16 (−2.38 ~ −1.94) |
-
Table 1—source data 1
Demographic information of the four groups.
- https://cdn.elifesciences.org/articles/54591/elife-54591-table1-data1-v2.xlsx
Table 2
Regions of significant activations for each visual category vs. the two others across all participants.
| Region | MNI coordinates | Peak p-value | Peak z-value |
|---|---|---|---|
| Words > others | |||
| Left inferior frontal gyrus | −48 12 30 | 2.06e-19 | 8.93 |
| Left precentral | −39 0 36 | 1.45e-18 | 8.72 |
| −51 6 39 | 2.91e-14 | 7.51 | |
| Left superior temporal gyrus/sulcus | −57 −30 3 | 2.39e-19 | 8.92 |
| Left middle temporal gyrus | −51 −42 6 | 7.89e-18 | 8.52 |
| Left fusiform gyrus | −48 −57 −15 | 1.69e-17 | 8.43 |
| Left Inferior parietal sulcus | −45 −39 42 | 4.29e-14 | 7.46 |
| Right superior temporal sulcus | 57 −27 3 | 8.94e-10 | 6.02 |
| Faces > others | |||
| Left fusiform gyrus | −39 −48 −21 | 3.28e-17 | 8.35 |
| Right fusiform gyrus | 42 −54 −18 | 6.14e-26 | 10.47 |
| Right amygdala/hippocampus | 18 −9 −18 | 6.11e-22 | 9.56 |
| Left amygdala/hippocampus | −18 −9 −18 | 3.91e-15 | 7.77 |
| Houses > others | |||
| Left fusiform gyrus | −30 −48 −6 | 9.01e-53 | 15.24 |
| Right fusiform gyrus | 30 −45 −9 | 2.90e-50 | 14.86 |
| 27 −63 −9 | 2.40e-22 | 9.65 | |
| Left calcarine | −18 −54 9 | 8.66e-10 | 6.02 |
Table 3
Regions significantly correlated with reading scores across all participants at the whole-brain level.
| Region | MNI coordinates | Peak p-value | Peak z-value | R-value |
|---|---|---|---|---|
| Left fusiform gyrus | −42 −45 −18 | 6.65e-6 | 4.36 | 0.490 |
| Right fusiform gyrus | 42 −66 −24 | 9.96e-6 | 4.27 | 0.512 |
| Left precentral | −36 −3 57 | 2.75e-6 | 4.54 | 0.467 |
| Right precentral | 54 18 33 | 1.29e-5 | 4.21 | 0.432 |
| Left middle frontal gyrus | −36 12 27 | 1.92e-5 | 4.12 | 0.468 |
| Right middle frontal gyrus | 45 6 54 | 7.72e-6 | 4.32 | 0.460 |
| Left superior temporal sulcus | −57 −24 0 | 1.00e-5 | 4.26 | 0.510 |
| Right middle occipital gyrus | 27 −69 42 | 6.34e-6 | 4.37 | 0.448 |
Table 4
Bayes factor (BF10) in Bayesian ANOVA analyses of children’s activation to words versus fixation.
| ROIs | Main effect of language | Main effect of reading ability | Interaction | Post-hoc analyses | |||
|---|---|---|---|---|---|---|---|
| Typical readers (Chinese vs. French) | Poor readers (Chinese vs. French) | Chinese children (typical vs. poor readers) | French children (typical vs. poor readers) | ||||
| FFG | 0.216 | 1528.966 | 0.313 | 0.227 | 0.337 | 13.577 | 93.163 |
| MFG | 80.211 | 9.948 | 0.305 | 2.837 | 309.651 | 1.616 | 29.351 |
| STS | 0.220 | 37.507 | 0.309 | 0.387 | 0.259 | 6.933 | 5.076 |
| PCG | 1.532 | 5.625 | 0.275 | 1.782 | 1.075 | 2.662 | 2.661 |
| SPL | 7.052 | 0.562 | 0.323 | 4.486 | 1.782 | 0.822 | 0.332 |
| pSTG | 9.908 | 0.289 | 1.054 | 0.616 | 74.014 | 0.215 | 23.744 |
-
The value of Bayes factor BF10 means that data are n times more likely under alternative hypothesis (H1) than null hypothesis (H0). The alternative hypothesis in comparisons between typical and poor readers is group 1 (typical) > group2 (poor); the alternative hypothesis in comparisons between languages is group 1 (Chinese) > group2 (French).
Author response table 1
| Mean | CI 95% | |
|---|---|---|
| Chinese typical readers | 0.67 | 0.44 ~ 0.89 |
| Chinese impaired readers | 0.69 | 0.47 ~ 0.91 |
| French typical readers | -0.41 | -0.85 ~ 0.36 |
| French impaired readers | -0.11 | -0.63 ~ 0.41 |
Additional files
-
Supplementary file 1
Demography and performance on literacy tests for Chinese children.
- https://cdn.elifesciences.org/articles/54591/elife-54591-supp1-v2.docx
-
Supplementary file 2
Demography and performance on literacy tests for French children.
- https://cdn.elifesciences.org/articles/54591/elife-54591-supp2-v2.docx
-
Supplementary file 3
Regions of significant activations for each visual category vs. the two others in each group (individual voxel p=0.001, cluster-level FWE corrected).
- https://cdn.elifesciences.org/articles/54591/elife-54591-supp3-v2.docx
-
Supplementary file 4
Summary of activation foci in meta-analyses of dyslexia in alphabetic languages.
- https://cdn.elifesciences.org/articles/54591/elife-54591-supp4-v2.docx
-
Supplementary file 5
Summary of foci in meta-analyses of reading in Chinese.
- https://cdn.elifesciences.org/articles/54591/elife-54591-supp5-v2.docx
-
Supplementary file 6
Distance between individual center of 10 most activated voxels and group peaks.
- https://cdn.elifesciences.org/articles/54591/elife-54591-supp6-v2.docx
-
Transparent reporting form
- https://cdn.elifesciences.org/articles/54591/elife-54591-transrepform-v2.pdf
Download links
A two-part list of links to download the article, or parts of the article, in various formats.
Downloads (link to download the article as PDF)
Open citations (links to open the citations from this article in various online reference manager services)
Cite this article (links to download the citations from this article in formats compatible with various reference manager tools)
A universal reading network and its modulation by writing system and reading ability in French and Chinese children
eLife 9:e54591.
https://doi.org/10.7554/eLife.54591


