Osterix-Cre marks distinct subsets of CD45- and CD45+ stromal populations in extra-skeletal tumors with pro-tumorigenic characteristics
- Department of Orthopedics, Washington University School of Medicine, United States
- Genome Technology Access Center, Department of Genetics, Washington University School of Medicine, United States
- Department of Medicine, Division of Oncology, Washington University School of Medicine, United States
- Department of Medicine, Division of Bone and Mineral Diseases, Washington University School of Medicine, United States
- Shriners Children Hospital, United States
Figures
Figure 1 with 1 supplement
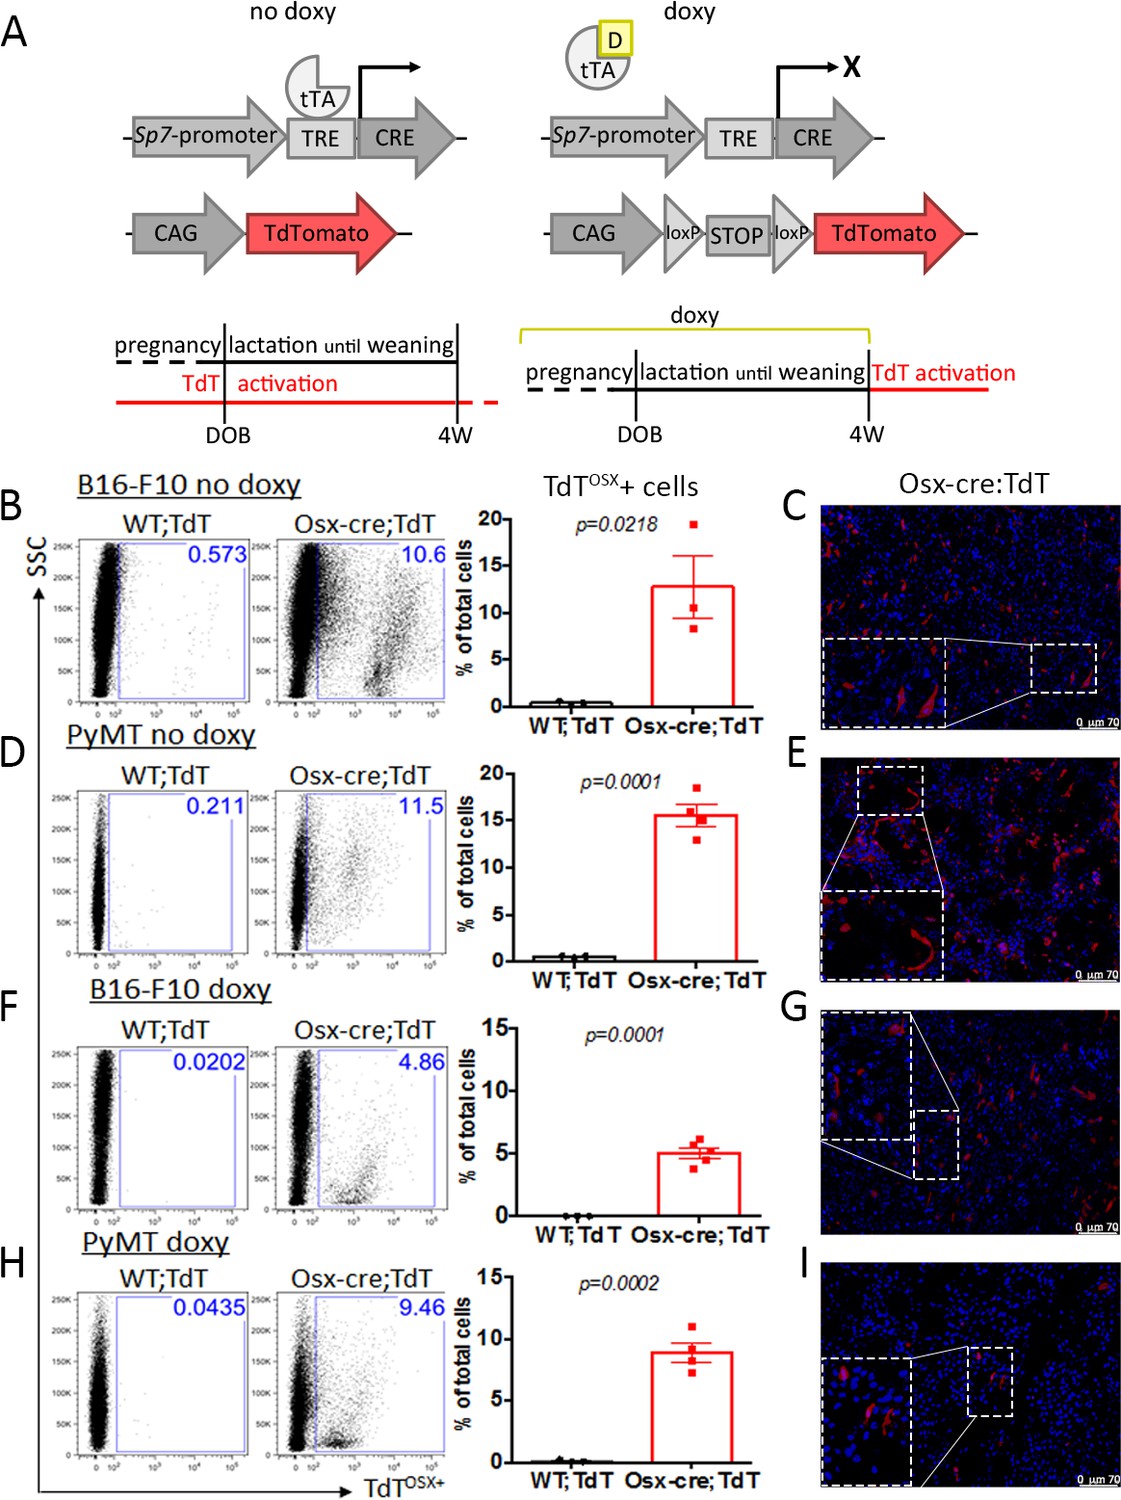
Embryonic and adult-derived Osx+ cells are present in primary tumors at extra-skeletal sites.
(A) Doxycycline (doxy)-repressible Sp7-cre/loxP mouse model used to activate Ai9/TdTomato expression for lineage tracing experiments. In no doxy-fed mice, TdT is expressed in embryonic-derived osteolineage cells (left), while in mice fed a doxy diet until weaning, TdT is expressed in adult-derived osteolineage cells. (B–I) Flow cytometry analysis and fluorescence images of primary tumors showing presence of TdTOSX+ cells in no-doxy fed Osx-cre;TdT mice or WT;TdT controls inoculated with B16-F10 melanoma subcutaneously (B–C), or with PyMT breast cancer cells in the mammary fat pad (MFP) (D–E), and in doxy-fed mice injected with B16-F10 subcutaneously (F–G), or with PyMT in the MFP (H–I). Slides for fluorescence images were counterstained with DAPI (blue), magnification 200X. Inserts are further magnified 4.5 folds. Data representative of a single experiment, experiments were repeated between 2 and 5 times. p values represent Student t-test statistical analysis.
-
Figure 1—source data 1
Relates to FACS analysis in panels B, D, F, H.
- https://cdn.elifesciences.org/articles/54659/elife-54659-fig1-data1-v2.xlsx
Figure 1—figure supplement 1
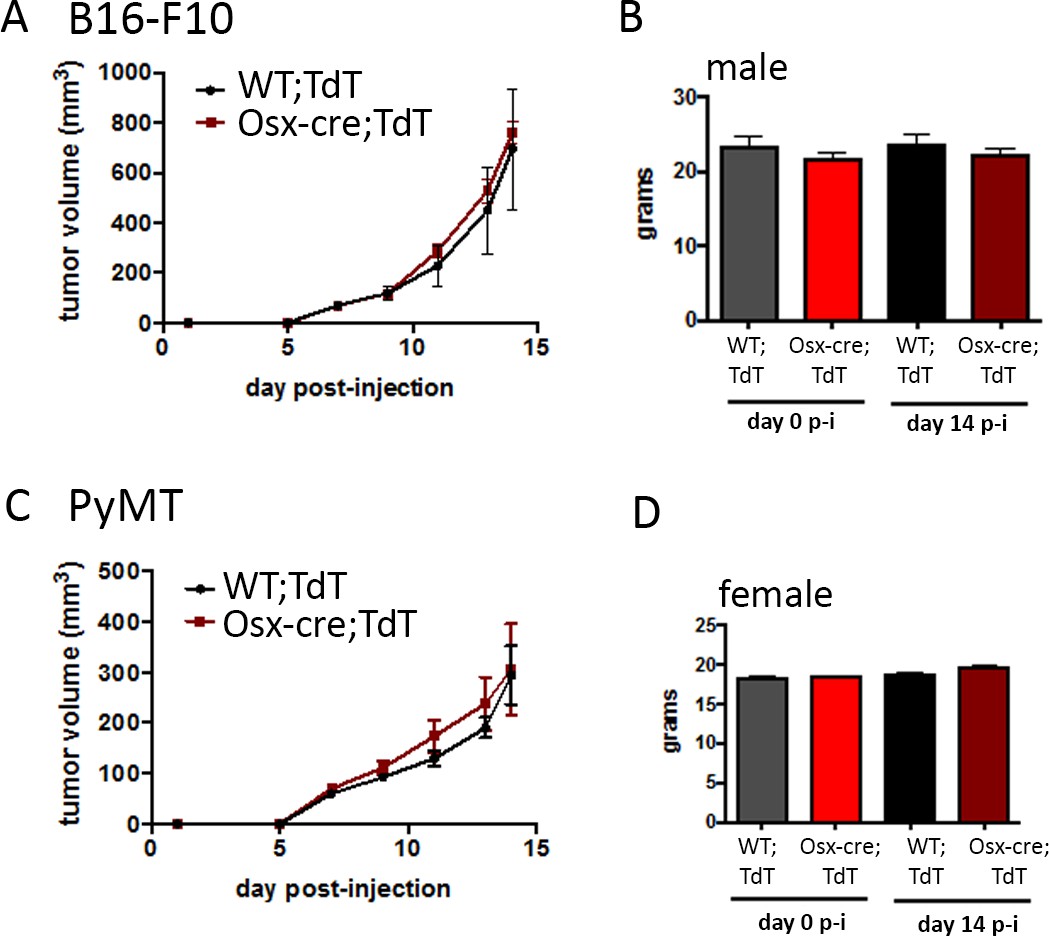
No difference in tumor growth and body weight between sex and age matched cre positive (Osx-cre;TdT) and negative (WT;TdT) mice.
. (A) Tumor growth in Osx-cre;TdT and WT;TdT male mice injected subcutaneously with B16-F10 tumor cells. (B) Body weight of the mice showed in (A) at the day of tumor injection (day 0) and at the end point (day 14 post-injection). (C) Tumor growth in Osx-cre;TdT and WT;TdT female mice injected in the MFP with PyMT tumor cells. (D) Body weight of the mice showed in (C) on day 0 and day 14 post-injection.
Figure 2

TdTOSX+ cells from primary tumors express mesenchymal markers.
(A) Experimental design for isolating TdTOSX+ cells from primary tumors isolated from doxy-fed Osx-cre;TdT mice inoculated with B16-F10. TdTOSX- cells comprise all TdT negative cells including the tumor cells. Immortalized CAFs (iCAFs) and crushed long bones were used as reference controls. (B–L) Quantitative Real-Time PCR for (B) Sp7(Osterix), (C) Runx2, (D) Bglap(Osteocalcin), (E) Ibsp (Bone sialoprotein), (F) Alpl (Tnap, Tissue non-specific alkaline phosphatase), (G) S100a4 (Fsp1), (H) Acta2 (α-SMA) (I) Collagen1a1 (J) Collagen1a2, (K) Mmp2 (Metalloproteinase2) and (L) Mmp9 (Metalloproteinase9) genes in TdTOSX+, TdTOSX- cells, iCAFs and bone. Each data point includes cells isolated from 3 to 4 mice and from two independent experiments. (M–N) Real-Time PCR of Sp7(Osterix) in B16-F10 or PyMT cell lines, CAFs isolated from primary B16-F10 or PyMT tumors or from the remaining cells comprising the tumor minus the CAFs (susp) (n = 3–4 mice). (O) Sp7(Osx) expression based on the Finak Breast Cancer Stroma gene set in the Oncomine cancer microarray database. Significance was determined by one-way ANOVA with Tukey post-hoc test, *p<0.05, **p<0.01, ***p<0.001, ****p<0.0001.
-
Figure 2—source data 1
Relates to Real-Time PCR data.
- https://cdn.elifesciences.org/articles/54659/elife-54659-fig2-data1-v2.xlsx
Figure 3 with 2 supplements
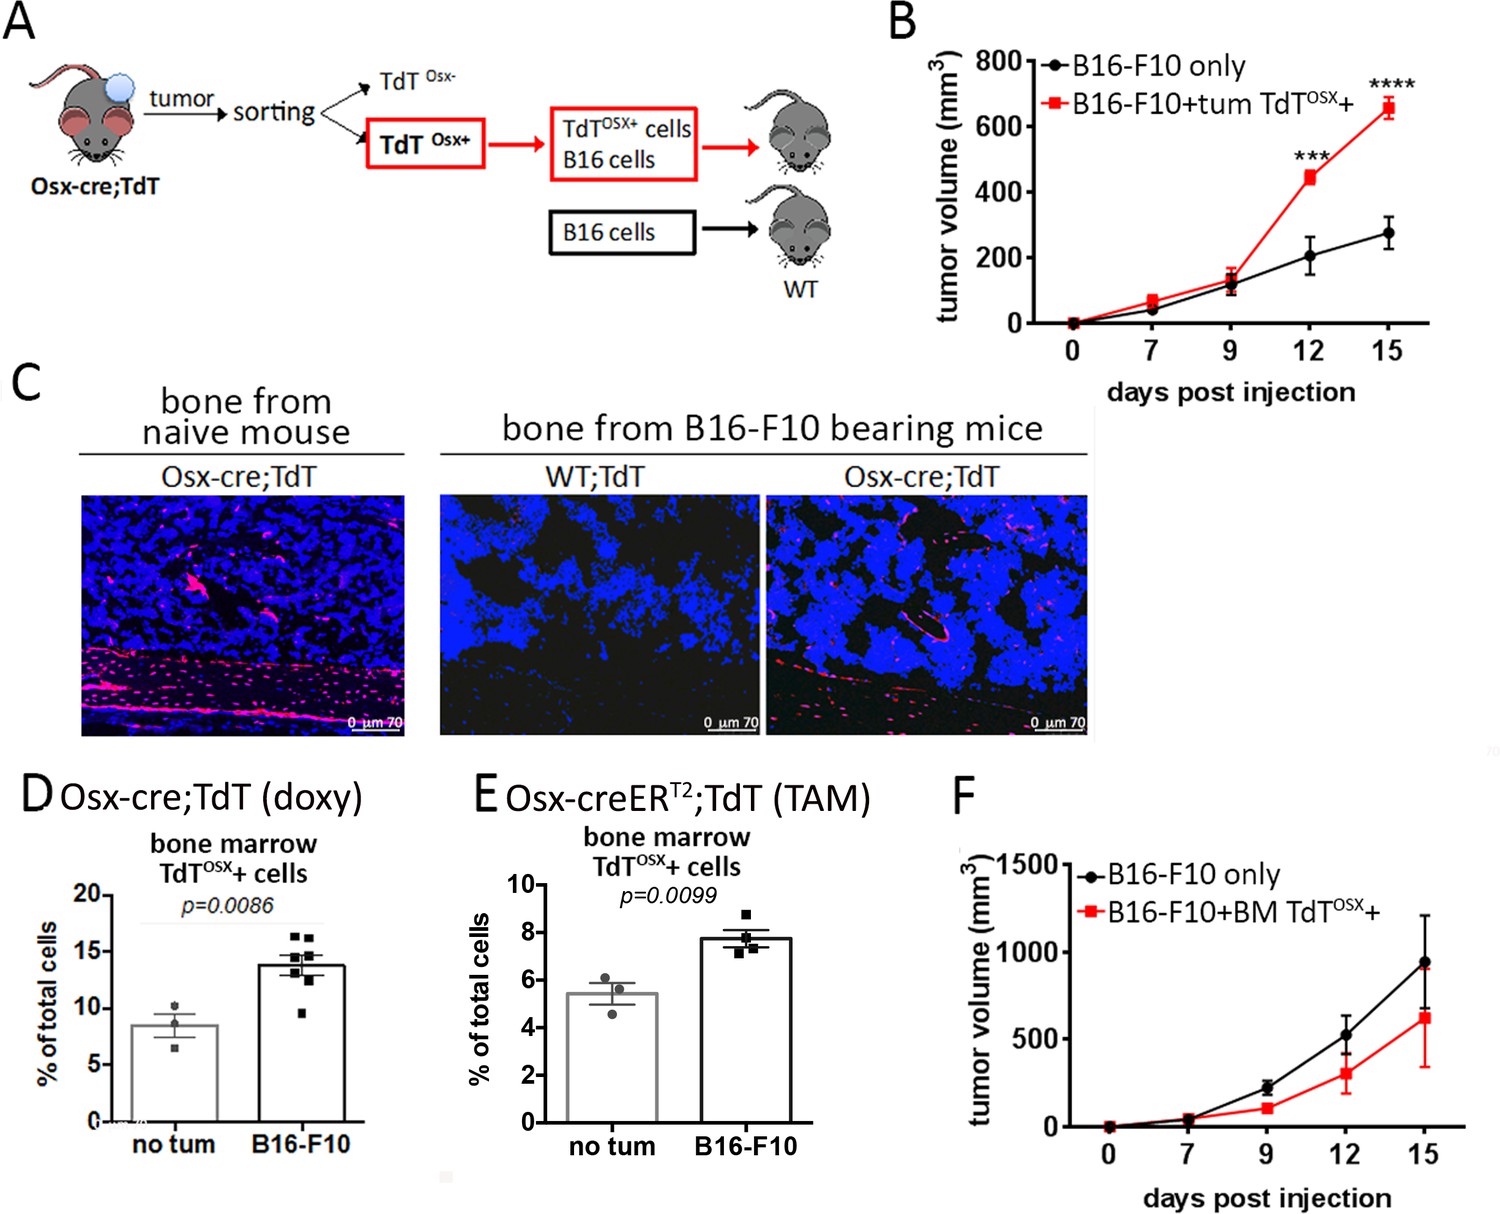
Tumor resident but not bone marrow resident TdTOSX+ cells increase tumor growth.
(A) Model showing isolation of TdTOSX+ cells from B16-F10 primary tumors injected into doxy-fed Osx-cre;TdT mice and re-inoculation of TdTOSX+ cells together with B16-F10 tumor cells into WT recipient mice at the ratio 5:1. Mice injected with B16-F10 alone were used as controls. (B) Tumor growth of experimental model described in (A) determined by caliper measurement. n = 3/group, experiment repeated twice. Significance was determined by one-way ANOVA with Tukey post-hoc test. (C) Fluorescence images of bone sections showing presence of TdTOSX+ within the bone and bone marrow of naïve Osx-cre;TdT, Osx-cre;TdT mice inoculated subcutaneously with B16-F10 tumors or WT;TdT mice used as negative control. Sections were counterstained with DAPI (blue), magnification 200X. (D–E) Quantification of TdTOSX+ cells in the bone marrow of tumor-free and B16-F10 tumor bearing (D) Osx-cre;TdT mice (doxy-fed) and (E) Osx-creERT2;TdT (TAM-treated) determined by FACS. Experiment repeated twice. Significance was determined by student t-test statistical analysis. (F) Tumor growth of WT mice inoculated with bone marrow-derived TdTOSX+ cells from B16-F10 bearing doxy-fed Osx-cre;TdT mice together with B16-F10 tumor cells (ratio 5:1). Mice injected with B16-F10 alone were used as controls. n = 3/group. Significance was determined by two-way ANOVA followed by Tukey post-hoc test. ***p<0.001, ****p<0.0001.
Figure 3—figure supplement 1

TdTOSX+ cells increase in the bone marrow of PyMT tumor bearing mice.
(A) Fluorescence images of WT;TdT and Osx-cre;TdT mice inoculated with PyMT tumors in the MFP. Slides for fluorescence images were counterstained with DAPI (blue), magnification 200X. (B) Quantification of TdTOSX+ cells in the bone marrow of tumor-free and PyMT bearing mice. Experiment repeated twice. p value represents Student t-test statistical analysis.
-
Figure 3—figure supplement 1—source data 1
Relates to FACS analysis.
- https://cdn.elifesciences.org/articles/54659/elife-54659-fig3-figsupp1-data1-v2.xlsx
Figure 3—figure supplement 2
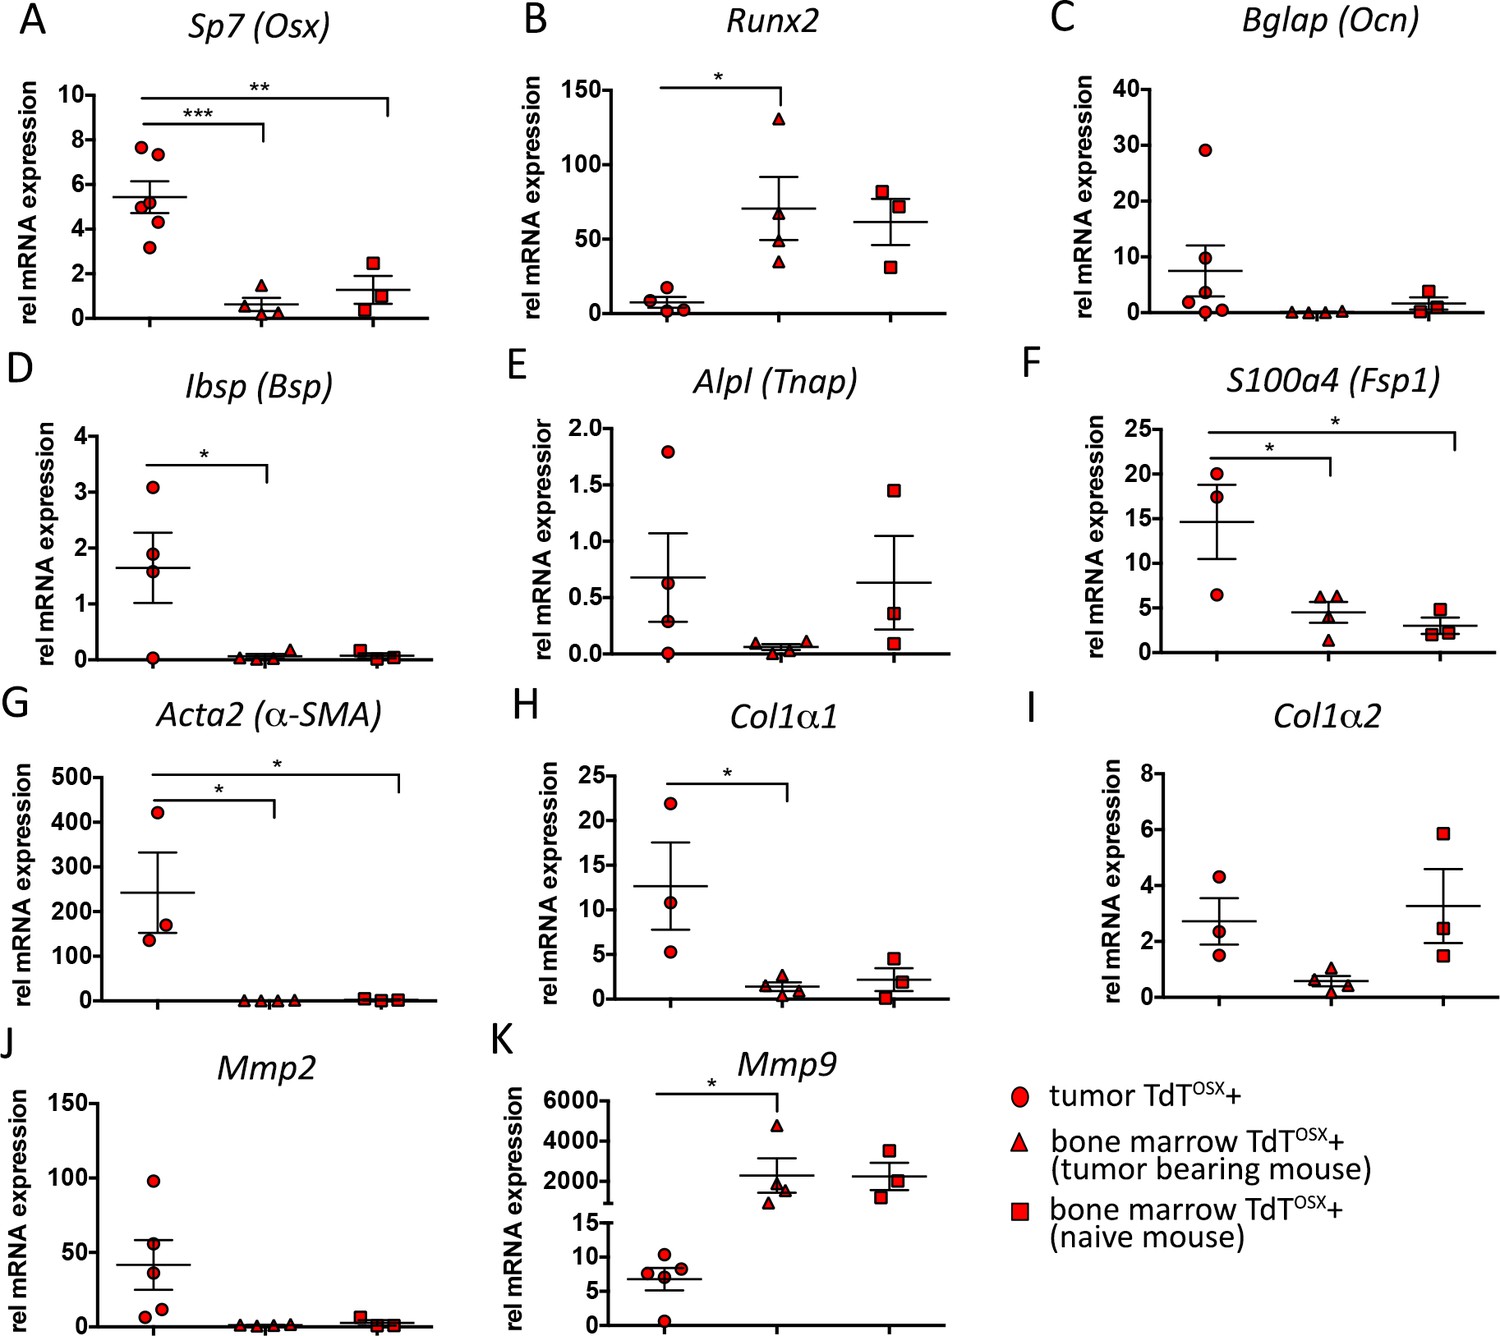
Differential expression of mesenchymal markers in TdTOSX+ cells isolated from tumor site or bone marrow.
(A–K) Quantitative Real-Time PCR for (A) Sp7 (Osterix), (B) Runx2, (C) Bglap (Osteocalcin), (D) Ibsp (Bone sialoprotein), (E) Alpl (Tnap, Tissue non-specific alkaline phosphatase), (F) S100a4 (Fsp1), (G) Acta2 (α-SMA), (H) Collagen 1a1, (I) Collagen 1a2, (J) Mmp2 (Metalloproteinase2) and (K) Mmp9 (Metalloproteinase9) genes in TdTOSX+ isolated from the B16-F10 melanoma primary tumors, bone marrow of B16-F10 bearing mice and bone marrow of naïve tumor-free mice.
-
Figure 3—figure supplement 2—source data 1
Relates to Real-Time PCR.
- https://cdn.elifesciences.org/articles/54659/elife-54659-fig3-figsupp2-data1-v2.xlsx
Figure 4 with 2 supplements
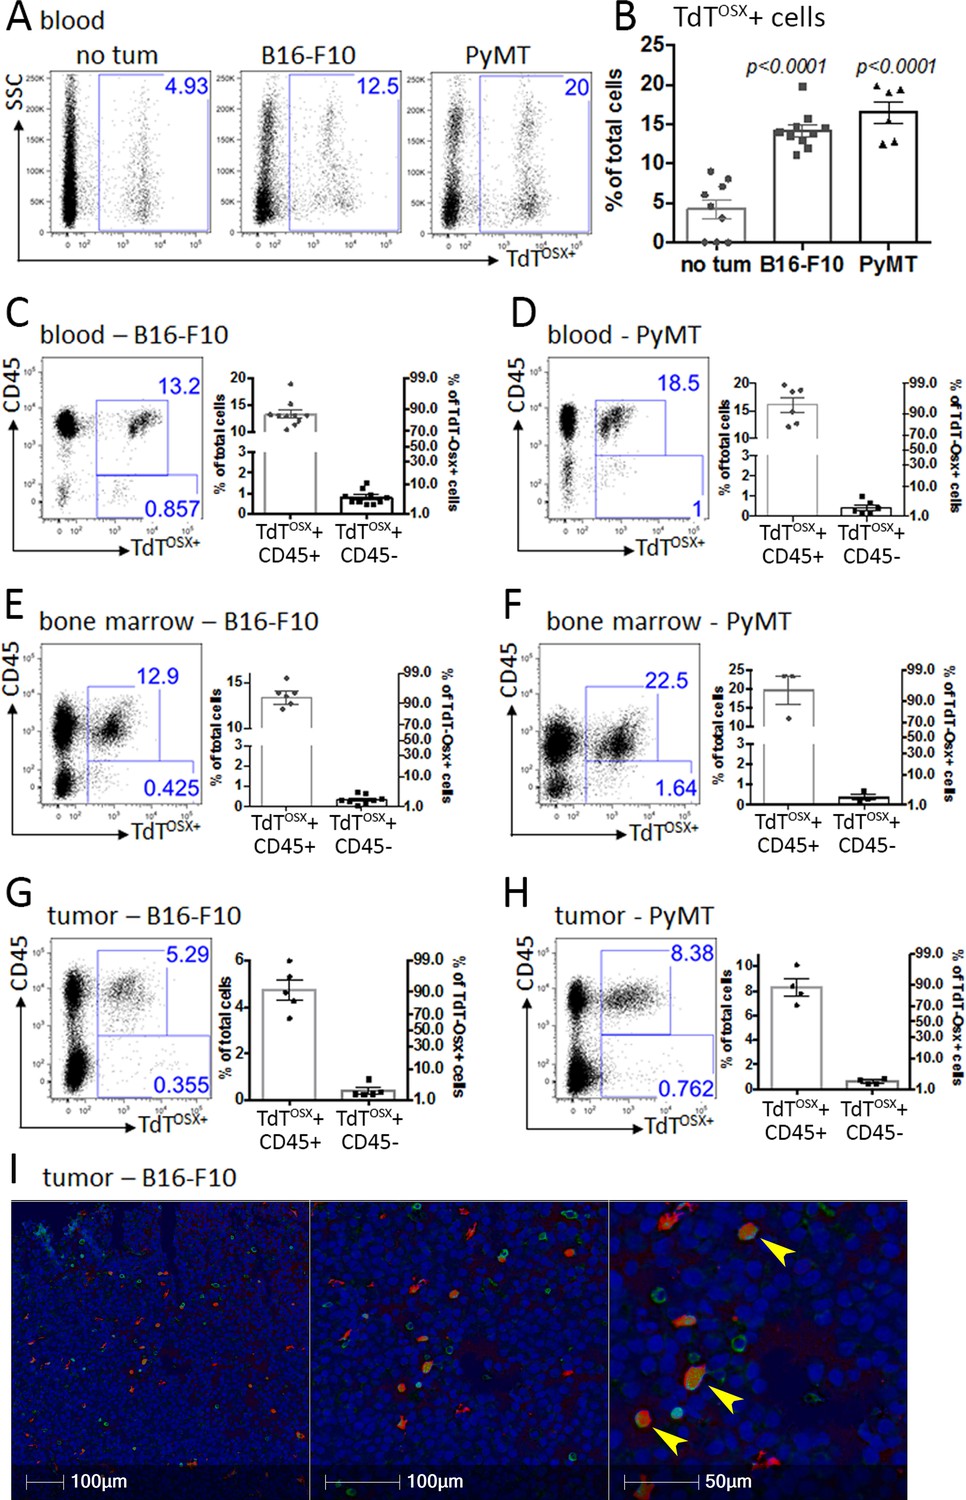
TdTOSX+ cells express the immune surface marker CD45.
(A–B) Representative FACS dot plots and quantification of TdTOSX+ cells in the peripheral blood of tumor-free and B16-F10 or PyMT tumor bearing mice. Significance was determined by student t-test statistical analysis for each tumor model relative to no tumor controls. (C–D) Representative FACS dot plots and quantification of TdTOSX+;CD45+ and TdTOSX+;CD45- populations in the blood of doxy-fed Osx-cre;TdT mice injected with B16-F10 or PyMT cells. (E–H) Representative FACS dot plots and quantification of TdTOSX+;CD45+ and TdTOSX+;CD45- populations in the bone marrow (E–F) or tumor site (G–H) of doxy-fed Osx-cre;TdT mice injected with B16-F10 or PyMT cells, respectively. Experiments were repeated at least twice. (I) Immunohistochemistry staining of paraffin-embedded B16-F10 tumors inoculated into Osx-cre;TdT reporter mice, pseudo colored with red representing TdTOSX+ cells (RFP stained), green representing CD45+ cells (DAB stained) and blue representing nuclei (hematoxylin), magnification 200X.
-
Figure 4—source data 1
Relates to FACS analysis in panels B, C, D, E, F, G, H.
- https://cdn.elifesciences.org/articles/54659/elife-54659-fig4-data1-v2.xlsx
Figure 4—figure supplement 1

Presence of TdTOSX+ cells in bone marrow (BM) of TAM-pulsed Osx-creERT2;TdT reporter mice.
(A) Schematic representation of TAM administration and tumor injection in Osx-creERT2;TdT mice. (B) Representative image of flow cytometry dot plots and quantification of TdTOSX+;CD45+ and TdTOSX+;CD45- populations in the bone marrow of B16-F10 bearing mice. A cre negative mouse was used as control to set gates. Experiment was repeated three times.
-
Figure 4—figure supplement 1—source data 1
Relates to FACS analysis.
- https://cdn.elifesciences.org/articles/54659/elife-54659-fig4-figsupp1-data1-v2.xlsx
Figure 4—figure supplement 2
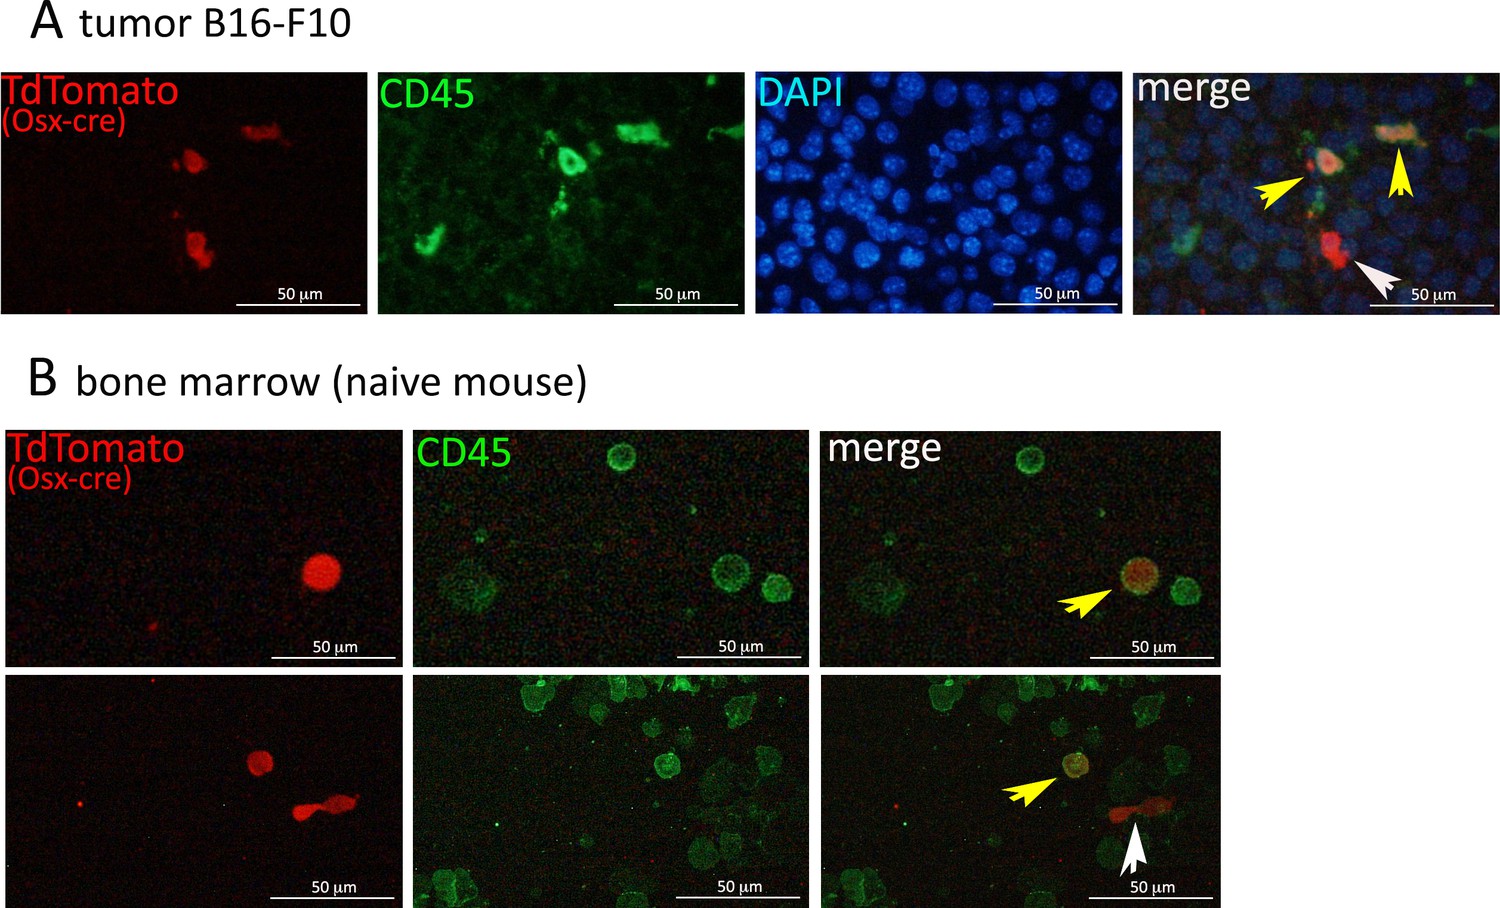
Co-expression of Osx-driven TdTomato and the immune marker CD45.
(A) Immunofluorescence on paraffin-embedded B16-F10 tumors isolated from Osx-cre;TdT reporter mice. Staining was done using anti-RFP (red) to detect TdTomato and anti-CD45 (green) to stain immune populations. Slides were counterstained with DAPI (blue), magnification 200X. (B) Staining for CD45 on a single cell suspension from bone marrow of Osx-cre;TdT reporter mice, magnification 200X. Yellow arrows point to TdTOSX+ single cells expressing CD45, while the white arrow points to a TdTOSX+ cell negative for CD45.
Figure 5 with 1 supplement
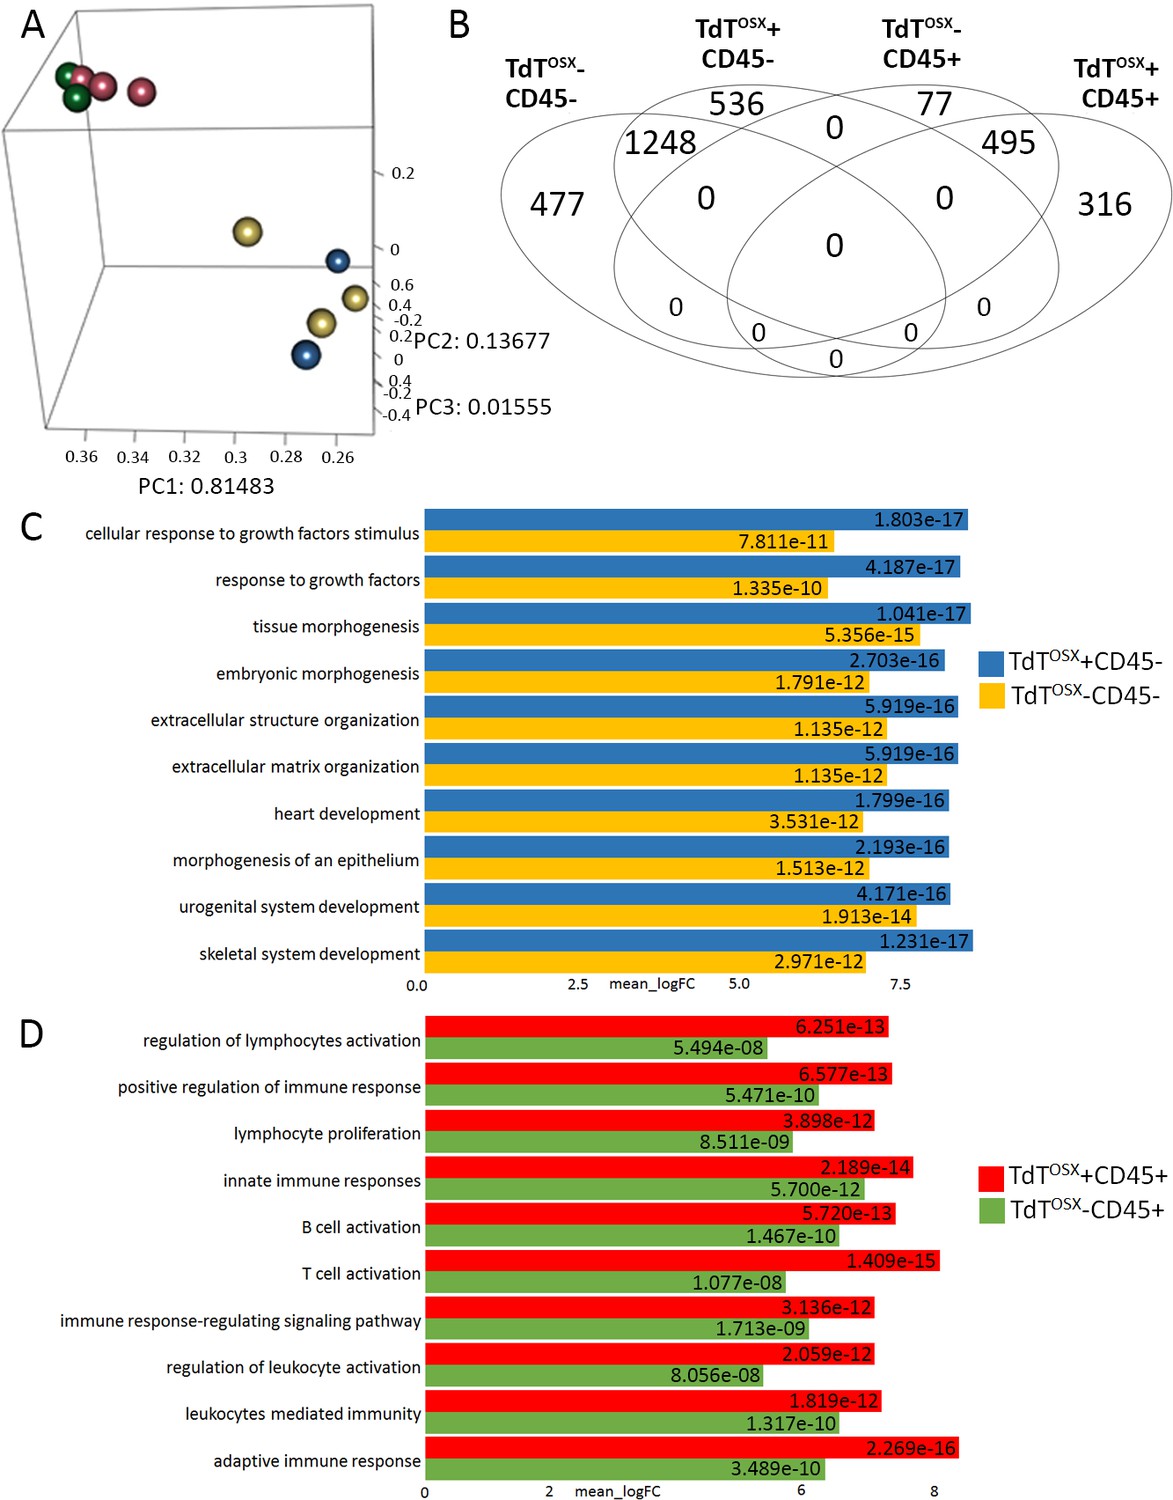
TdTOSX+;CD45- and TdTOSX+;CD45+ are two functionally distinct populations in the tumor microenvironment.
(A) Multidimensional Principal Component Analysis of RNAseq data obtained from four tumor stroma subsets sorted according to TdTOSX and CD45 expression. (B) Venn diagram depicting uniquely and commonly expressed genes among the four groups. (C–D) First ten GO pathways obtained from the GO analysis of the log two fold-changes for (C) CD45 negative subsets and (D) CD45 positive subsets.
Figure 5—figure supplement 1
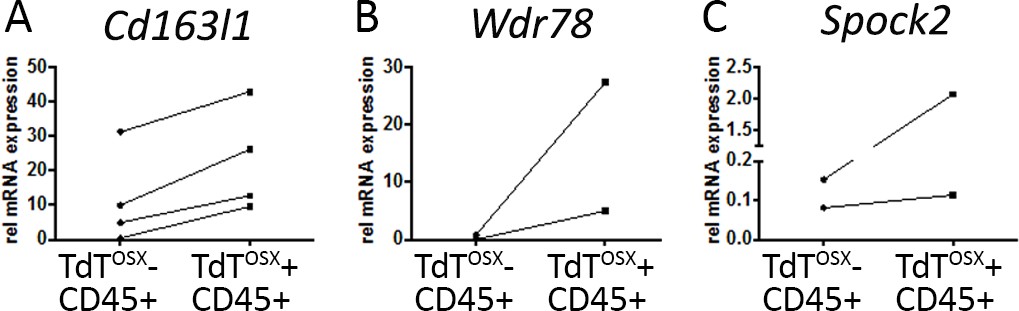
Validation of RNAseq data.
Real Time PCR performed on TdTOSX+;CD45+ and TdTOSX+;CD45- populations sorted from B16-F10 tumors in doxy-fed mice. Each sample is a pool of two tumors. Data show three genes (A) Cd163l1, (B) Wdr79 and (C) Spock2 to be upregulated in the TdTOSX+;CD45+ compared to TdTOSX-;CD45+ cells.
-
Figure 5—figure supplement 1—source data 1
Relates to Real-Time PCR data.
- https://cdn.elifesciences.org/articles/54659/elife-54659-fig5-figsupp1-data1-v2.xlsx
Figure 6 with 1 supplement
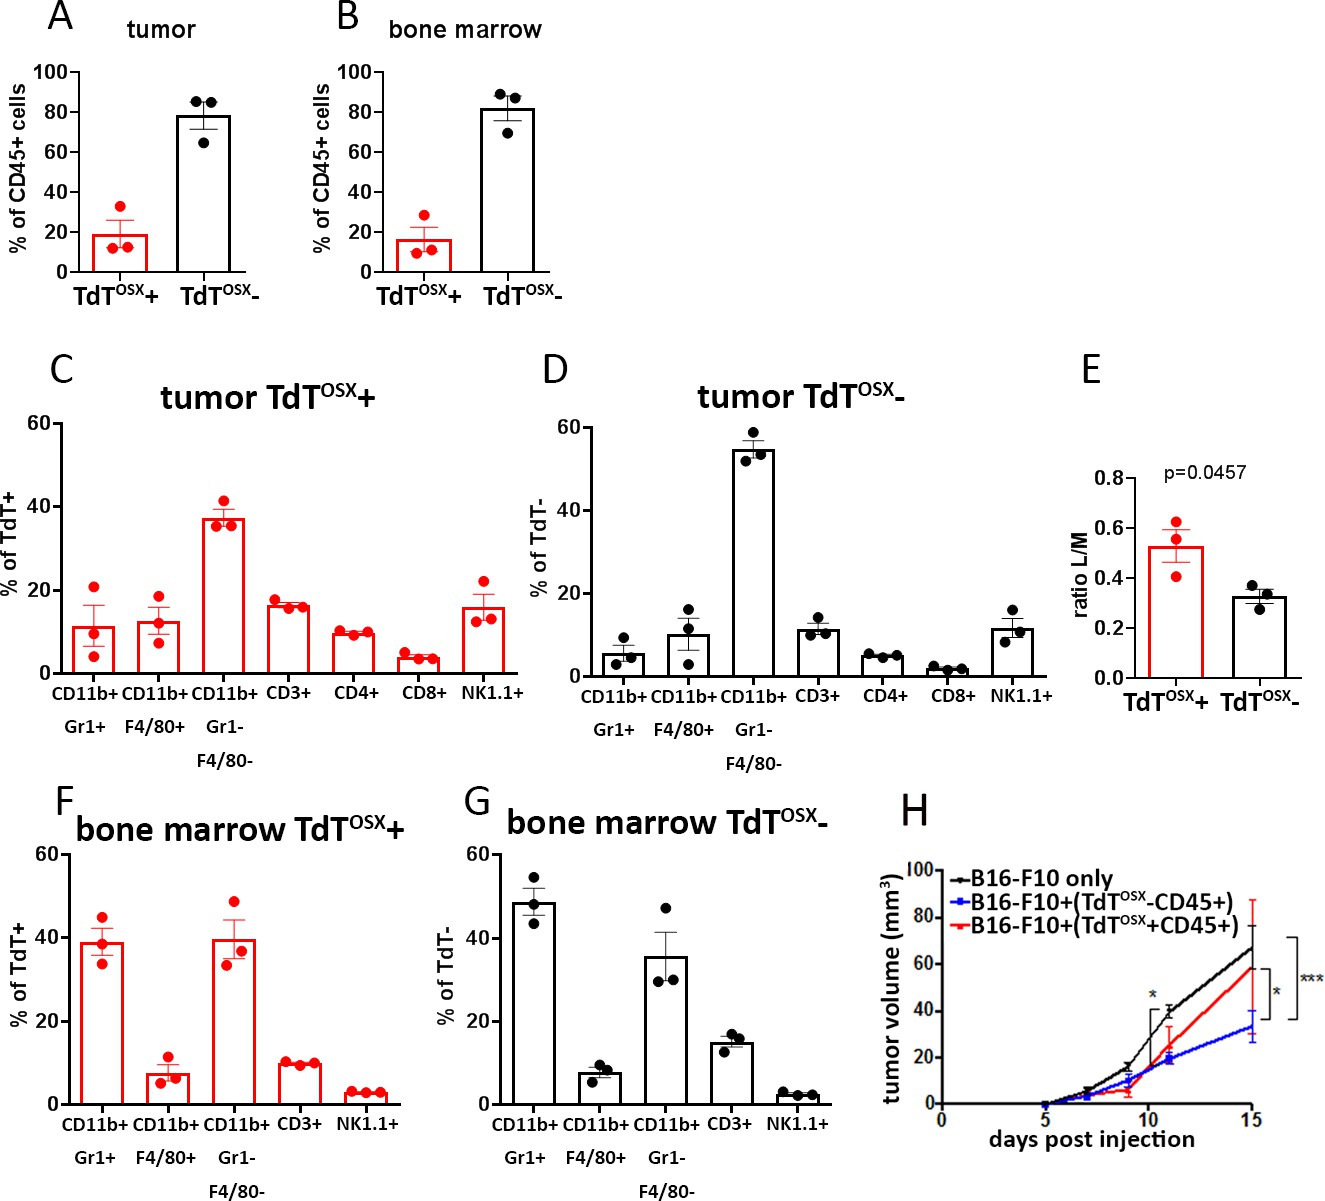
Subsets of myeloid and lymphoid cells in the tumor microenvironment and the bone marrow are derived from TdTOSX+ cells.
(A–B) Quantification of FACS analysis showing the percentage of TdTOSX+;CD45+ and TdTOSX-;CD45+ populations in the tumor and bone marrow of Osx-cre;TdT mice injected subcutaneously with B16-F10 tumor cells. Data showed as % of total CD45+ cells. (C–D) Quantification of FACS analysis showing the percentage of tumor infiltrating myeloid and lymphoid populations within the TdTOSX+;CD45+ or TdTOSX-;CD45+ subsets, each considered as 100%. (E) Lymphoid over myeloid ratio within the tumor infiltrating TdTOSX+;CD45+ or the TdTOSX-;CD45+ subsets. Statistical analysis was performed by student t-test. (F–G) Quantification of FACS analysis showing the percentage of the bone marrow resident myeloid and lymphoid populations within the TdTOSX+;CD45+ or TdTOSX-;CD45+ subsets, each considered as 100%. n = 3/group. (H) Tumor growth in mice injected with B16-F10 tumor cells alone or together with tumor-derived TdTOSX+;CD45+ or TdTOSX-;CD45+ cells at the ratio 1:5. n = 3–6/group.
-
Figure 6—source data 1
Relates to FACS analysis.
- https://cdn.elifesciences.org/articles/54659/elife-54659-fig6-data1-v2.xlsx
Figure 6—figure supplement 1
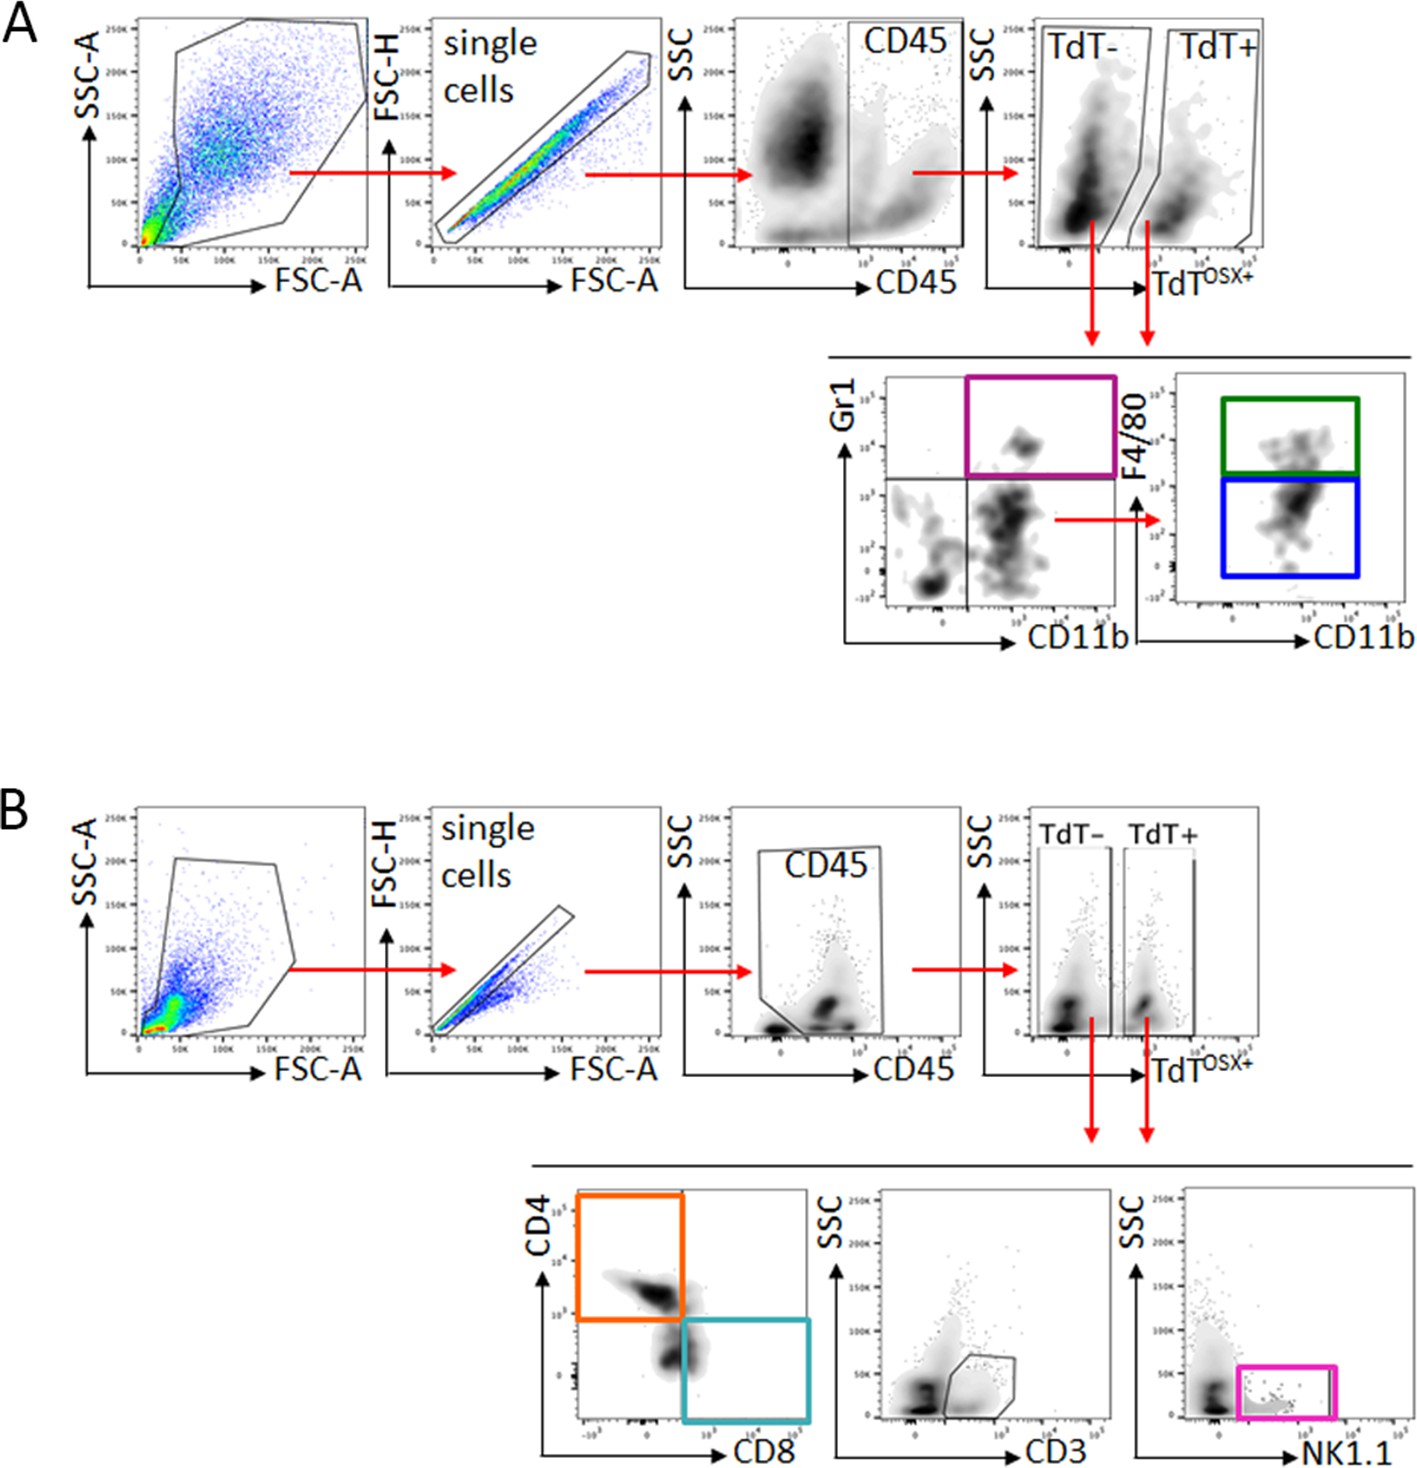
Gate strategy for immune staining of tumor and bone marrow.
(A) Representative gate strategy analysis of total tumor mass stained for CD45, myeloid immune markers CD11b, F4/80 and Gr1. Analysis performed in both TdTOSX+ and TdTOSX- populations. Identical analysis was performed on BM samples. (B) Representative gate strategy analysis of BM stained for lymphoid immune markers CD3, CD8, CD4 and NK1.1. Analysis performed in both TdTOSX+ and TdTOSX- populations. Identical analysis was performed on tumor samples. Fluorescence minus one (FMO) controls were used to set the gates. WT;TdT mice were used to set the gate for TdT+ cells.
Figure 7 with 1 supplement
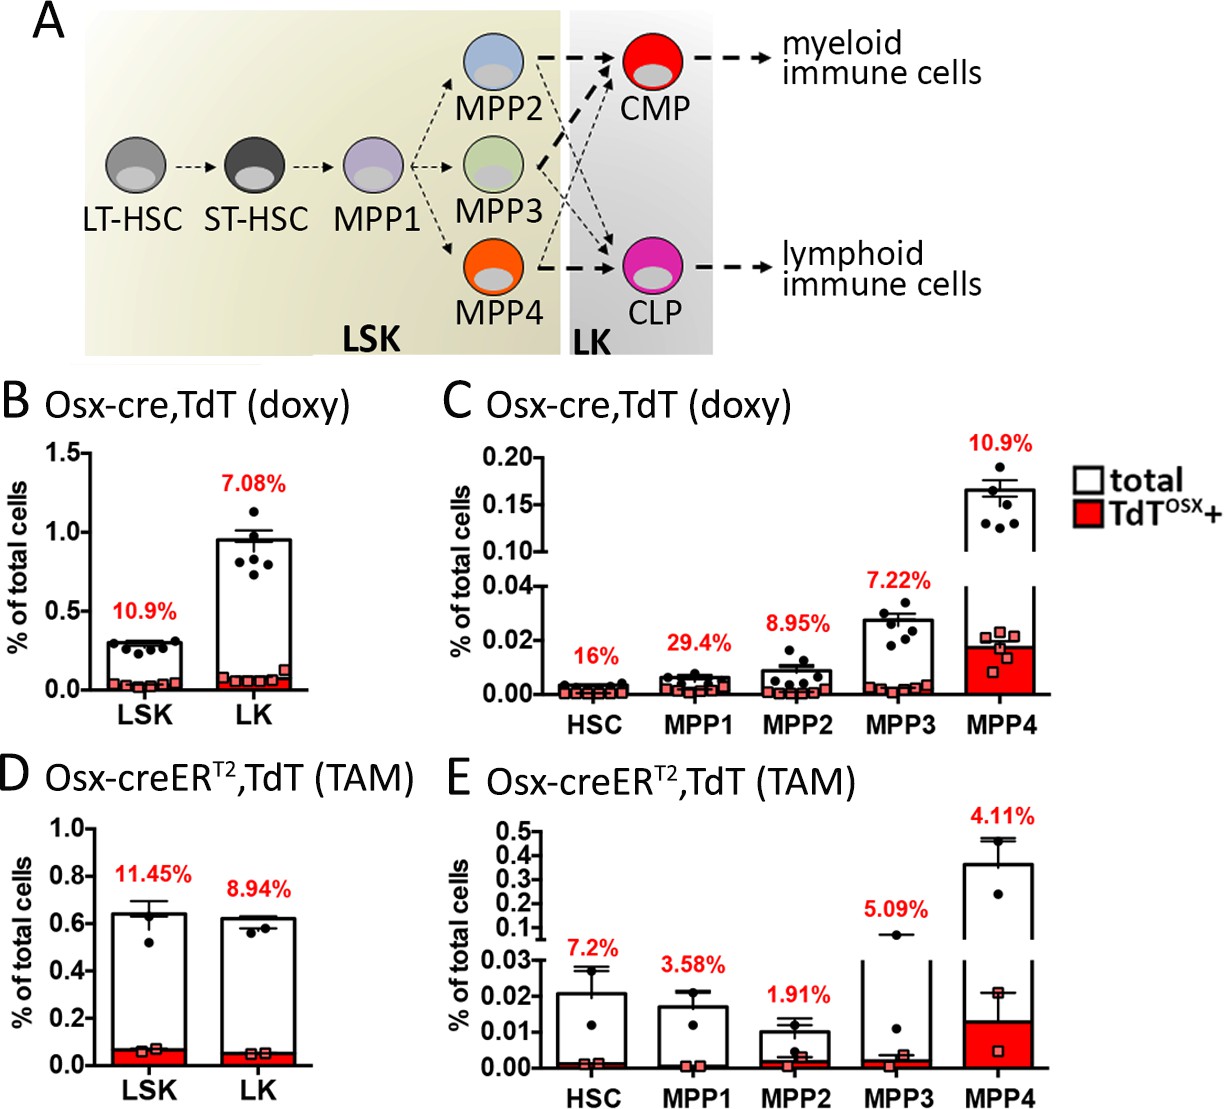
TdTOSX+;CD45+ cells derive from TdTOSX+ HSCs.
(A) Schematic of hematopoietic differentiation. (B–E) Flow cytometry quantification of TdTOSX+ cells in the bone marrow of (B–C) doxy-fed Osx-cre;TdT mice and (D–E) TAM-treated Osx-creERT2;TdT mice injected subcutaneously at 7 weeks of age with B16-F10 tumors. In (B and D) LSK and LK subsets are shown, while in (C and E) the LSK population is further divided into HSCs and MPP1-4 subsets. Red numbers represent the average of TdTOSX+ cells in each specific subset. n = 2–6/group.
-
Figure 7—source data 1
Relates to FACS analysis.
- https://cdn.elifesciences.org/articles/54659/elife-54659-fig7-data1-v2.xlsx
Figure 7—figure supplement 1
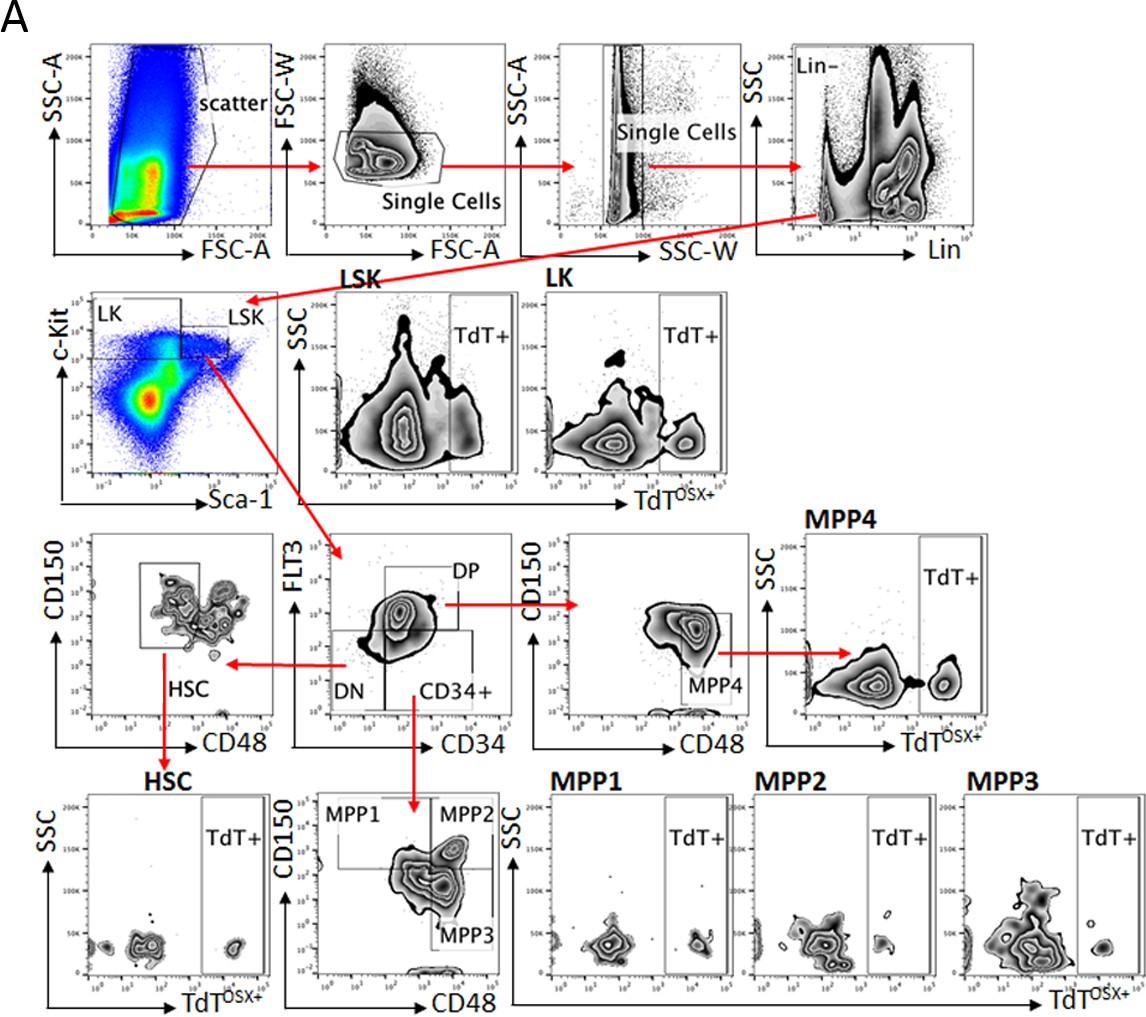
Gate strategy for HSC immunostaining of bone marrow.
(A) Representative gate strategy analysis of bone marrow stained for HSC subsets. TdTOSX+ cells were quantified in each subset. Fluorescence minus one (FMO) controls were used to set the gates. WT;TdT mice were used to set the gate for TdT+ cells.
Figure 8
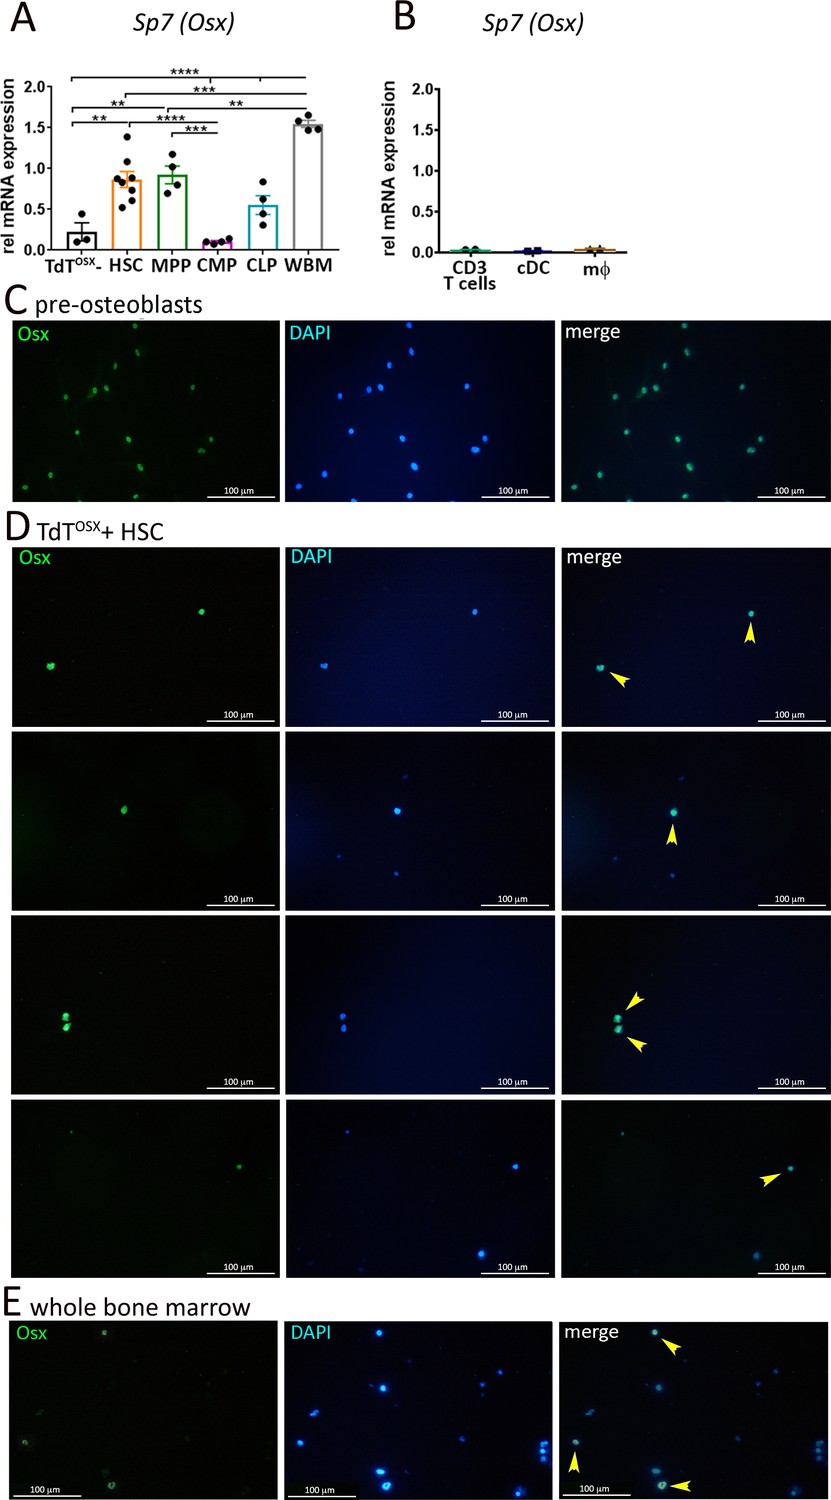
Sp7 transcripts and Osx protein are expressed in a subset of HSCs isolated from bone marrow of naïve mice.
(A) Real Time PCR analysis comparing sorted hematopoietic stem cells (HSC), multipotent progenitors (MPP), common myeloid progenitors (CMP), common lymphoid progenitors (CLP) and whole bone marrow (WBM) from 7 to 9 week old mice. FACS sorted TdTOSX- cells from the tumor of Osx-cre;TdT mice were used as negative control (n = 3–8/group). Statistical analysis was determined by two-way ANOVA followed by Tukey post-hoc test. *p<0.05, **p<0.01, ***p<0.001, ****p<0.0001. (B) Real Time PCR analysis of isolated mature CD3+ T cells, conventional dendritic cells (cDC) and bone marrow-derived macrophages (mφ) from WT naïve mice. (C–E) Immunofluorescence for Osx in (C) primary osteoblasts differentiated from BMSC cultured for 4 days in osteogenic media, (D) TdTOSX+ HSCs sorted from Osx-cre;TdT reporter mice and (E) whole bone marrow cells from WT mice. DAPI is used for nuclear staining. Magnification 200X.
-
Figure 8—source data 1
Relates to Real-Time PCR in panels A, B.
- https://cdn.elifesciences.org/articles/54659/elife-54659-fig8-data1-v2.xlsx
Tables
Table 1
Top 50 uniquely up-regulated genes in tumor-derived TdTOSX+;CD45- cells.
List of the 50 most highly expressed genes in the TdTOSX+;CD45- cells compared to the TdTOSX-;CD45- cells isolated from the TME.
| external_gene_name | description | TdTOSX+CD45- logFC | TdTOSX+CD45- linearFC |
|---|---|---|---|
| Reg1 | regenerating islet-derived 1 | 7.675801 | 204.477899 |
| Fbln7 | fibulin 7 | 7.184048 | 145.416614 |
| Adcyap1r1 | adenylate cyclase activating polypeptide 1 receptor 1 | 6.864422 | 116.51905 |
| Col24a1 | collagen, type XXIV, alpha 1 | 6.788179 | 110.521192 |
| Moxd1 | monooxygenase, DBH-like 1 | 6.74623 | 107.35382 |
| Fmod | fibromodulin | 6.739645 | 106.864989 |
| 4930562D21Rik | RIKEN cDNA 4930562D21 gene | 6.149924 | 71.008705 |
| Angpt4 | angiopoietin 4 | 6.131627 | 70.113799 |
| Tmem132c | transmembrane protein 132C | 5.933002 | 61.095844 |
| Frem1 | Fras1 related extracellular matrix protein 1 | 5.906166 | 59.969876 |
| Cxcl5 | chemokine (C-X-C motif) ligand 5 | 5.88881 | 59.252728 |
| Ccl19 | chemokine (C-C motif) ligand 19 | 5.748355 | 53.756054 |
| Rab15 | RAB15, member RAS oncogene family | 5.696057 | 51.842269 |
| Prlr | prolactin receptor | 5.673651 | 51.04334 |
| Msx1 | msh homeobox 1 | 5.657661 | 50.480738 |
| Pabpc4l | poly(A) binding protein, cytoplasmic 4-like | 5.657301 | 50.46814 |
| Reg3g | regenerating islet-derived 3 gamma | 5.651841 | 50.2775 |
| Rflna | refilin A | 5.651765 | 50.274843 |
| Adamts3 | a disintegrin-like and metallopeptidase (reprolysin type) with thrombospondin type 1 motif, 3 | 5.52646 | 46.092506 |
| Lrp3 | low density lipoprotein receptor-related protein 3 | 5.465865 | 44.196651 |
| Clstn2 | calsyntenin 2 | 5.41628 | 42.703438 |
| Adam5 | a disintegrin and metallopeptidase domain 5 | 5.36495 | 41.210775 |
| H2-M11 | histocompatibility 2, M region locus 11 | 5.335531 | 40.378937 |
| Ptx3 | pentraxin related gene | 5.320565 | 39.962237 |
| Rtl3 | retrotransposon Gag like 3 | 5.252916 | 38.131634 |
| Gm26682 | predicted gene, 26682 | 5.252803 | 38.128648 |
| Morc1 | microrchidia 1 | 5.251594 | 38.096689 |
| Hoxc6 | homeobox C6 | 5.176329 | 36.160165 |
| Mcpt8 | mast cell protease 8 | 5.146576 | 35.422062 |
| Gabrb3 | gamma-aminobutyric acid (GABA) A receptor, subunit beta 3 | 5.110873 | 34.556218 |
| Sbspon | somatomedin B and thrombospondin, type 1 domain containing | 5.085426 | 33.952042 |
| Akap6 | A kinase (PRKA) anchor protein 6 | 5.073102 | 33.663235 |
| Hmcn1 | hemicentin 1 | 5.060346 | 33.366905 |
| Aqp2 | aquaporin 2 | 5.031264 | 32.701036 |
| Gria3 | glutamate receptor, ionotropic, AMPA3 (alpha 3) | 5.011924 | 32.265589 |
| AI464131 | expressed sequence AI464131 | 5.001414 | 32.03138 |
| Muc13 | mucin 13, epithelial transmembrane | 4.997132 | 31.936452 |
| Syt4 | synaptotagmin IV | 4.994666 | 31.881898 |
| Spon1 | spondin 1, (f-spondin) extracellular matrix protein | 4.916033 | 30.190712 |
| Caln1 | calneuron 1 | 4.85996 | 29.039801 |
| Hoxc4 | homeobox C4 | 4.844155 | 28.723415 |
| Tbx2 | T-box 2 | 4.842042 | 28.681376 |
| Jph2 | junctophilin 2 | 4.816833 | 28.18456 |
| Frzb | frizzled-related protein | 4.79214 | 27.706253 |
| Galnt5 | polypeptide N-acetylgalactosaminyltransferase 5 | 4.77782 | 27.432606 |
| Gm29100 | predicted gene 29100 | 4.77255 | 27.332593 |
| Tspyl5 | testis-specific protein, Y-encoded-like 5 | 4.771509 | 27.312867 |
| Spag17 | sperm associated antigen 17 | 4.770653 | 27.296671 |
| Ldoc1 | regulator of NFKB signaling | 4.7479 | 26.86954 |
| 4833422C13Rik | RIKEN cDNA 4833422C13 gene | 4.730678 | 26.550693 |
Table 2
Top 50 uniquely up-regulated genes in tumor-derived TdTOSX+;CD45+ cells.
List of the 50 most highly expressed genes in the TdTOSX+;CD45+ cells compared to the TdTOSX-;CD45+ cells isolated from the TME.
| external_gene_ name | description | TdTOSX+CD45+ logFC | TdTOSX+CD45+ linearFC |
|---|---|---|---|
| Cd163l1 | CD163 molecule-like 1 | 6.482112 | 89.394369 |
| Ltb | lymphotoxin B | 6.217037 | 74.389998 |
| Klrg1 | killer cell lectin-like receptor subfamily G, member 1 | 5.915697 | 60.367363 |
| Foxp3 | forkhead box P3 | 5.882423 | 58.991007 |
| Trbv19 | T cell receptor beta, variable 19 | 5.83901 | 57.242322 |
| Cd5 | CD5 antigen | 5.822965 | 56.609196 |
| Gm4759 | predicted gene 4759 | 5.712238 | 52.426999 |
| Tcrg-C1 | T cell receptor gamma, constant 1 | 5.709921 | 52.342868 |
| Icos | inducible T cell co-stimulator | 5.588856 | 48.129715 |
| Gm19585 | predicted gene, 19585 | 5.577582 | 47.755056 |
| Fasl | Fas ligand (TNF superfamily, member 6) | 5.571314 | 47.548033 |
| Rln3 | relaxin 3 | 5.518062 | 45.824955 |
| Ubash3a | ubiquitin associated and SH3 domain containing, A | 5.432308 | 43.180511 |
| Pcsk1 | proprotein convertase subtilisin/kexin type 1 | 5.376329 | 41.537117 |
| Ccr8 | chemokine (C-C motif) receptor 8 | 5.32423 | 40.06386 |
| Gimap3 | GTPase, IMAP family member 3 | 5.257508 | 38.253185 |
| Slamf1 | signaling lymphocytic activation molecule family member 1 | 5.220641 | 37.288037 |
| Klrb1f | killer cell lectin-like receptor subfamily B member 1F | 5.204067 | 36.86212 |
| Ikzf3 | IKAROS family zinc finger 3 | 5.185332 | 36.386518 |
| Trdv4 | T cell receptor delta variable | 5.179288 | 36.234394 |
| Trat1 | T cell receptor associated transmembrane adaptor 1 | 5.144648 | 35.374755 |
| Pdcd1 | programmed cell death 1 | 5.092017 | 34.107504 |
| Izumo1r | IZUMO1 receptor, JUNO | 5.053635 | 33.212045 |
| Cd3e | CD3 antigen, epsilon polypeptide | 5.042174 | 32.949246 |
| Itk | IL2 inducible T cell kinase | 5.027182 | 32.608632 |
| Ctla4 | cytotoxic T-lymphocyte-associated protein 4 | 4.978043 | 31.516668 |
| Actn2 | actinin alpha 2 | 4.919967 | 30.27316 |
| Trbv1 | T cell receptor beta, variable 1 | 4.891164 | 29.674756 |
| Dkkl1 | dickkopf-like 1 | 4.820628 | 28.258804 |
| Cd300e | CD300E molecule | 4.801355 | 27.883791 |
| Pglyrp2 | peptidoglycan recognition protein 2 | 4.80032 | 27.863797 |
| Cd226 | CD226 antigen | 4.766441 | 27.21709 |
| Themis | thymocyte selection associated | 4.760082 | 27.097397 |
| Dpep3 | dipeptidase 3 | 4.694473 | 25.892693 |
| Cd209a | CD209a antigen | 4.650261 | 25.111233 |
| Cd27 | CD27 antigen | 4.648725 | 25.084512 |
| Gpr55 | G protein-coupled receptor 55 | 4.621113 | 24.608975 |
| Ccr6 | chemokine (C-C motif) receptor 6 | 4.596004 | 24.18439 |
| Gpr174 | G protein-coupled receptor 174 | 4.594683 | 24.16225 |
| A630023P12Rik | RIKEN cDNA A630023P12 gene | 4.586499 | 24.025577 |
| Cd28 | CD28 antigen | 4.564255 | 23.657981 |
| Cd3g | CD3 antigen, gamma polypeptide | 4.547609 | 23.386577 |
| Lta | lymphotoxin A | 4.534293 | 23.171712 |
| Ccr3 | chemokine (C-C motif) receptor 3 | 4.526527 | 23.047318 |
| Gzmb | granzyme B | 4.518658 | 22.921957 |
| Lrrc66 | leucine rich repeat containing 66 | 4.47147 | 22.184347 |
| Xirp2 | xin actin-binding repeat containing 2 | 4.462937 | 22.053513 |
| St8sia1 | ST8 alpha-N-acetyl-neuraminide alpha-2,8-sialyltransferase 1 | 4.460924 | 22.022769 |
| Sit1 | suppression inducing transmembrane adaptor 1 | 4.417363 | 21.367754 |
| Tnfrsf4 | tumor necrosis factor receptor superfamily, member 4 | 4.381868 | 20.84844 |
Key resources table
| Reagent type (species) or resource | Designation | Source or reference | Identifiers | Additional information |
|---|---|---|---|---|
| Gene (Mus musculus) | Sp7(Osx) | NCBI Gene | RRID:MGI:2153568 | NCBI ID:170574 |
| Genetic reagent (Mus musculus) | Tg(Sp7-tTA,tetO-EGFP/cre)1Amc/J (Osx-cre) | The Jackson Laboratories | Cat#006361 RRID:MGI:3689350 | C57Bl/6 |
| Genetic reagent (Mus musculus) | B6.Cg-Gt(ROSA)26Sortm9(CAG-tdTomato)Hze/J (TdT) | The Jackson Laboratories | RRID:MGI3813511 | C57Bl/6 |
| Genetic reagent (Mus musculus) | Sp7-creERT2/Ai9tdTomato (Osx-creERT2;TdT) | PMID:31768488 | Cat#007909 RRID:MGI:4829803 | Prof. Silva MJ (Washington University in St Louis) C57Bl/6 |
| Cell line (Mus musculus, C57Bl/6) | B16-F10 melanoma cell line | ATCC | RRID:CRL-6475-LUC2 | C57Bl/6 |
| Cell line (Mus musculus) | PyMT breast cancer cell line | PMID:27216180 | Prof. Weilbaecher KN (Washington University in St Louis) C57Bl/6 | |
| Cell line (Mus musculus) | Immortalized Cancer Associated Fibroblast cell line | PMID:27264173 | Prof Longmore GD (Washington University in St Louis) | |
| Antibody | Rat anti-mouse CD45-APCeFluor780(clone 30-F11) | eBioscience | Cat #47-0451-82 RRID:AB_1548781 | FACS (1:400) |
| Antibody | Rat anti-mouse CD45-PE Cy7 (clone 30-F11) | eBioscience | Cat #25-0451-82 RRID:AB_2734986 | FACS (1:400) |
| Antibody | Rat anti-mouse CD11b-AlexaFluor700 (clone M1/70) | eBioscience | Cat#56-0112-82 RRID:AB_657585 | FACS (1:400) |
| Antibody | Rat anti-mouse Gr1(Ly6G)-FITC (clone RB6-8C5) | Miltenyi Biotec | Cat#130-102-837 RRID:AB_2659858 | FACS (1:100) |
| Antibody | Rat anti-mouse F4/80 PerCP Cy5.5 (clone BM8) | Biolegend | Cat#123126 RRID:AB_10802654 | FACS (1:400) |
| Antibody | Hamster anti-mouse CD3e-PE (clone 145–2 C11) | eBioscience | Cat#A14714 RRID:AB_2534230 | FACS (1:200) |
| Antibody | Rat anti-mouse CD4-APC (clone RM4-5) | BD Biosciences | Cat#553051 RRID:AB_398528 | FACS (1:200) |
| Antibody | Rat anti-mouse CD8a-FITC (clone 53–6.7) | BD Biosciences | Cat#561966 RRID:AB_10896291 | FACS (1:200) |
| Antibody | Mouse anti-mouse NK1.1 (clone PK136) | Biolegend | Cat#108722 RRID:AB_2132712 | FACS (1:200) |
| Antibody | Rat anti-mouse CD45R (B220)-Biotin (clone RA3-6B2) | eBioscience | Cat#13-0452-82 RRID:AB_466449 | FACS (0.4 ul/sample) |
| Antibody | Hamster anti-mouse CD3e-Biotin (clone 145–2 C11) | eBioscience | Cat#13-0031-82 RRID:AB_466319 | FACS (0.4 ul/sample) |
| Antibody | Rat anti-mouse Ter119 (clone TER119) | eBioscience | Cat# 13-5921-82 RRID:AB_466797 | FACS (0.4 ul/sample) |
| Antibody | Rat anti-mouse Ly-6G/Ly-6C Biotin (clone RB6-8C5), | eBioscience | Cat#13-5931-82 RRID:AB_466800 | FACS (0.2 ul/sample) |
| Antibody | Rat anti-mouse CD41Biotin (clone MWReg30) | eBioscience | Cat#13-0411-82 RRID:AB_763484 | FACS (1 ul/sample) |
| Antibody | Streptavidin-BV510 | BD Biosciences | Cat#563261 | FACS (0.5 ul/sample) |
| Antibody | Rat anti-mouse Sca-1 BV711 (clone D7) | BD Biosciences | Cat#563992 RRID:AB_2738529 | FACS (0.25 ul/sample) |
| Antibody | Rat anti-mouse c-kit(CD117)-APCeFluor780 (clone ACK2) | eBioscience | Cat#47-1172-82 RRID:AB_1582226 | FACS (1 ul/sample) |
| Antibody | Rat anti-mouse CD16/32-BUV395 (clone 2.4G2) | BD Biosciences | Cat#740217 RRID:AB_2739965 | FACS (0.5 ul/sample) |
| Antibody | Rat anti-mouse CD34-FITC (clone RAM34) | eBioscience | Cat#11-0341-82 RRID:AB_465021 | FACS (4 ul/sample) |
| Antibody | Rat anti-mouse CD150(SLAM)-BV421 (clone TC15-12F12.2) | Biolegend | Cat#115943 RRID:AB_2650881 | FACS (1 ul/sample) |
| Antibody | Hamster anti-mouse CD48-PE Cy7 (clone HM48-1) | eBioscience | Cat#25-0481-80 RRID:AB_1724087 | FACS (0.15 ul/sample) |
| Antibody | Rat anti-mouse CD135(Flt3)-APC (clone A2F10) | eBioscience | Cat#17-1351-82 RRID:AB_10717261 | FACS (2 ul/sample) |
| Antibody | Rat anti-mouse CD45 (clone 30-F11) | Invitrogen | Cat#14-0451-82 RRID:AB_467251 | IF, IHC (1:200) |
| Antibody | Rabbit anti-mouse RFP/TdT | Rockland | Cat#600-401-379 RRID:AB_2209751 | IF,IHC (1:500) |
| Antibody | Goat-anti-Rat IgG-Biotin | Thermo Fisher | Cat#31830 RRID:AB_228355 | IF, IHC (1:500) |
| Antibody | Streptavidin-HRP | Bio-Rad | Cat#STAR5B | IF, IHC (1:500) |
| Antibody | Goat-anti-rabbit Alexa-fluor647 | Thermo Fisher | Cat#A21244 RRID:AB_2535812 | IF (4 ug/ml) |
| Antibody | Rabbit anti-mouse Sp7/Osx | Abcam | Cat#ab227820 | IF (1:500) |
| Antibody | Goat anti-rabbit AlexaFluor488 | Abcam | Cat#ab150077 RRID:AB_2630356 | IF (1:1000) |
| Sequence-based reagent | Cyclophilin | This paper | PCR primers | 5’-AGC ATA CAG GTC CTG GCA TC-3’ and 5’-TTC ACC TTC CCA AAG ACC AC-3’ |
| Sequence-based reagent | Sp7(Osx) | This paper | PCR primers | 5’-AAG GGT GGG TAG TCA TTT GCA-3’ and 5’-CCC TTC TCA AGC ACC AAT GG-3’ |
| Sequence-based reagent | S100A4(Fsp-1) | This paper | PCR primers | 5’-TGA GCA ACT TGG ACA GCA ACA-3’ and 5’-TTC CGG GGT TCC TTA TCT GGG-3’ |
| Sequence-based reagent | Acta2(α-SMA) | This paper | PCR primers | 5’-GTC CCA GAC ATC AGG GAG TAA-3’ and 5’-TCG GAT ACT TCA GCG TCA GGA-3’ |
| Sequence-based reagent | Col1a1 | This paper | PCR primers | 5’-GGC CTT GGA GGA AAC TTT GC-3’ and 5’-GGG ACC CAT TGG ACC TGA AC-3’ |
| Sequence-based reagent | Bglap(Ocn) | This paper | PCR primers | 5’-GGA CTG AGG CTC TGT GAG GT-3’ and 5’-CAG ACA CCA TGA GGA CCA TC-3’ |
| Sequence-based reagent | Runx2 | This paper | PCR primers | 5’-GTT ATG AAA AAC CAA GTA GCC AGG-3’ and 5’-GTA ATC TGA CTC TGT CCT TGT GGA-3’ |
| Sequence-based reagent | BSP | This paper | PCR primers | 5’-AGG ACT AGG GGT CAA ACA C-3’ and 5’-AGT AGC GTG GCC GGT ACT TA-3’ |
| Sequence-based reagent | TNAP | This paper | PCR primers | 5’-GGG GAC ATG CAG TAT GAG TT-3’ and 5’-GGC CTG GTA GTT GTT GTG AG-3’ |
| Commercial assay or kit | TSA FITC System | Perkin Elmer | Cat#NEL701A001KT | |
| Commercial assay or kit | BOND Intense R detection kit | Leica Biosystem | Cat#DS9263 | |
| Commercial assay or kit | BOND Polymer Refine Red detection kit | Leica Biosystem | Cat#DS9390 | |
| Commercial assay or kit | Avidin/Biotin Blocking kit | Vector Labs | Cat#SP2001 RRID:AB_2336231 | |
| Software, algorithm | STAR | STAR | RRID:SCR_015899 | Version 2.0.4b |
| Software, algorithm | Subread | Subread | RRID:SCR_009803 | Version 1.4.5 |
| Software, algorithm | R | R | RRID:SCR_001905 | Version 3.4.1 |
| Software, algorithm | EdgeR | EdgeR | RRID:SCR_012802 | Version 3.20.2 |
| Software, algorithm | LIMMA | LIMMA | RRID:SCR_010943 | Version 3.34.4 |
| Software, algorithm | GAGE | GAGE | RRID:SCR_017067 | Version 2.28.0 |
| Other | VECTASHIELD Mounting Medium with DAPI | Vector Labs | Cat#H1200 RRID:AB_2336790 | one drop |
| Other | ProLong Gold with DAPI | Invitrogen | Cat#P10144 | one drop |
Additional files
Download links
A two-part list of links to download the article, or parts of the article, in various formats.
Downloads (link to download the article as PDF)
Open citations (links to open the citations from this article in various online reference manager services)
Cite this article (links to download the citations from this article in formats compatible with various reference manager tools)
Osterix-Cre marks distinct subsets of CD45- and CD45+ stromal populations in extra-skeletal tumors with pro-tumorigenic characteristics
eLife 9:e54659.
https://doi.org/10.7554/eLife.54659


