Local frustration determines loop opening during the catalytic cycle of an oxidoreductase
- Department of Biochemistry, University of Oxford, United Kingdom
- Department of Molecular Biosciences, University of Texas at Austin, United States
- Institute of Nanoscience and Nanotechnology, NCSR Demokritos, Greece
- Laboratoire de Microbiologie, Institut de Biologie, Université de Neuchâtel, Switzerland
- Department of Chemistry, Physical and Theoretical Chemistry Laboratory, University of Oxford, United Kingdom
Figures
Figure 1

Schematic representation of DsbD.
(A) DsbD comprises a central domain with eight transmembrane helices (tmDsbD) and two periplasmic globular domains (nDsbD and cDsbD). The electron transfer pathway from thioredoxin (Trx) to periplasmic partner proteins is shown. cDsbD, DsbC, CcmG and DsbG have a thioredoxin fold (circle), typical of thiol-disulfide oxidoreductases, while nDsbD adopts an immunoglobulin fold (square). nDsbD and cDsbD are shown in cyan and grey, respectively. (B) Electron transfer reactions involving DsbD are shown. Two electrons and two H+ are transferred in each step. Trxred reduces the disulfide bond in tmDsbDox, tmDsbDred then reduces cDsbDox, and cDsbDred subsequently reduces nDsbDox. Oxidized DsbC, CcmG and DsbG subsequently accept electrons from nDsbDred. (C) Schematic representation of the thiol-disulfide exchange reaction (bimolecular nucleophilic substitution) between cDsbD and nDsbD. (D) The central panels illustrate two possible mechanisms mediating cap loop opening in the formation of the nDsbD-cDsbD complex. In the upper scheme, a steric clash upon binding induces cap loop opening. In the lower scheme, the sampling of an open conformation by nDsbD allows formation of the complex without steric clashes. nDsbDox is illustrated on the left (PDB: 1L6P); the cap loop (residues 68–72), which covers the active site is in teal. F70 (stick and surface representation) shields the active-site disulfide bond (yellow) in this closed conformation. The nDsbD cap loop adopts an open conformation in the complex between nDsbD and cDsbD (PDB: 1VRS), shown on the right, allowing interaction of the cysteine residues of the two domains. All structures in this and other figures were rendered in Pymol (Version 2.3.5, Schrödinger, LLC) unless otherwise indicated.
Figure 2 with 3 supplements
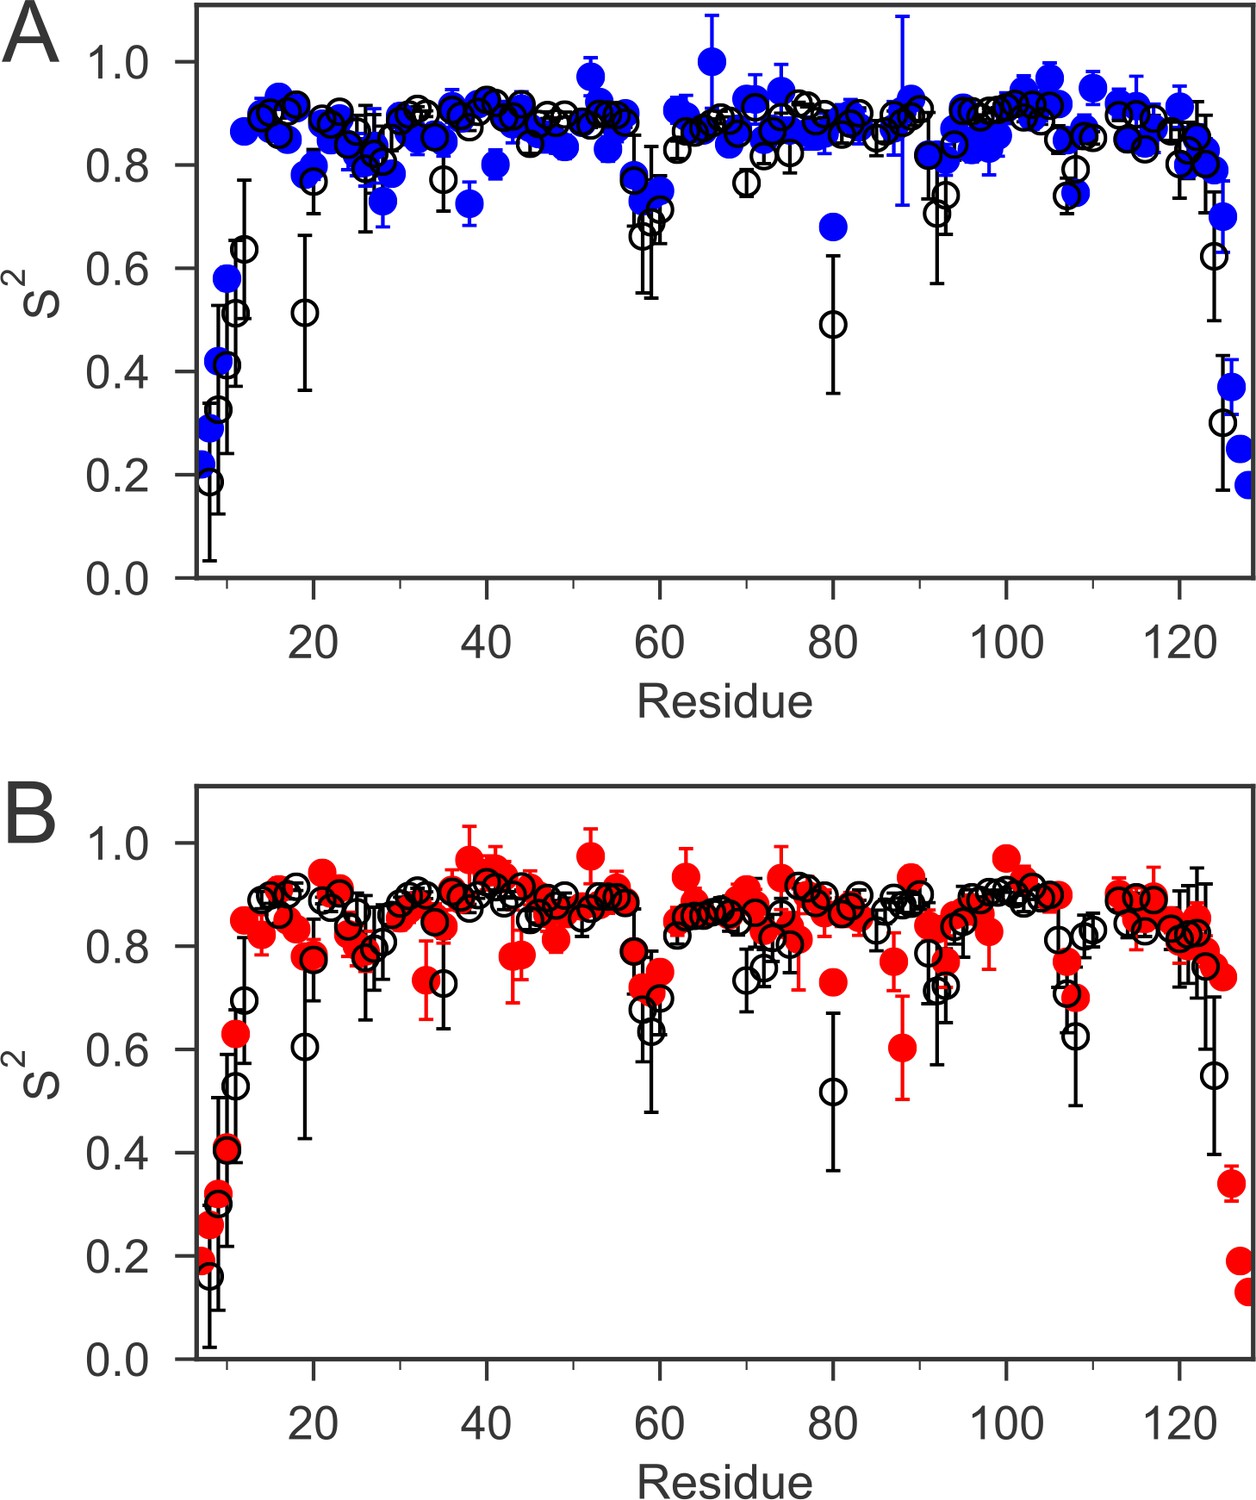
The order parameters (S2) for backbone amides derived from 15N relaxation experiments and MD simulations are plotted as a function of sequence.
The experimental order parameters for reduced and oxidized nDsbD are shown in blue (A) and red (B), respectively. The average order parameters calculated from the combined 1 μs MD simulation ensembles starting from closed structures for reduced (A) and oxidized (B) nDsbD are shown in black. Errors in S2 were determined by Monte Carlo simulations (experiment) and resampling of S2 from trajectory segments (MD simulations). The simulations of both oxidized and reduced nDsbD reproduced even subtle features of sequence-dependent variation of S2 values. For example, S2 values for residues 57–60 were lowered in both experiment and simulation. These residues are not part of the regular secondary structure of the Ig fold in both the X-ray structures of nDsbD and in the MD simulations.
Figure 2—figure supplement 1
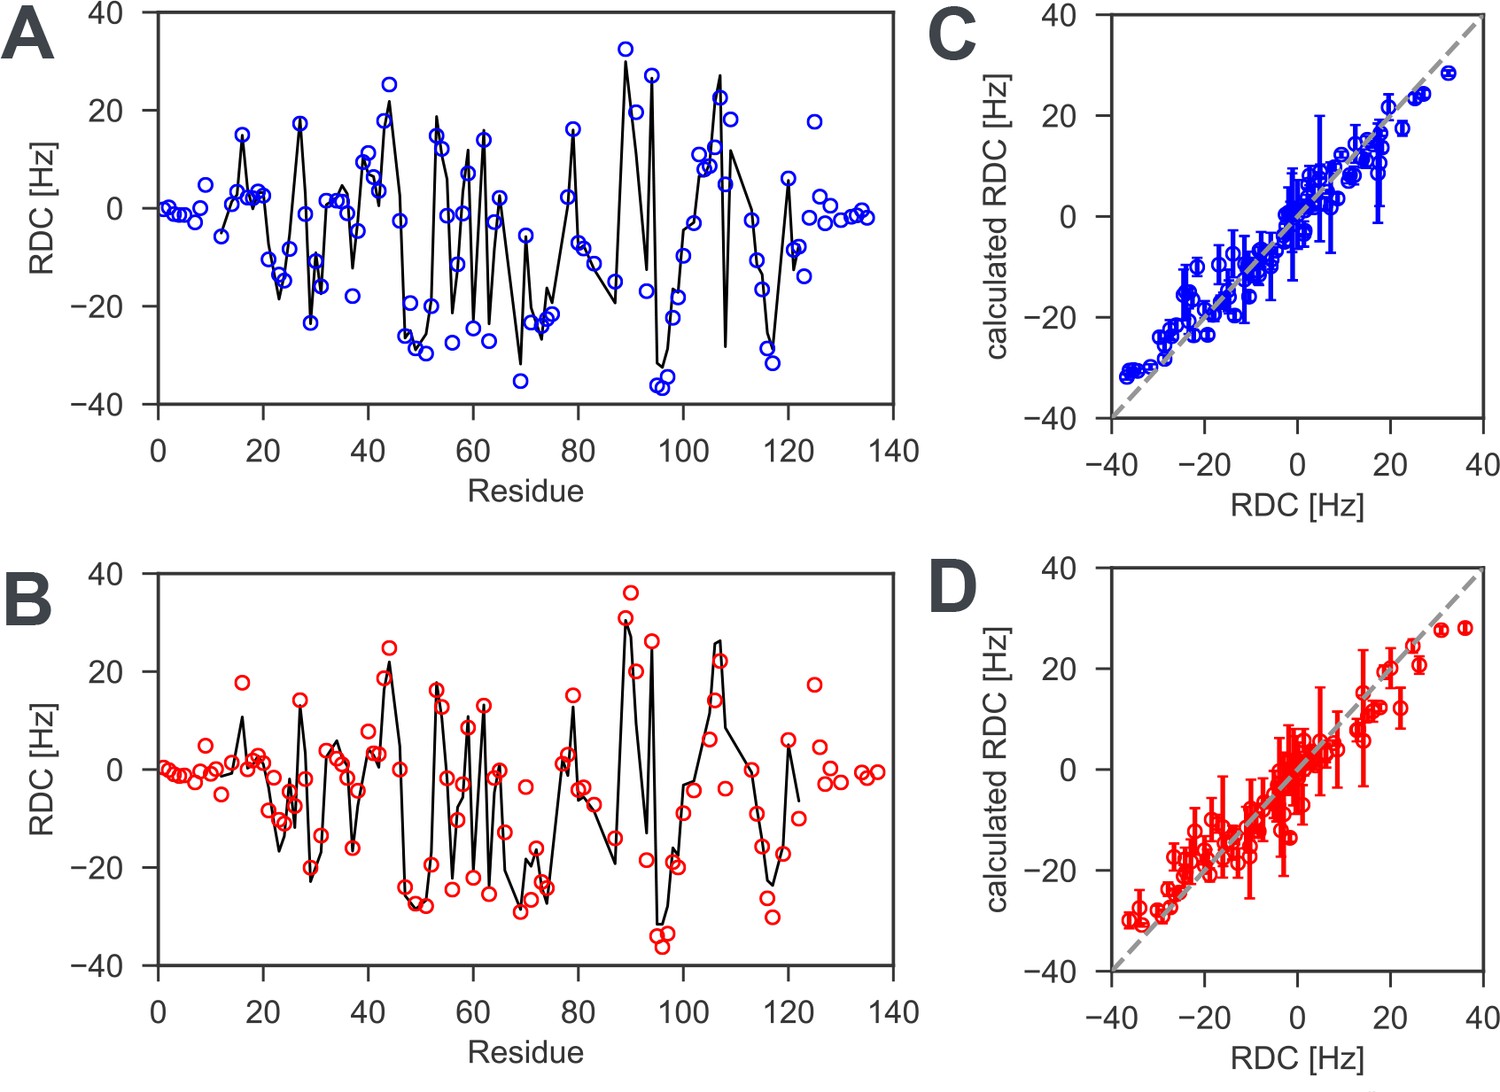
1H −15N residual dipolar couplings (RDCs) for reduced and oxidized nDsbD.
To probe the solution structure of nDsbD, 1H-15N RDCs, which are sensitive reporters of protein structure, were measured for (A) reduced and (B) oxidized nDsbD. Experimental RDCs are indicated by the open circles while RDCs calculated by fitting the alignment tensor to the X-ray structure (PDB:3PFU for reduced and PDB:1L6P for oxidized nDsbD) are indicated by the solid line. For most residues, very similar RDCs were measured for reduced and oxidized nDsbD. The small RDCs measured for residues 1–8 and 126–135 in both redox states are likely to indicate conformational dynamics that lead to averaging of these RDCs; values for most of these residues cannot be predicted from the X-ray structures because electron density is not observed before residue eight and after residue 125 in the structures. By contrast, the RDCs for the core β-sandwich are accurately predicted by the X-ray structures; Q values of 0.17 and 0.21 are obtained for reduced and oxidized nDsbD, respectively (Figure 2—figure supplement 1—source data 1). When fits are carried out for residues 12–122, which includes the core β-sandwich and the active-site/cap-loop residues, Q values of 0.19 and 0.24 are obtained for reduced and oxidized nDsbD, respectively (Figure 2—figure supplement 1—source data 1). The similar Q values for the two sets of RDCs suggest that the orientation of the active-site/cap-loop residues relative to the core β-sandwich of both reduced and oxidized nDsbD in solution is described well by the X-ray structures in which the cap loop adopts a closed conformation. Experimental RDCs are compared with RDCs calculated from MD simulations for (C) reduced and (D) oxidized nDsbD. For both nDsbDred and nDsbDox, the agreement between calculated and experimental RDCs improved for the 1μs MD ensemble compared to the static X-ray structures. It is also interesting to note that the RDCs for residues 106 and 108, which gave poor agreement in the fits to the static X-ray structures due to crystal contacts, agree well with the values predicted from the MD simulations. Errors in RDCs calculated from the MD simulations were determined using resampling of RDCs from trajectory segments.
-
Figure 2—figure supplement 1—source data 1
Quality factors (Q) and alignment tensor parameters (Da, R, θ, ϕ, ψ) obtained from fits of experimental RDCs to X-ray structures and from analysis of the MD trajectories.
- https://cdn.elifesciences.org/articles/54661/elife-54661-fig2-figsupp1-data1-v2.docx
Figure 2—figure supplement 2
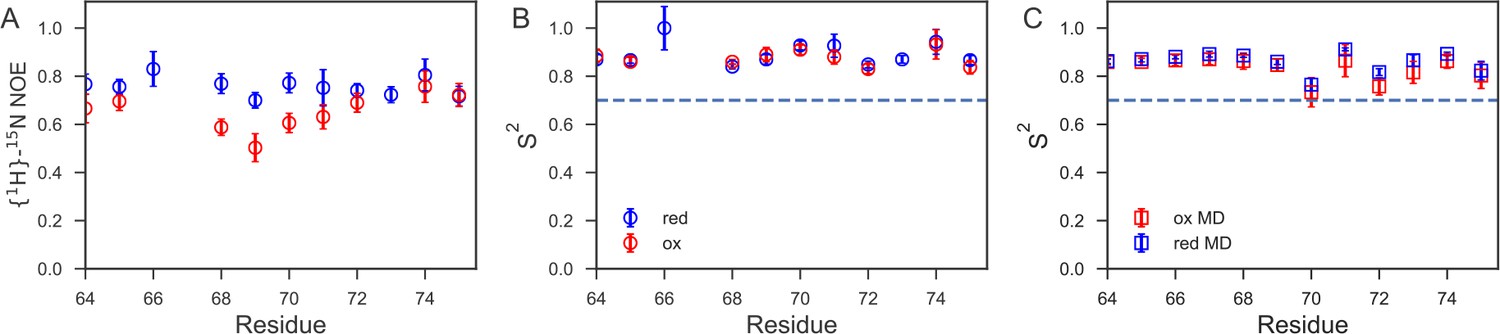
Fast time-scale dynamics of the cap loop.
(A) Comparison of experimental {1H}-15N heteronuclear NOE values for nDsbDred (blue) and nDsbDox (red). (B) Comparison of order parameters (S2) derived from model-free analysis of 15N relaxation data for nDsbDred (blue) and nDsbDox (red). (C) Comparison of order parameters (S2) derived from the MD simulations for nDsbDred (blue) and nDsbDox (red). Errors in the experimental {1H}-15N heteronuclear NOE and the S2 order parameters were determined as described previously using Monte Carlo error estimation (Smith et al., 2013).
-
Figure 2—figure supplement 2—source data 1
Model-free analysis of 15N relaxation data for the cap loop and the flanking β-strands.
- https://cdn.elifesciences.org/articles/54661/elife-54661-fig2-figsupp2-data1-v2.docx
Figure 2—figure supplement 3
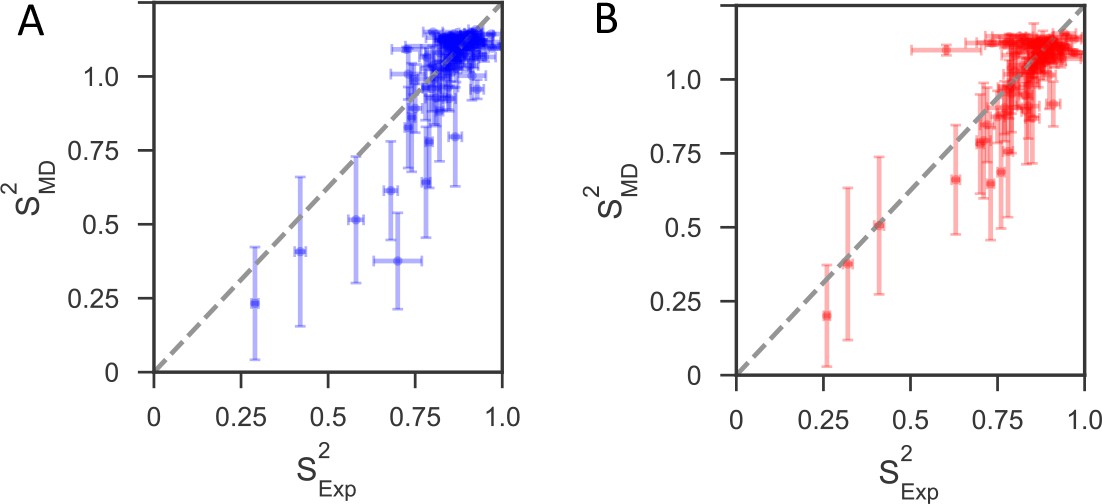
Comparison of backbone order parameters (S2) derived from experimental 15N relaxation data and calculated from the 1μs MD simulations for (A) reduced and (B) oxidized nDsbD.
The extent of the fast-time scale (ps-ns) dynamics observed experimentally by NMR is on the whole correctly reproduced by the MD simulations. The root mean-square deviation (RMSD) between the order parameters detemined from model-free analysis and from the simulations is 0.08 for both reduced and oxidized nDsbD. The N- and C-termini were very flexible, but most residues in the folded segments of nDsbD were well ordered with S2 >0.80, which agrees with experiment. Errors in S2 calculated from the MD simulations were determined using resampling of S2 from trajectory segments.
Figure 3 with 2 supplements
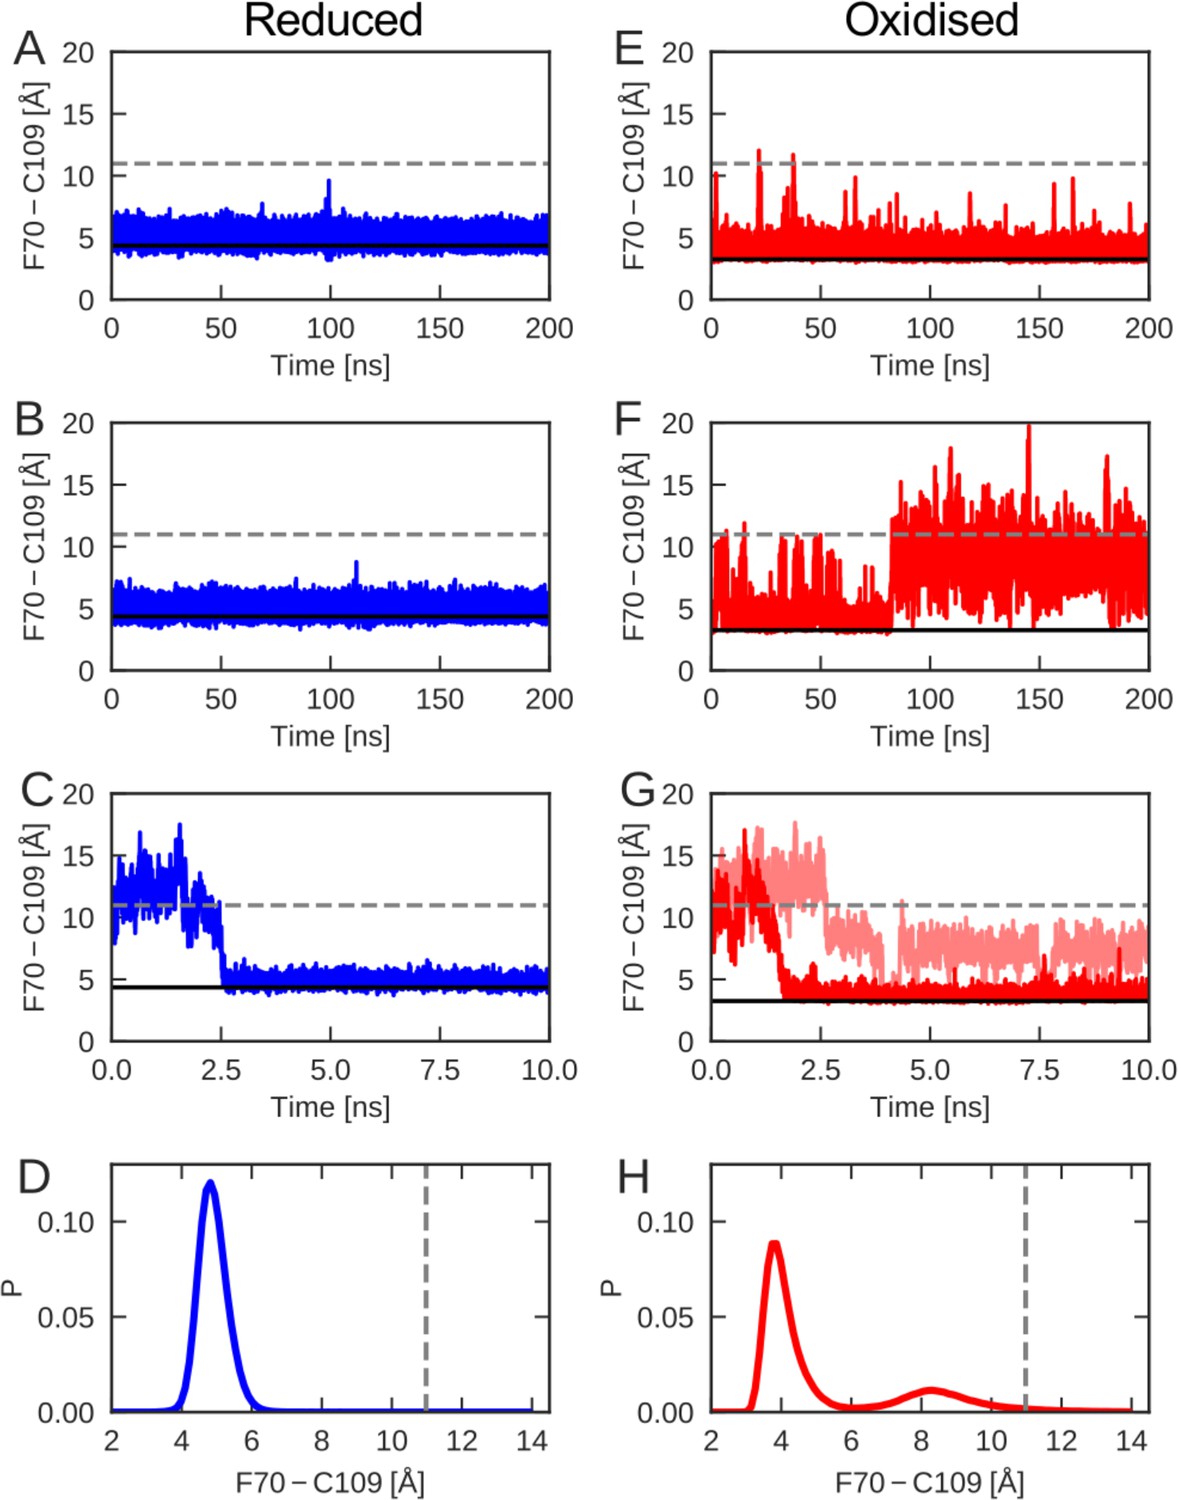
The cap-loop conformation was probed in MD simulations with reduced (A–C) and oxidized (E–G) nDsbD.
The conformational state of the cap loop was followed by tracking the distance between the center of the aromatic ring of F70 and the sulfur atom of C109. The solid and dashed lines at ~3–4 and~11 Å show the F70 ring to C109 Sγ distance in the closed (3PFU/1L6P) and open (1VRS) X-ray structures, respectively. The cap loop remains stably closed in simulations of nDsbDred, as shown in (A) and (B). The cap loop in nDsbDred closes within 3 ns for a simulation started from an open conformation based on the 1VRS structure (C). The 1 μs simulation ensemble for nDsbDred shows a closed conformation of F70 relative to C109 (D). The cap loop conformation is more flexible in simulations of nDsbDox; in some simulations it remains closed (E) while in others the loop opens (F). The loop closes in some simulations of nDsbDox started from an open conformation (G). Overall, the 1 μs simulation ensemble for nDsbDox shows a preference for the closed conformation of F70 relative to C109, with open conformations sampled relatively rarely (H).
Figure 3—figure supplement 1

Distances between the aromatic ring of F70 and the Sγ of C109 for additional MD simulations.
Data for an additional 600 ns of MD simulations, not illustrated in Figure 3, are shown for reduced (left) and oxidized (right) nDsbD. The conformational state of the cap loop was followed by tracking the distance between the center of the aromatic ring of F70 and the sulfur atom of C109. The solid and dashed lines at ~3–4 and ~11 Å show the F70 ring to C109 Sγ distance in the closed (3PFU/1L6P) and open (1VRS) X-ray structures, respectively. The cap loop remains stably closed in simulations of nDsbDred (left). The cap loop conformation is more flexible in simulations of nDsbDox (right) showing several transient and longer-lived opening events. Data for ten 20 ns simulations are combined in the bottom panels; the vertical grey lines show the starting and ending points of these shorter 20 ns simulations.
Figure 3—figure supplement 2
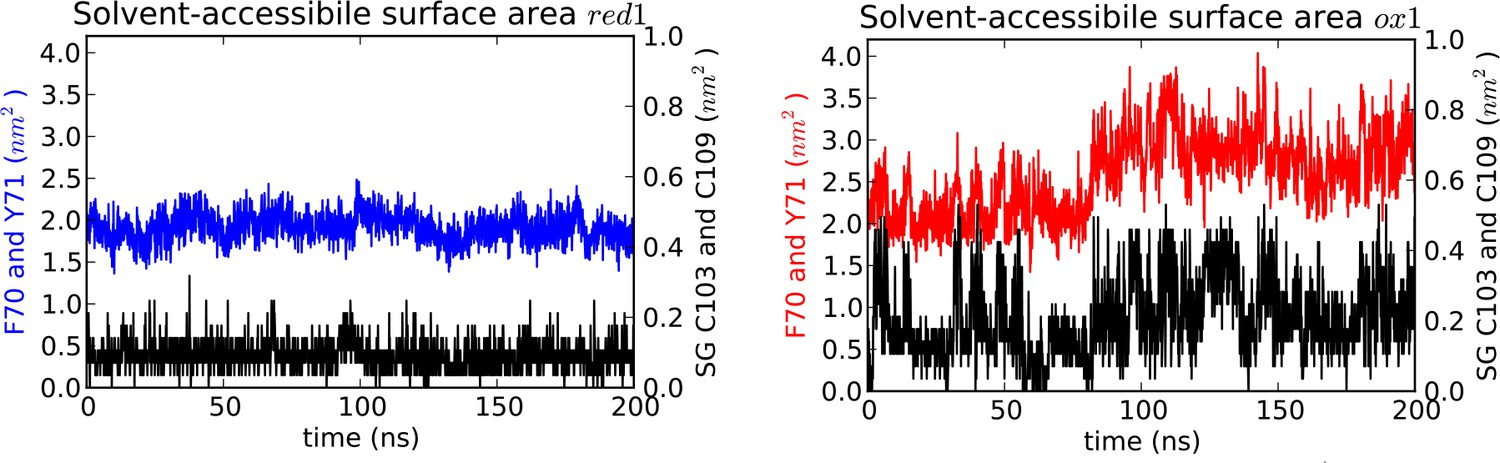
Solvent accessible surface area (SASA) measured for MD simulations.
SASA is plotted for the aromatic cap loop residues F70 and Y71 and for the Sγ of C103 and C109 in simulations of nDsbDred (left) and nDsbDox (right). The Sγ of C103 and C109 remain largely shielded from solvent in nDsbDred but become more exposed during loop opening in nDsbDox. The SASA of the aromatic rings of F70 and Y71 also increases during the main loop opening event between 80 and 200 ns. These data are derived from the trajectories shown in Figure 3A and F.
Figure 4 with 2 supplements
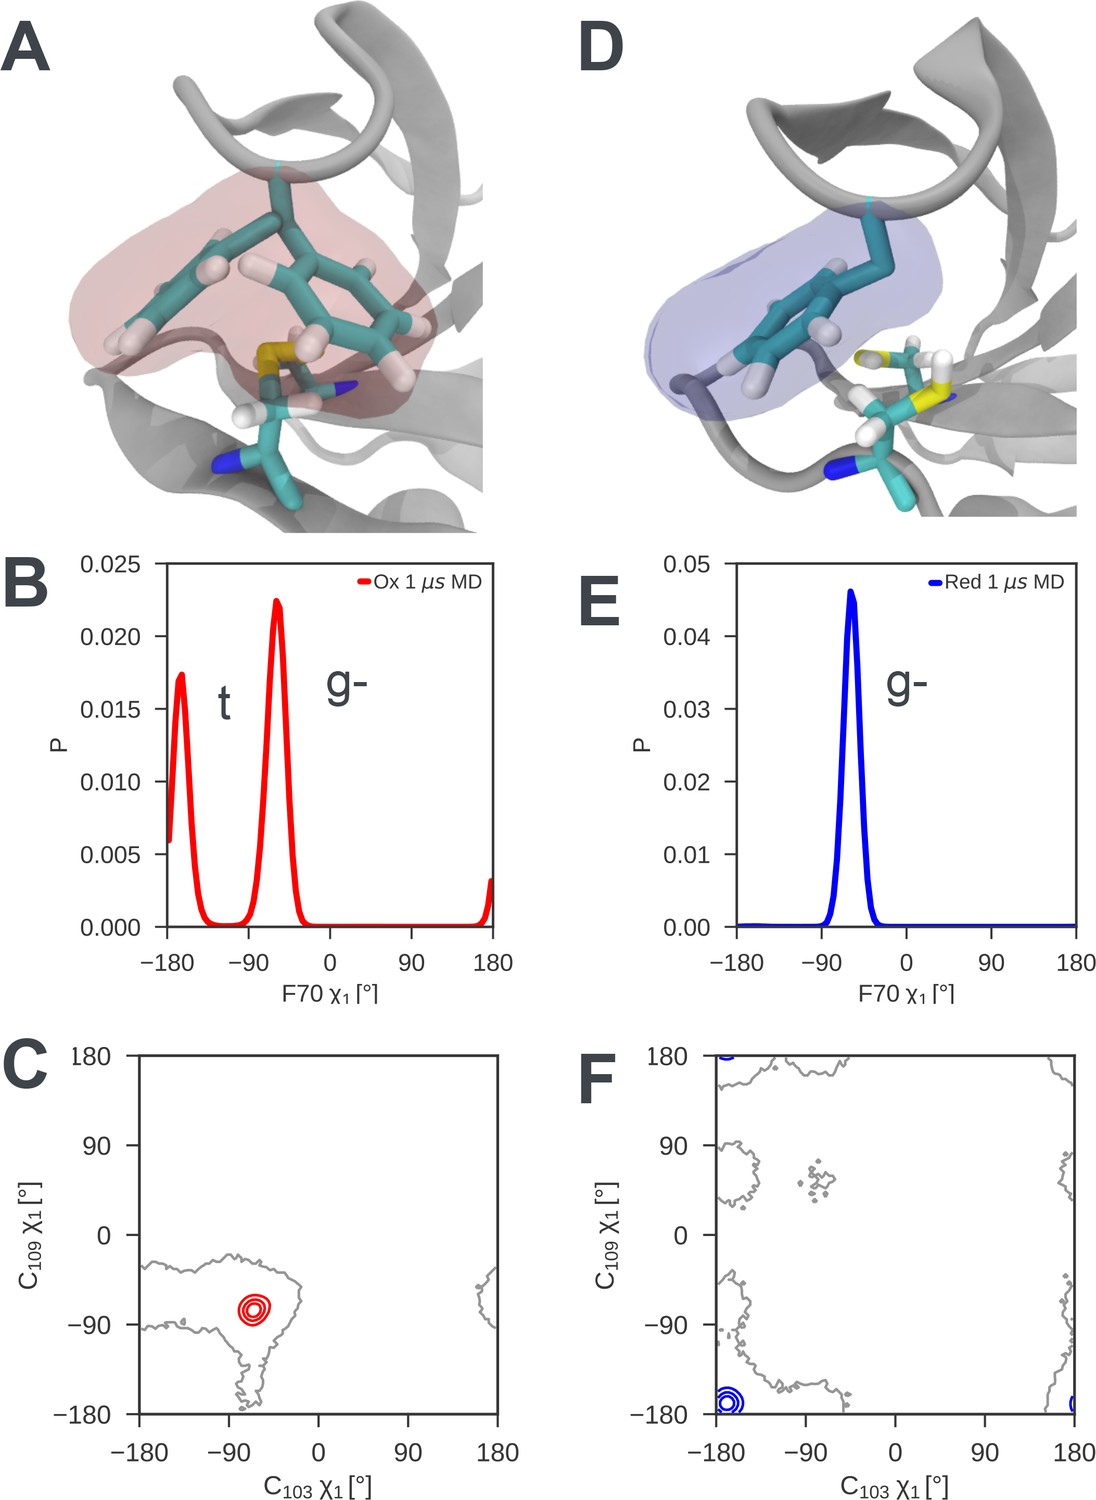
Local frustration destabilizes the cap loop of oxidized nDsbD while the cap loop of reduced nDsbD packs stably onto the active site.
(A) In nDsbDox, the side chain of F70 switches between a gauche- and trans orientation in MD simulations as shown by the mass density calculated for F70 (red). (B) The gauche- and trans conformations are approximately equally populated in the 1 μs MD simulations of nDsbDox. (D) The cap loop and the active site of nDsbDred are rigid as shown by the mass density calculated for F70 (blue). The well-defined density closely circumscribes the position of the F70 side chain in the 3PFU crystal structure. (E) F70 is locked in the gauche- conformation. The surfaces in (A) and (D) surround points with at least 0.12 relative occupancy; these structures were rendered using VMD (Humphrey et al., 1996). The side chains of C103 and C109 in the active site of nDsbD adopt different conformations in the oxidized (C) and reduced (F) isoforms as shown by contour plots of their χ1 dihedral angles. Here 1 μs of MD simulations is analysed for each redox state.
Figure 4—figure supplement 1
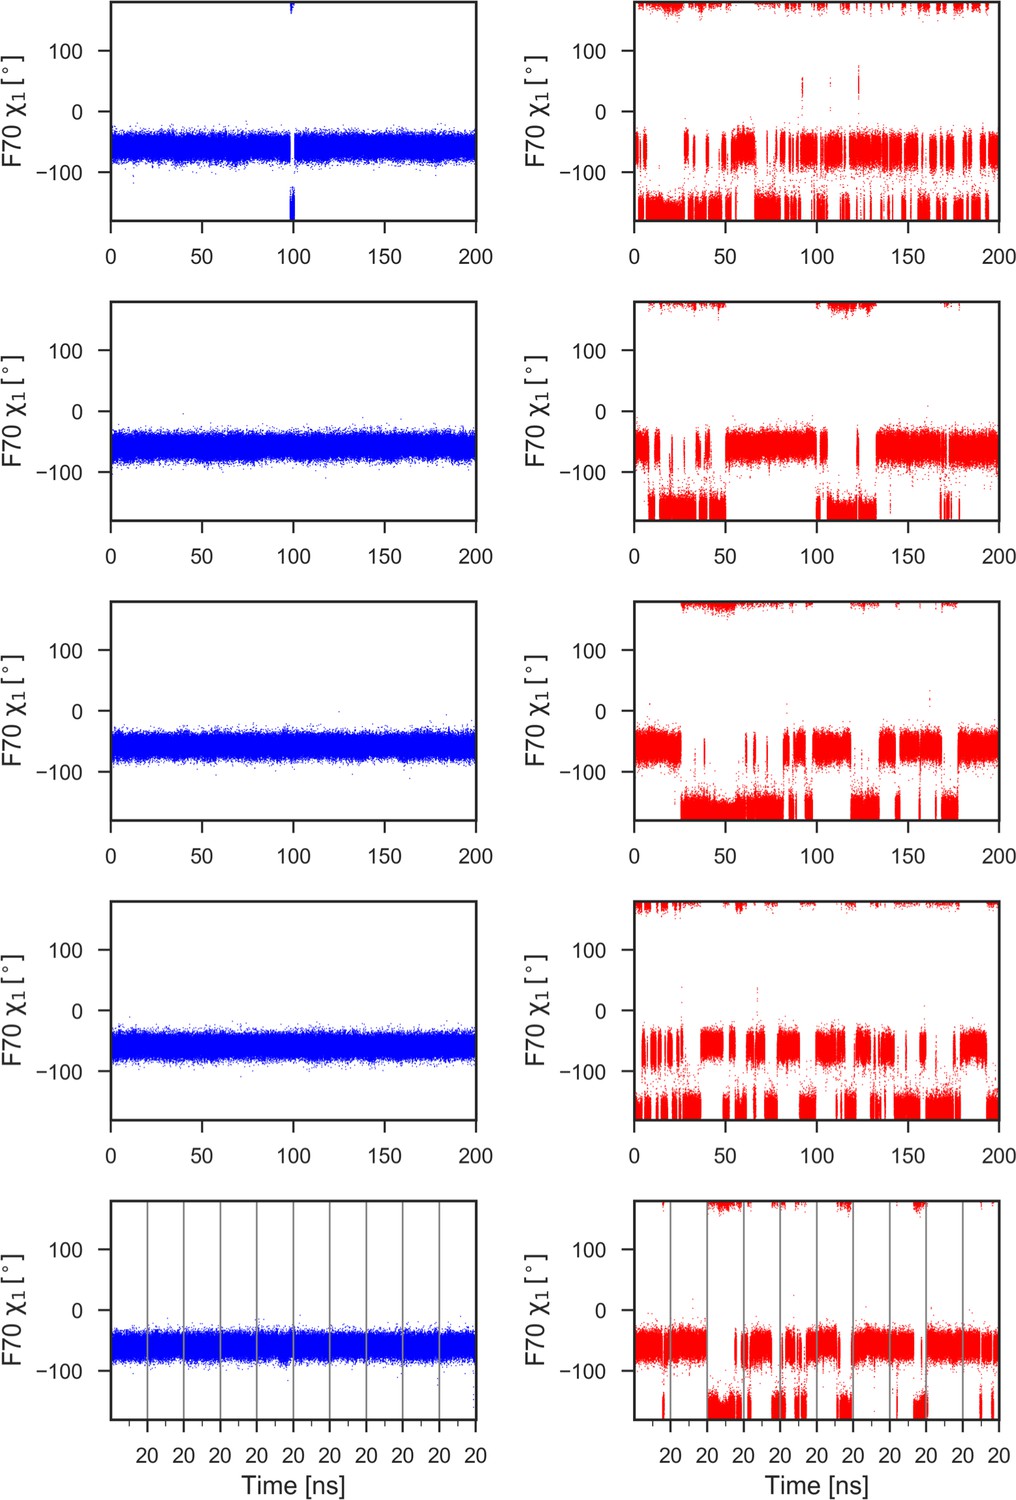
F70 χ1 torsion angle during 1μs of MD simulations for reduced (left) and oxidized (right) nDsbD.
With the exception of a brief excursion to the trans (t) conformer (χ1 = −180o) in the top left panel, F70 remains in the gauche- (g-) conformer (χ1 = −60o) throughout the 1μs of MD simulations in nDsbDred (left panels). By contrast, in nDsbDox, F70 interconverts frequently between the g- and t conformers (right panels). In closed structures (F70-C109 distance <6 Å), the g- and t conformers are sampled 61.5% and 38.5% of the time, respectively, while in open structures the g- and t conformers are sampled 52.9% and 47.1% of the time, respectively. Data for ten 20 ns simulations are combined in the bottom panels; the vertical grey lines show the starting and ending points of these shorter 20 ns simulations.
Figure 4—figure supplement 2
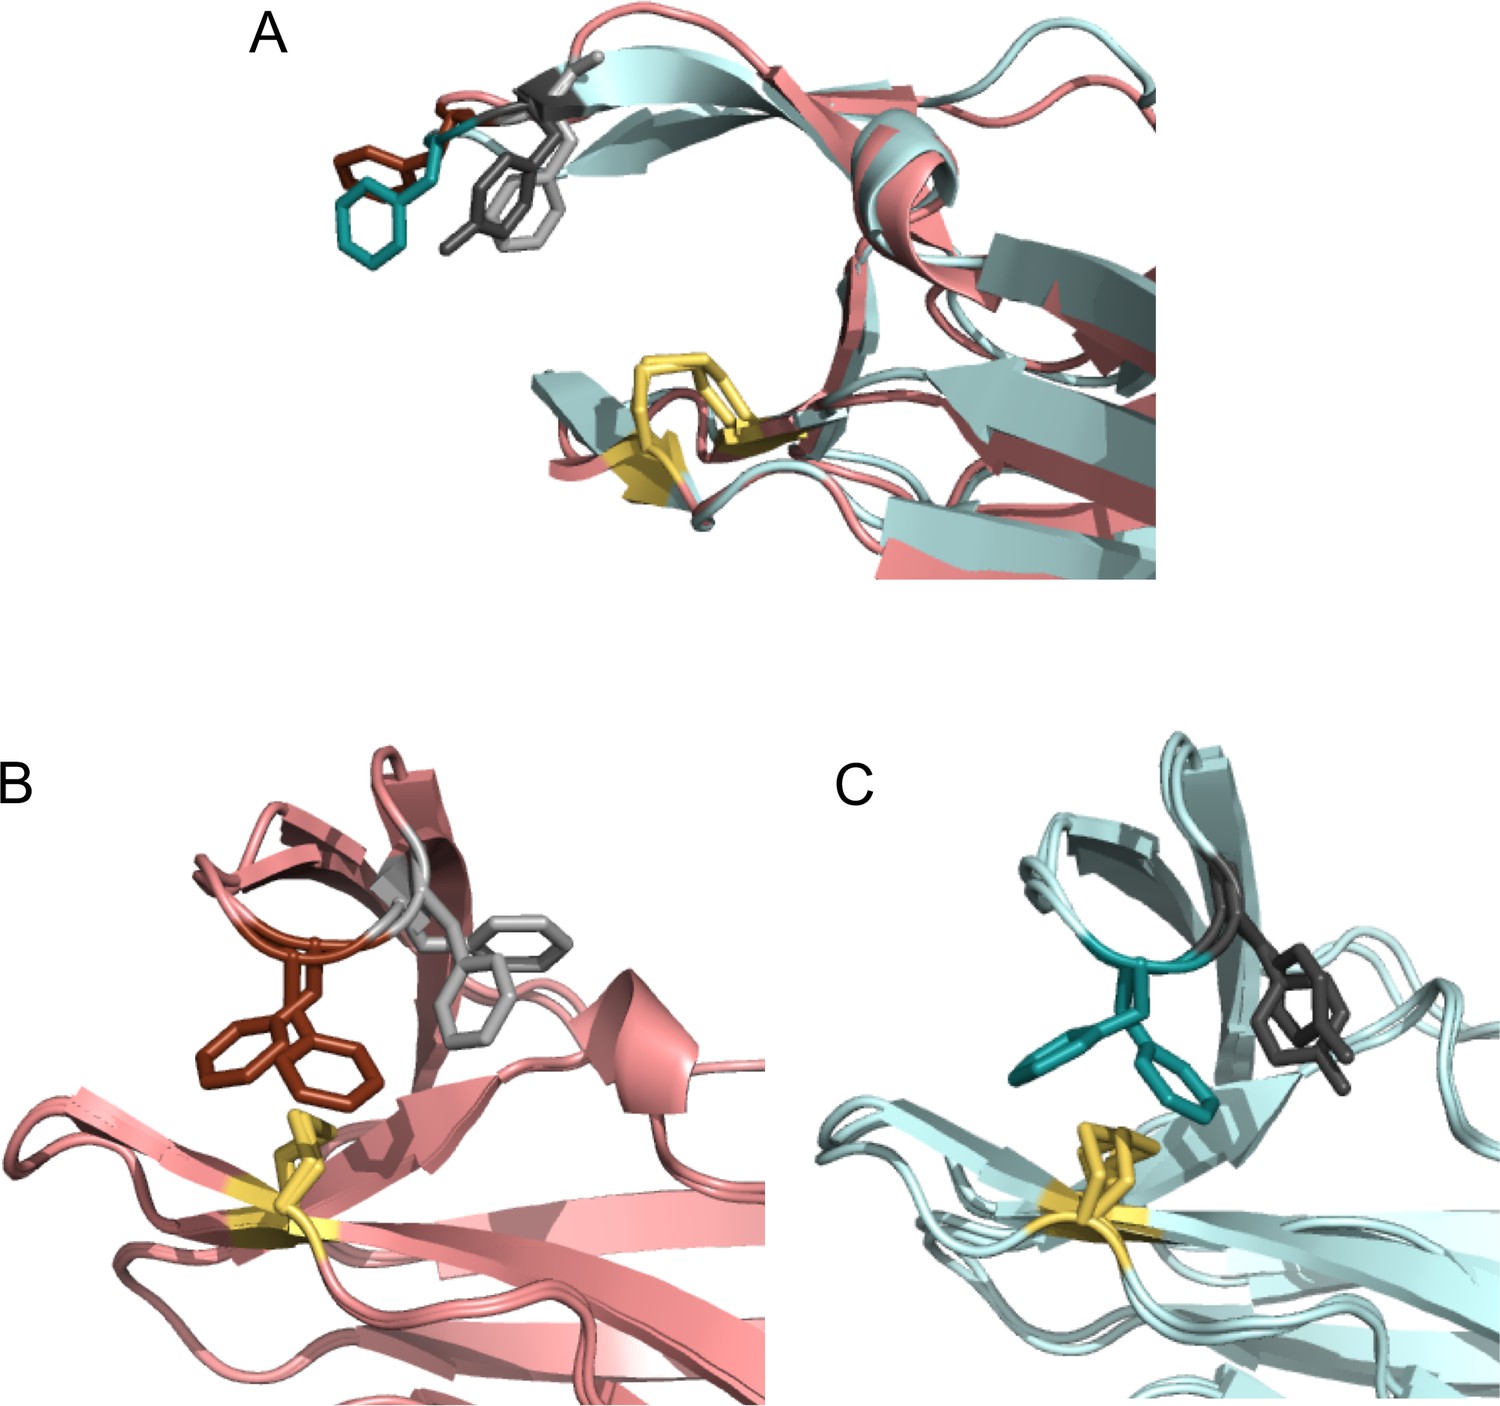
Comparison of ‘snapshots’ of E. coli nDsbDox from MD simulations with the X-ray structure of Neisseria meningitidis nDsbDox.
N. meningitidis nDsbDox crystallizes in the P213 space group with six molecules (denoted A to F) in the asymmetric unit (PDB: 6DPS [Smith et al., 2018]). (A) One of the six molecules (E) in the asymmetric unit has an open ‘Phen cap’ loop. This structure superimposes well with the open conformation of E. coli nDsbDox observed in MD simulations. (B) The other five molecules in the N. meningitidis nDsbDox asymmetric unit have a closed ‘Phen cap’ loop with the aromatic ring of F66 packing onto the C100-C106 disulfide bond in both gauche- and trans conformations. Shown here is a superposition of molecules B and C from the unit cell. (C) Superposition of two closed conformations of E. coli nDsbDox observed in the MD simulations showing F70 adopting the ‘frustrated’ gauche- and trans orientations. (A–C) The backbone of nDsbDox from E. coli and N. meningitidis are shown in cyan and salmon, respectively. F70 (dark teal), Y71 (dark grey), F66 (dark salmon), F67 (light grey) and the C103-C109 and C100-C106 disulfide bonds (yellow) are shown in a stick representation.
Figure 5 with 6 supplements
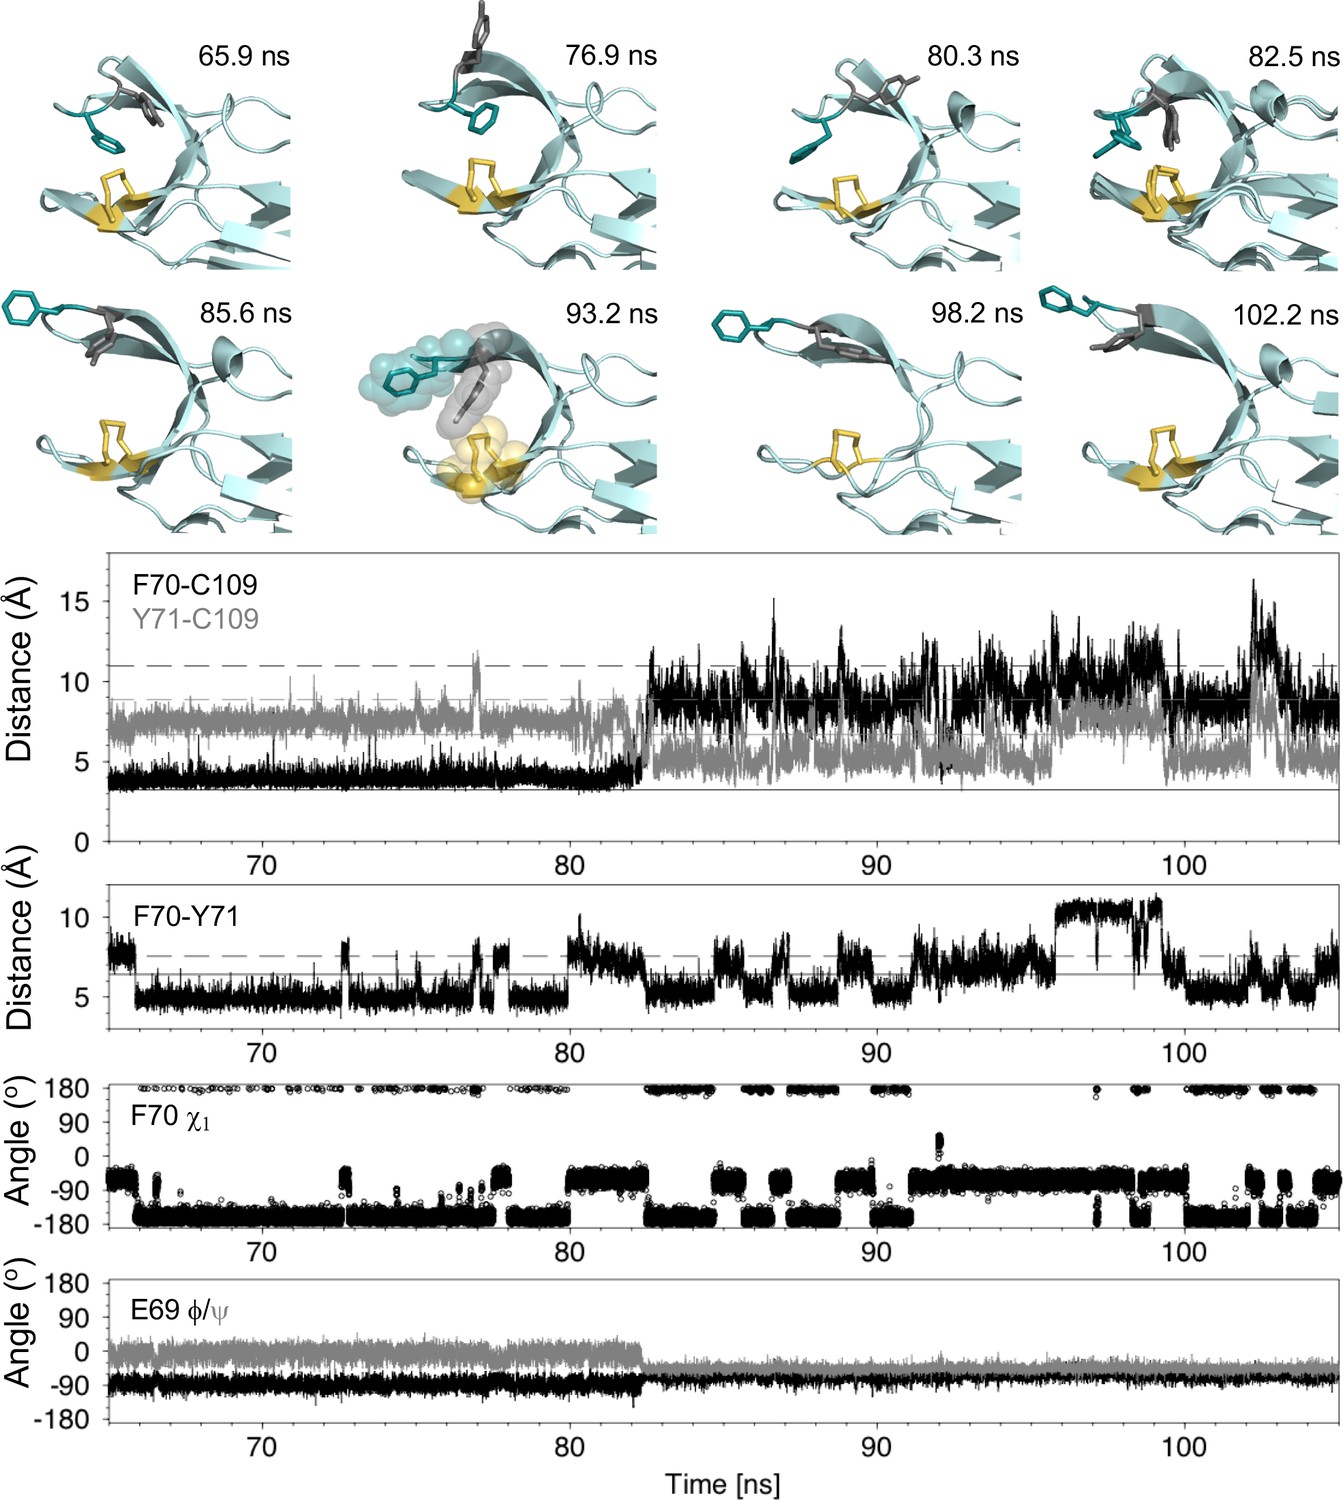
Analysis of the major cap-loop opening event observed in MD simulations of nDsbDox.
Top: Snapshots of structures generated from the MD simulation between 65 and 105 ns show the range of cap loop conformations and, in particular, the F70 and Y71 side chain positions that are sampled. The backbone of nDsbD is shown as a cartoon in pale cyan. F70, Y71 and C103/C109 are shown in a stick representation and colored deep teal, grey and yellow, respectively. Two structures are overlaid in the 82.5 ns panel; these illustrate the conversion of F70 from the gauche- to the trans conformation observed simultaneously with loop opening. A surface representation is used in the 93.2 ns snapshot to illustrate how Y71 blocks closing of the cap loop. Bottom: Structural parameters are plotted as a function of simulation time. The distance from the center of the rings of F70 and Y71 to C109 Sγ are shown in black and grey in the first panel. The distance between the ring centres of F70 and Y71 are shown in the second panel. The solid and dashed lines show these distances in the closed (1L6P) and open (1VRS) X-ray structures, respectively. In the third and fourth panels, the F70 χ1 torsion angle and the E69 ϕ and ψ torsion angles are shown. These and additional structural parameters are shown in the figure supplements for the entire loop opening period (60–200 ns) and for a second 22 ns loop opening event.
Figure 5—figure supplement 1
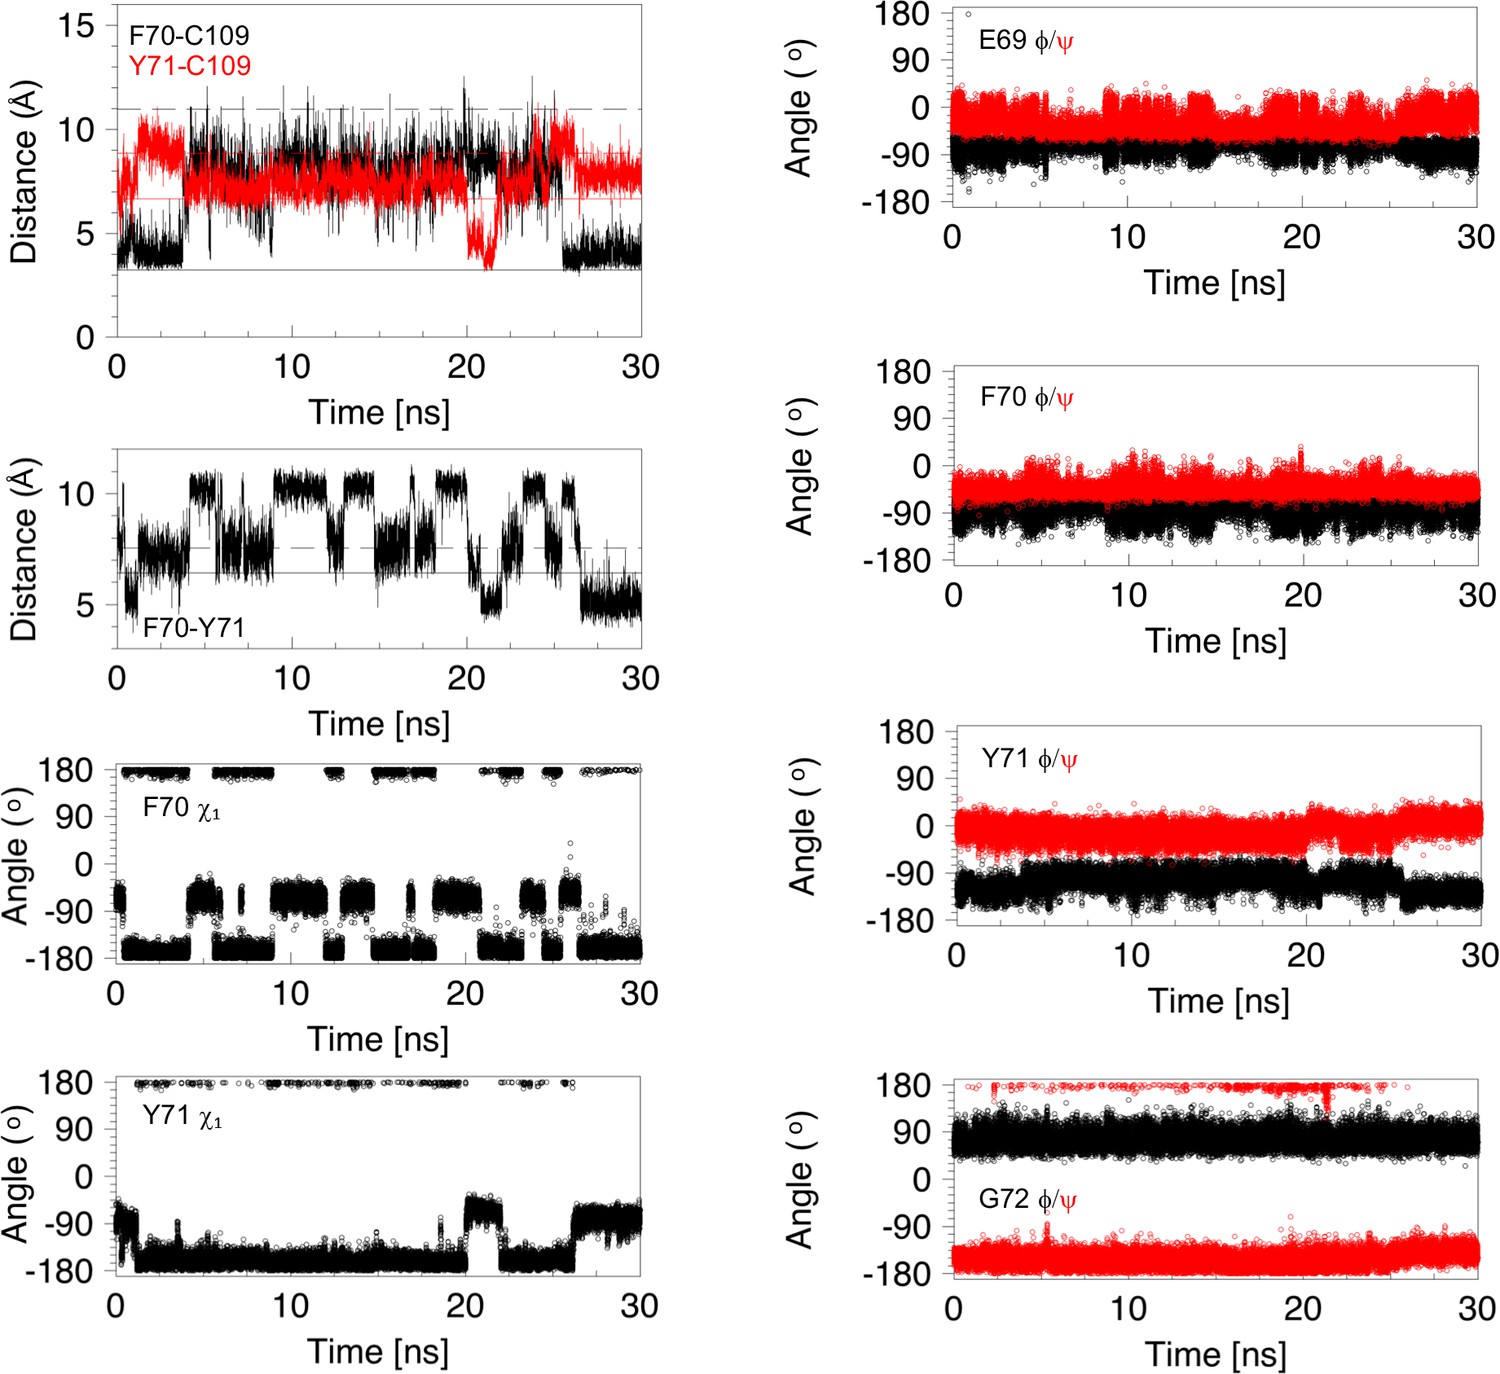
Analysis of distances and torsion angles for 30 ns of a molecular dynamics trajectory showing a 22 ns cap loop opening.
Structural parameters, derived from the first 30 ns of the MD trajectory shown in Figure 3—figure supplement 1 (middle right panel), are plotted as a function of time. The four panels on the left show the distance between C109 Sγ and the centres of the F70 (black) and Y71 (red) aromatic rings, the distance between the center of the aromatic rings of F70 and Y71, and the χ1 torsion angles of F70 and Y71. The four panels on the right show the ϕ (black) and ψ (red) torsion angles for E69, F70, Y71 and G72. The cap loop opens after 3.8 ns and remains open for 21.7 ns. The loop opens with F70 in the trans conformer but this χ1 angle changes several times while the loop is open. Before loop opening, the aromatic ring of Y71 is farther away from C109 than in the 1L6P X-ray structure. This is due to the trans χ1 conformer. At ~20 ns the Y71 χ1 switches to the gauche- conformer; this brings the ring of Y71 closer to C109 and places the ring in between F70 and C109 in a ‘blocking’ conformation. At ~22 ns the ring of Y71 moves out of this position, and away from C109, allowing the loop to close at 25.5 ns. The backbone torsion angles of E69, F70, Y71 and G72 show some of the features in the open conformations that have been highlighted for the major opening event in Figure 5—figure supplement 4. When the loop closes at 25.5 ns, these torsion angles return to values typical of the closed conformation of nDsbD. Snapshots of structures from this opening event are shown in Figure 5—figure supplement 5.
Figure 5—figure supplement 2
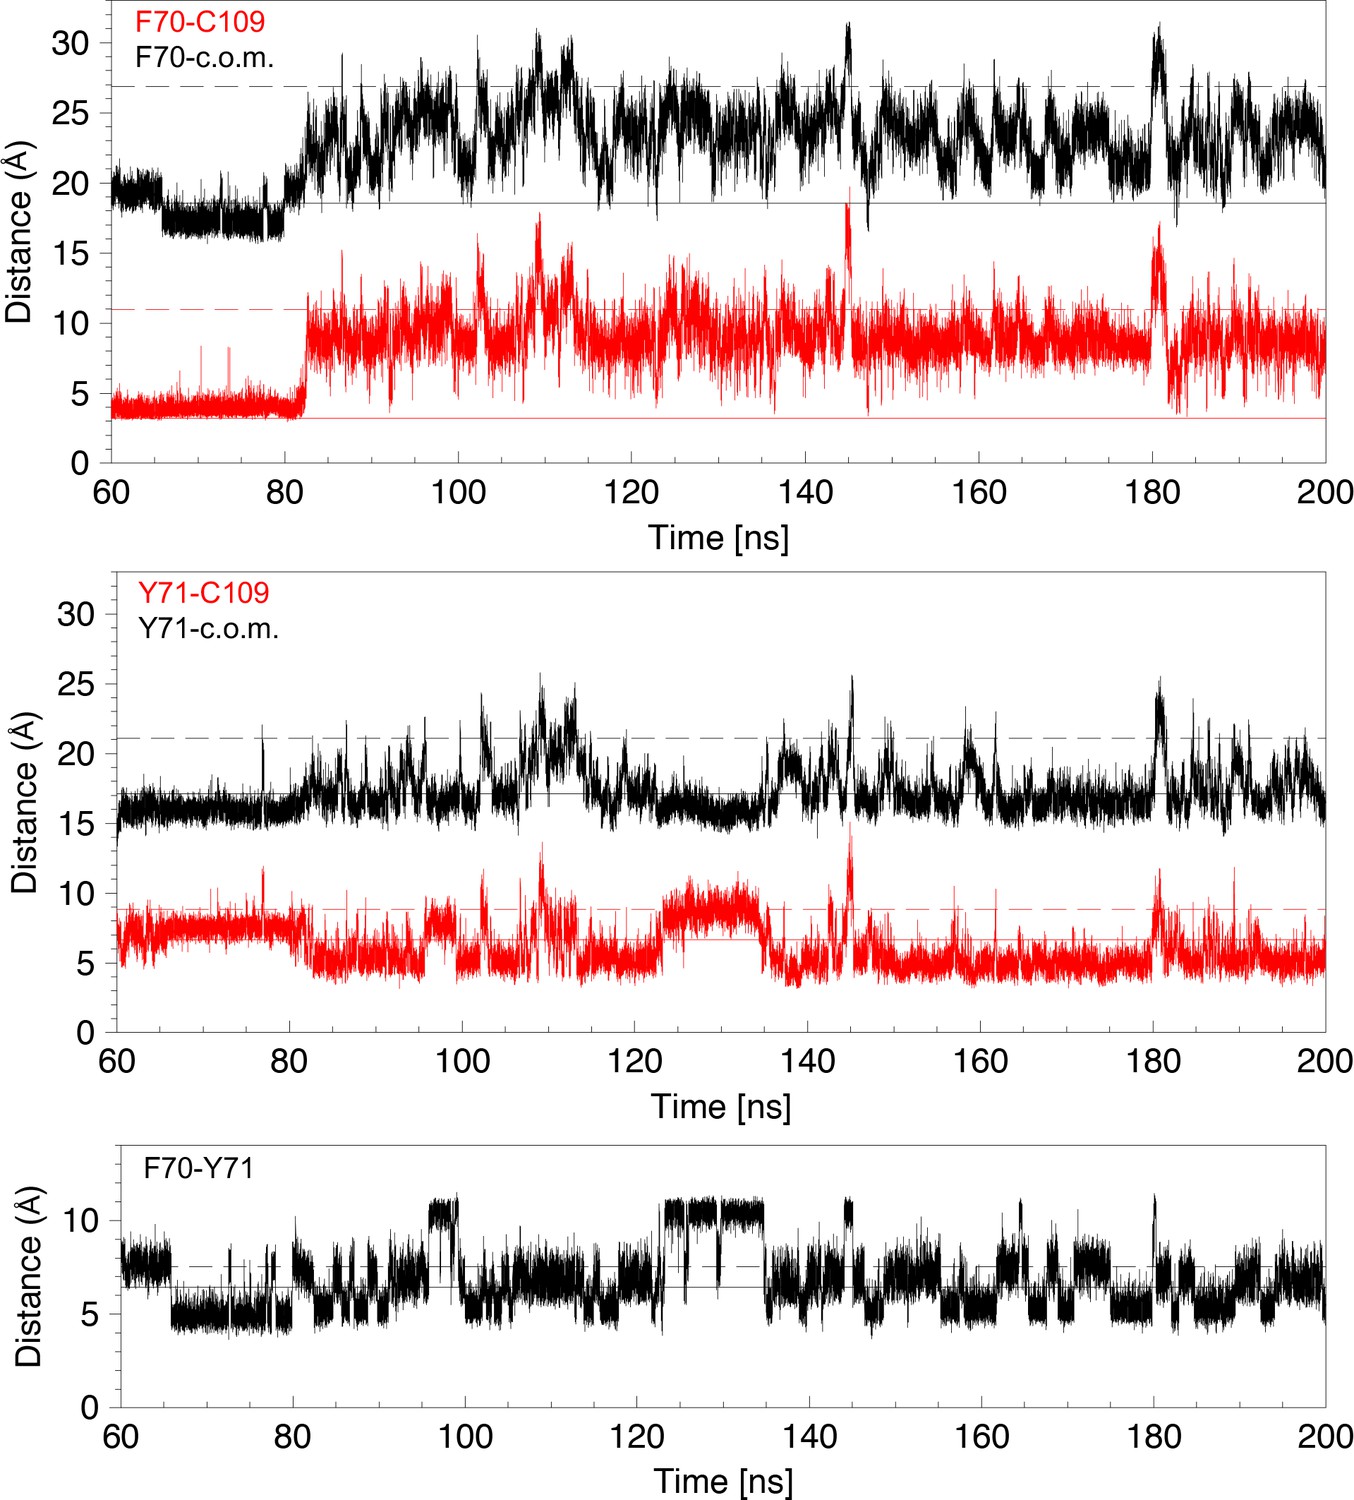
Analysis of distances for 140 ns of a molecular dynamics trajectory showing cap loop opening.
Distances are derived from the MD trajectory shown in Figure 3F. Top panel: The distance between the center of the F70 aromatic ring and C109 Sγ (red) or the center of mass (c.o.m.) (black) are plotted as a function of time. The solid and dashed lines in the three panels show these distances in the closed 1L6P and open 1VRS X-ray structures. The center of mass of nDsbD in the 1L6P X-ray structure was determined to coincide with W33 Cε2. Both these distances are a good indicator of whether the cap loop is closed or open. The distance to the center of mass decreases at ~66 ns because of the change of the F70 χ1 conformation from gauche- to trans. Middle panel: The distance between the center of the Y71 aromatic ring and C109 Sγ (red) or the center of mass (c.o.m) (black) are plotted as a function of time. The distance from Y71 to C109 is a less clear indicator of cap loop opening because this distance first decreases as Y71 moves past C109 and then increases again as Y71 adopts more open conformations. In structures in which Y71 sits between F70 and C109, and blocks loop closing, the distance of Y71 to C109 is reduced. Bottom panel: The distance between the centres of the aromatic rings of F70 and Y71 is plotted as a function of time. This can vary from ~5 to ~11 Å. The shorter distance usually corresponds to F70 χ1 in the trans conformation. The longer distance, observed at ~95–100 and ~125–135 ns, corresponds to the rings pointing in opposite directions usually with the F70 and Y71 χ1 in the gauche- and trans conformations, respectively.
Figure 5—figure supplement 3
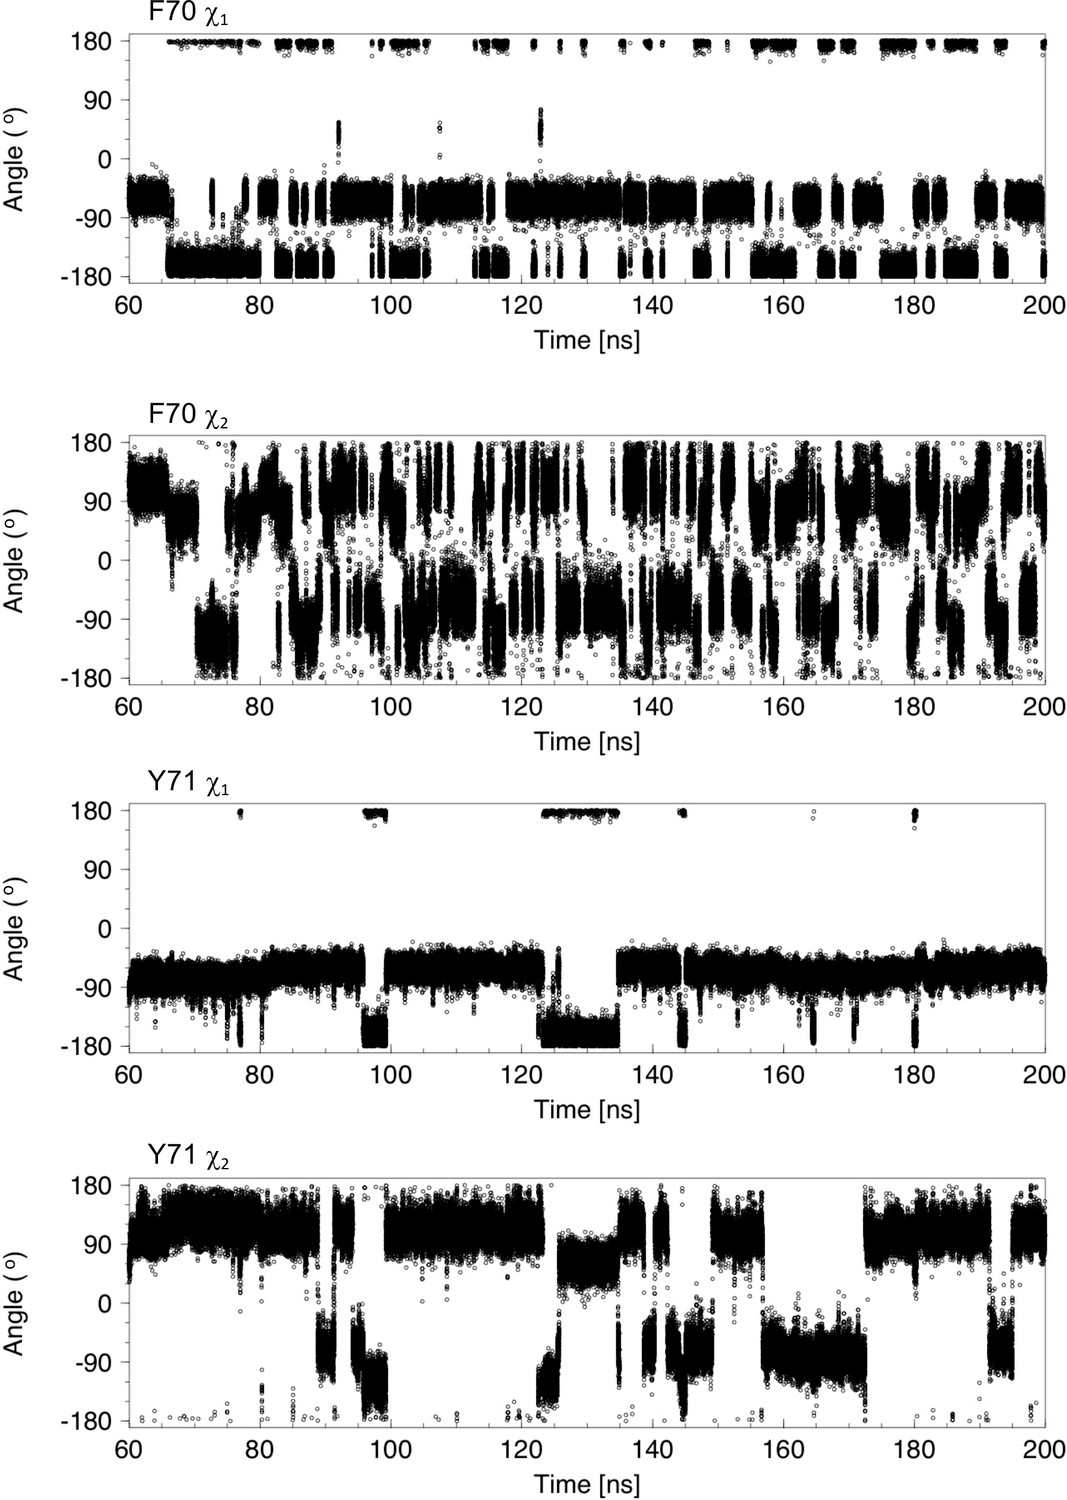
Analysis of χ1 and χ2 torsion angles for 140 ns of a molecular dynamics trajectory showing cap loop opening.
The sidechain χ1 and χ2 torsion angles of F70 and Y71 are plotted as a function of time. In nDsbDox, F70 interconverts between the gauche- (−60o) and trans (−180o) conformations. At 60 ns, the cap loop is closed with F70 χ1 in the gauche- conformation. At ~66 ns, F70 χ1 switches to the trans conformation; this is accompanied by a change in the F70 χ2 angle from ~120o to ~65o. The cap loop begins to open at 82.5 ns and this coincides with a change of the F70 χ1 from −60o to −180o. After loop opening, F70 χ1 continues to interconvert between the gauche- and trans conformations. In the more exposed open conformation the aromatic ring of F70 undergoes frequent ring flips, as evidenced by 180°Changes in χ2, but also changes between the ~120o (or ~ −60o) to ~65o (or ~ −115o) orientations observed before loop opening. The Y71 χ1 torsion angle changes less frequently than F70 and has a marked preference for the gauche- conformer. Transitions to the trans conformer correlate with the largest F70-Y71 ring-to-ring distances observed in panel (A); these changes to the trans conformer are coupled to changes in χ2 from ~120o (or ~ −60o) to ~65o (or ~ −115o). Ring flips of Y71 are less frequent due to its less exposed conformation.
Figure 5—figure supplement 4

Analysis of ϕ and ψ torsion angles for 140 ns of a molecular dynamics trajectory showing cap loop opening.
Backbone ϕ (black) and ψ (red) torsion angles are plotted as a function of time for residues D68, E69, F70, Y71 and G72. These angles change at 82.5 ns, the time at which the cap loop opens. The ϕ and ψ values for E69 become less variable in the open loop while the values for the other residues appear to be more variable. Between ~160 and 180 ns, the ϕ and ψ angles of D68 and E69 return to values observed when the loop is closed. These changes are correlated with the presence (in the closed structure) or absence (in most of the open conformations) of a hydrogen bond between the backbone HN of Y71 and the D68 sidechain carboxyl group.
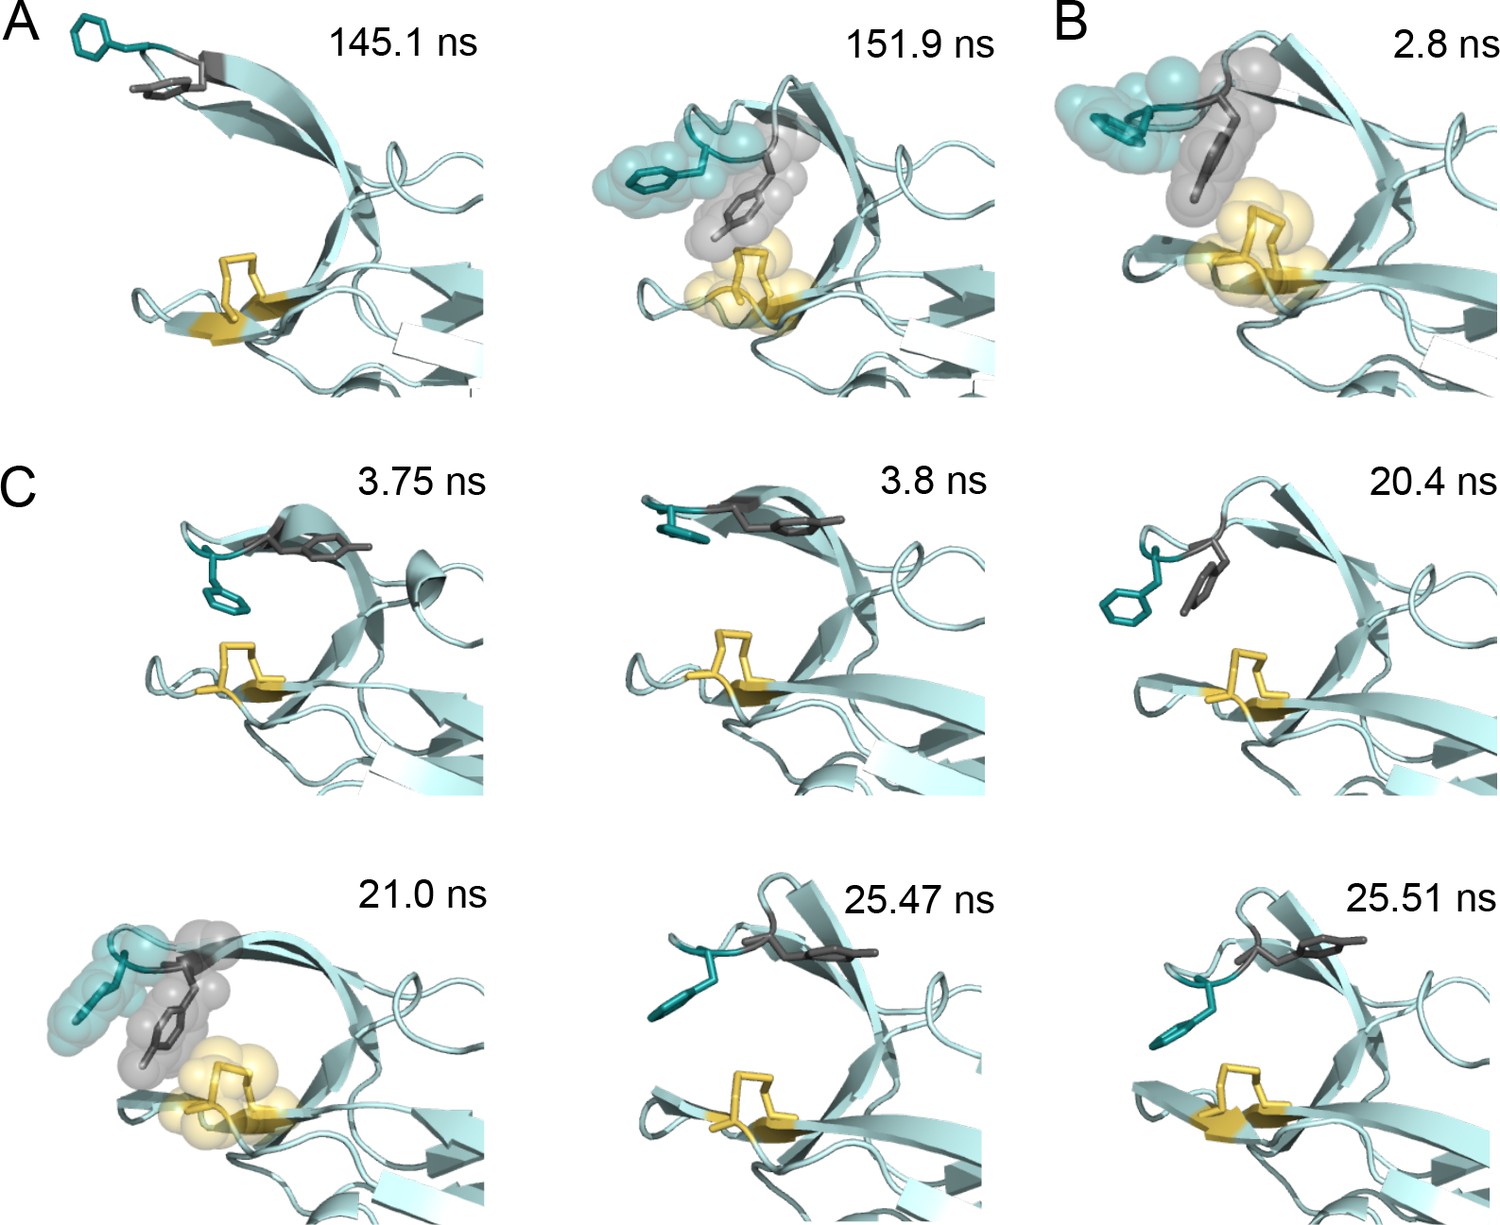
Figure 5—figure supplement 5
Snapshots of structures generated from the molecular dynamics simulations of nDsbDox.
(A) Two structures taken from the major loop opening described in Figure 5 and Figure 5—figure supplements 2–4. At 145.1 ns the cap loop adopts a very open conformation (F70-to-C109 distance of >16 Å) that may be important for the initial docking of cDsbD leading to complex formation. At 151.9 ns Y71 adopts a position between F70 and C109 that blocks loop closing. (B) A structure taken from the loop closing simulation of nDsbDox shown in Figure 3G (in pink). At 2.8 ns Y71 adopts a position in between F70 and C109 which blocks the loop from closing immediately. (C) Six structures taken from the ~22 ns loop opening event described in Figure 5—figure supplement 1. Prior to loop opening, at 3.75 ns, F70 and Y71 both adopt the trans χ1 conformation with Y71 farther away from C109 than observed in the closed 1L6P X-ray structure. Loop opening at 3.8 ns involves F70 moving up and away from C109. At 20.4 ns the Y71 χ1 changes to the gauche- conformer bringing the ring of Y71 closer to C109 allowing it to adopt a ‘blocking’ conformation at 21 ns. Prior to loop closing Y71 returns to the trans conformation (25.47 ns) allowing F70 to approach C109 and leading to loop closure (25.51 ns). In all panels the backbone of nDsbD is shown as a cartoon in pale cyan. F70, Y71 and C103/C109 are shown in a stick representation and colored deep teal, grey and yellow, respectively. A surface representation is used in the snapshots that show the ‘blocking’ conformation of Y71.
Figure 5—figure supplement 6
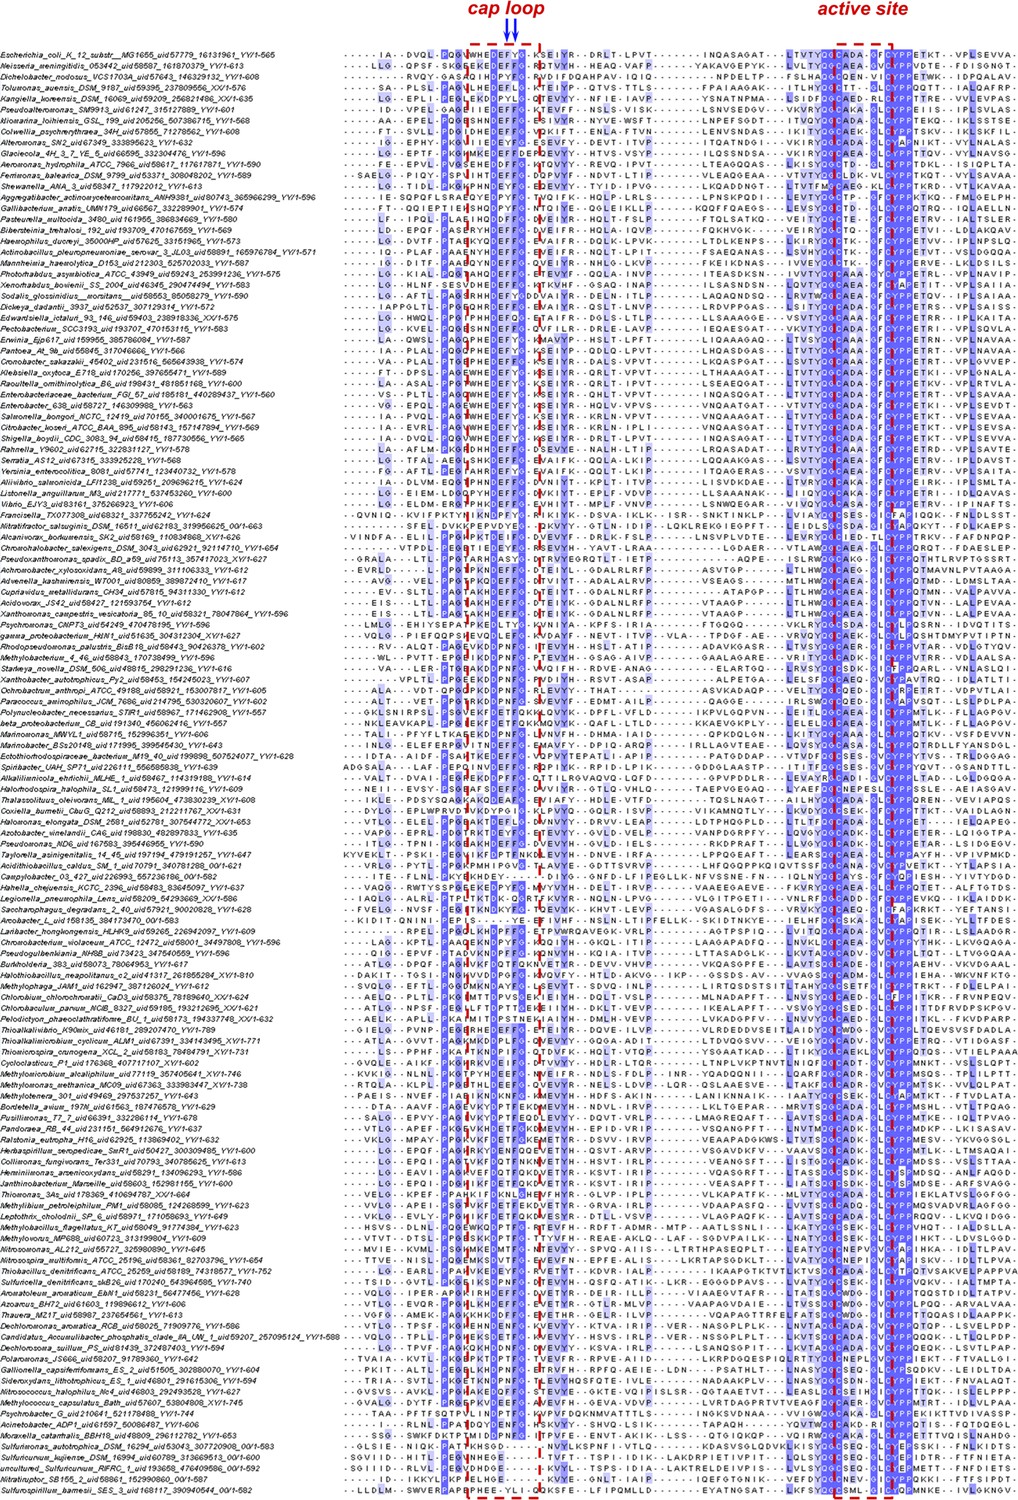
Sequence alignment of the cap-loop and active-site regions of nDsbD from β- and γ-proteobacteria.
The figure shows a sequence alignment of representative nDsbD protein sequences from β- and γ-proteobacteria; only part of each nDsbD sequence is shown, spanning residues A53 to L119 in E. coli nDsbD. 2753 representative bacterial and archaeal proteomes were selected for homologues of nDsbD, and a subset of 731 sequences clustering around the E. coli DsbD were selected for subsequent analysis as a consistent phylogenetic group of proteins, belonging to mostly β- and γ-proteobacteria. 134 sequences, on per bacterial genus, were aligned along with E. coli nDsbD (top). The cap loop region and active-site cysteines are indicated by the red dashed lines, and positions 70 and 71 in E. coli nDsbD are indicated by blue arrows.
Figure 6 with 2 supplements
15N relaxation dispersion experiments were used to determine the μs-ms dynamics of nDsbD.
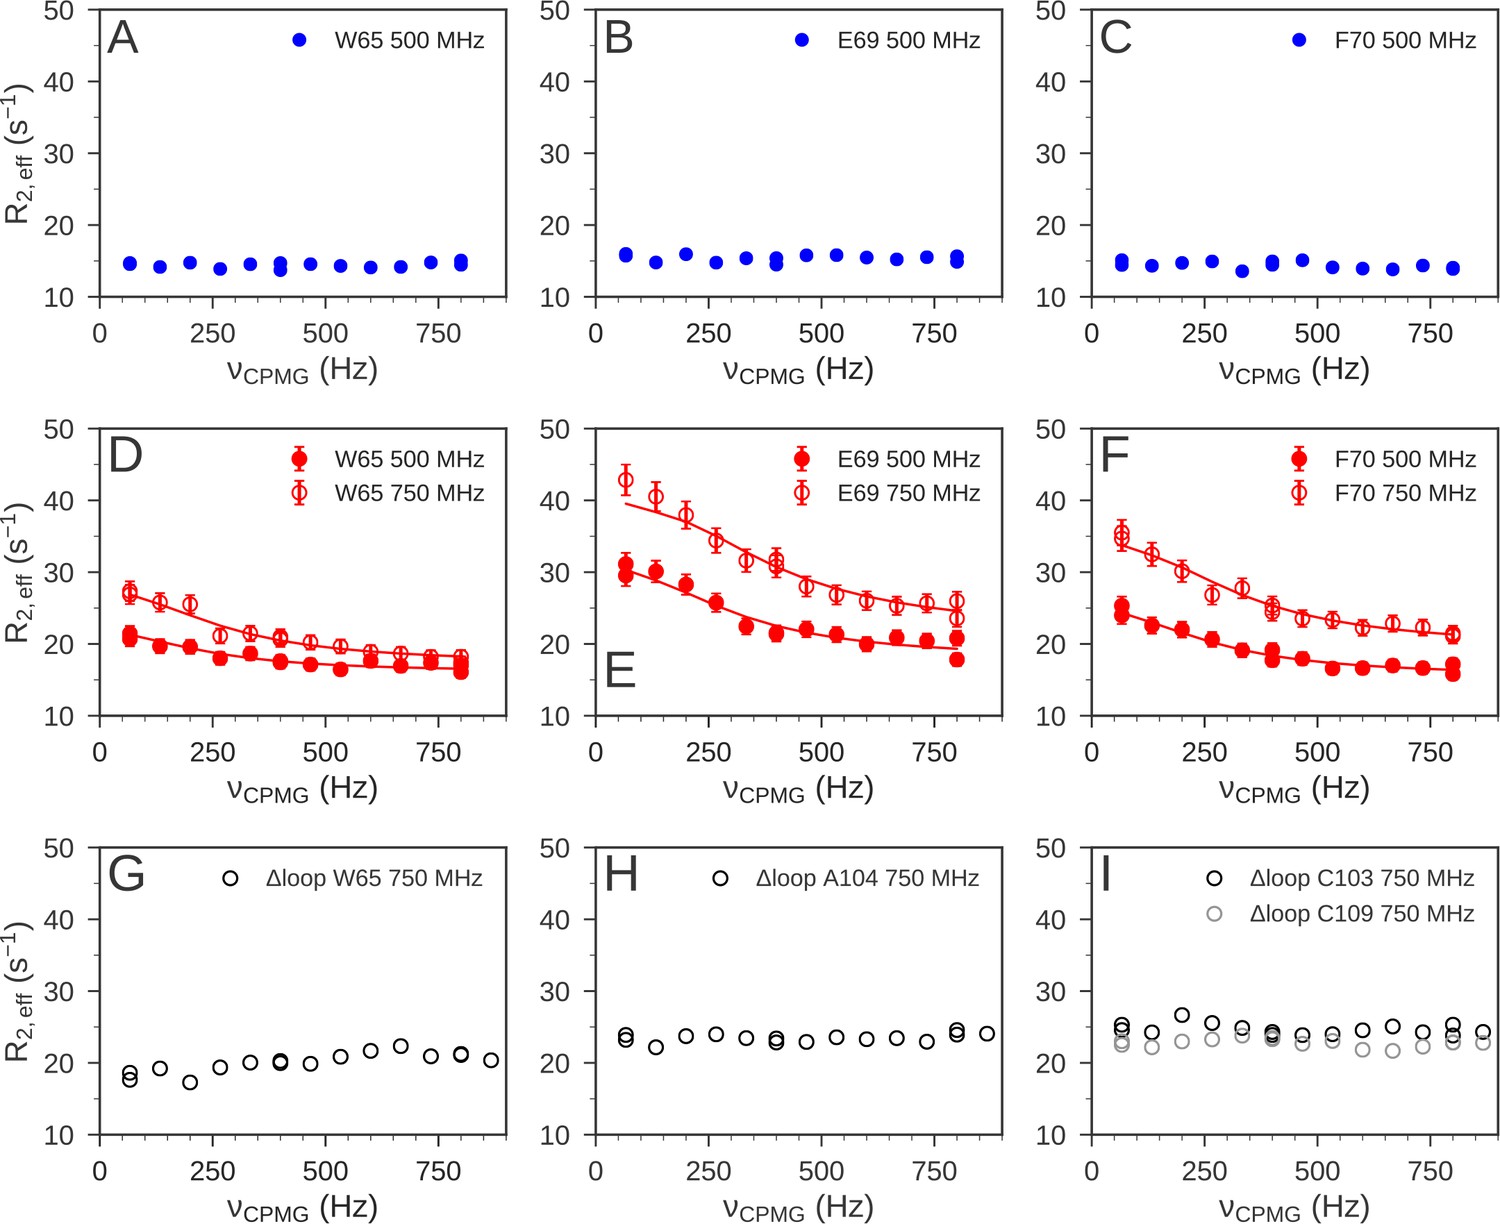
For nDsbDred, flat relaxation dispersion profiles were obtained as illustrated for (A) W65, (B) E69 and (C) F70 in the cap loop. For nDsbDox clear relaxation dispersion effects were measured for (D) W65, (E) E69 and (F) F70; error bars were determined as described in Figure 6—figure supplement 1—source data 1. In the oxidized cap-loop deletion mutant (Δloop-nDsbDox), flat relaxation dispersion profiles were obtained for (G) W65, (H) A104 and (I) C103/C109 in the active site. Experimental data are represented by circles and fits to the data for wild-type nDsbDox are shown by solid lines.
Figure 6—figure supplement 1
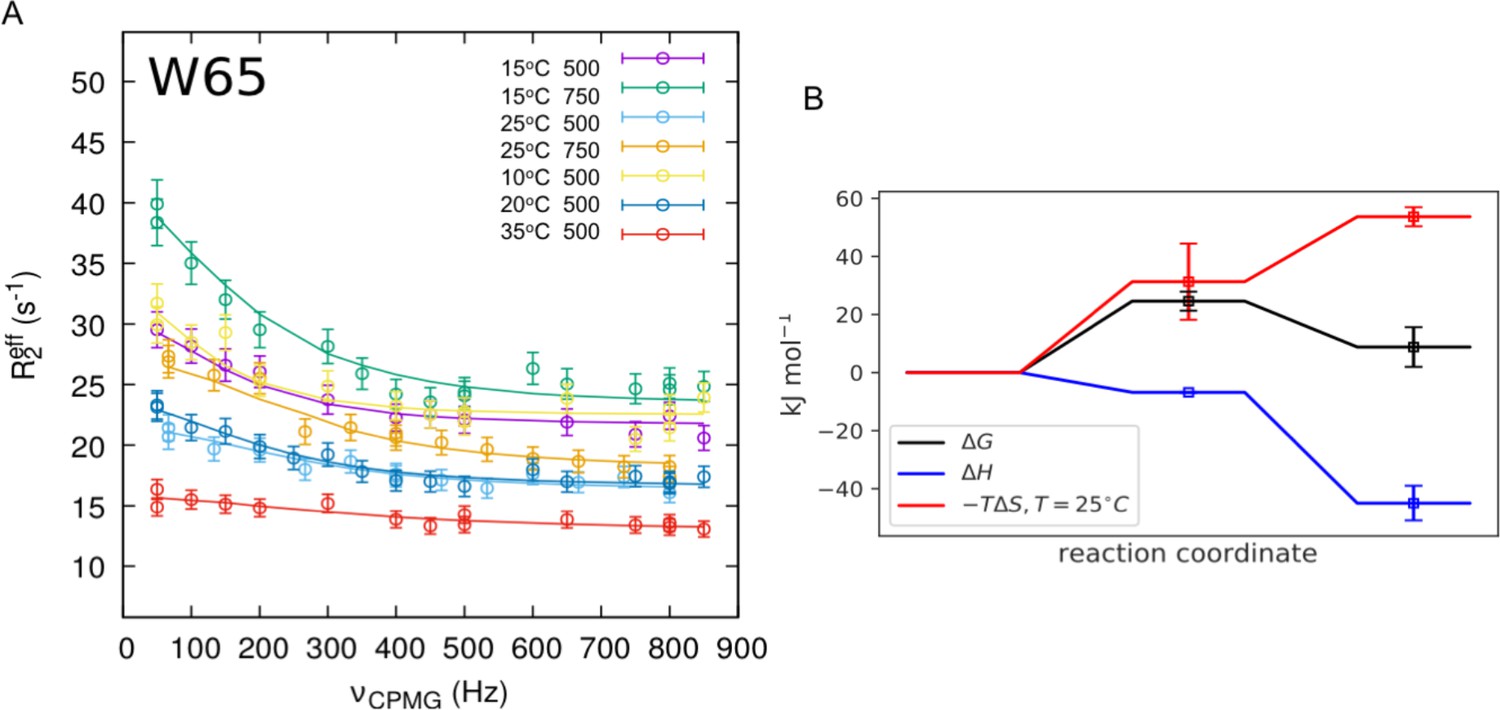
Analysis of the relaxation dispersion experiments at multiple temperatures.
Global fitting of relaxation dispersion data measured for twelve residues in nDsbDox at 10°C, 15°C, 20°C, 25°C and 35°C at 500 MHz and at 15°C and 25°C at 750 MHz was performed using CATIA (Cpmg, Anti-trosy, and Trosy Intelligent Analysis)(Alderson et al., 2019; Baldwin et al., 2011a; Vallurupalli et al., 2008), where the specific pulse sequence was simulated incorporating differential relaxation rates between the coherences generated, and off-resonance effects of the 180o pulses. Error bars were determined as described in Figure 6—figure supplement 1—source data 1. Relaxation dispersion data measured for W65 and the curves from the global fitting are shown in (A) (Figure 6—figure supplement 1—source data 1). The global fits at five different temperatures yield a description of the free energy landscape of the exchange process shown in (B). The minor state of nDsbDox is enthalpically more favorable than the ground state. This is reflected in the decrease in the population of the minor state from 7.1% to 1.6% when the temperature is increased from 10°C to 35°C (Figure 6—figure supplement 1—source data 1). The minor state is entropically less favorable than the ground state. Overall, the reaction coordinate in (B) shows that the minor state is less favorable by 8.8 kJ mol−1 at 25°C. The fitting of the experimental curves at the five temperatures also reports on the barrier between the two states. The transition state is enthalphically more favorable than the ground state. There is, however, a sizeable free-energy barrier as the transition state is lower in entropy than the ground state, and so the rate for the forward reaction, while approximately temperature independent, decreases slightly with increasing temperature. Note that and hence depend on the transmission coefficient κ that is used in Equation 1.
and are the activation enthalpy and entropy for the reaction. The transmission coefficient κ was set to 1.4 × 10⁻⁷ s−1 K−1 (Fersht, 1984).
-
Figure 6—figure supplement 1—source data 1
Parameters from a multi-temperature analysis of the relaxation dispersion data.
- https://cdn.elifesciences.org/articles/54661/elife-54661-fig6-figsupp1-data1-v2.docx
Figure 6—figure supplement 2

Comparison of the X-ray structures of wild-type nDsbDox (A) and Δloop-nDsbDox (B).
The backbone/cap loop of wild-type nDsbDox (1L6P) and Δloop-nDsbDox (5NHI) are shown in cyan/deep teal and grey/black, respectively. F70 (dark teal), in wild-type DsbDox, and the C103-C109 and C98-C104 disulfide bonds (yellow/pale yellow) are shown with a stick representation. The overlaid structures (C) have a Cα RMSD of 0.25 Å for residues 12–122.
-
Figure 6—figure supplement 2—source data 1
Crystallographic data collection and refinement statistics for Δloop-nDsbDox.
- https://cdn.elifesciences.org/articles/54661/elife-54661-fig6-figsupp2-data1-v2.docx
Figure 7

Structural characterization of μs-ms dynamics in nDsbDox.
(A) Residues 64, 65 and 69–74 with chemical shift differences between the major and minor states of >1 ppm are shown in a stick representation in dark teal. C103 and C109 are shown in yellow. The magnitude of the 15N chemical shift differences between the major and minor states are compared in (B) with the magnitude of predicted shift differences between the native and random coil states and in (C) with the magnitude of the experimental shift difference between nDsbDox and nDsbDred. Shift differences between the major and minor states for W65, E69, F70, Y71, G72 and K73, for which the sign has been obtained experimentally, are compared with the predicted shift differences between the native and random coil states in (D) and between nDsbDox and nDsbDred in (E). The experimentally determined chemical shift differences are shown in light grey, with error bars. Random coil shifts were predicted using POTENCI (Nielsen and Mulder, 2018). Details of the fitting procedures used for the dispersion data and the determination of errors in the chemical shift differences are presented in Figure 6—figure supplement 1 and Figure 6—figure supplement 1—source data 1 and Figure 7—source data 1.
-
Figure 7—source data 1
Determination of the sign of the 15N chemical shift difference between the excited state and the ground state determined by comparison of HSQC and HMQC spectra collected at 750 MHz.*.
- https://cdn.elifesciences.org/articles/54661/elife-54661-fig7-data1-v2.docx
Figure 8
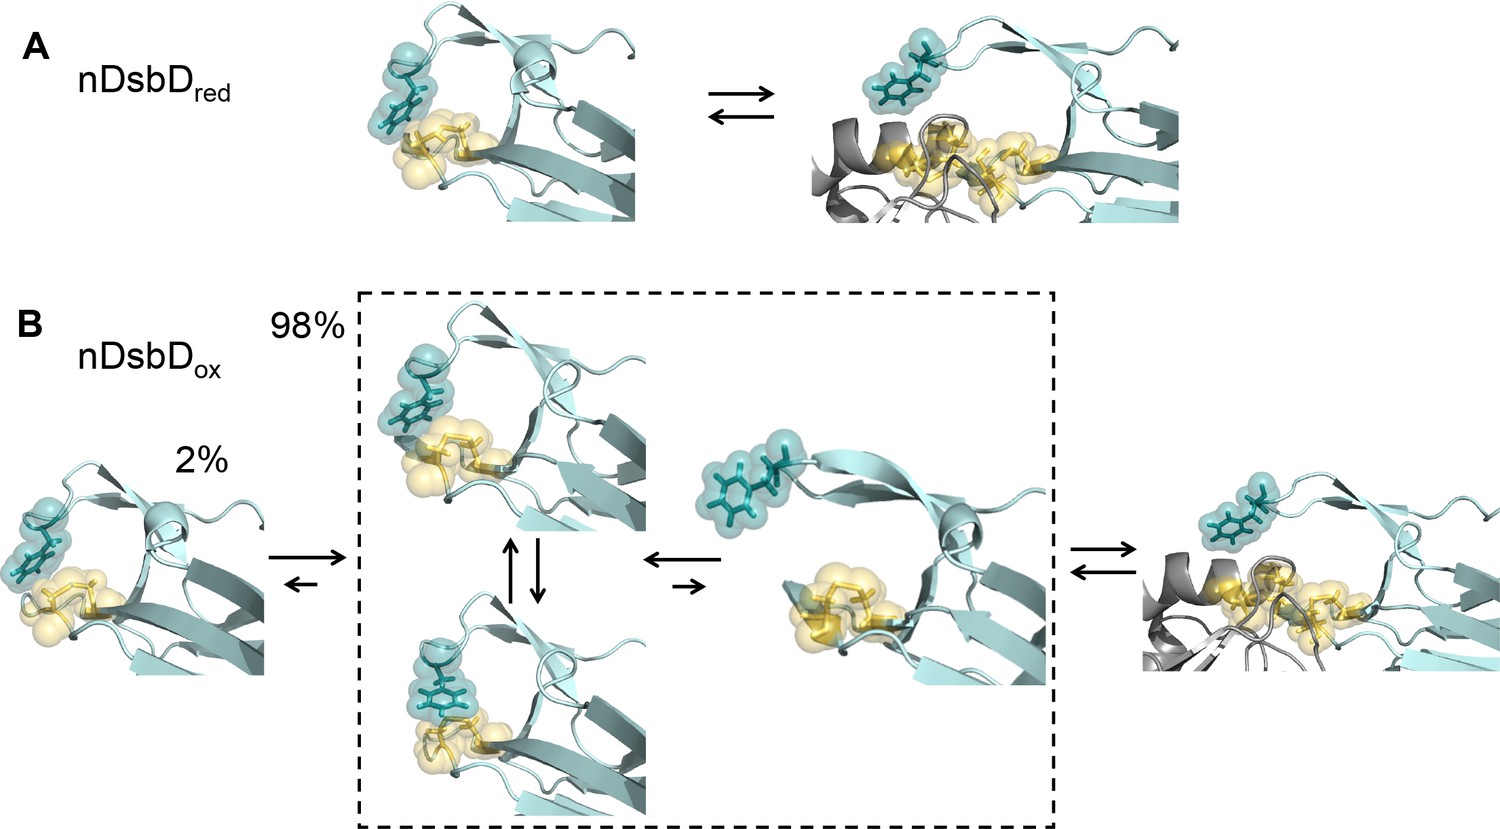
Local frustration occurs in oxidized, but not in reduced, nDsbD.
(A) The cap loop in nDsbDred maintains a closed conformation shielding the active-site cysteine thiols. The cap loop may only open to expose the cysteine thiols via an induced-fit mechanism when it encounters its legitimate binding partners, CcmG, DsbC and DsbG. (B) nDsbDox undergoes more complex dynamics as a result of local structural frustration. F70 interacts with C109 Sγ both in its gauche- (top left structure in dashed box) and trans (lower left structure in dashed box) orientations. These mutually competing interactions destabilize the packing of the cap loop onto the active site. Consequently, open conformations (right-hand structure in dashed box) are accessible in nDsbDox and these would allow nDsbDox to form complexes with its legitimate binding partner, cDsbDred, via a conformational selection mechanism. The left-hand structure shows a reduced-like minor (2%) conformation identified by relaxation dispersion experiments and populated on a slower timescale. The backbone of nDsbD and cDsbD are shown in cyan and grey, respectively. F70 (dark teal), C103 and C109 (yellow) are shown with sticks and a surface representation. (A) is from the 3PFU X-ray structure of nDsbDred, the left-hand panel in (B) is the energy minimized 3PFU structure with a disulfide bond incorporated, the structures in the dashed rectangle in (B) are 'snapshots' from the MD simulations of nDsbDox. The bound complexes shown on the right in (A) and (B) are based on the 1VRS X-ray structure.
Tables
Key resources table
| Reagent type (species) or resource | Designation | Source or reference | Identifiers | Additional information |
|---|---|---|---|---|
| Gene (Escherichia coli) | DSBD | DSBD_ECOLI | UniprotID P36655 | |
| Strain, strain background (Escherichia coli) | BL21(DE3) | Stratagene | Competent cells | |
| Recombinant DNA reagent | pDzn3 | DOIs:10.1007/s12104-011-9347-9 and 10.1074/jbc.M805963200 | N-terminal domain of DsbD (nDsbD) (L2-V132) | Plasmid for wild-type nDsbD expression |
| Recombinant DNA reagent | pDzn8 | This study. | nDsbD (L2-V132) with residues H66-K73 replaced by AGG | Plasmid for Δ-loop nDsbD expression |
| Sequence-based reagent | Δ-loop nDsbD | This study. Synthesized by Sigma Aldrich. | PCR primer (forward): 5′-(AGGAAGCGAGATTTACCGCGATCGGCTG)−3′ | |
| Sequence-based reagent | Δ-loop nDsbD | This study. Synthesized by Sigma Aldrich. | PCR primer (reverse): 5′-(CCGGCCCAGACGCCTTGCGGCAGCTGC)−3′ | |
| Peptide, recombinant protein | Wild-type nDsbd | DOIs:10.1007/s12104-011-9347-9 and 10.1074/jbc.M805963200 | N-terminal domain of DsbD (nDsbD) (L2-V132) | Purified using a thrombin-cleavable C-terminal poly-His tag |
| Peptide, recombinant protein | Δ-loop nDsbd | This study. | nDsbD (L2-V132) with residues H66-K73 replaced by AGG | Purified using a thrombin-cleavable C-terminal poly-His tag |
| Commercial assay or kit | Sigma Thrombin CleanCleave Kit | Sigma-Aldrich | Used for removal of the poly-His tag | |
| Chemical compound, drug | KOD Hot Start DNA polymerase | Novagen | Used for PCR | |
| Chemical compound, drug | Pf1 phage | ASLA Biotech AB | Used for partial alignment for RDC measurements | |
| Software, algorithm | NMRPipe | DOI:10.1007/BF00197809 | Processing of NMR data | |
| Software, algorithm | CCPN Analysis (version 2.4.2) | DOI:10.1002/prot.20449 | RRID:SCR_016984 | Analysis of NMR spectra |
| Software, algorithm | CATIA | DOIs:10.1073/pnas.0804221105 and 10.1016/j.jmb.2011.07.017 and 10.1038/s41467-019-08557-8 | https://www.ucl.ac.uk/hansen-lab/catia/ | Global fitting of relaxation dispersion NMR data |
| Software, algorithm | GROMACS 4.5 | DOI:10.1002/jcc.20291 | RRID:SCR_014565 | Used for MD simulations |
| Software, algorithm | WHAT-IF | DOI:10.1093/nar/gkq453 | https://swift.cmbi.umcn.nl/whatif | Used to add missing atoms prior to MD simulations |
| Software, algorithm | Visual Molecular Dynamics (VMD) | DOI:10.1016/0263-7855(96)00018-5 | RRID:SCR_001820 | Used for analysis of distances, angles, hydrogen bonds in MD simulations and for rendering protein structures |
| Software, algorithm | MDAnalysis Python Library | DOI:10.1002/jcc.21787 | Used for analysis of distances, angles, hydrogen bonds in MD simulations | |
| Software, algorithm | blast 2.2.28+ (blastp) | NCBI | RRID:SCR_001010 https://blast.ncbi.nlm.nih.gov/Blast.cgi | Used to search for DsbD protein homologs |
| Software, algorithm | fasttree 2.1.7 | DOI:10.1371/journal.pone.0009490 | RRID:SCR_015501 | Used for building a phylogenetic tree |
| Software, algorithm | muscle 3.8.31 | DOI:10.1093/nar/gkh340 | RRID:SCR_011812 | Used for sequence alignment |
| Software, algorithm | Pymol Version 2.3.5 | Schrodinger, LLC | RRID:SCR_000305 | Used for rendering protein structural figures |
| Software, algorithm | Denzo/ Scalepack | DOI:10.1016/S0076-6879(97)76066-X | Used for processing and scaling of X-ray data | |
| Software, algorithm | MOLREP | DOI: 10.1107/S0907444996012255 | Used for molecular replacement in solving X-ray structure | |
| Software, algorithm | Phenix.refine | DOI:10.1107/S09074444909052925 | RRID:SCR_016736 | Used for refinement of X-ray structure |
| Software, algorithm | Coot | DOI:10.1107/S0907444910007493 | RRID:SCR_014222 | Used for manual fitting of electron density in X-ray structure |
Additional files
Download links
A two-part list of links to download the article, or parts of the article, in various formats.
Downloads (link to download the article as PDF)
Open citations (links to open the citations from this article in various online reference manager services)
Cite this article (links to download the citations from this article in formats compatible with various reference manager tools)
Local frustration determines loop opening during the catalytic cycle of an oxidoreductase
eLife 9:e54661.
https://doi.org/10.7554/eLife.54661


