Senotherapeutic drugs for human intervertebral disc degeneration and low back pain
- Orthopaedic Research Lab, Department of Surgery, McGill University and the Research Institute of the McGill University Health Centre, Canada
- McGill Scoliosis and Spine Group, Department of Surgery, McGill University and the Research Institute of the McGill University Health Centre, Canada
- Shriner’s Hospital for Children, 1003 Decarie Blvd, Canada
Figures
Figure 1 with 1 supplement
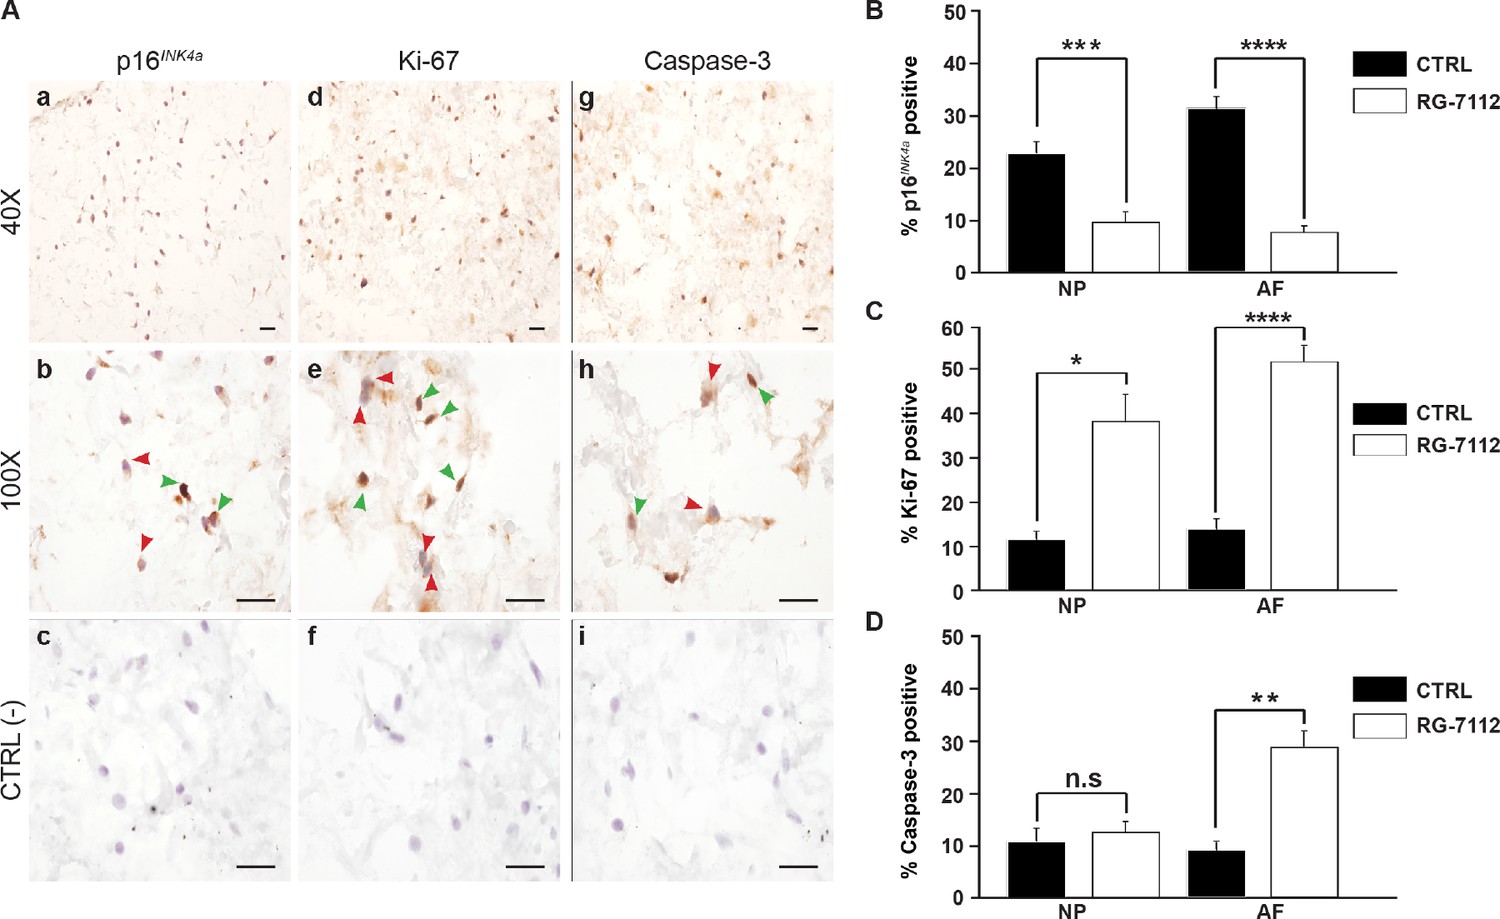
RG-7112 treatment of IVD pellet cultures.
(A) Representative images indicating how we deemed positive and negative p16INK4a (a), Ki-67 (d), and caspase-3 (g) staining. (b, e and h) Magnified images of (a, d and g). Arrow heads indicate positive (green) and negative (red) staining. (c, f and i) no secondary antibody control photomicrographs. Quantification of (B) p16INK4a (n = 7), (C) Ki-67, and (D) caspase-3 expression, (n = 8). Scale bars: 20 μm in (A). The cells were from degenerating IVDs as indicated in Table 2. Values are presented as mean ± SEM in (B–D). * Indicates a significant difference assessed by the two-tailed Student's t-test: p<0.05; **p<0.01 and ****p<0.0001.
-
Figure 1—source data 1
Excel file containing the percentage of p16Ink4a, ki-67 and caspase three positive in NP and AF cells control and treated with RG-7112.
- https://cdn.elifesciences.org/articles/54693/elife-54693-fig1-data1-v1.xlsx
Figure 1—figure supplement 1
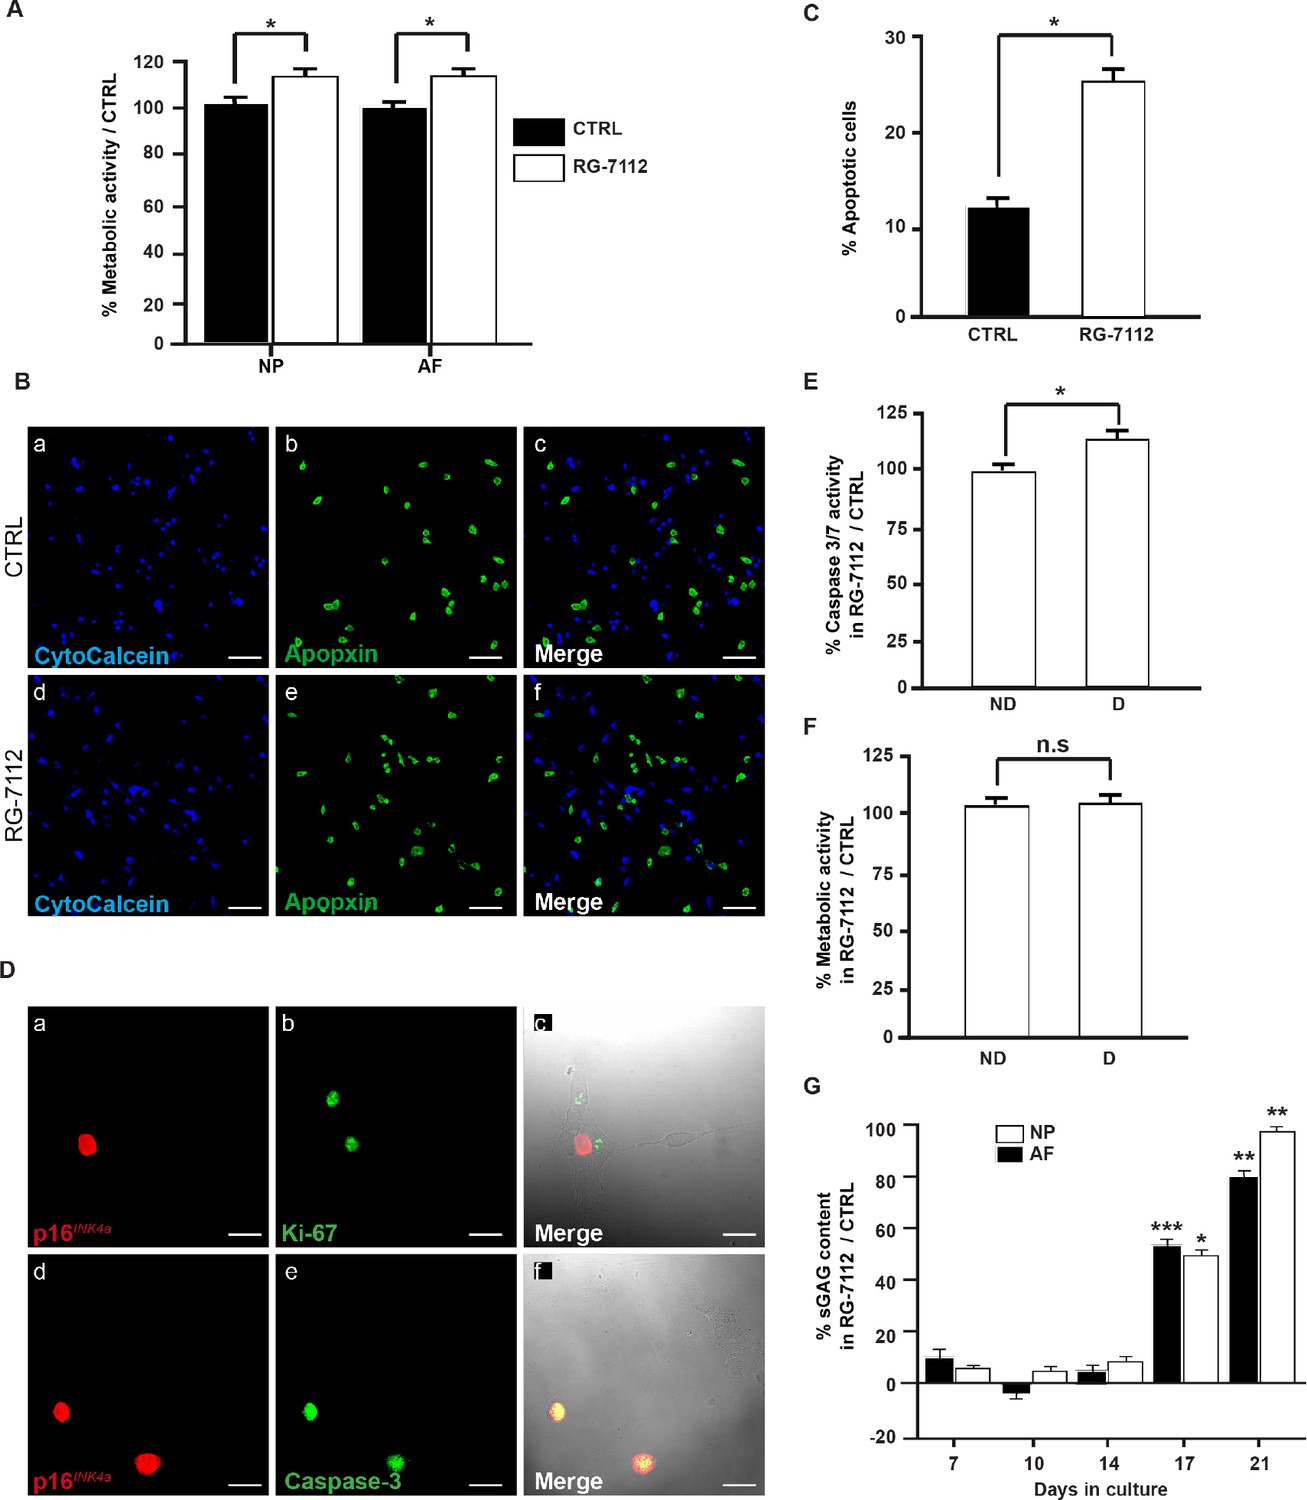
Senolytic activity of RG-7112 on human IVD cells in vitro.
(A) Metabolic activity in control and treated NP and AF pellet cultures from degenerate IVDs (n = 6). (B) Representative photomicrographs of untreated (a–c) and RG-7112 treated (d–f) NP cells stained for cytocalcein (viable), apopxin (apoptotic) and merged images. (C) Quantification of apoptosis in treated and control groups (n = 3). (D) p16INK4a separate-staining with Ki-67 (a–c) and colocalization with caspase-3 (d–f) in NP cells (n = 3). (E) RG-7112 (5 μM) selectively induced apoptosis in degenerate NP cells compared to non-mildly-degenerate as measured by the caspase 3/7 activity kit. The results are expressed as a percentage compared to the untreated control (n = 8). (F) Alamar blue assay comparison of the effect of RG-7112 (5 μM) on the viability of degenerate and non-degenerate NP cells. Results are presented as fold-change compared to the control (n = 8). (G) Glycosaminoglycan (sGAG) levels in the NP and AF-treated pellet media at days 7, 14, 21 and 28 were assessed by DMMB. GAG release was normalized to day 0 GAG concentration and then to the sGAG concentration of untreated culture media (n = 6). Scale bars: 50 μm in (B) and 25 μm (D). Values are presented as mean ± SEM in (A, C, E, F and F). Data was analyzed by Student’s t-tests to compare two groups. * indicates a significant difference of p<0.05, ** of p<0.01 and *** of p<0.001.
-
Figure 1—figure supplement 1—source data 1
Excel file containing the fluorescence values for metabolic and caspase3/7 activity, the number of apoptotic cells, and the concentrations of sGAG in NP (and AF) cells treated and untreated with RG-7112.
- https://cdn.elifesciences.org/articles/54693/elife-54693-fig1-figsupp1-data1-v1.xlsx
Figure 2 with 1 supplement
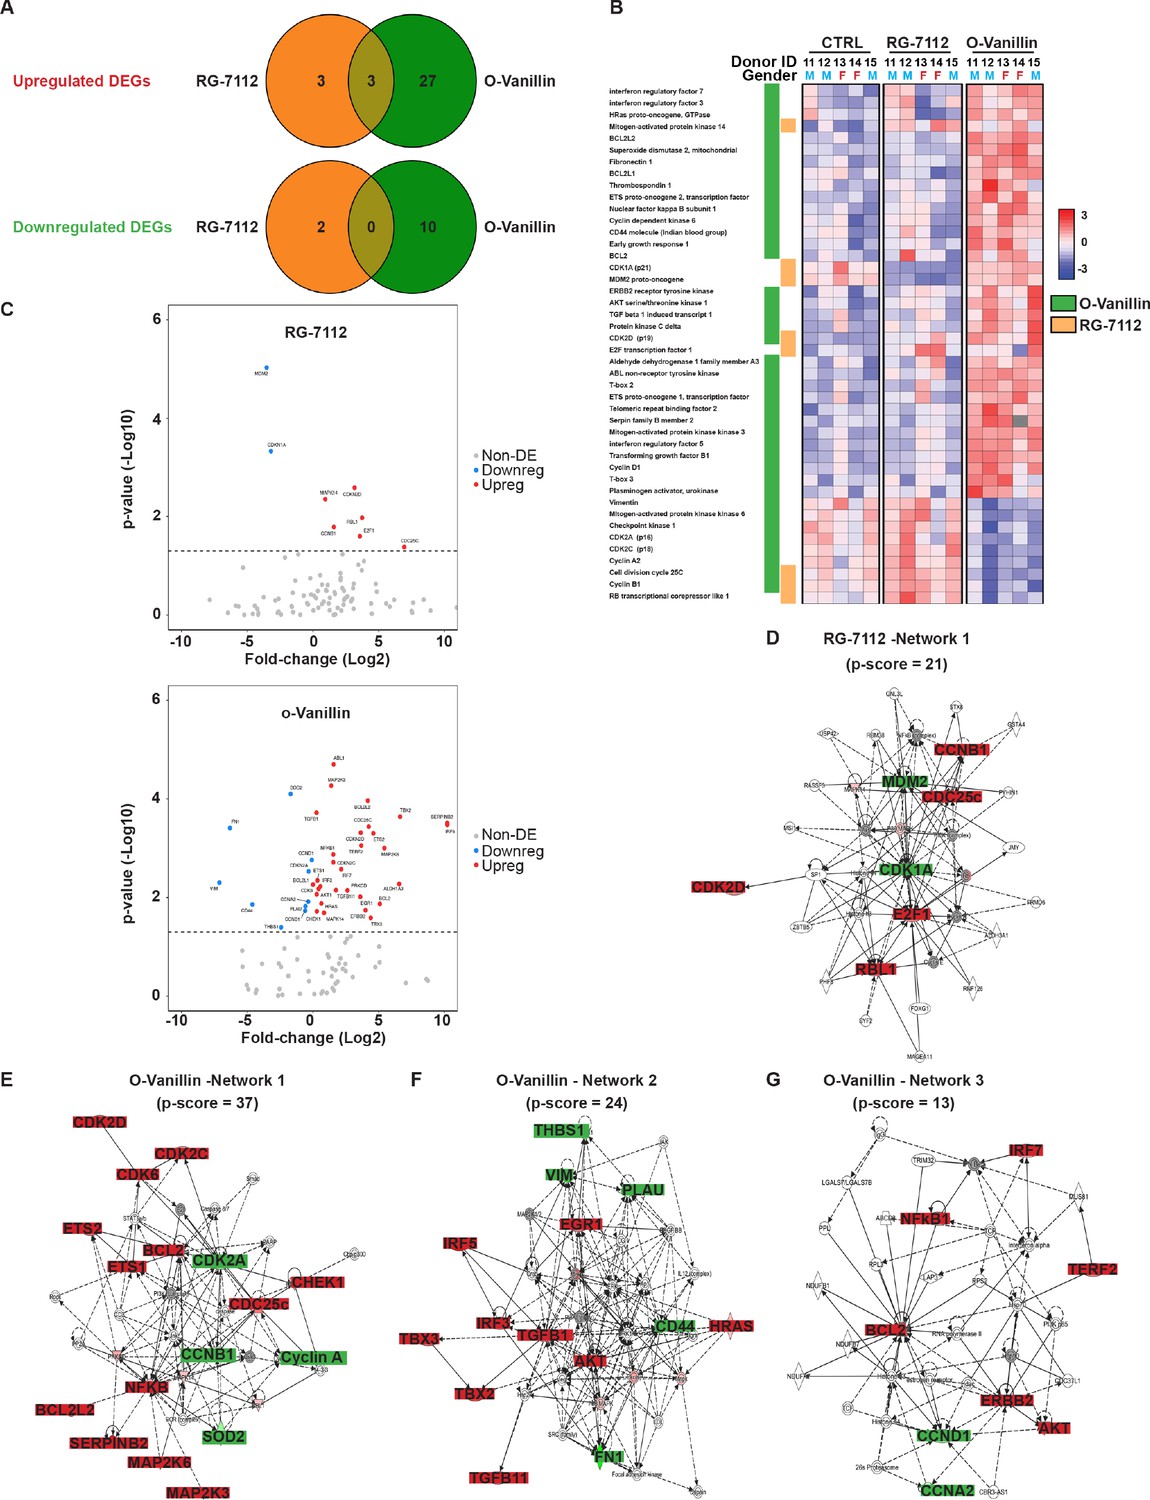
Differentially expressed senescence related genes in NP pellets.
(A) Venn diagrams of the differentially up and downregulated genes among the different groups. O-Vanillin, RG-7112-treated NP cells in pellets culture. For Upregulated genes odds ratio (OR) = 2.13 and p=0.39; for Downregulated genes: OR = 0 and p=1. (B) Heatmap of the top 44 over and under expressed genes in control (CTRL), RG-7112 and o-Vanillin-treated NP cells. All genes shown were first normalized to the housekeeping gene GAPDH. Data shown are relative to the calculated Z scores across the samples (see Materials and methods) and ranked by significance adjusted to p<0.05. Red represents relatively high levels of expression; blue represents relatively low levels of expression. Significantly differentially expressed genes are indicated with green lines for o-Vanillin and in orange lines for RG-7112. Each column represents one individual (for a total of n = 5 per group) and each row represents expression of a single gene. Donor ID and gender are indicated for each subject. (C) Volcano plots of mRNA expression of o-Vanillin and RG-7112 treated NP pellets: Plotted along the x-axis is the mean of log2 fold-change, along the y-axis the negative log10 of the p-values. Blue circles refer to downregulated genes, red circles refer to upregulated genes and grey circles to non-DEGs in o-Vanillin and RG-7112-treated NP pellets. The horizontal grey line is the negative logarithm of the t-test-adjusted p-value threshold (-log10 of p=0.05). (D) IPA diagrams of differentially expressed genes in RG-7112 and (E–G) o-Vanillin-treated NP pellets within the selected set of 91 genes. Direct and indirect interactions are shown by solid lines and dashed lines respectively. Green indicates gene downregulation; red depicts upregulation and molecules found by the data mining tools of IPA (build tools) are shown in gray. Color intensity represents the average of log2 fold change with brighter colors representing a more significant difference between treated and controls. Symbols for each molecule are presented according to molecular functions and type of interactions. Functional assignations attributed by IPA software. Significant difference set at p<0.05 was assessed by repeated measures Analysis of Variance (ANOVA) with Turkey’s post hoc test for multiple pairwise comparison in (B–C) and Fisher’s exact test in (A, D–G). The cells were from degenerating IVDs as indicated in Table 2.
-
Figure 2—source data 1
Excel file containing the list of Differentially Expressed genes significantly up- or downregulated at p < 0.05 in RG-7112 and o-Vanillin conditions and the raw values of the fold change in control and treated groups for all tested genes.
- https://cdn.elifesciences.org/articles/54693/elife-54693-fig2-data1-v1.xlsx
Figure 2—figure supplement 1
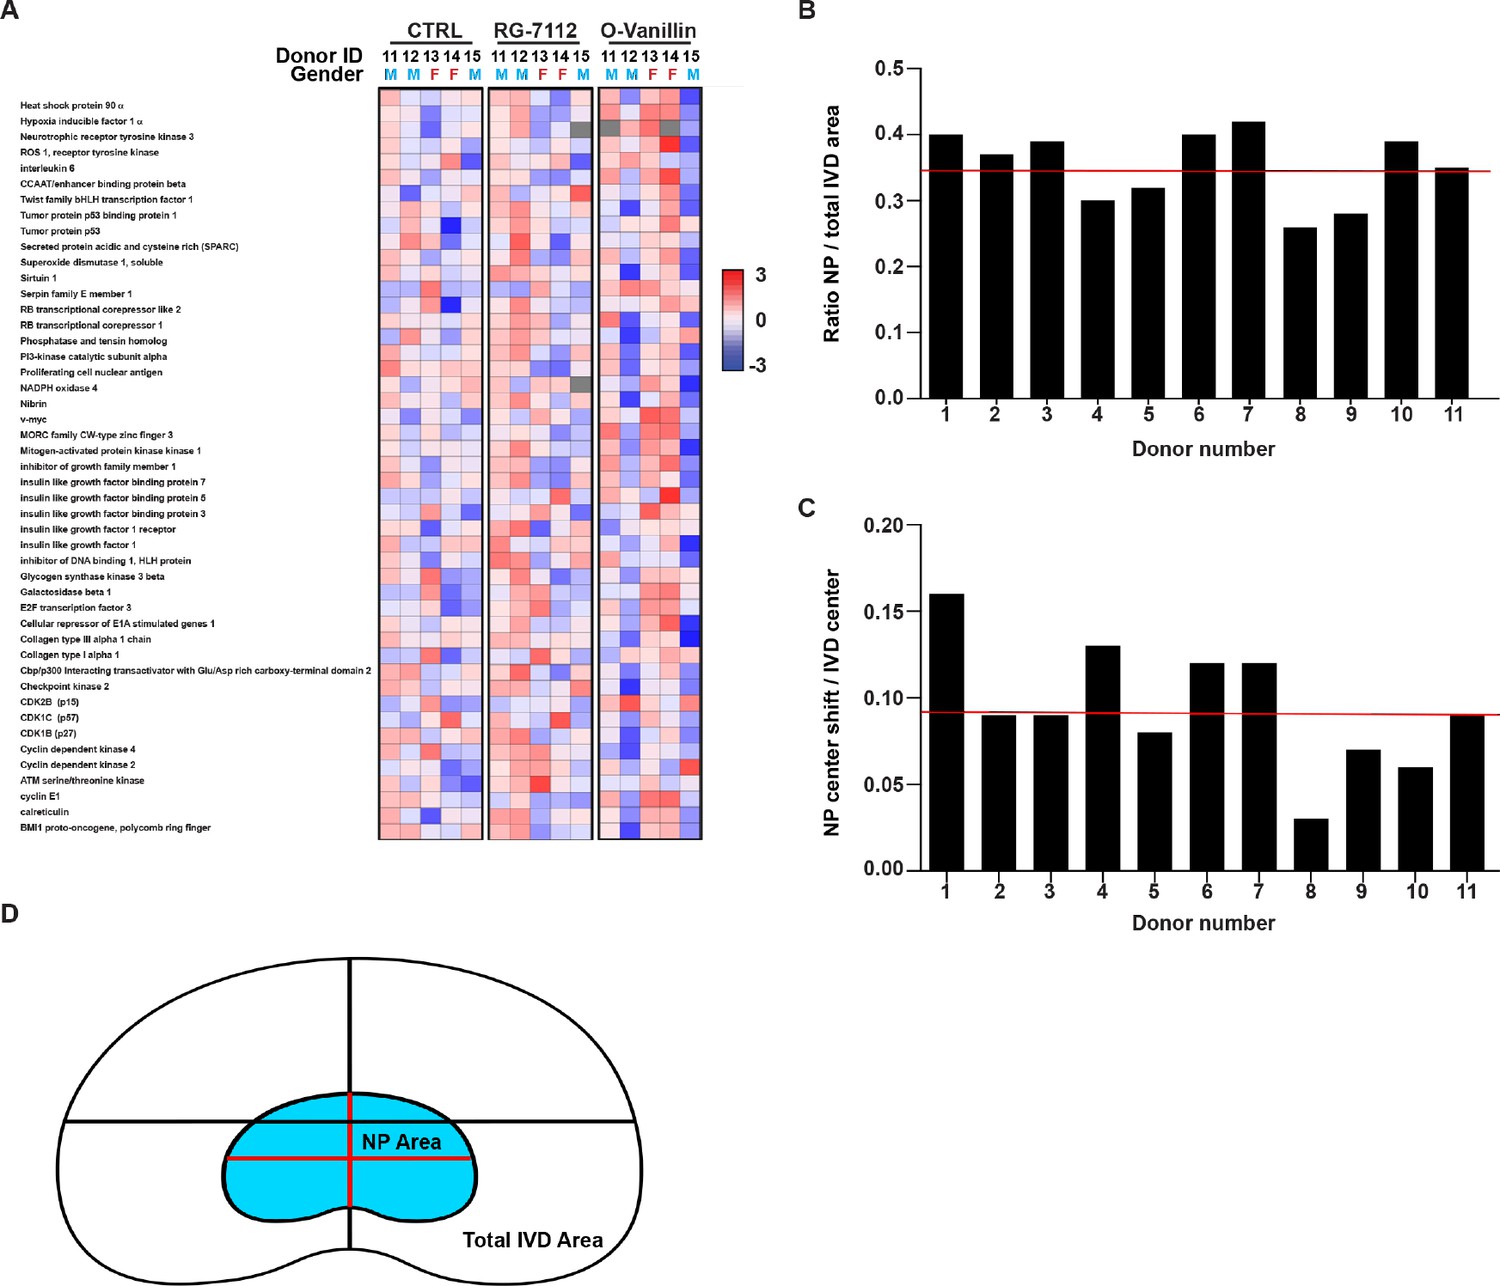
Non differentially expressed genes Heatmap and NP area measure in human IVD.
(A) 47 genes did not show significant expression change in RG-7112 (5 µM) and o-Vanillin (100 µM) treated NP cells when compared with control (CTRL). See methods for statistical calculation and genes ranking. Quantification of the average NP (B) area (C) and position in human IVD. Red lines indicate the average ratio (n = 11 discs). (D) Schematic representation of the average NP area and position.
-
Figure 2—figure supplement 1—source data 1
Excel file containing the the list of Non-Differentially Expressed genes in RG-7112 and o-Vanillin conditions and the raw values of the fold change of the 91 genes tested in control and treated groups.
- https://cdn.elifesciences.org/articles/54693/elife-54693-fig2-figsupp1-data1-v1.xlsx
Figure 3 with 1 supplement
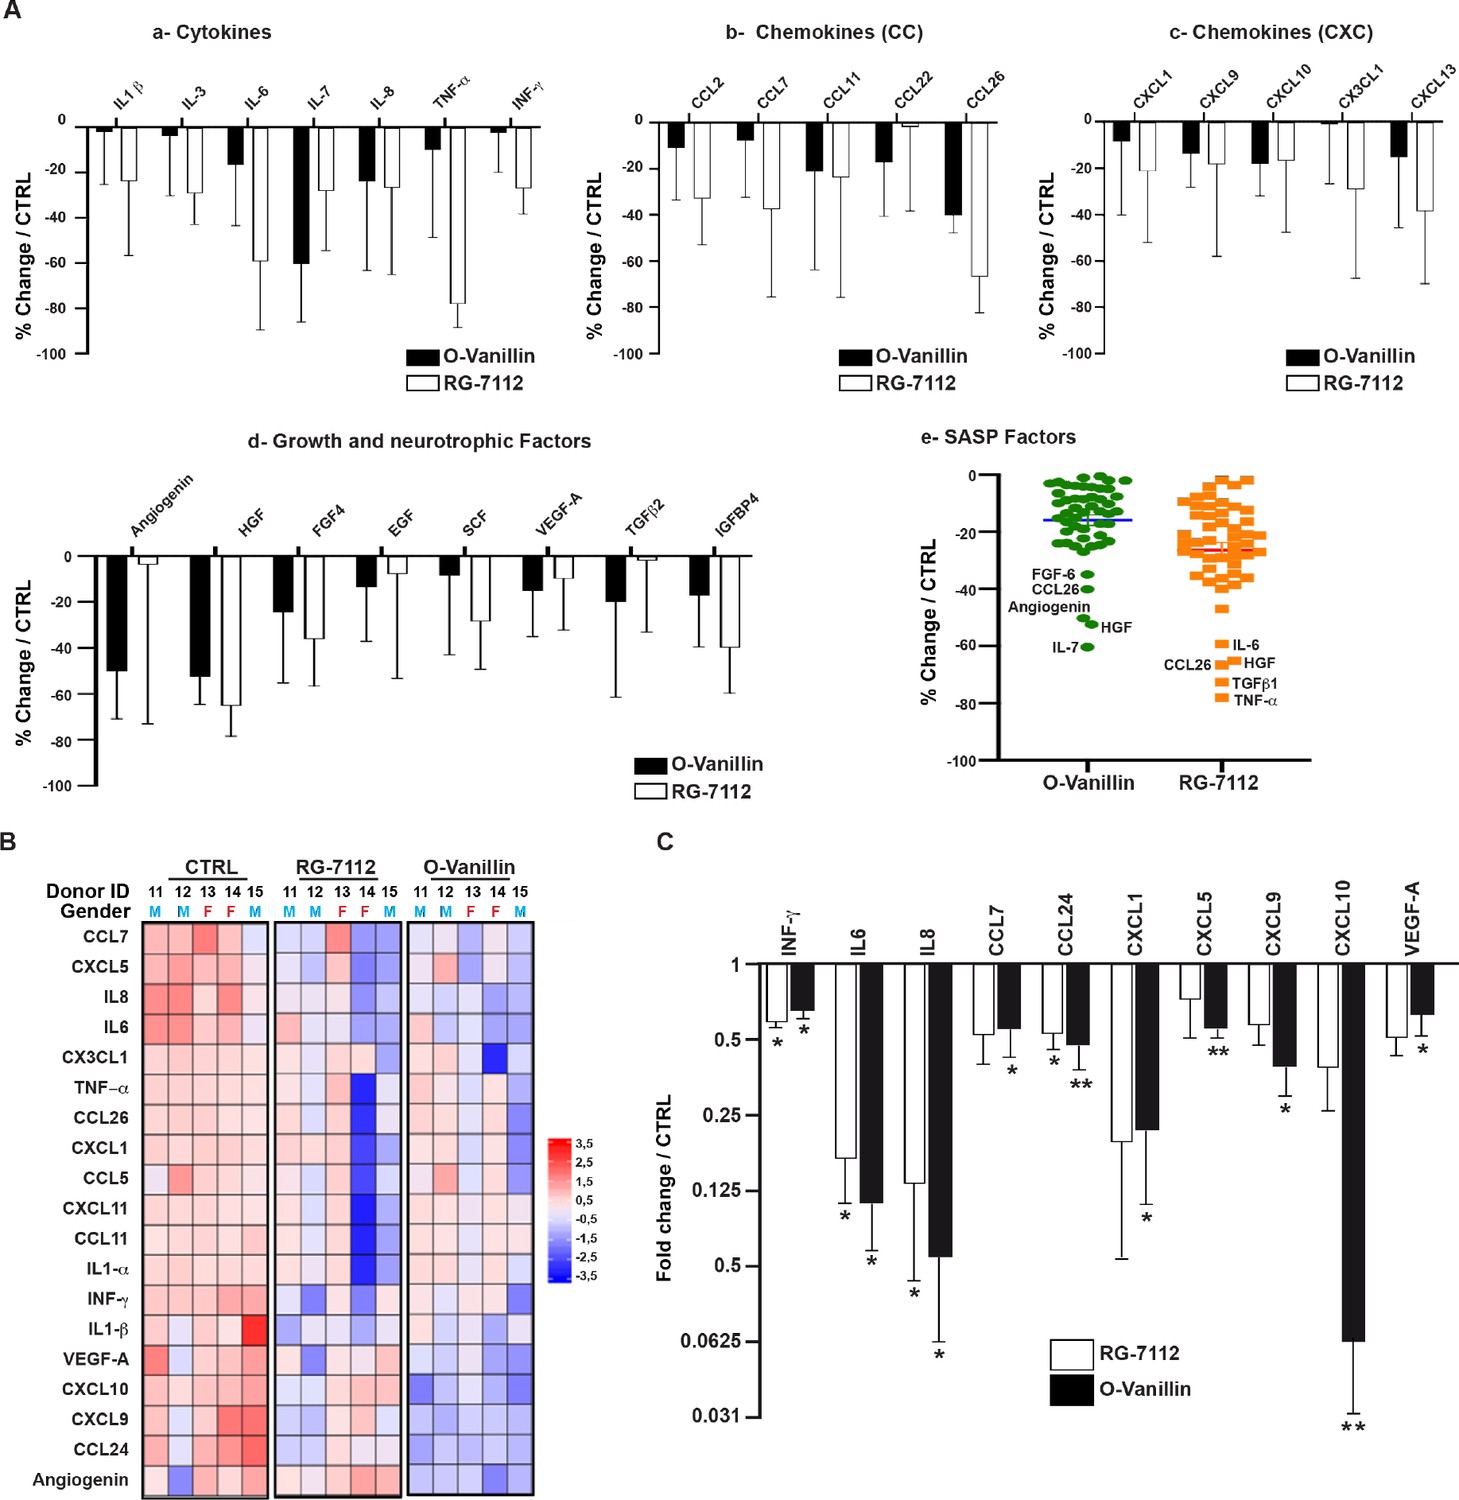
Profile of SASP factors released from pellet cultures following senolytic treatment.
(A) Culture media was analyzed by a RayBio Human Cytokine Array. Relative mean densitometry units of the 80 factors were normalized to untreated controls with the most 25 downregulated SASP factors presented: cytokines (A–a), CC-chemokines (A–b), CXC-chemokines (A–c), growth and neurotrophic factors (A–d). Scatter plot showing the distribution in average change of 50 cytokines quantified using cytokine array (A–e). (B) Heatmap displaying quantification of 19 selected cytokines (19-plex Luminex array). Each column represents one individual (n = 5). The rows represent expression of a single protein. Data shown are log2 (fold change) relative to the average expression level in each condition. Donors ID and gender are indicated for each subject. (C) Significantly downregulated factors are presented as mean fold difference ± SEM; (n = 5). Culture media was collected from the same NP cells used in Figure 2. *Indicates significant difference assessed by repeated measures Analysis of Variance (ANOVA) with Turkey’s post hoc test for multiple pairwise comparison: p<0.05 and **indicates p<0.01.
-
Figure 3—source data 1
Excel file containing the meausres for the selected and significantly SASPs factors measured using cytokine array and Luminex analysis in NP pellets media following the treatment with RG-7112 and o-Vanilin.
- https://cdn.elifesciences.org/articles/54693/elife-54693-fig3-data1-v1.xlsx
Figure 3—figure supplement 1
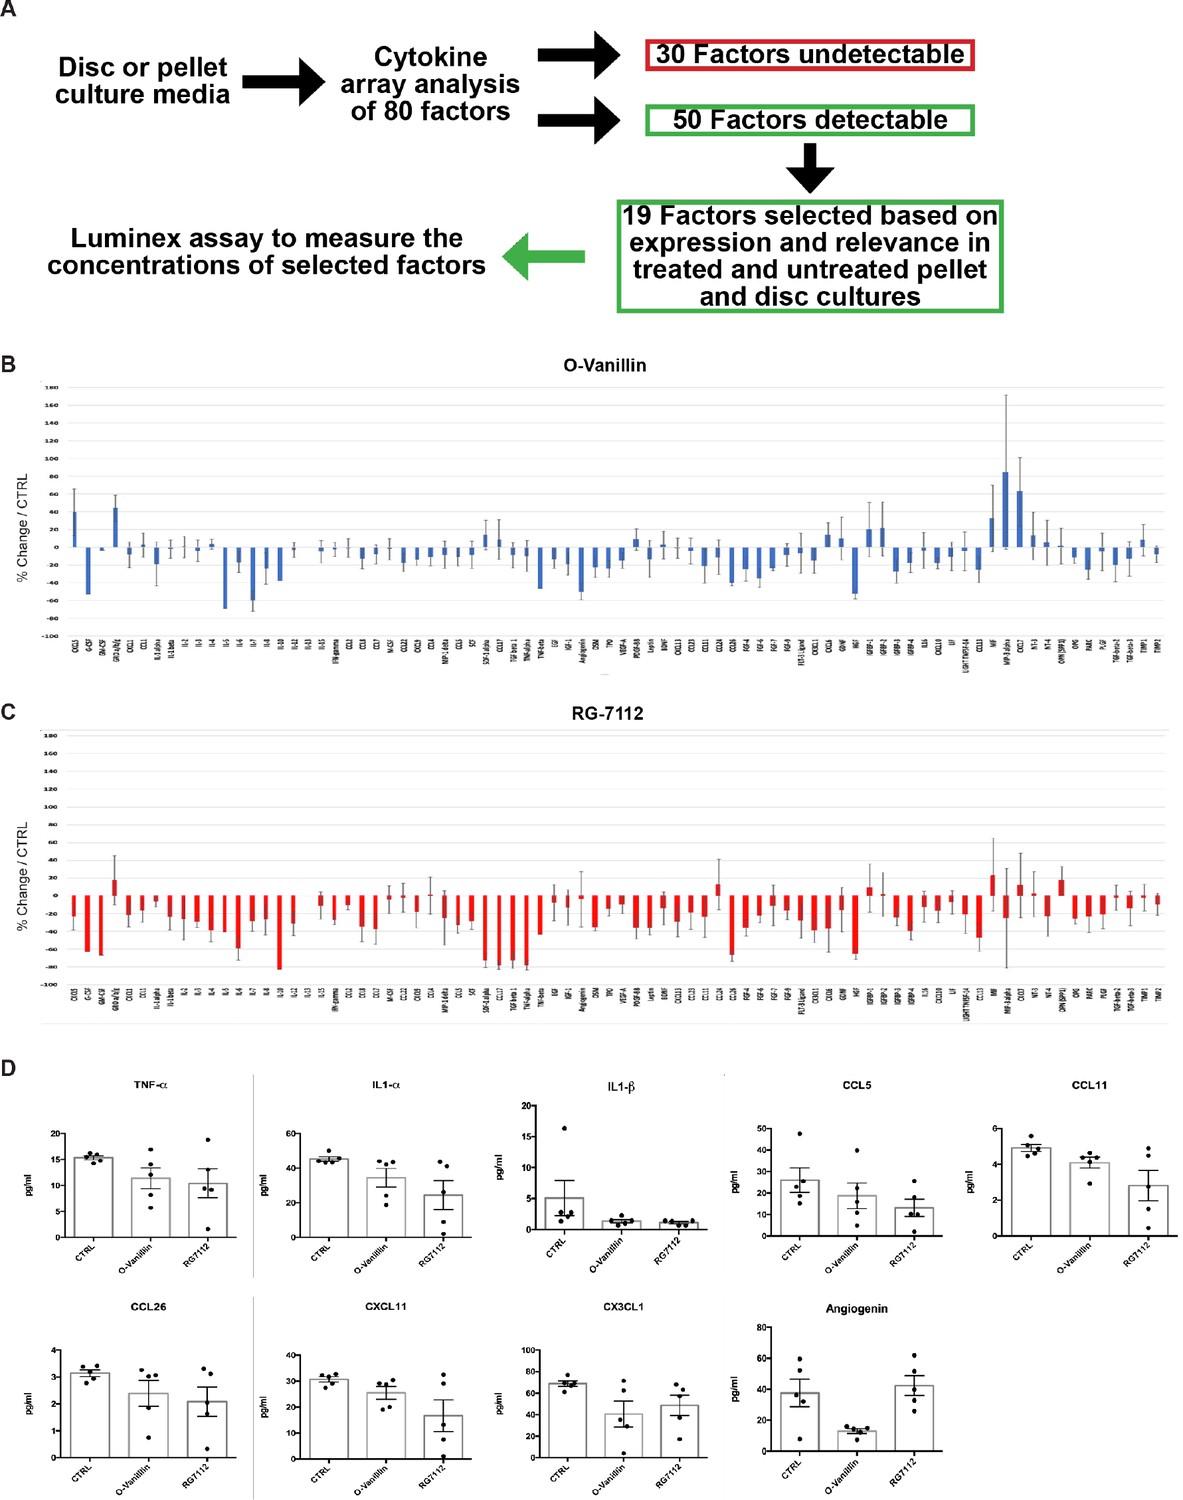
Total cytokine array and Luminex measures in pellet culture media.
(A) Schematic representation of the media analysis by cytokine arrays and Luminex assay. Cytokine/chemokine array quantification of the media in NP cell pellets treated with (B) o-Vanillin (100 μM) and (C) RG-7112 (5 μM). Results present the percentage of change in treated compare to untreated pellet cultures. (D) Nine inflammatory factors in pellet media (TNF-α, IL-1α, IL-1β, CCL5, CCL11, CCL26, CXCL11, CX3CL1 and Angiogenin) displaying no statistically significant decrease measured by Luminex assay. Data is presented as mean ± SEM and was analyzed by repeated measures Analysis of Variance (ANOVA) with Turkey’s post hoc test for multiple pairwise comparison (n = 5).
-
Figure 3—figure supplement 1—source data 1
Excel file containing the complete list of SASP factors measured by cytokines arrays and the non-significantly regulated factors measured by Luminex assay in treated NP pellets media.
- https://cdn.elifesciences.org/articles/54693/elife-54693-fig3-figsupp1-data1-v1.xlsx
Figure 4

RG-7112 and o-Vanillin effects in ex vivo human IVD culture.
(A) Schematic of the ex vivo organ culture experiment. Lumbar spines from organ donors were assessed radiographically for signs of degeneration. Three discs per experiment were isolated from the same spine, cultured for 4–6 days then scanned with MRI and injected with vehicle, o-Vanillin or RG-7112. Discs were then cultured for an additional 28 days, with media changes every 3–4 days. The discs were scanned by MRI again at day 28. Media and tissues were used for SASP factor release and histology respectively. (B) Representative images of mid-axial T1ρ slices pre-treatment (a–b, e–f, i–j) and the same location post treatment (c–d, g–h, k–l) with vehicle (CTRL), RG-7112 (5 μM) or o-Vanillin (100 μM). The heatmap correlates the red color with the highest and the blue color with the lowest T1ρ values. (C) Quantification for NP regions with the graph showing percentage change in T1ρ values post- compared to the pre-treatment scans. (D) Representative safranin O/fast green staining of histological sections. (E) Representative images of disc sections stained with antibodies against p16INK4a and Ki-67. Quantification of (F) p16INK4a and (G) Ki-67 expression. Scale bars = 150 µm in 4D, 25 µm in 4E (p16 INK4a) and 50 µm in 4E (ki-67); Error bars represent mean ± SEM, Statistical significance was assessed by two-tailed Student's t-test to compare pre and post disc groups (C) and by repeated measures Analysis of Variance (ANOVA) with Turkey’s post hoc test for multiple pairwise comparison in (F and G). *Indicates p<0.05 and **indicates p<0.01, n = 4 for each condition. The tissues were from degenerating IVDs as indicated in Tables 2 and 3.
-
Figure 4—source data 1
Excel file containing the complete list of donors, slices and their respective voxel intensities, p16Ink4a and ki-67-positive cells in control and treated discs.
- https://cdn.elifesciences.org/articles/54693/elife-54693-fig4-data1-v1.xlsx
Figure 5 with 1 supplement
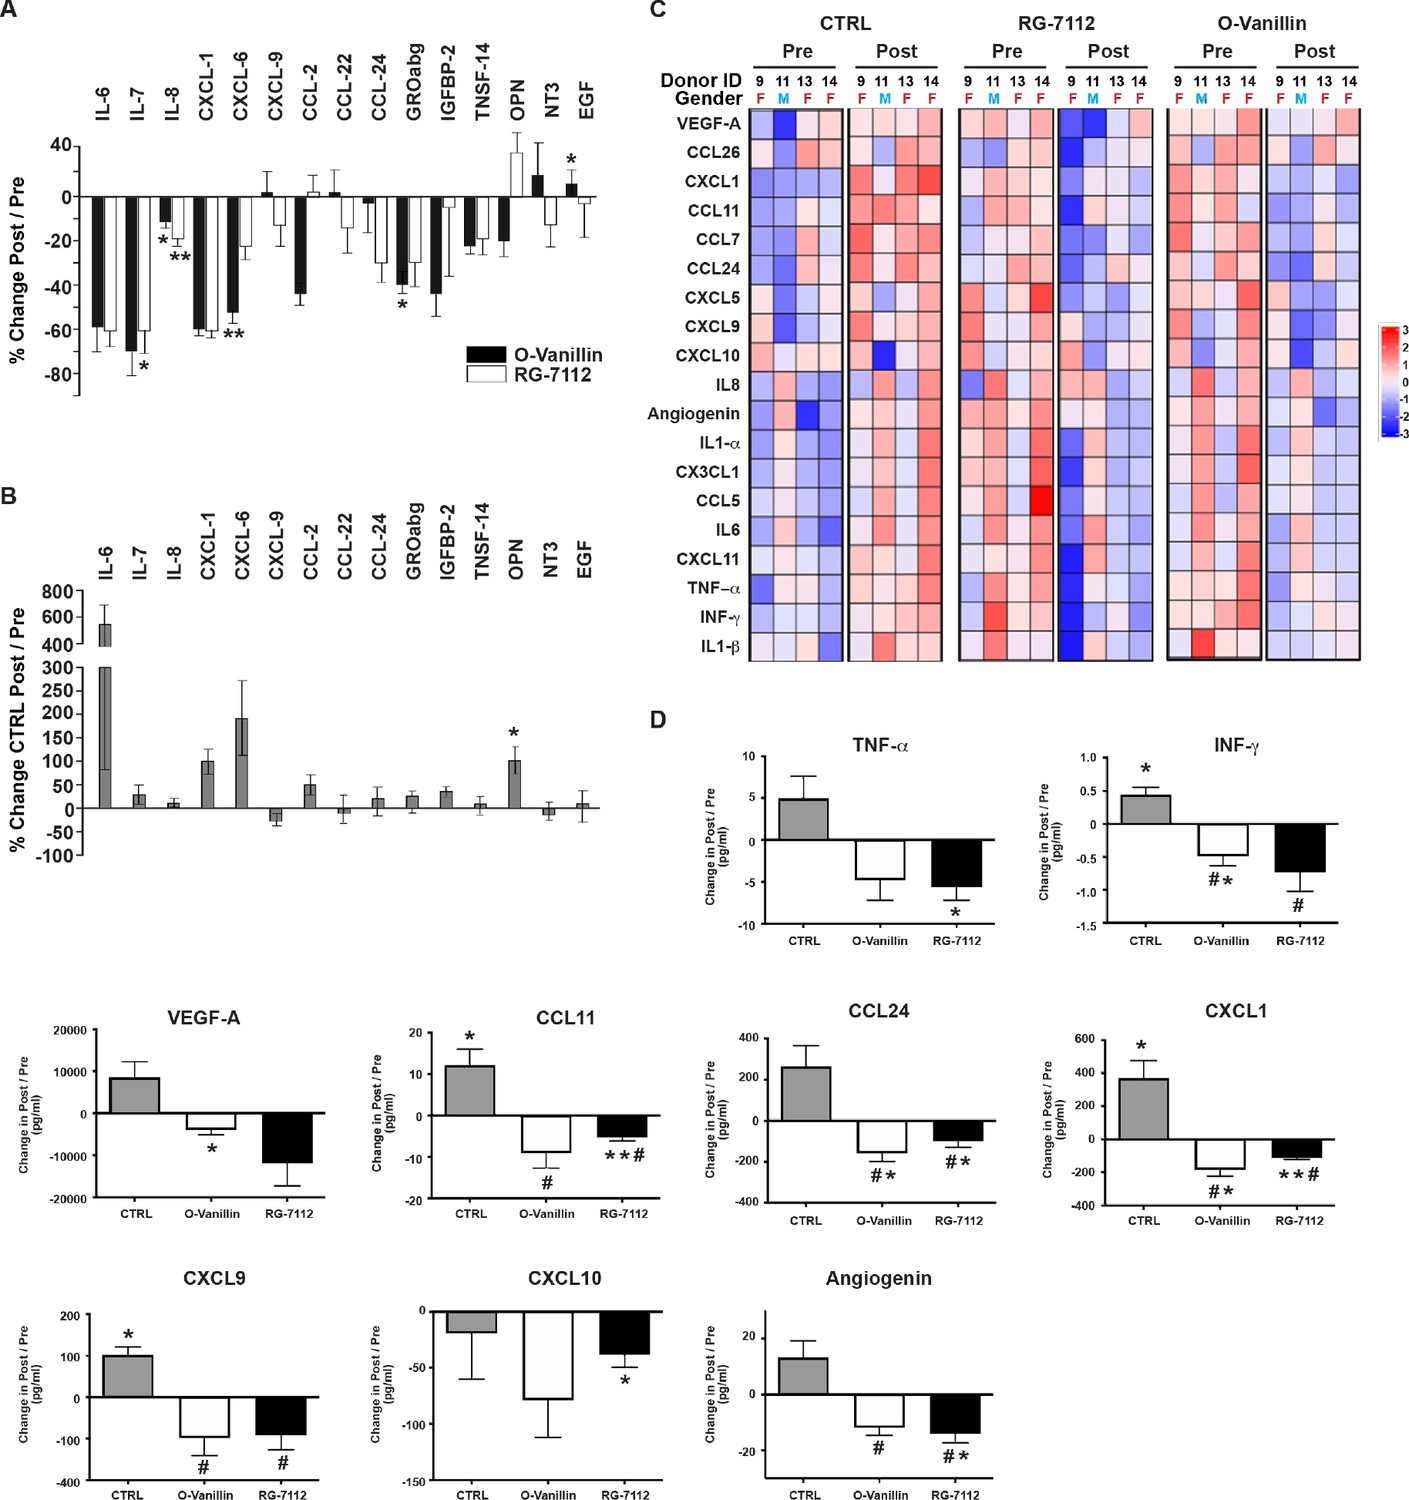
Profile of SASP factors released from ex vivo human IVDs cultures following senolytic treatment.
Culture media was analyzed by a RayBio Human Cytokine Array. Relative mean densitometry units of the 80 factors were normalized to pre-treatment media of the same IVD. The percentage change (post/pre) of the 15 most affected factors are shown for RG-7112 and o-Vanillin (A) and vehicle (B) treated discs. (C) Heatmap displaying quantification of 19 selected cytokines (19-plex Luminex array). Each column represents one individual and each row represent expression of a single protein. Data shown are log2 (fold change) in pre- or post-treated disc media relative to their respective expression level average. (D) Nine analytes (INF-γ, TNF-α, CCL11, CCL24, CXCL1, CXCL9, CXCL10, Angiogenin and VEGF) displayed statistically significant differences when measured in post compared to pretreated disc media. Error bars represent mean ± SEM. Statistical significance when comparing pre and post discs groups was assessed by two-tailed Student's t-test (A, B and D): * Indicates p<0.05 and **indicates p<0.01. Data was analyzed by repeated measures Analysis of Variance (ANOVA) with Turkey’s post hoc test for multiple pairwise comparison (D) where # Indicates significant difference (p<0.05) between treated and untreated groups, (n = 4). The analyzed media were collected from same donors used in Figure 4.
-
Figure 5—source data 1
Excel file containing the meausres of the significantly changed SASP factors measured using cytokine array and Luminex analysis in vehicle, RG-7112 and o-Vanilin disc media before and after the injection.
- https://cdn.elifesciences.org/articles/54693/elife-54693-fig5-data1-v1.xlsx
Figure 5—figure supplement 1
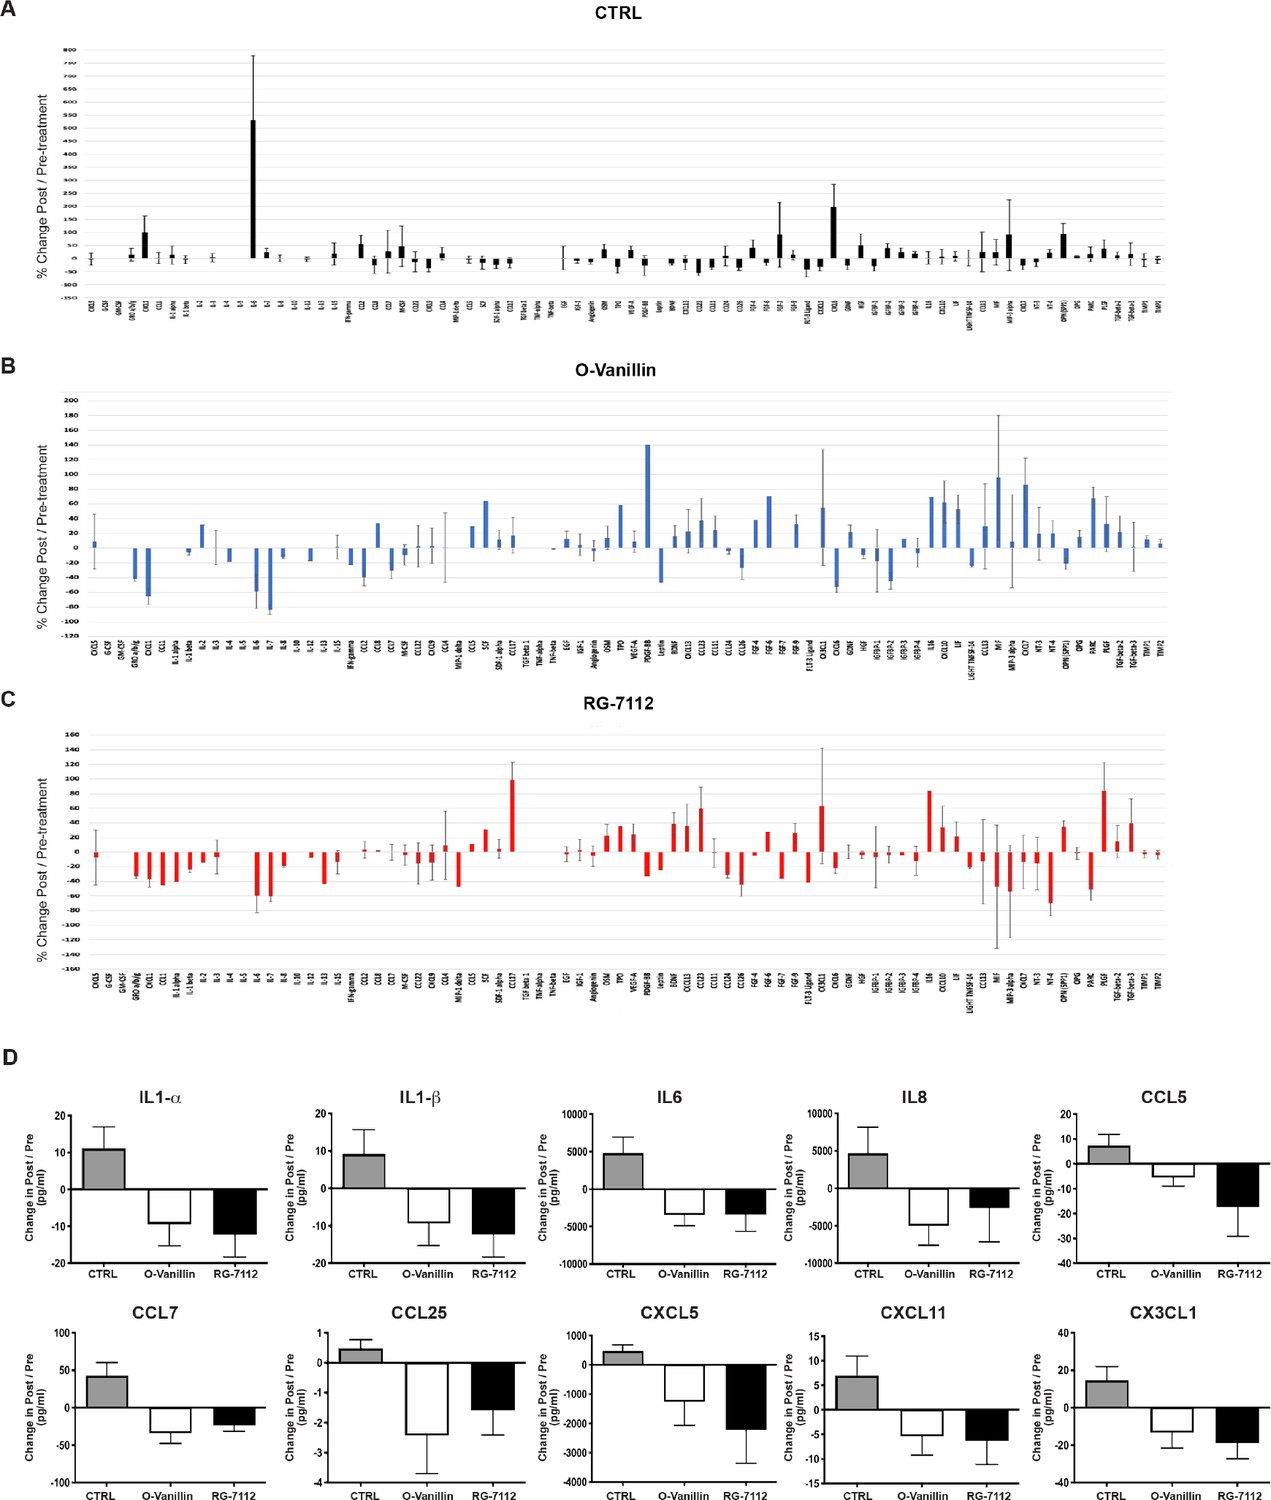
Complete profiling and measure of growth factors and cytokines in disc cultures media.
Total cytokine/chemokine array quantification of inflammatory factors release in (A) Control, (B) o-Vanillin and (C) RG-7112 discs. Shown in the graphs is the ratio (% change) of the factors detected in the cultures media of post-treated and compared with their respective pre-treated cultures media. (D) Ten analytes in disc media (IL-1α, IL-1β, IL-6, IL-8, CCL5, CCL7, CCL26, CXCL5, CXCL11 and CX3CL1) displayed no statistically significant decrease when compared with their respective controls. Data is presented as mean ± SEM and was analyzed by t-tests for pre and post groups and by repeated measures Analysis of Variance (ANOVA) with Turkey’s post hoc test for multiple pairwise comparison (n = 4).
-
Figure 5—figure supplement 1—source data 1
Excel file containing the complete list of SASP factors measured by cytokine arrays and the non-significantly regulated factors measured by Luminex assay in the pre and post media of injected discs.
- https://cdn.elifesciences.org/articles/54693/elife-54693-fig5-figsupp1-data1-v1.xlsx
Author response image 1

Tables
Key resources table
| Reagent type (species) or resource | Designation | Source or reference | Identifiers | Additional information |
|---|---|---|---|---|
| Antibody | Rabbit polyclonal anti-caspase-3 | Sigma-Aldrich | C8487 RRID:AB_476884 | IF (1:500) IHC-Fr (1:500) |
| Antibody | Rabbit polyclonal anti-Ki-67 | Novus Biologicals | NB500-170 RRID:AB_10001977 | IF (1:300) IHC-Fr (1:500) IHC-P (1:2000) |
| Antibody | Mouse monoclonal Anti- p16Ink4a | Abcam | ab54210 RRID:AB_2059963 | IHC-P (1:500) |
| Antibody | Polyclonal Alexa Fluor 488 (Donkey anti-Rabbit) | Invitrogen Thermo Fisher | A-21202 RRID:AB_141607 | IF (1:1000) |
| Antibody | Polyclonal Alexa Fluor 555 (Donkey anti-Mouse) | Invitrogen Thermo Fisher | A-31570 RRID:AB_2536180 | IF (1:1000) |
| Antibody Array | Human Cytokine Antibody Array C5 | RayBiotech, Inc | AAH-CYT-5–2 RRID:AB_10185250 | |
| Chemical compound, drug | o-Vanillin | Sigma-Aldrich | 120804 | |
| Chemical compound, drug | RG-7112 | Selleck Chemicals | S7030 | |
| Chemical compound, drug | DMSO | Sigma-Aldrich | D8418 | |
| Commercial Kit | Apoptosis detection | Abcam | ab176749 RRID:SCR_018379 | |
| Commercial Kit | Caspase 3/7 activity | AAT Bioquest 13503 | Amplite Fluorimetric Catalog # 13503 | |
| Commercial Kit | qScript cDNA Synthesis Kit | Quanta Biosciences | 95047–500 | |
| Commercial Kit | Goat anti-Mouse and Rabbit specific HRP/DAB Detection IHC Kit | Abcam | ab64264 | |
| Commercial Kit | Mouse monoclonal Anti- p16Ink4a | Roche, Ventana Laboratories | CINtec Plus (9531) RRID:SCR_018380 | Prediluted |
| Commercial Kit | Mycoplasma PCR Detection Kit | ZmTech Scientific | M209001 | |
| Commercial Assay | Custom Taqman (R) Gene Expression 96-Well Fast Plates | Thermo Fisher | 4413255 | See Supplementary file 1 for each gene product ID |
| Commercial Assay | Luminex immunoassay 19-PLEX plate - Human Cytokine PROCARTAPLEX | Life Technologies | MXMFXHX | |
| Software | ImageJ | ImageJ http://imagej.nih.gov/ij/ | RRID:SCR_003070 | |
| Software | GraphPad Prism 8 | GraphPad Prism https://www.graphpad.com | RRID:SCR_015807 | |
| Software | Ingenuity Pathway Analysis (IPA) | Ingenuity Systems | RRID:SCR_008653 | |
| Software | R package ggplot2 | Wickham, 2016 | ISBN 978-3-319-24277-4 | |
| Software | MIPAV | NIH Center for Information Technology | RRID:SCR_007371 | |
| Software | Image Quant TL array analysis | GE Healthcare | RRID:SCR_018374 | |
| Software | FlowCytomix Pro2.2.1 | eBioscience | RRID:SCR_018375 | |
| Software | AxioVision LE64 | Zeiss | RRID:SCR_002677 | |
| Other | DMMB | Sigma-Aldrich | 341088 | |
| Other | Alamar Blue reagent | Thermo Fisher | DAL1025 | |
| Other | DAPI stain | Invitrogen | D1306 | (1 µg/mL) |
| Other | Safranin-O | Sigma-Aldrich | S2255 | |
| Other | TaqMan Fast Universal PCR Master Mix (2×) | Thermo Fisher | 4366073 | |
| Cell line | Primary Human Nucleus Pulposus (NP) and Annulus Fibrosis (AF) | Primary Cells | Human Biological samples. See Table 1 for demographics. | Cell line maintained in Haglund Lab. |
Table 1
Donors demographics.
| Donor ID | Age | Sex | Cause of death |
|---|---|---|---|
| 1 | 53 | F | Anoxia |
| 2 | 53 | M | bone; cerebral aneurysm rupture |
| 3 | 76 | F | Anoxia |
| 4 | 52 | M | Ischemic cerebral vascular accident |
| 5 | 17 | M | Brain death |
| 6 | 73 | F | Cerebrovascular hemorrhage |
| 7 | 68 | F | Cerebral hemorrhage |
| 8 | 39 | M | Gunshot to the neck |
| 9 | 66 | F | Unknown |
| 10 | 67 | M | Cardiac arrest |
| 11 | 69 | M | Cerebral hemorrhage |
| 12 | 61 | M | Cardiac arrest |
| 13 | 40 | F | Brain hemorrhage |
| 14 | 53 | F | Medical suicide |
| 15 | 28 | M | Suicide (Hang) |
| 16 | 35 | M | Anoxia |
Table 2
Complete donors list per assays and results.
| Donor ID | Discs | Thompson grade and Degeneration | Cell type | Type of culture | Type of assays | Results |
|---|---|---|---|---|---|---|
| 6 | L1-L5 | 3 - (D) | NP & AF | Pellet | IHC Metabolic activity | Figure 1 (A–D) Donor # 6, 7, 10–15 Figure 1—figure supplement 1(A) Donor # 10–15 Figure 1—figure supplement 1(G) Donor # 10–15 |
| 7 | L2-L5 | 4 - (D) | ||||
| 8 | L3-S1 | 3 - (D) | ||||
| 10 | L4-L5 | 4 - (D) | ||||
| 11 | L5-S1 | 3 - (D) | ||||
| 12 | L5-S1 | 3 - (D) | ||||
| 13 | L4-S1 | 3 - (D) | ||||
| 14 | L5-S1 L1-L2 | 3 - (D) | ||||
| 15 | L5-S1 | 5 - (D) | ||||
| 11 | L5-S1 | 3 - (D) | NP | Pellet | RT-qPCR Cytokine array Luminex | Figure 2 (A–E) Figure 3 (A–E) Figure 2—figure supplement 1(A) Figure 3—figure supplement 1(A-C) All Donor # 11–15 |
| 12 | L5-S1 | 3 - (D) | ||||
| 13 | L4-S1 | 3 - (D) | ||||
| 14 | L5-S1 L1-L2 | 3 - (D) | ||||
| 15 | L5-S1 | 5 - (D) | ||||
| 9 | T11-L2 | Table 3 | Intact disc | Ex vivo | MRI Luminex IHC | Figure 4 (A–F) Figure 5 (A–D) Figure 5—figure supplement 1(A-D) Donor # 9, 11, 13 and 14 |
| 11 | L1-L4 | Table 3 | ||||
| 13 | L1-L4 | Table 3 | ||||
| 14 | L2-L5 | Table 3 | ||||
| 1 | L1-S1 | 4 - (D) | NP | Monolayer | ICC Metabolic activity Caspase 3/7 activity | Figure 1—figure supplement 1(B, C and D) Donor # 1–3 Figure 1—figure supplement 1(E and F) Donor # 1–3 and 11 (D) Donor # 4, 5, 10 and 11 (ND) |
| 2 | L4-S1 | 3 - (D) | ||||
| 3 | L2-S1 | 4 - (D) | ||||
| 4 | L1-L5 | 1 - (ND) | ||||
| 5 | T11-S1 | 1 - (ND) | ||||
| 10 | T12-L1 | 1 - (ND) | ||||
| 11 | T12-L1 L5-S1 | 1 - (ND) 3 - (D) | ||||
| 15 | T11-L5 L5-S1 | 1 - (ND) 5 - (D) | Intact disc | NP Area and position measure | Figure 2—figure supplement 1(B-C) Donor # 15 and 16 | |
| 16 | L1-S1 | 1 - (ND) | ||||
Table 3
Characteristics of discs injected with each treatment.
| Donor ID | 9 | 11 | 13 | 14 | |
|---|---|---|---|---|---|
| Age | 66 | 69 | 40 | 53 | |
| Sex | F | M | F | F | |
| CTRL | Disc Level | T12/L1 | L1/2 | L1/2 | L2/3 |
| Grade | 2 | 2 | 2 | 2 | |
| Disc Height (cm) | 0.84 | 0.92 | 0.92 | 0.88 | |
| O-Vanillin | Disc Level | L1/2 | L2/3 | L3/4 | L4/5 |
| Grade | 2 | 2 | 2 | 2 | |
| Disc Height (cm) | 0.92 | 0.89 | 0.99 | 0.88 | |
| RG-7112 | Disc Level | T11/T12 | L3/4 | L2/3 | L3/4 |
| Grade | 2 | 2 | 2 | 2 | |
| Disc Height (cm) | 0.82 | 0.9 | 0.93 | 0.99 |
Additional files
-
Supplementary file 1
Gene names (aliases) and primers.
- https://cdn.elifesciences.org/articles/54693/elife-54693-supp1-v1.xlsx
-
Supplementary file 2
List of cytokines and synonyms.
- https://cdn.elifesciences.org/articles/54693/elife-54693-supp2-v1.docx
-
Supplementary file 3
List of differentially and non-differentially expressed genes following treatment with o-Vanillin and RG-7112.
(a) Eight Differentially Expressed genes significantly up- or downregulated at p < 0.05 in RG-7112 condition. (b) Forty Differentially Expressed genes significantly up- or downregulated at p < 0.05 in o-Vanillin condition. (c) Non-Differentially Expressed genes in RG-7112. (d) Non-Differentially Expressed genes in o-Vanillin.
- https://cdn.elifesciences.org/articles/54693/elife-54693-supp3-v1.docx
-
Supplementary file 4
O-Vanillin and RG-7112 IPA network scores, molecules and top diseases.
(a) O-Vanillin network scores, molecules and top diseases. Physical function analysis using IPA of o-Vanillin treated NP pellets generated three networks which are ordered by a score denoting significance. The highest-scoring network, which comprises 37 proteins in our list, revealed significant changes in cell death and survival, neurological disease, organismal Injury and abnormalities. In addition, the other networks revealed changes in cancer, cellular movement, connective tissue development and function, cell cycle, organismal injury and abnormalities. (b) RG-7112 network scores, molecules and top diseases. Physical function analysis using IPA of RG-7112 treated NP pellets generated a single network which is ordered by a score denoting significance of 21. This network reveals significant changes in cell cycle, cell death and survival, connective tissue development and function.
- https://cdn.elifesciences.org/articles/54693/elife-54693-supp4-v1.docx
-
Transparent reporting form
- https://cdn.elifesciences.org/articles/54693/elife-54693-transrepform-v1.pdf
Download links
A two-part list of links to download the article, or parts of the article, in various formats.
Downloads (link to download the article as PDF)
Open citations (links to open the citations from this article in various online reference manager services)
Cite this article (links to download the citations from this article in formats compatible with various reference manager tools)
Senotherapeutic drugs for human intervertebral disc degeneration and low back pain
eLife 9:e54693.
https://doi.org/10.7554/eLife.54693


