A physicochemical perspective of aging from single-cell analysis of pH, macromolecular and organellar crowding in yeast
- European Research Institute for the Biology of Ageing, University of Groningen, University Medical Center Groningen, Netherlands
- Department of Cell Biology, Yale School of Medicine, United States
- Department of Pathology, School of Medicine, University of Washington, United States
- DWI-Leibniz Institute for Interactive Materials, Germany
Figures
Figure 1 with 3 supplements
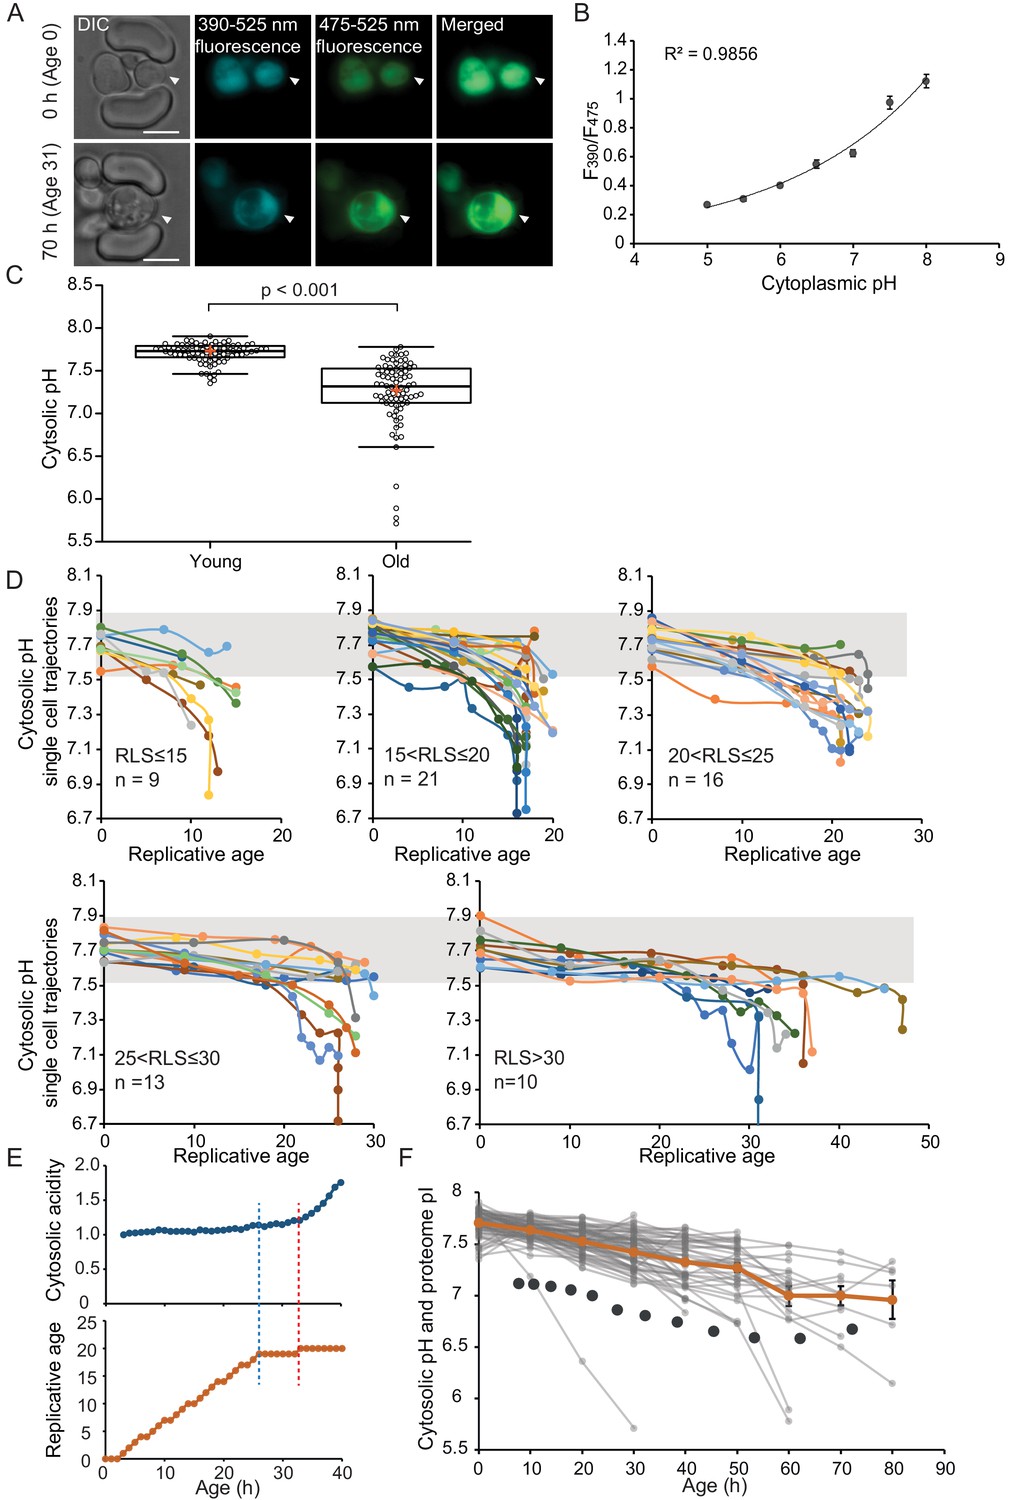
The cytosol of old cells acidifies, and cells display more substantial variability in cytosolic pH with aging, especially after entry into senescence.
(A) Representative images of the same cell expressing ratiometric pHluorin imaged at the start of the experiment and after 80 hr; the replicative age is indicated. Young cells are trapped in the microfluidic device, and bright-field images are taken every 20 min to determine the age of the cells. Fluorescent images are taken once every 10 hr (panels, C, D, F) or every hour (panel E) with excitation at 390 and 475 nm and emission at 525 nm. The images show DIC, DAPI, and FITC channels and merged fluorescence. The scale bar represents 5 μm. The trapped aging cell is indicated with white arrowheads. (B) Calibration curve showing the relationship between intracellular pH and pHluorin ratios. Cells expressing pHluorin from an exponential culture at OD600 of 0.5 were resuspended in buffers, titrated to pH 5, 5.5, 6, 6.5, 7, 7.5, 8, containing final concentrations of 75 μM monensin, 10 μM nigericin, 10 mM 2-deoxyglucose, and 10 mM NaN3. Monensin and nigericin are ionophores that carry protons across the plasma membrane, while the 2-deoxyglucose and NaN3 deprive the cell from ATP and thus block energy-dependent pH maintenance. Each point represents data from 20 cells. (C) Data collected from 80 yeast cells during the process of replicative aging. The young group consists of data points from the first recorded ratio at time 0 hr, and the old group consists of the last recorded measurement before cell death. Colored crosses indicate the average and bold lines show the median, p=9.1E-18. (D) Single-cell profiles of the pH at different replicative ages. Cells are grouped according to lifespan (RLS <15, 15–20, 20–25, 25–30 and >30). Grey bar indicates the range of pH values measured in the first time point (young age) to illustrate that 36% of the cells remain within this range throughout their lifespan. (E) Cytosolic acidity (normalized ratiometric pHluorin read-out:F475/F390, top) and replicative age (bottom) as a function of time, for a cell that enters senescence at 26 hr (dashed blue line) after which a sharp acidification of the cytosol (dashed red line) follows. (F) The pH of single cells during aging plotted versus their age in hours. Each grey line represents a single cell. The orange line shows the average pH. The dark grey circles show the total proteome pI in aging estimated based on the PI and changes in abundance of 1229 proteins. Error bars represent the standard error of the mean (SEM).
-
Figure 1—source data 1
Singe-cell measurements of pH in replicative aging yeast cells.
- https://cdn.elifesciences.org/articles/54707/elife-54707-fig1-data1-v2.xlsx
Figure 1—figure supplement 1
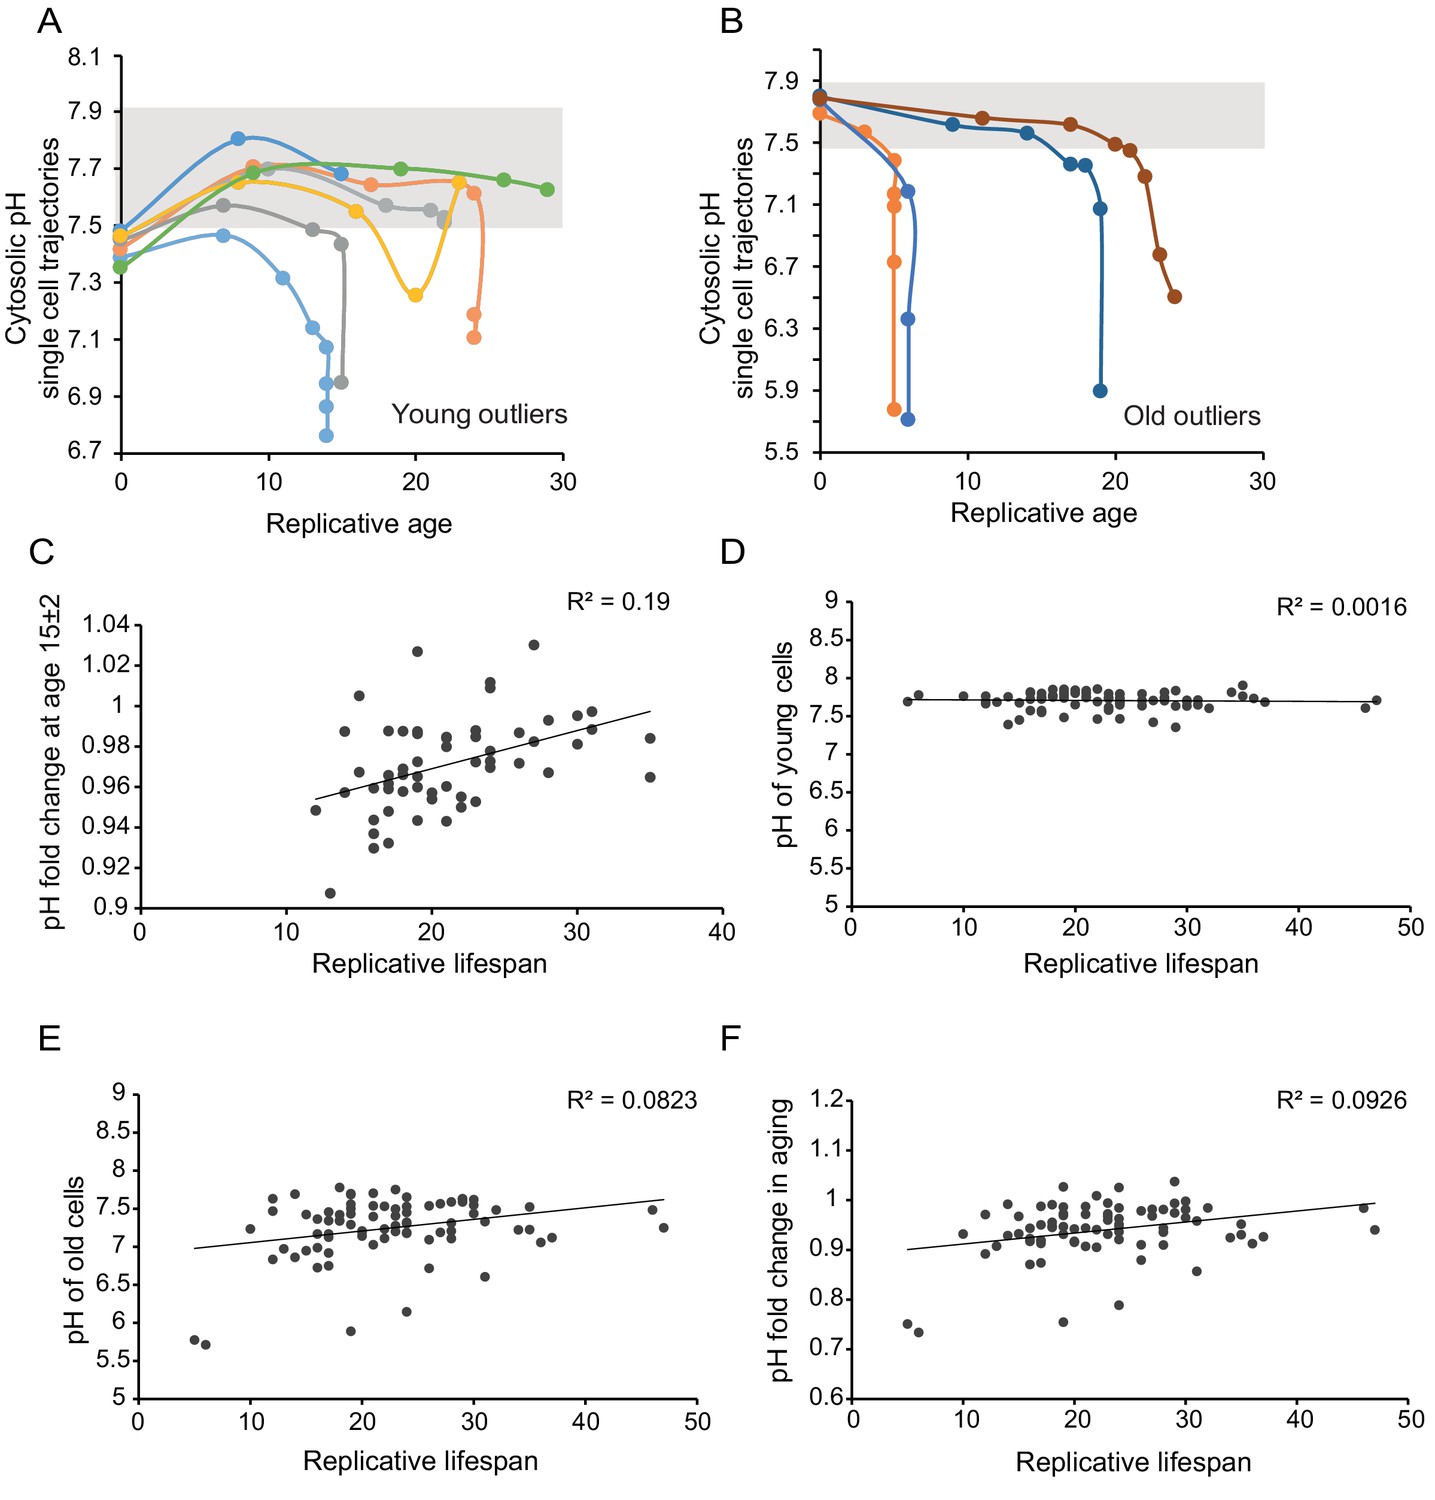
Age-related changes in cytosolic pH are not predictive for lifespan.
As in Figure 1D but now for the population outliers from 1C; (A) outliers at young age; (B) outliers at old age. (C) The change in pH within the first 15 (±2) divisions correlates weakly with lifespan. Only cells that had a measurement falling in the ages between 13 and 17 divisions were included in this analysis; R²=0.1893, p=0.000718509, n = 57. (D,E,F) The pH in young (D) and old cells (E), as well as the fold change in pH in aging (F), do not correlate with the replicative lifespan.
Figure 1—figure supplement 2
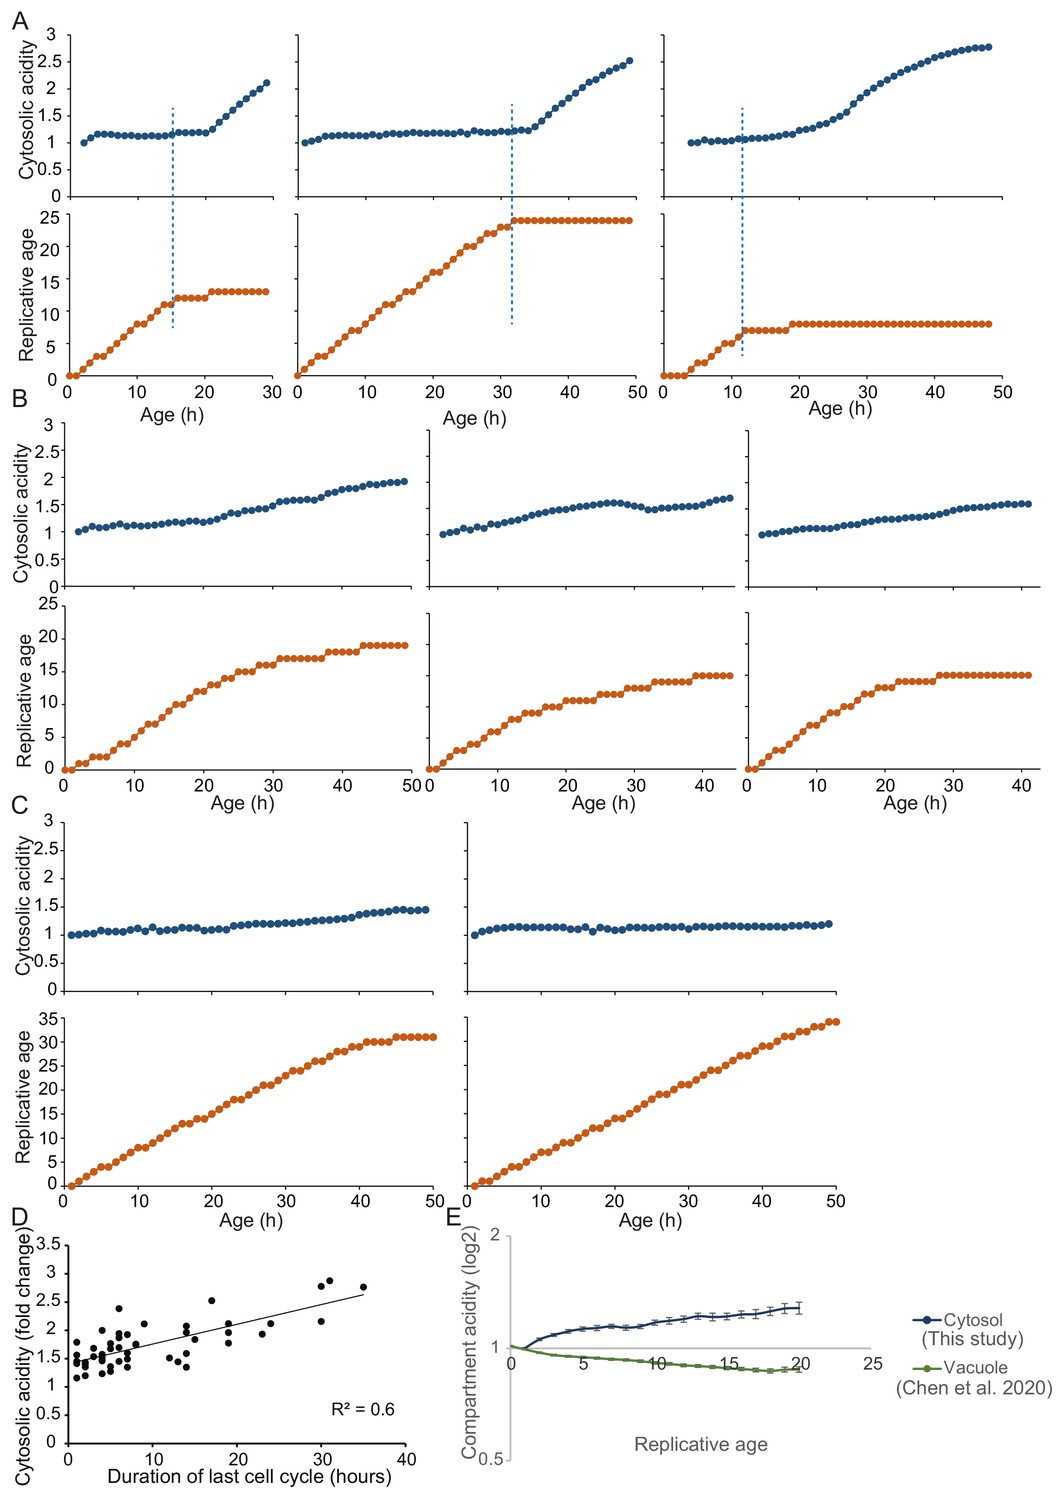
Representative single-cell trajectories with high time course resolution to pinpoint timing of senescence entry and sharp cytosolic acidification.
(A) Cells with clear senescent phenotype show that senescence entry precedes sharp increase in cytosolic acidity. (B) Representative cells that lack a clear senescent phenotype but have significantly longer division times show a gradual and more modest increase in cytosolic acidity. (C) Long lived and actively dividing cells (16% of the total population) show little change in cytosolic pH. For A, B, and C: The dark blue line shows F475/F390 ratio normalized to replicative age 1, as a read-out to cytosolic acidity. The orange line indicates the replicative age. Both cytosolic acidity and replicative age are plotted versus the cell’s age in hours. Each data point indicates a separate measurement. All measurements have been collected with interval of 1 hr. The blue dashed line shows entry into senescence. (D) The fold change of cytosolic acidity for all cells is plotted versus the time (in hours) that each cell took to complete the last division before the measurement took place; R2 = 0.5681, p=2.7E-10. (E) High time course data on cytosolic (this study) and vacuolar (Chen et al., 2020) acidity in yeast replicative aging. The vacuolar data (green line) are normalized to the average F475/F390 ratio from ages 0 and 1, as described in Chen et al., 2020. The cytosolic data (blue line) are normalized to age one to compensate for adaptations the cells experience when first loaded in the chip.
Figure 1—figure supplement 3
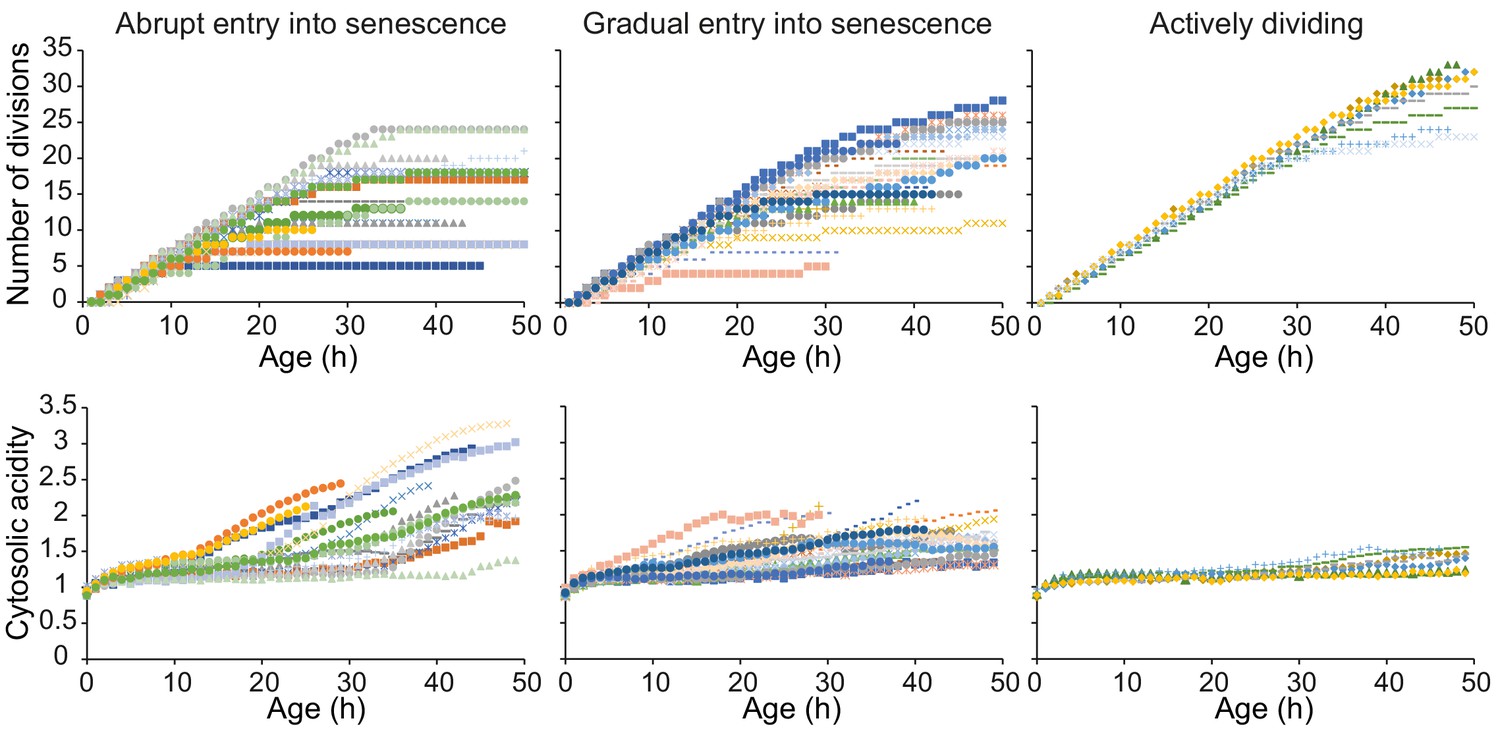
Single-cell trajectories with high time course resolution, categorized in qualitative groups based on their senescence status.
We split the cells in three groups based on whether they (1) abruptly enter senescence; (2) gradually enter senescence; (3) do not become senescent throughout the duration of the experiment. The first group consists of 18 cells (36% of the total population), with average age at 50 hr of 15 divisions and highest fold increase in acidity of ~2. The second group represents half of the population with 25 cells, with average age at 50 hr of 18 divisions, and a smaller increase of 1.6-fold change. The third population consists of seven cells (14%), with average age at 50 hr of 30 divisions and a fold increase in acidity of 1.4. Please note that these measurements only reflect the lifespan and increase in acidity of the cells throughout the 50 hr of the experiment. Therefore, for all categories, it is likely that cells will acidify further when they become post-mitotic/spend longer time in senescence. Of the total number of cells, 28% died within the timespan of the experiment with five cells from category 1; eight cells from category 2 and one cell from category 3.
Figure 2 with 1 supplement
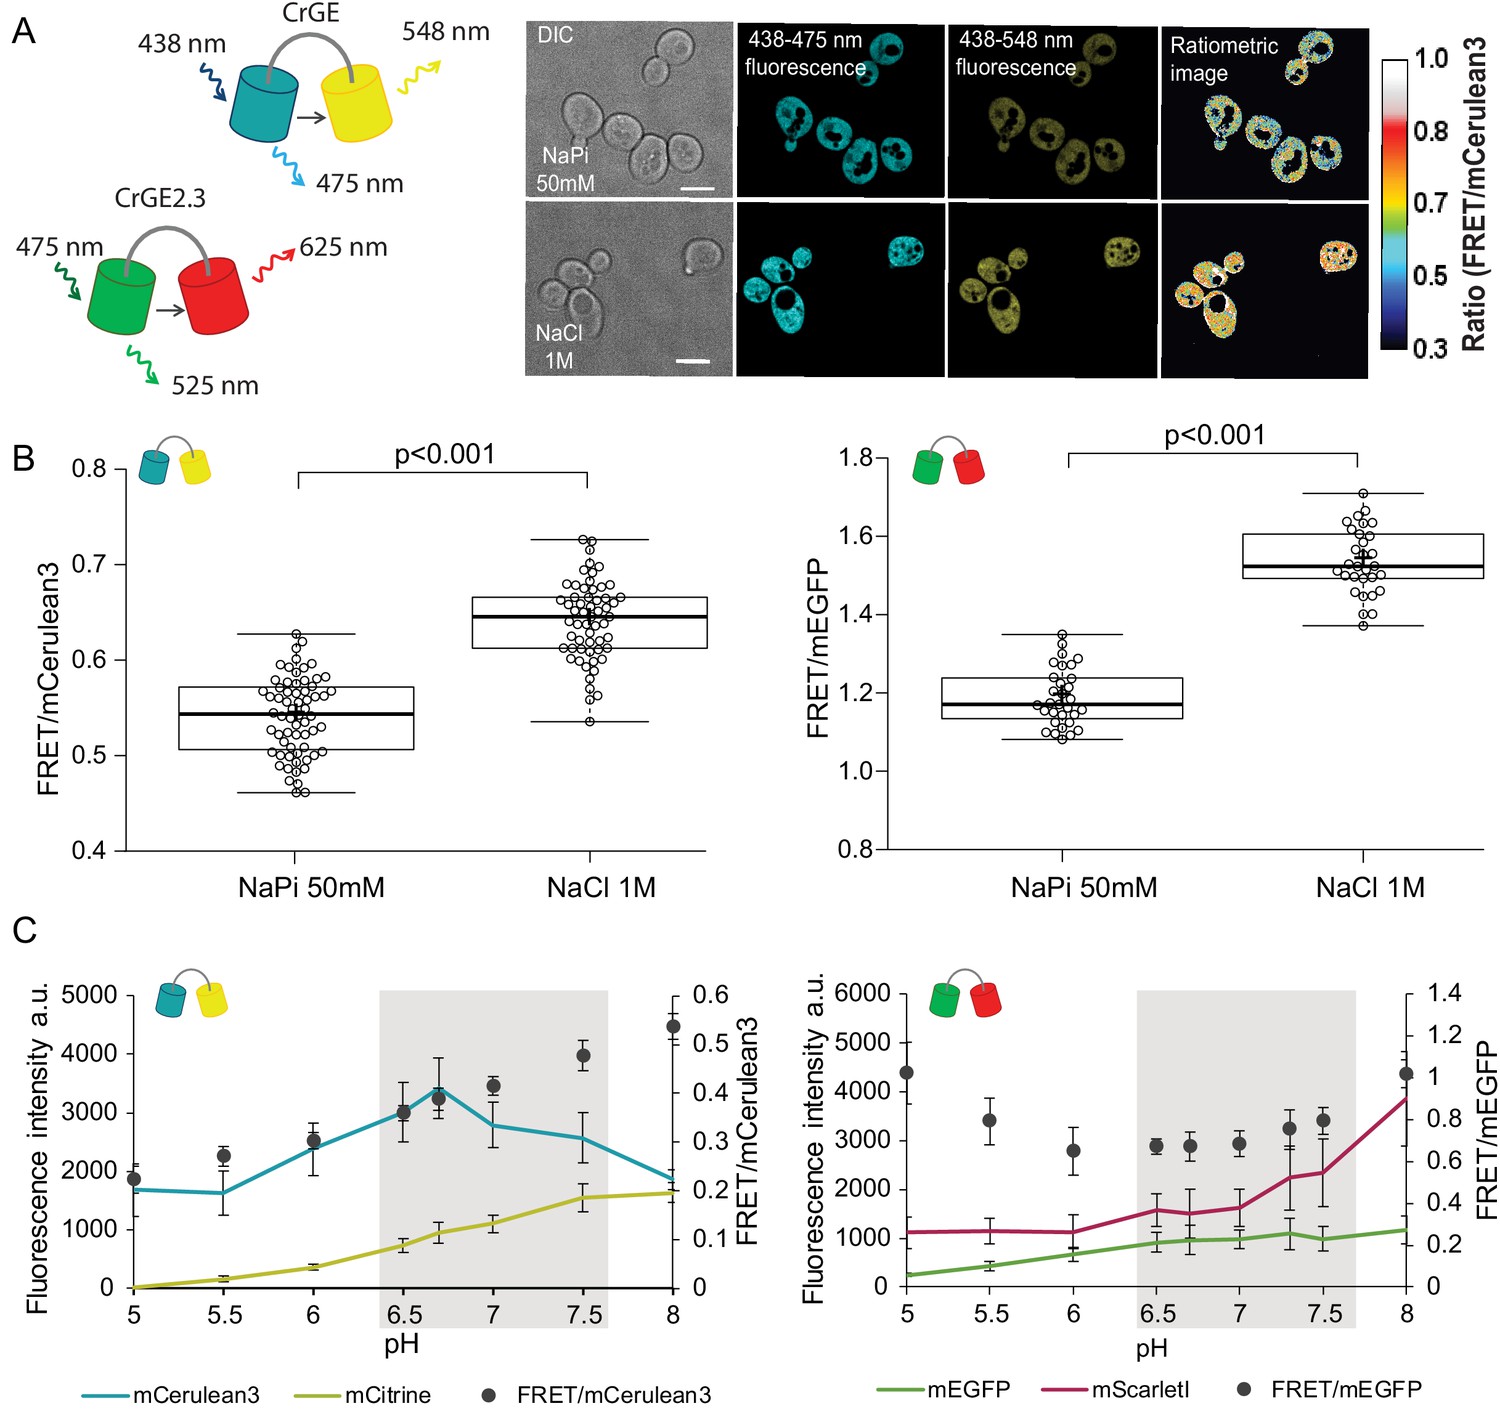
Crowding sensor with traditional CFP-YFP FRET pair is functional in yeast cells, but sensitive to pH variations; the sensor CrGE2.3 with mEGFP-mScarlet-I is aging-compatible.
(A) Left: Schematic representation of the crGE and CrGE2.3 sensors. Right: Yeast cells expressing crGE sensor, the DIC, mCerulean3, and FRET channels are shown. Ratiometric image shows changes in the crowding ratio upon osmotic shock. The scale bar is 5 μm. (B) CrGE sensor (left), expressed under a strong constitutive TEF1 promoter in yeast, shows an increase in FRET/CFP ratio upon osmotic shock with 1M NaCl versus control in sodium phosphate buffer at pH 7. Crosses indicate the average and bold lines show the median. The data is from n > 58 cells per condition; p=2.0E-25. Right: CrGE2.3 sensor, expression and osmotic shock experiment is the same as for the original CrGE sensor, the data is from 30 cells per condition, p=1.6E-24 (C) Left: Fluorescence intensities of mCerulean3 (blue line), and mCitrine (yellow line; directly excited) and FRET/CFP ratios (black circles). Right: Fluorescent intensities from mEGFP (green line) and mScarlet-I (magenta; directly excited) and FRET/mEGFP ratio (black circles) from permeabilized cells, expressing the crowding sensor CrGE (left) and CrGE2.3 (right), in buffers with pH ranging from 5 to 8. Each data point represents the average of 20 cells; error bars show standard deviation.
-
Figure 2—source data 1
Validation of FRET sensors GrGE and GrGE2.3.
- https://cdn.elifesciences.org/articles/54707/elife-54707-fig2-data1-v2.xlsx
Figure 2—figure supplement 1
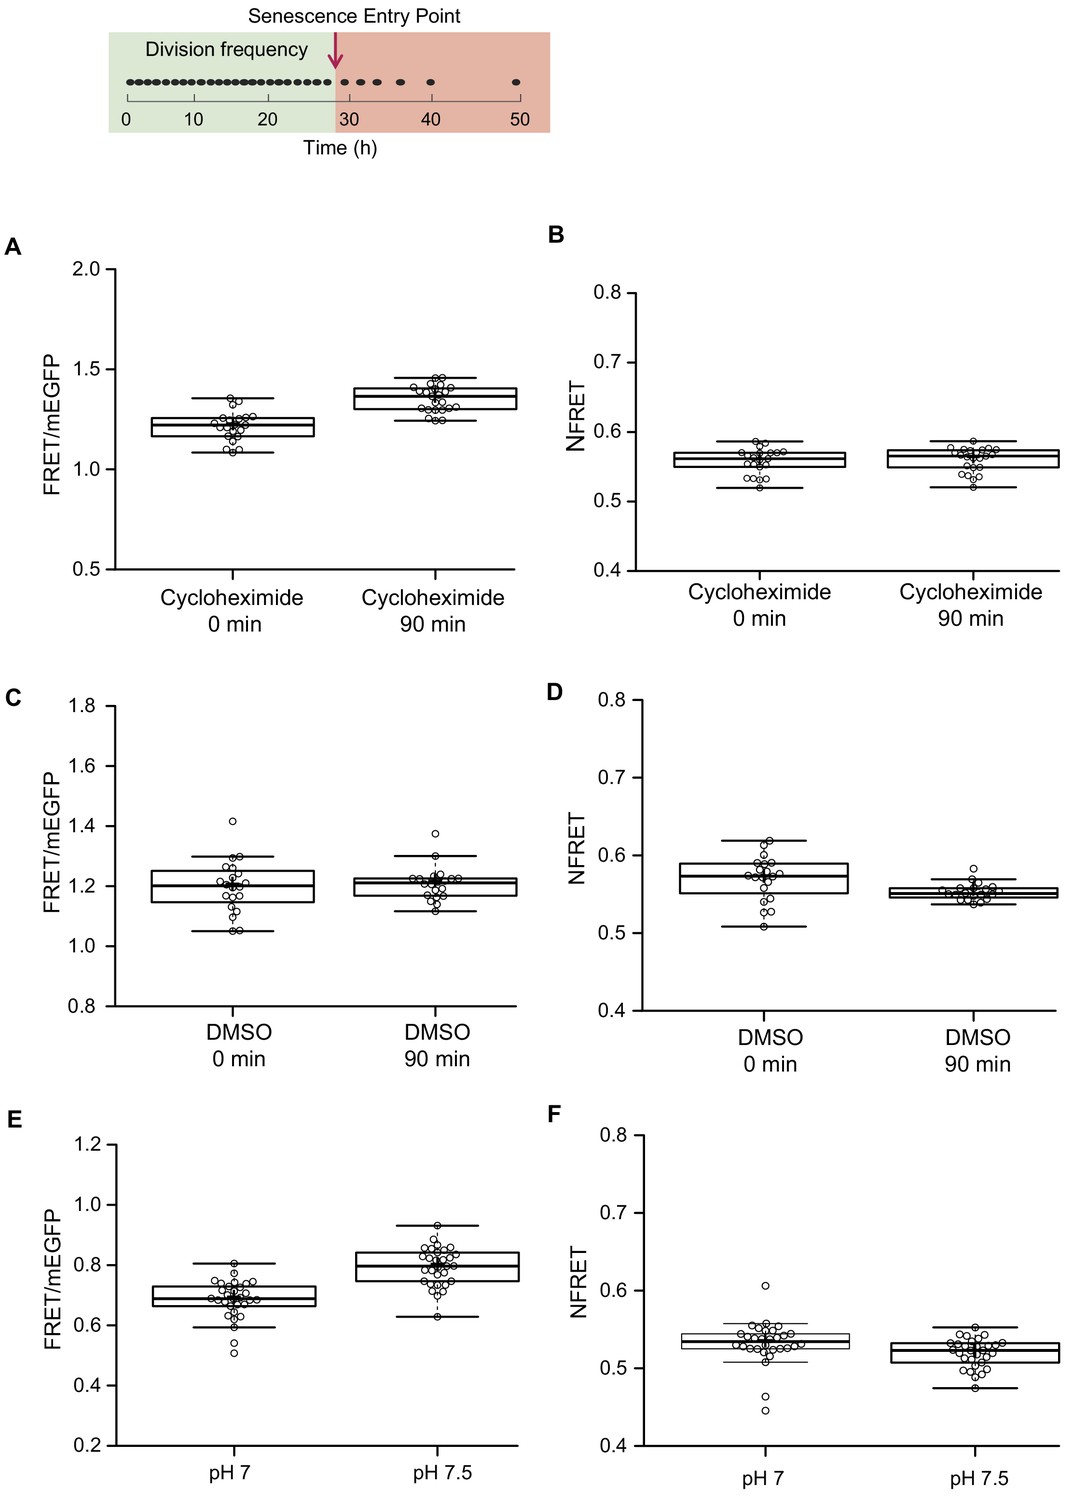
Read-outs from fluorescent sensors are sensitive to conditions affecting the amount of actively fluorescent donor and acceptor of FRET, such as changes in division frequency and varying intracellular pH.
(Top row) The division frequency of a representative cell during its replicative lifespan in the microfluidic device, indicated by black dots. The timeline is indicated underneath. The green box highlights the part of the lifespan of the cell, where the division frequency is constant. The supposed senescence entry point is indicated with an arrow, and the red box highlights the reduced division frequency after the cell enters into senescence mode. (A) Cells from an exponential culture, expressing the new version of the crowding sensor CrGE2.3, are treated with 1 μM cycloheximide or (C) DMSO as control, and samples were collected at two points: 0 min and 90 min after the addition of cycloheximide or DMSO. FRET/mEGFP ratios increase in the cycloheximide probe, but not in the DMSO probe, showing the sensitivity of the sensor to the different maturation kinetics of the donor and acceptor. (B) When applying a correction for an unequal number of donor and acceptor, as described in the Materials and methods section, there is no difference in the normalized read-out after 90 min of cycloheximide treatment and (D) a small reduction in DMSO treatment. (E) The sensor is mildly sensitive to pH changes within the relevant physiological range. (F) When we normalize the read-out, this dependence is alleviated. (G) The crowding read-out reports on increased crowding through hyperosmotic shock, induced by 1M NaCl or (I) 1.5 M Sorbitol. (H and J) The normalization procedure does not affect the increase in crowding read-out, induced by actual crowding events. n = 20–30 cells per condition. To test if the correction for unequal amounts of fluorescent proteins (Xia and Liu, 2001) compensates for maturation artifacts, we subjected cells to 90 min of cycloheximide treatment. Cycloheximide inhibits protein translation and allows the fluorescent proteins to fully mature. We compared the FRET ratios before and after 90 min of treatment with 1 μM cycloheximide and estimated an 11% increase with average ratios starting from 1.22 immediately after addition of cycloheximide to 1.35 after 90 min of treatment (A). We added 10 μL DMSO to the control culture and did not observe any significant changes in the average ratio, which remains 1.2 after 90 min of exposure to DMSO (C). The increase in the FRET/donor ratio observed upon cycloheximide treatment is likely related to maturation instead of crowding because inhibiting protein synthesis would not increase crowding. The NFRET ratio did indeed not change during cycloheximide treatment, showing the validity of correction for an unequal number of donor and acceptor due to maturation artifacts (B). We observed similar effects for the pH: Permeabilized cells at pH 7 and pH 7.5, which is a physiologically relevant pH range in the context of ageing and a range where the mScarlet-I is pH sensitive, gave FRET ratios at pH 7 of 0.69 and 0.79 at pH 7.5 (E), while the corresponding NFRET ratios are the same with 0.53 and 0.52, respectively (F). Importantly, this normalization retains readouts from crowding changes (A-F), where the increase remains 20% upon osmotic upshift.
Figure 3 with 1 supplement

Crowding remains remarkably stable in aging.
(A) Yeast cells expressing the crGE2.3 sensor, trapped in the aging chip. Images are from the same cell at the beginning of the experiment and the last measurement taken before cell death. Fluorescent images are taken once every 10 hr. Boxes indicate a cytoplasmic region. The scale bar is 5 μm. (B) Boxplot, showing normalized crowding ratios in young and old cells. For the young population, the first ratios recorded at the start of the experiment were taken. For the old population, the last ratio recorded before cell death was taken. The old population contains cells from different ages with a median lifespan of 18 divisions, n = 80. The ratio recorded for the cell displayed in Figure 3—figure supplement 1A is shown with a red dot. (C) Single-cell trajectories of cells with indicated replicative lifespan-ranges and an indicated number of cells in each category. Grey boxes indicate the range of crowding ratios at the end of the replicative lifespan (RLS) of each age group. (D) The fold change in crowding plotted against the replicative lifespan of cells, R2 = 0.22, p=1.3E-05. (E) The average first and last recorded NFRET values of cells with an RLS shorter (red) or longer (blue) than the median RLS of 18 divisions. There is no difference in crowding between young and old cells from the long-lived population. However, in the short-lived population, the old cells have significantly higher crowding than the young cells (p=0.007), and the old cells from the long-lived population (p=0.003).
-
Figure 3—source data 1
Singe-cell measurements of macromolecular crowding in replicative aging yeast cells.
- https://cdn.elifesciences.org/articles/54707/elife-54707-fig3-data1-v2.xlsx
Figure 3—figure supplement 1
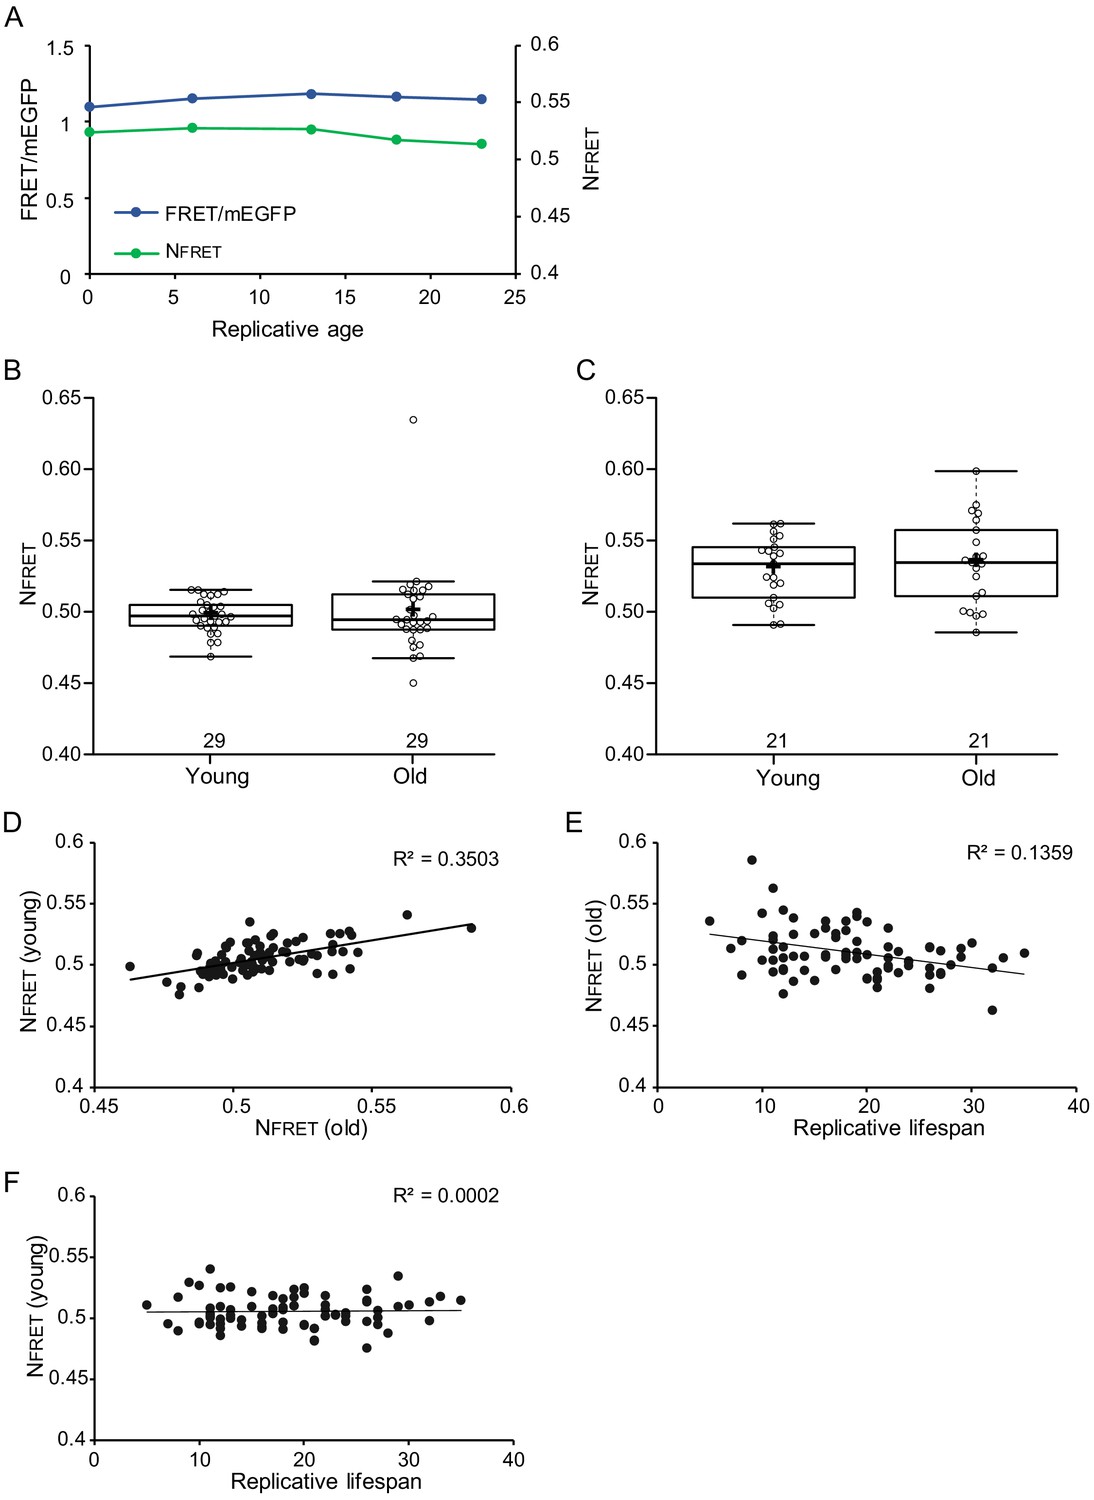
Crowding levels vary between individual young cells, but starting crowding levels do not associate with lifespan.
In old cells, there is a weak correlation between lower crowding levels and longer lifespan. (A) Single-cell trajectory of FRET/mEGFP ratios (blue line) and normalized FRET (green line) (B) and (C) show data from young and old cells from two separate experiments with n = 29 and n = 21, respectively. As in Figure 3B, also here crowding remains stable in aging. (D) Normalized crowding read-outs from young cells, plotted versus their crowding levels at old cells, show that crowding levels vary between individual cells and are generally maintained throughout aging; R2 = 0.3503, p=2.3E-07 (E) There is a weak correlation between crowding levels in old cells and lifespan, R2 = 0.1359, p=0.000764711. (G) Starting crowding levels are not predictive for lifespan, shown by the lack of correlation between crowding read-out in young cells and their lifespan.
Figure 4 with 4 supplements
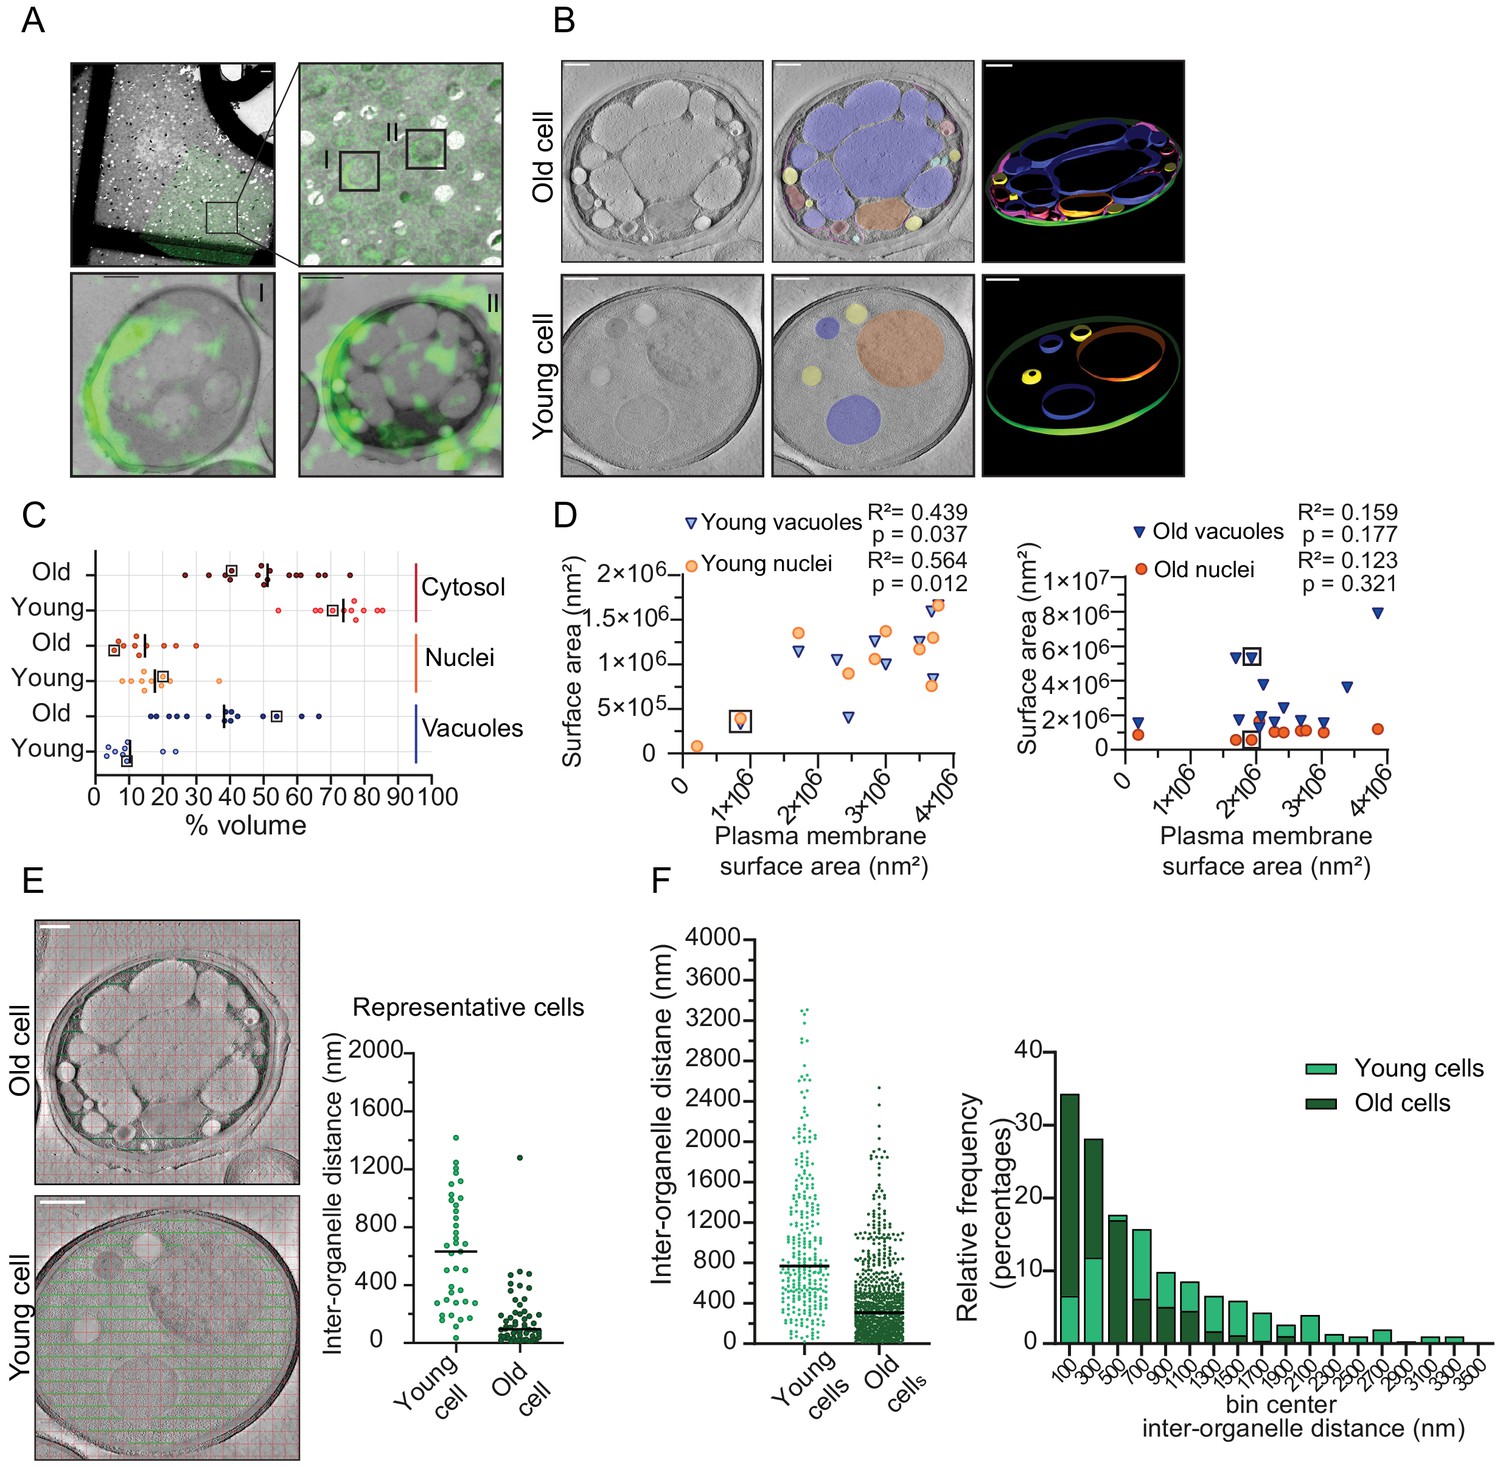
Inter-organellar crowding increases in aged cells.
(A) Identification of aged cells (20 hr, replicative age ~13) by CLEM. Overlay of low magnification (225x) electron micrograph and fluorescence image and zoom-in of old cells with Alexa-488 labeling (boxed). Scale bar is 10 µm. Boxed cells I and II are shown at higher magnification (8900x) in lower panels with a scale bar set at 1 µm. (B) Single slices of tomograms without (left panel) and with an overlay to emphasize organelles (middle panel). 3D isosurface rendering (right panel) of tomograms of young or old cells. Nuclei (orange), vacuoles (blue), lipid droplets (yellow), mitochondria (red), ER (magenta), and plasma membrane (green). Scale bars are 500 nm. (C) The relative cell volume occupied by vacuoles increases in old cells. The scatterplot shows volume fractions of nuclei and vacuoles in 14 aged cells and 10 young cells. The volume fraction of the cell section minus the volume fractions of the nucleus and vacuole is used to estimate of the cytosol volume fraction. The values for the example shown in B are boxed. Black lines denote the median. (D) Membrane surface areas of nucleus and vacuole as a fraction of the plasma membrane surface area in young (left) and aged (right) cell sections. Each point represents a single nucleus or the sum of all vacuole surface areas within a single cell. The boxes indicate values from cells in B; linear correlations, R2 values, are indicated. (E) Method to measure the distance between membranes in young and aged cells. Right is a scatter plot of measured distances from represented cells (F) Left is a scatter plot of inter-organelle distances between membrane-bound organelles in young and old cells. The black line demarks the median. Right is a histogram of inter-organelle distance distribution. Values were grouped into 200 nm width bins. n = 305 from 10 young cells, n = 778 from 14 old cells.
-
Figure 4—source data 1
Volume, surface area, and interorganelle distance measurements in young and replicative aged yeast cells.
- https://cdn.elifesciences.org/articles/54707/elife-54707-fig4-data1-v2.xlsx
Figure 4—figure supplement 1
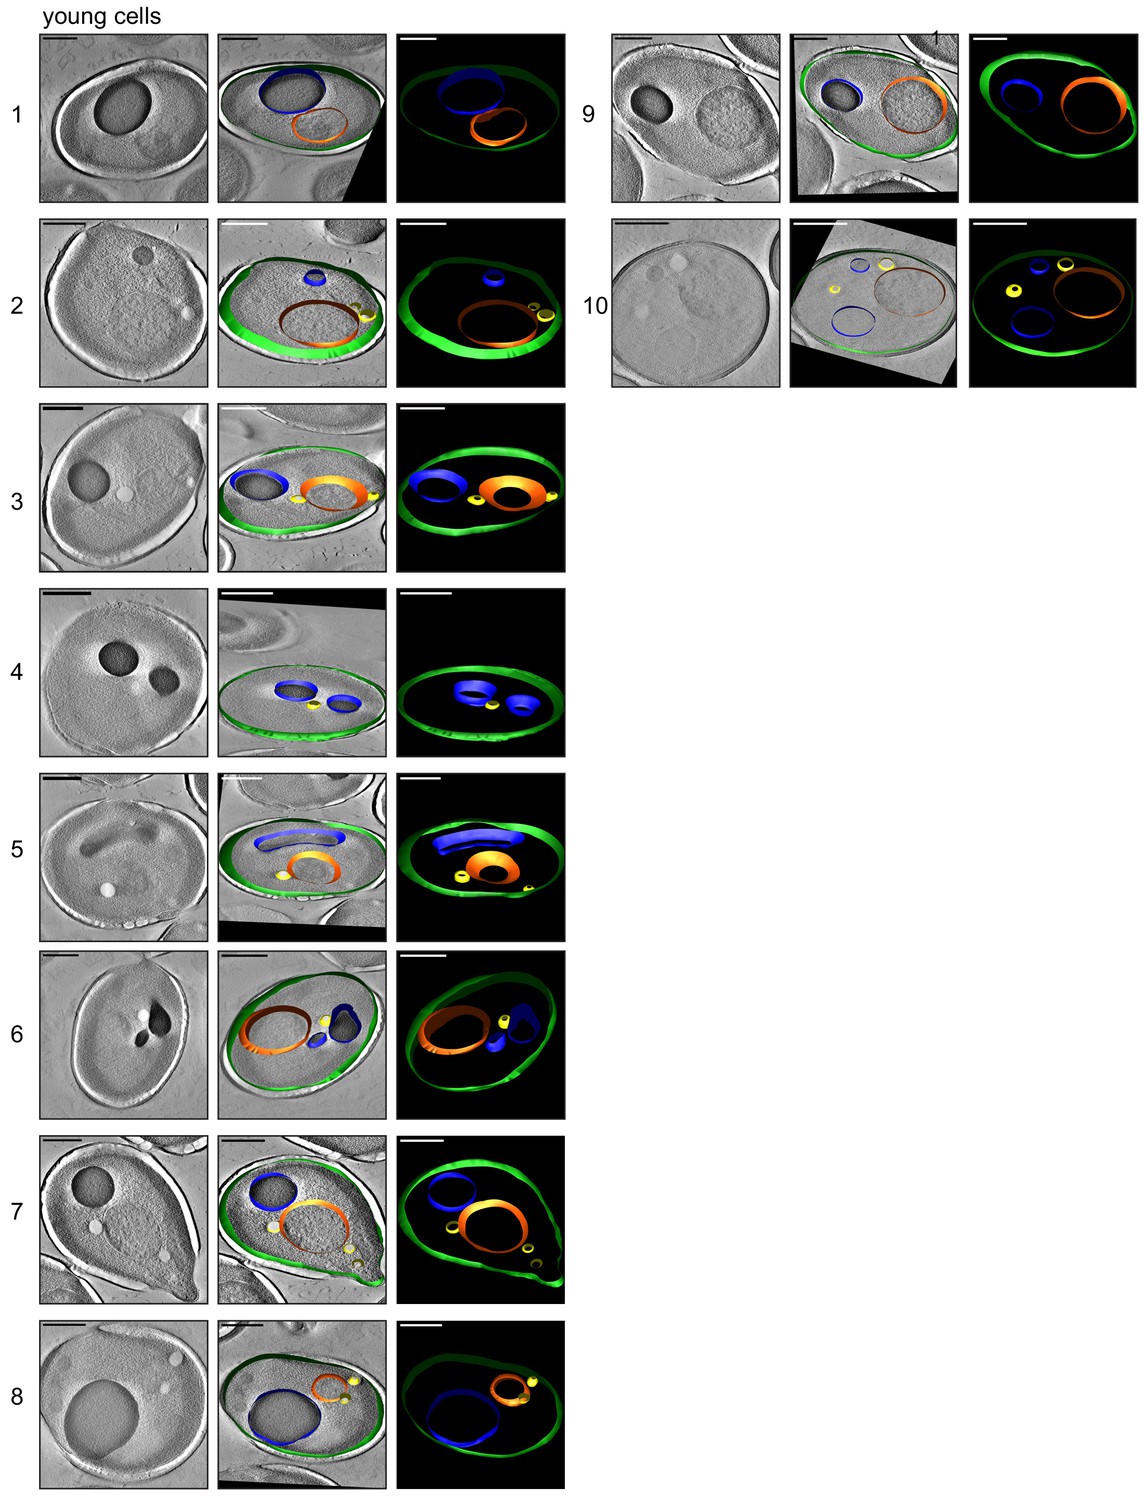
3D isosurface rendering of tomograms of 10 young cells.
The sections show that plasma membrane (green), nucleus (orange), vacuole (blue), lipid droplets (yellow), ER (magenta), and mitochondria (red) can be detected. Scale bars are 1 μm.
Figure 4—figure supplement 2
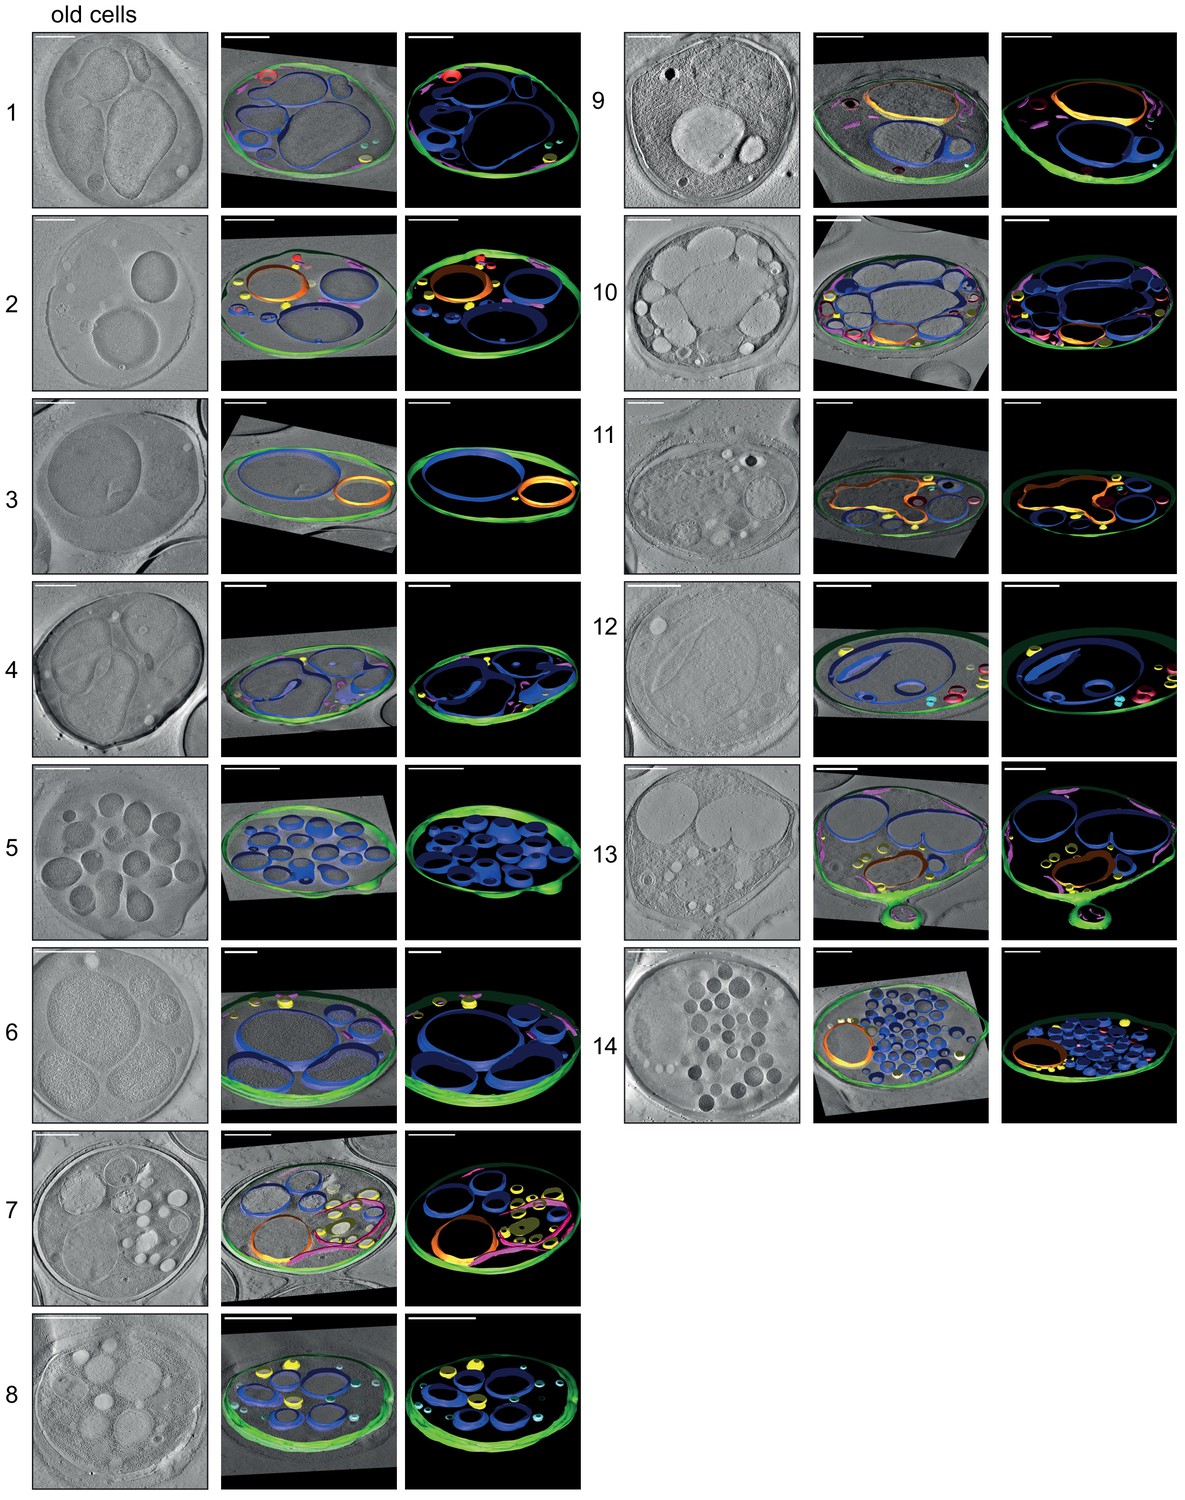
3D isosurface rendering of tomograms of 14 aged cells (~age 13).
The sections show that plasma membrane (green), nucleus (orange), vacuole (blue), lipid droplets (yellow), ER (magenta), and mitochondria (red) can be detected. The aged cells show diverse phenotypes, but in most cells, the organelles, particularly the vacuoles, take up a much more significant fraction of the cell volume than in young cells (see Figure 4—figure supplement 1). Scale bars are 1 μm.
Figure 4—figure supplement 3
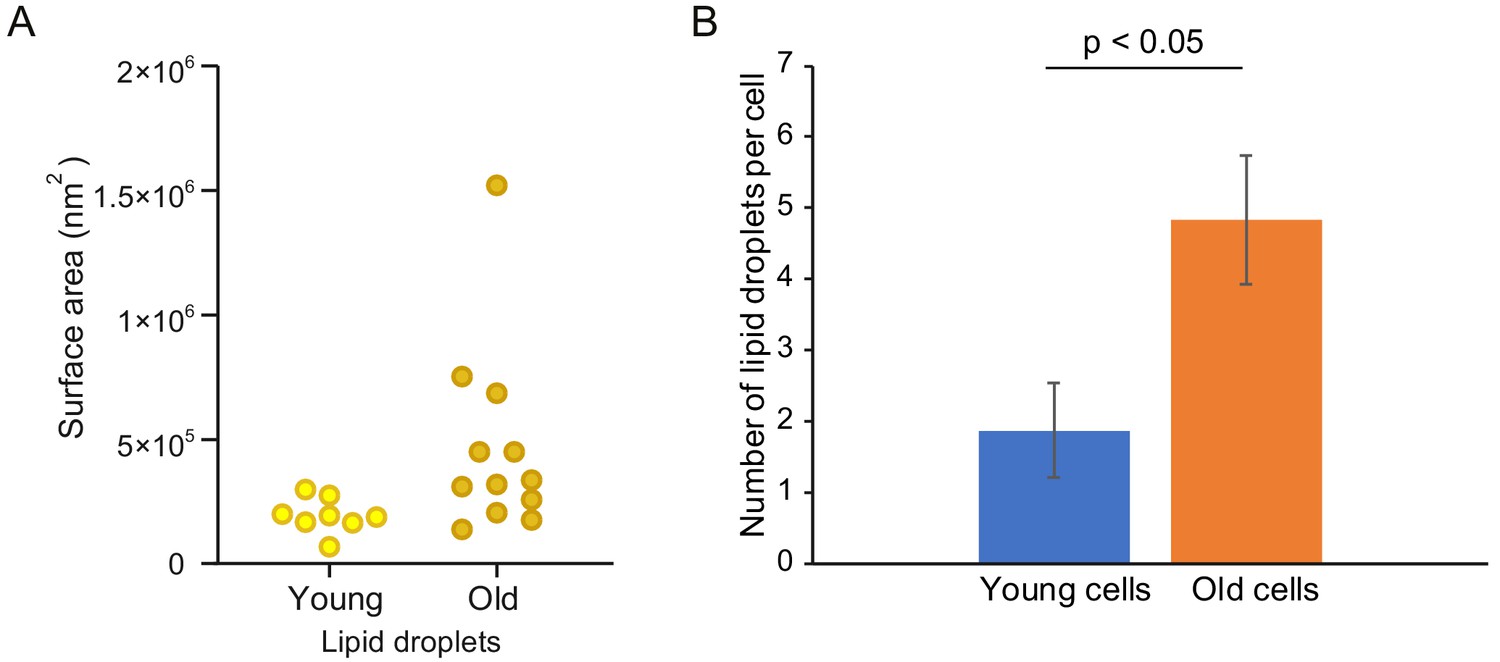
Number and surface area of lipid droplets increase in yeast replicative aging.
Out of the 10 tomograms of young and 14 tomograms of old cells, 8 and 12 cells respectively had visible lipid droplets. (A) Surface area of the lipid droplets in young and old cells, each point reflects one cell. (B) Average number of lipid droplets per cell in the young and old cohort. Error bars display the standard error of the mean, p=0.017521667.
Figure 4—figure supplement 4
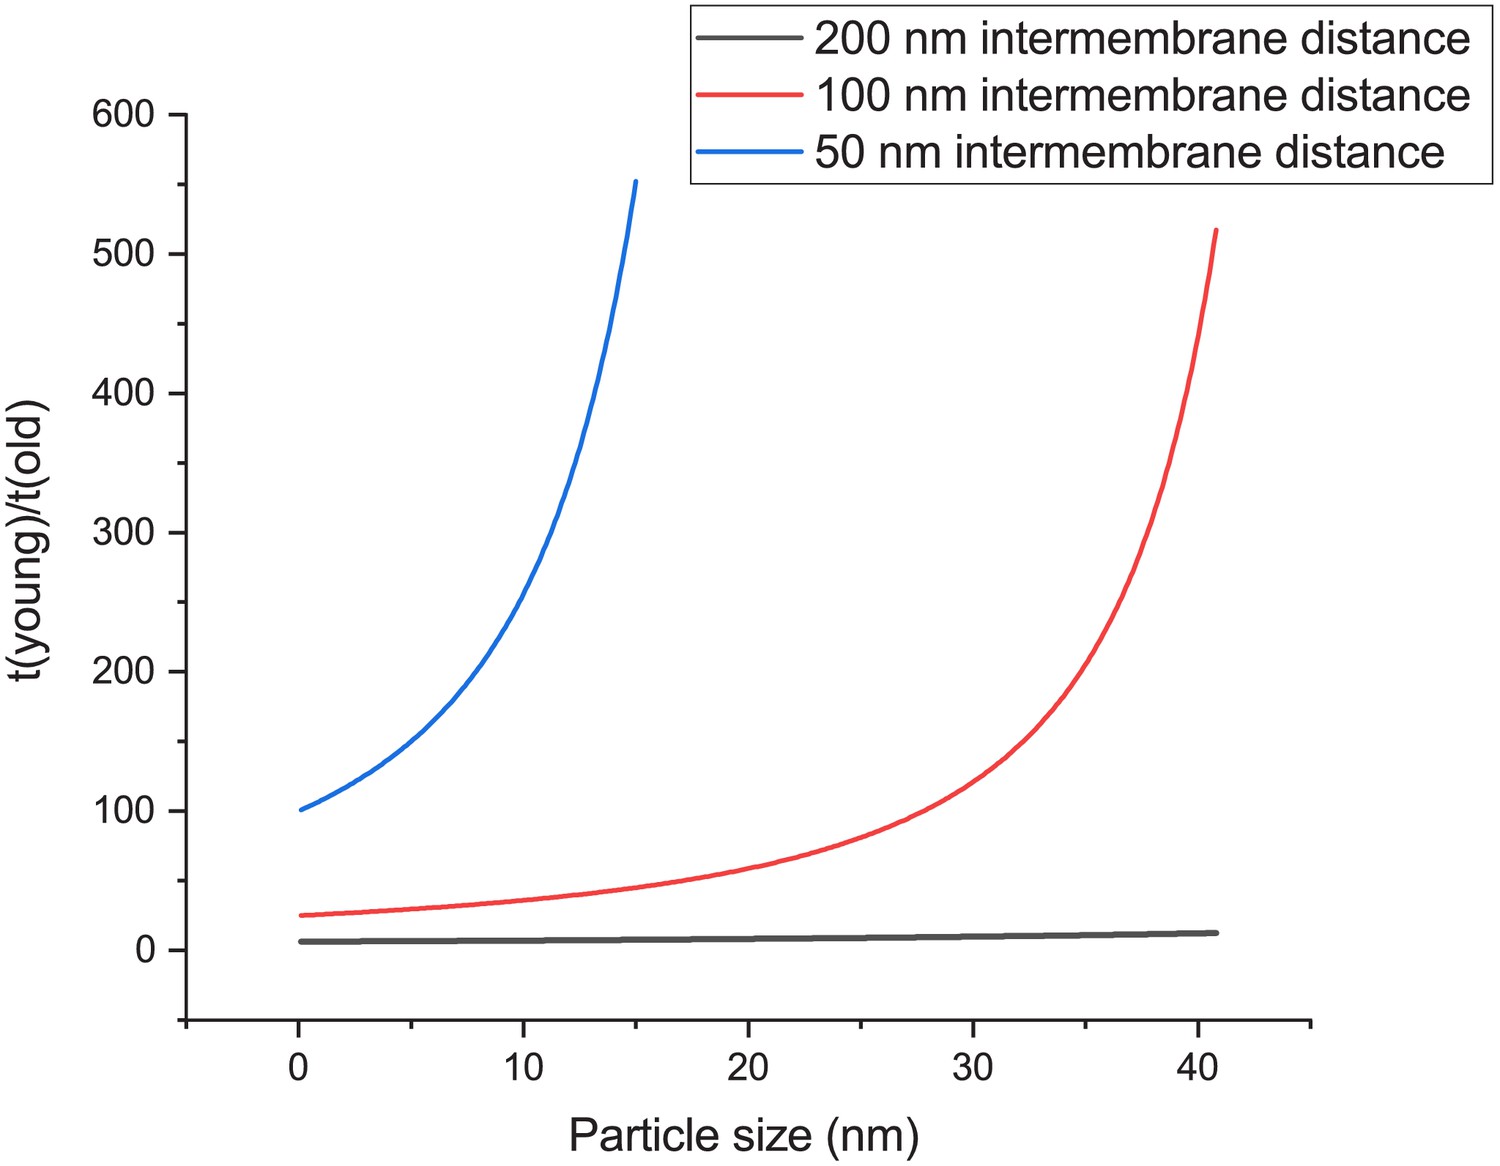
The time to diffuse between two membranes depends strongly on particle-size.
The ratio is independent of the diffusion coefficient, assuming that old and young cells have similar viscosity. The intermembrane distance of young cells is set at 500 nm, and the blue line is at distance of 50 nm, red 100 nm, and grey 200 nm in old cells. 100 nm distances are most frequently observed in aged cells albeit with a wide distribution in distances. Note that in this analysis, a 20 nm particle would already result in 60 times shorter diffusion time to diffuse between two membranes compared to a young cell, while a 40 nm particle results in 440 times shorter diffusion time.
Additional files
-
Supplementary file 1
Strains used in this study.
- https://cdn.elifesciences.org/articles/54707/elife-54707-supp1-v2.docx
-
Supplementary file 2
Primer sequences used in this study.
- https://cdn.elifesciences.org/articles/54707/elife-54707-supp2-v2.docx
-
Supplementary file 3
Comparison between measuring cytoplasmic acidity in aging every 10 hr (Figure 1C,D,F, Figure 1—figure supplement 1) or every hour (Figure 1E, Figure 1—figure supplement 2).
- https://cdn.elifesciences.org/articles/54707/elife-54707-supp3-v2.docx
-
Transparent reporting form
- https://cdn.elifesciences.org/articles/54707/elife-54707-transrepform-v2.docx
Download links
A two-part list of links to download the article, or parts of the article, in various formats.
Downloads (link to download the article as PDF)
Open citations (links to open the citations from this article in various online reference manager services)
Cite this article (links to download the citations from this article in formats compatible with various reference manager tools)
A physicochemical perspective of aging from single-cell analysis of pH, macromolecular and organellar crowding in yeast
eLife 9:e54707.
https://doi.org/10.7554/eLife.54707


