Metabolic response of blood vessels to TNFα
- Division of Systems Biomedicine and Pharmacology, Leiden Academic Centre for Drug Research, Leiden University, Netherlands
- Department of Internal Medicine (Nephrology), Leiden University Medical Center, Netherlands
- Einthoven Laboratory for Vascular and Regenerative Medicine, Leiden University Medical Center, Netherlands
Figures
Figure 1
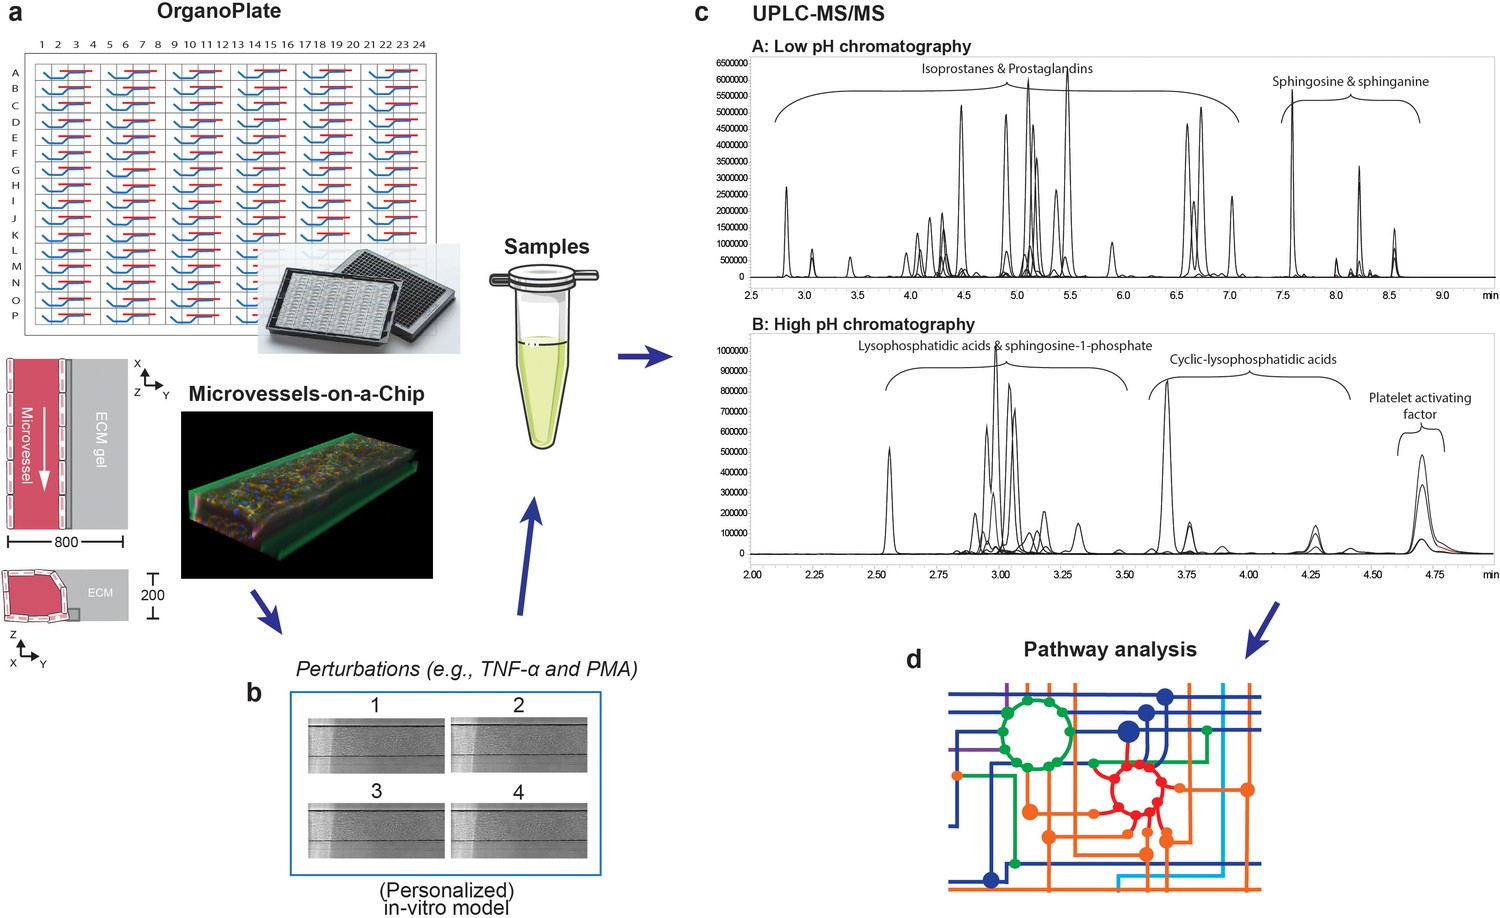
Metabolomics workflow.
(a) Schematic diagram of the OrganoPlate 2-lane design and 3D reconstruction of the microvessels-on-a-chip formed by cultured HUVECs (blue: Hoechst, red: F-actin and green: VE-cadherin). All dimensions are in µm. (b) Collection of culture media after perfusion. The medium of four microvessels were pooled to form one sample. (c) Identification and quantification of prostaglandins, isoprostanes, lysophosphatidic acid (LPA) classes, sphingolipids and platelet activating factor (PAF) in microvessels-on-a-chip by UPLC-MS/MS using two different solvent gradients. (d) Pathway analysis.
Figure 2

Inflammatory and oxidative stress markers in microvessels-on-a-chip.
Reconstructed LC-MS/MS ion chromatograms of PGE2, 5-iPF2α IV, iPF2α and 8, 12-iPF2α IV in microvessels treated with 50 ng/ml TNFα for 18 hr.
Figure 3
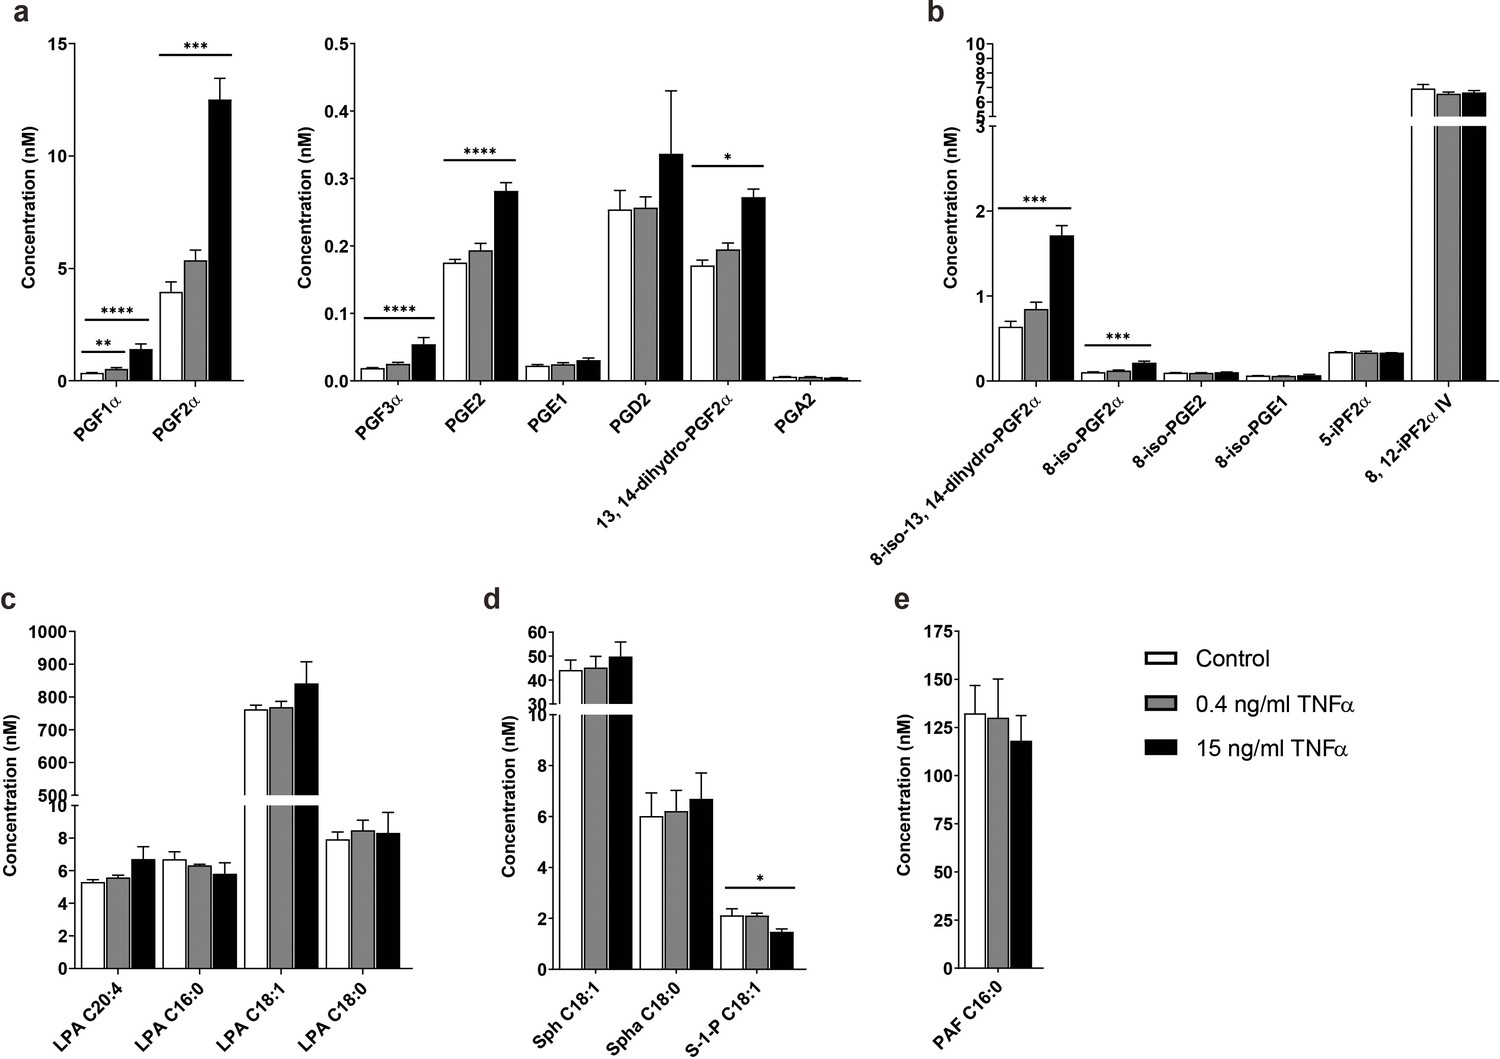
TNFα-induced concentration profile changes of the signaling lipids in the microvessels-on-a-chip.
Concentrations of (a) prostaglandins, (b) isoprostanes, (c) lysophosphatidic acid (LPA) classes, (d) sphingolipids and (e) platelet activating factor (PAF) with available standards detected in the microvessels without TNFα exposure (control) and after exposure to 0.4 and 15 ng/ml TNFα for 18 hr. Data represent mean and s.e.m. of three biological replicates per condition; n = 4–6 technical replicates. Significance determined by unpaired Student’s t-test; *p<0.1, **p<0.05, ***p<0.01, ****p<0.001.
Figure 4
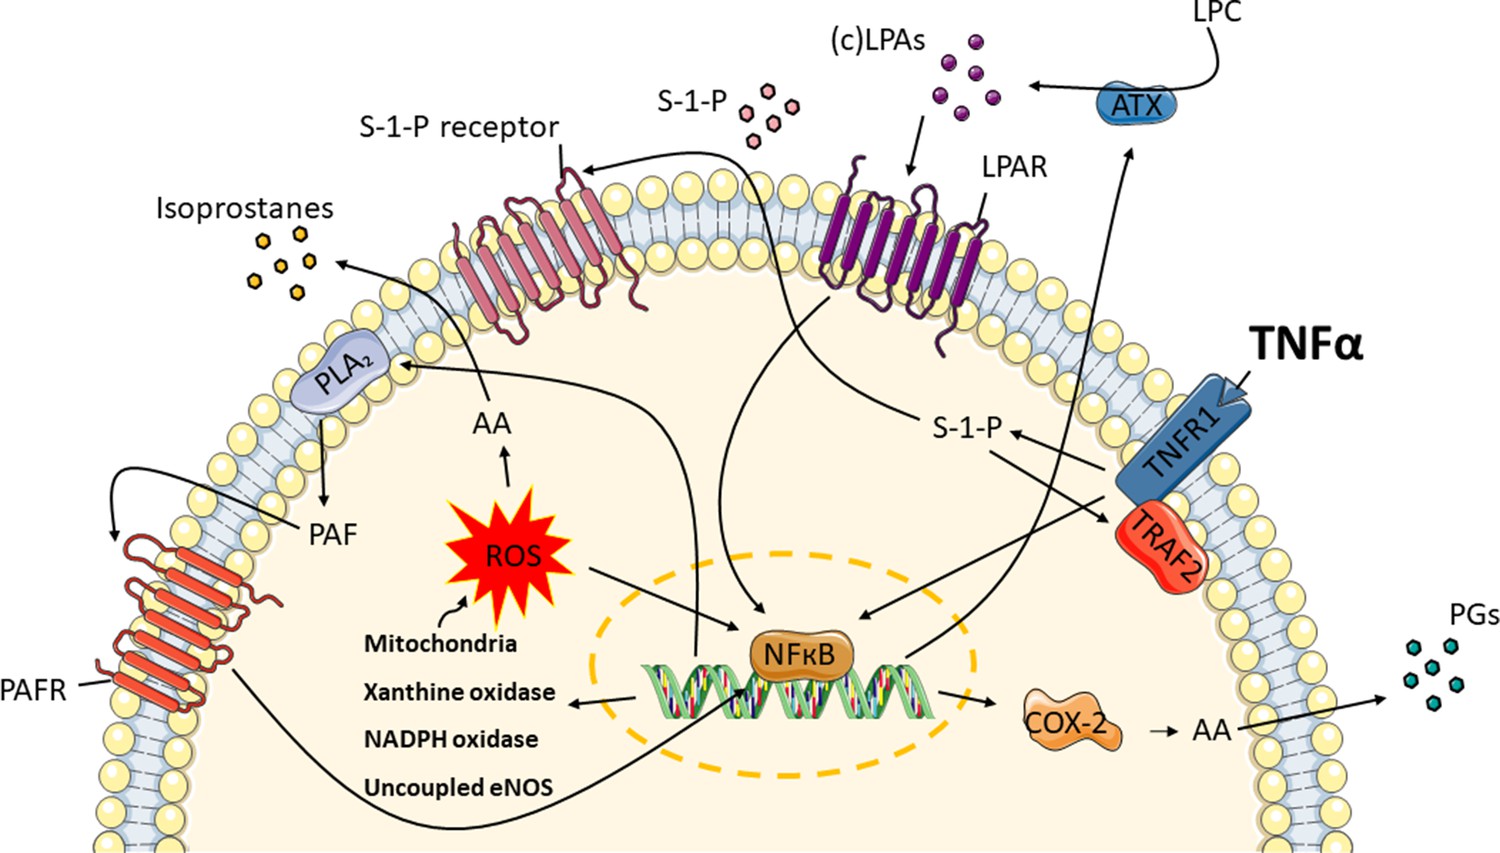
TNFα induces the release of oxidative stress and inflammatory markers in endothelial cells.
Exposure to TNFα, causes TNF signaling in the microvessels to produce ROS from endogenous sources: mitochondria, xanthine oxidase, NADPH oxidase and uncoupled eNOS. Sphingosine-1-phosphate (S-1-P) is needed in order for TNF receptor-associated factor 2 (TRAF2) to form a complex with the TNF receptor 1 (TNFR1). These lead to the conversion of arachidonic acid (AA) to isoprostanes and NFκB activation. Moreover, AA is enzymatically converted by cyclooxygenase-2 (COX-2) to prostaglandins (PGs). At the same time, autotaxin (ATX) and phospholipase A2 (PLA2) are upregulated, resulting in the syntheses of lysophosphatidic acid (LPA) classes and platelet activating factor (PAF). Through their receptors, LPAs and PAF further promote the activation of COX-2.
Figure 5

Expression of platelet endothelial cell adhesion molecule (PECAM-1) and von Willebrand factor (vWF) in isolated human umbilical vein endothelial cells (HUVECs).
Tables
Table 1
The peak area ratio of metabolites in the culture medium (EGM2) normalized with the peak area ratio of metabolites found in the culture medium after perfusion in the microvessels-on-a-chip for 18 hr (EGM2 HUVECs).
The peak area ratio is the peak area of the metabolites divided by the appropriate peak area of the internal standards. Fold changes below the 1 (blue) and above the 1 (red) indicates that low and high concentrations of fatty acids were present in medium before exposure to the microvessels. The data represent one biological replicate; n = 3 technical replicates.
| Bioactive lipid* | EGM2/EGM2 HUVECs | Bioactive lipid* | EGM2/EGM2 HUVECs |
|---|---|---|---|
| PGF2α | 0.1 | LPA C22:5 | 18.2 |
| PGF3α | 2.1 | LPA C16:0 | 21.3 |
| 8-iso-13, 14-dihydro-PGF2α | 0.0 | LPA C18:1 | 48.4 |
| 8-iso-PGF2α | 0.2 | LPA C22:4 | 5.9 |
| 5-iPF2α | 0.4 | cLPA C20:4 | 78.6 |
| 8, 12-iPF2α IV | 0.5 | LPA C18:0 | 0.0 |
| LPA C14:0 | 6.2 | cLPA C18:2 | 0.0 |
| LPA C16:1 | 25.4 | cLPA C16:0 | 14.8 |
| LPA C22:6 | 17.7 | cLPA C18:1 | 25.8 |
| LPA C18:2 | 77.2 | cLPA C18:0 | 11.1 |
| LPA C20:4 | 31.0 | S-1-P C18:1 | 0.9 |
-
* The rest of the metabolites shown in Figure 3 are not displayed, because they were not detected in the EGM2.
-
Table 1—source data 1
Peak area ratios of the identified metabolites in culture medium (EGM2) and in culture medium after perfusion in the microvessels-on-a-chip (EGM2 HUVECs).
- https://cdn.elifesciences.org/articles/54754/elife-54754-table1-data1-v2.xlsx
Table 2
Comparison of the concentration of bioactive lipids between living human blood vessel and human microvessels-on-a- chip.
The concentrations in human blood vessel were obtained from HMDB (Wishart et al., 2018; Wishart et al., 2013; Wishart et al., 2007; Wishart et al., 2009).
| Human blood vessel | Microvessels-on-a-chip | |||
|---|---|---|---|---|
| Bioactive lipid | Healthy | Diseased | Healthy | Diseased |
| PGF1α | ∼0.0317–0.376 nM | - | ∼0.350 nM | ∼0.527–1.412 nM |
| PGF2α | ∼0.144–0.371 nM | ∼0.4–1.6 nM | ∼3.96 nM | ∼5.36–12.5 nM |
| PGE2* | ∼0.13–0.172 nM | - | ∼0.175 nM | ∼0.194–0.281 nM |
| PGE1 | <0.1 nM | - | ∼0.0225 nM | ∼0.0246–0.0308 nM |
| PGD2 | ∼0.065–0.2 nM | - | ∼0.254 nM | ∼0.257–0.336 nM |
| PGA2 | ∼0.0448–0.496 nM | - | ∼0.006 nM | ∼0.0048–0.0058 nM |
| 8-iso-PGF2α | ∼0.057–0.57 nM | - | ∼0.103 nM | ∼0.122–0.216 nM |
| S-1-P C18:1 | ∼0.5–3.0 nM | - | ∼2.12 nM | ∼1.47–2.11 nM |
| Sph C18:1 | ∼1.3–50 nM | - | ∼44.2 nM | ∼45.2–49.8 nM |
| Spha C18:0 | ∼1.3–50 nM | - | ∼6.0 nM | ∼6.2–6.7 nM |
Table 3
Heatmap of prostaglandins, isoprostanes, lysophosphatidic acid (LPA) classes, sphingolipids and platelet activating factor (PAF) detected in the microvessels-on-a-chip.
The fold changes were measured with respect to the controls and log2 transformed. The controls are microvessels unexposed to TNFα and PMA. The metabolites are characterized by their inflammatory action (anti- or pro-inflammatory), platelet activation (anti- or pro-platelet activation), vascular tone (constriction or dilation) and angiogenic action (anti- or pro-angiogenic). The data were obtained from the experiments done in Figure 3 with three biological replicates per condition; n = 4–6 technical replicates.
| Fold change of concentration | ||||||||
|---|---|---|---|---|---|---|---|---|
| Bioactive lipid | 15 ng/ml | 50 ng/ml | 20 ng/ml | Inflammatory | Platelet | Vascular | Angiogenic | |
| TNF | TNF | PMA | action | activation | tone | action | ||
| Prostaglandins | PGF1α | 2.0 | 1.8 | 5.0 | anti | no | con | |
| PGF2α | 1.7 | 1.5 | 5.0 | pro | no | con | pro | |
| PGF3α | 1.5 | 1.1 | 4.4 | anti | ||||
| PGE2* | 0.7 | 0.7 | .7 | pro | anti | dil | pro | |
| PGE1 | 0.5 | 0.4 | 2.7 | anti | anti | dil | pro | |
| PGD2 | 0.4 | 3.4 | 3.5 | anti | anti | con | anti | |
| 13, 14-dihydro-PGF2α | 0.7 | 0.5 | 2.3 | pro | ||||
| PGA2 | −0.3 | 0.0 | 2.6 | anti | no | |||
| Isoprostanes | 8-iso-13, 14-dihydro-PGF2α | 1.4 | 1.3 | 4.6 | anti | |||
| 8-iso-PGF2α* | 1.1 | 0.9 | 4.2 | pro | anti | con | anti | |
| 8-iso-PGE2 | 0.1 | 0.0 | 2.1 | pro | anti | con | anti | |
| 8-iso-PGE1 | 0.1 | 0.0 | 0.7 | anti | con | anti | ||
| 5-iPF2α | 0.0 | 0.0 | 0.0 | |||||
| 8, 12-iPF2α IV | −0.1 | 0.0 | 0.2 | |||||
| Lysophosphatidic acids | LPA C14:0 | −0.2 | −0.2 | −0.4 | pro | pro | con | pro |
| LPA C16:1 | −0.4 | −0.3 | −0.6 | pro | pro | con | pro | |
| LPA C22:6* | 0.4 | 0.5 | 0.2 | pro | pro | con | pro | |
| LPA C18:2 | 0.1 | 0.0 | −0.1 | pro | pro | con | pro | |
| LPA C20:4 | 0.3 | 0.4 | 0.3 | pro | pro | con | pro | |
| LPA C22:5* | 0.5 | 0.6 | 0.3 | pro | pro | con | pro | |
| LPA C16:0 | −0.2 | −0.3 | −0.3 | pro | pro | con | pro | |
| LPA C18:1 | 0.1 | 0.2 | −0.1 | pro | pro | con | pro | |
| cLPA C20:4 | −0.1 | −0.2 | −0.1 | anti | anti | no | ||
| LPA C18:0 | 0.1 | 0.0 | −0.2 | pro | pro | con | pro | |
| cLPA C16:0 | −0.2 | 0.0 | 0.0 | anti | anti | no | ||
| cLPA C18:0 | −0.2 | −0.1 | −0.2 | anti | anti | no | ||
| Sphingolipids | S-1-P C18:1 | −0.5 | −0.6 | −0.9 | anti | anti | con | pro |
| Sph C18:1 | 0.2 | 0.1 | 0.0 | anti | anti | con | pro | |
| Spha C18:0 | 0.2 | 0.0 | −0.1 | |||||
| PAF C16:0 | −0.2 | −0.2 | −0.4 | pro | pro | con | pro | |
-
* Validated markers of oxidative stress.
-
Table 3—source data 1
Concentrations of the identified metabolites in the microvessels-on-a-chip.
- https://cdn.elifesciences.org/articles/54754/elife-54754-table3-data1-v2.xlsx
Table 4
Heatmap of pro- and anti- inflammatory and oxidative stress markers measured in 3D microvessels-on-a-chip and 2D endothelial cell monolayers.
The cells were treated with 15 ng/ml TNFα in the same experiment as Figure 3. The fold changes were measured with respect to the controls and log2 transformed. The controls are microvessels unexposed to TNFα and PMA. The metabolites are characterized by their inflammatory action (anti- or pro-inflammatory), platelet activation (anti- or pro-platelet activation), vascular tone (constriction or dilation) and angiogenic action (anti- or pro-angiogenic). The data represent one biological replicate; n = 2–3 technical replicates.
| Fold change of | ||||||
|---|---|---|---|---|---|---|
| Concentration | ||||||
| Bioactive lipid | 2D | 3D | Inflammatory | Platelet | Vascular | Angiogenic |
| TNF | TNF | action | activation | tone | action | |
| PGF1α | 1.9 | 3.4 | anti | no | con | |
| PGF3α | 1.0 | 6.6 | anti | |||
| PGE1 | 2.1 | 1.9 | anti | anti | dil | pro |
| PGD2 | 2.3 | 6.5 | anti | anti | con | anti |
| PGA2 | 0.7 | 0.0 | anti | no | ||
| cLPA C20:4 | −0.7 | −0.5 | anti | anti | no | |
| cLPA C18:2 | −0.5 | 0.0 | anti | anti | no | |
| cLPA C16:0 | −0.6 | −0.3 | anti | anti | no | |
| cLPA C18:1 | −0.9 | −0.2 | anti | anti | no | |
| cLPA C18:0 | −0.6 | −0.2 | anti | anti | no | |
| S-1-P C18:1 | −2.0 | −0.9 | anti | anti | con | pro |
| 8-iso-PGE1 | 1.8 | 1.9 | anti | con | anti | |
| 5-iPF2α | 0.3 | −0.1 | ||||
| PGF2α | 1.9 | 2.2 | pro | no | con | pro |
| PGE2* | 2.4 | 1.0 | pro | anti | dil | pro |
| 13, 14-dihydro-PGF2α | 0.9 | 1.1 | pro | |||
| 8-iso-13, 14-dihydro-PGF2α | 1.9 | 1.9 | anti | |||
| 8-iso-PGF2α* | 2.0 | 1.3 | pro | anti | con | anti |
| 8-iso-PGE2 | 0.6 | −0.3 | pro | anti | con | anti |
| LPA C14:0 | 0.0 | −0.8 | pro | pro | con | pro |
| LPA C16:1 | −1.0 | −1.0 | pro | pro | con | pro |
| LPA C22:6* | 0.0 | −0.3 | pro | pro | con | pro |
| LPA C18:2 | −1.0 | −1.2 | pro | pro | con | pro |
| LPA C20:4 | −0.2 | −0.4 | pro | pro | con | pro |
| LPA C22:5* | 1.0 | −0.1 | pro | pro | con | pro |
| LPA C16:0 | −0.6 | −0.6 | pro | pro | con | pro |
| LPA C18:1 | −0.5 | −1.0 | pro | pro | con | pro |
| LPA C18:0 | 0.1 | −0.9 | pro | pro | con | pro |
| PAF C16:0 | −0.5 | −0.8 | pro | pro | con | pro |
-
* Validated markers of oxidative stress.
-
Table 4—source data 1
Peak area ratios of the identified metabolites in 6-well plates and in the microvessels-on-a-chip.
- https://cdn.elifesciences.org/articles/54754/elife-54754-table4-data1-v2.xlsx
Key resources table
| Reagent type (species) or resource | Designation | Source or reference | Identifiers | Additional information |
|---|---|---|---|---|
| Biological sample (Human) | primary human umbilical vein endothelial cells | Leiden University Medical Center (LUMC) | freshly isolated from umbilical cord of male newborns | |
| Chemical compound, drug | phorbol 12-myristate 13-acetate | Sigma-Aldrich | Cat#:P8139 | |
| Peptide, recombinant protein | tumor necrosis factor-α | Sigma-Aldrich | Cat#:H8916 | |
| Biological sample (Rat) | rat tail collagen type 1 | Trevigen | Cat#:3440-005-01 | |
| Antibody | mouse anti-human CD144 | BD Biosciences | Cat#:555661; RRID:AB_396015 | IF(1:150) |
| Antibody | sheep anti-human CD31 | R and D Systems | Cat#:AF806; RRID:AB_355617 | IF(1:150) |
| Antibody | rabbit anti-human vWF | Agilent Dako | Cat#:A0082; RRID:AB_2315602 | IF(1:1000) |
| Antibody | alexa fluor 488-conjugated goat anti-mouse | ThermoFisher | Cat#:R37120; RRID:AB_2556548 | IF(1:250) |
| Antibody | alexa fluor 488-conjugated donkey anti-sheep | ThermoFisher | Cat#:A11015; RRID:AB_141362 | IF(1:250) |
| Antibody | alexa fluor 647-conjugated goat anti-rabbit | ThermoFisher | Cat#:A27040; RRID:AB_2536101 | IF(1:250) |
| Other | rhodamine phalloidin | Sigma-Aldrich | Cat#:P1951; RRID:AB_2315148 | IF(1:200) |
| Other | hoechst | Invitrogen | Cat#:H3569; RRID:AB_2651133 | IF(1:2000) |
| Software, algorithm | LabSolutions | Shimadzu | RRID:SCR_018241 | |
| Software, algorithm | SPSS | SPSS | RRID:SCR_002865 | |
| Software, algorithm | GraphPad Prism | GraphPad | RRID:SCR_002798 |
Additional files
-
Source data 1
Calibration curve of bioactive lipids.
- https://cdn.elifesciences.org/articles/54754/elife-54754-data1-v2.xlsx
-
Supplementary file 1
References regarding the action of bioactive lipids on inflammation, platelets, vascular tone and angiogenesis.
- https://cdn.elifesciences.org/articles/54754/elife-54754-supp1-v2.docx
-
Supplementary file 2
An overview of the concentrations of the calibration solution.
- https://cdn.elifesciences.org/articles/54754/elife-54754-supp2-v2.docx
-
Transparent reporting form
- https://cdn.elifesciences.org/articles/54754/elife-54754-transrepform-v2.docx
Download links
A two-part list of links to download the article, or parts of the article, in various formats.
Downloads (link to download the article as PDF)
Open citations (links to open the citations from this article in various online reference manager services)
Cite this article (links to download the citations from this article in formats compatible with various reference manager tools)
Metabolic response of blood vessels to TNFα
eLife 9:e54754.
https://doi.org/10.7554/eLife.54754


