Global phenotypic profiling identifies a conserved actinobacterial cofactor for a bifunctional PBP-type cell wall synthase
- Department of Microbiology, Harvard Medical School, United States
- Howard Hughes Medical Institute, United States
Figures
Figure 1 with 1 supplement

Phenotypic profiling of a Corynebacterium glutamicum transposon mutant library.
(A) Overview of the phenotypic profiling procedure. A transposon mutagenized library of Cglu MB001 was exposed to sub-MIC concentrations of the indicated antibiotics or to the listed stress condition for 11 generations prior to transposon sequencing analysis and the calculation of fitness scores for mutants in each gene under each condition. Several of the antibiotics were tested at two different concentrations such that a total of 40 different growth conditions were surveyed (see Supplementary file 1). (B) Scatterplot highlighting the reproducibility of the analysis for duplicate samples grown in the absence of drug. The calculated fitness scores for each gene in the two replicates are plotted. Scores were calculated by comparing the proportion of total transposon reads for each gene in the untreated samples grown for 11 generations relative to the reads mapped for the input library. (C) Pie chart summarizing results from the profiling analysis. Depicted are essential genes (453, gray), genes that displayed a strong phenotype (fitness value below 0.75 or above 1.25) in at least one condition (465, dark blue), genes that displayed a moderate phenotype (fitness value below 0.9 or above 1.1) in at least one condition (484, light blue) and genes that did not show a phenotype in any condition tested (1535, black).
Figure 1—figure supplement 1
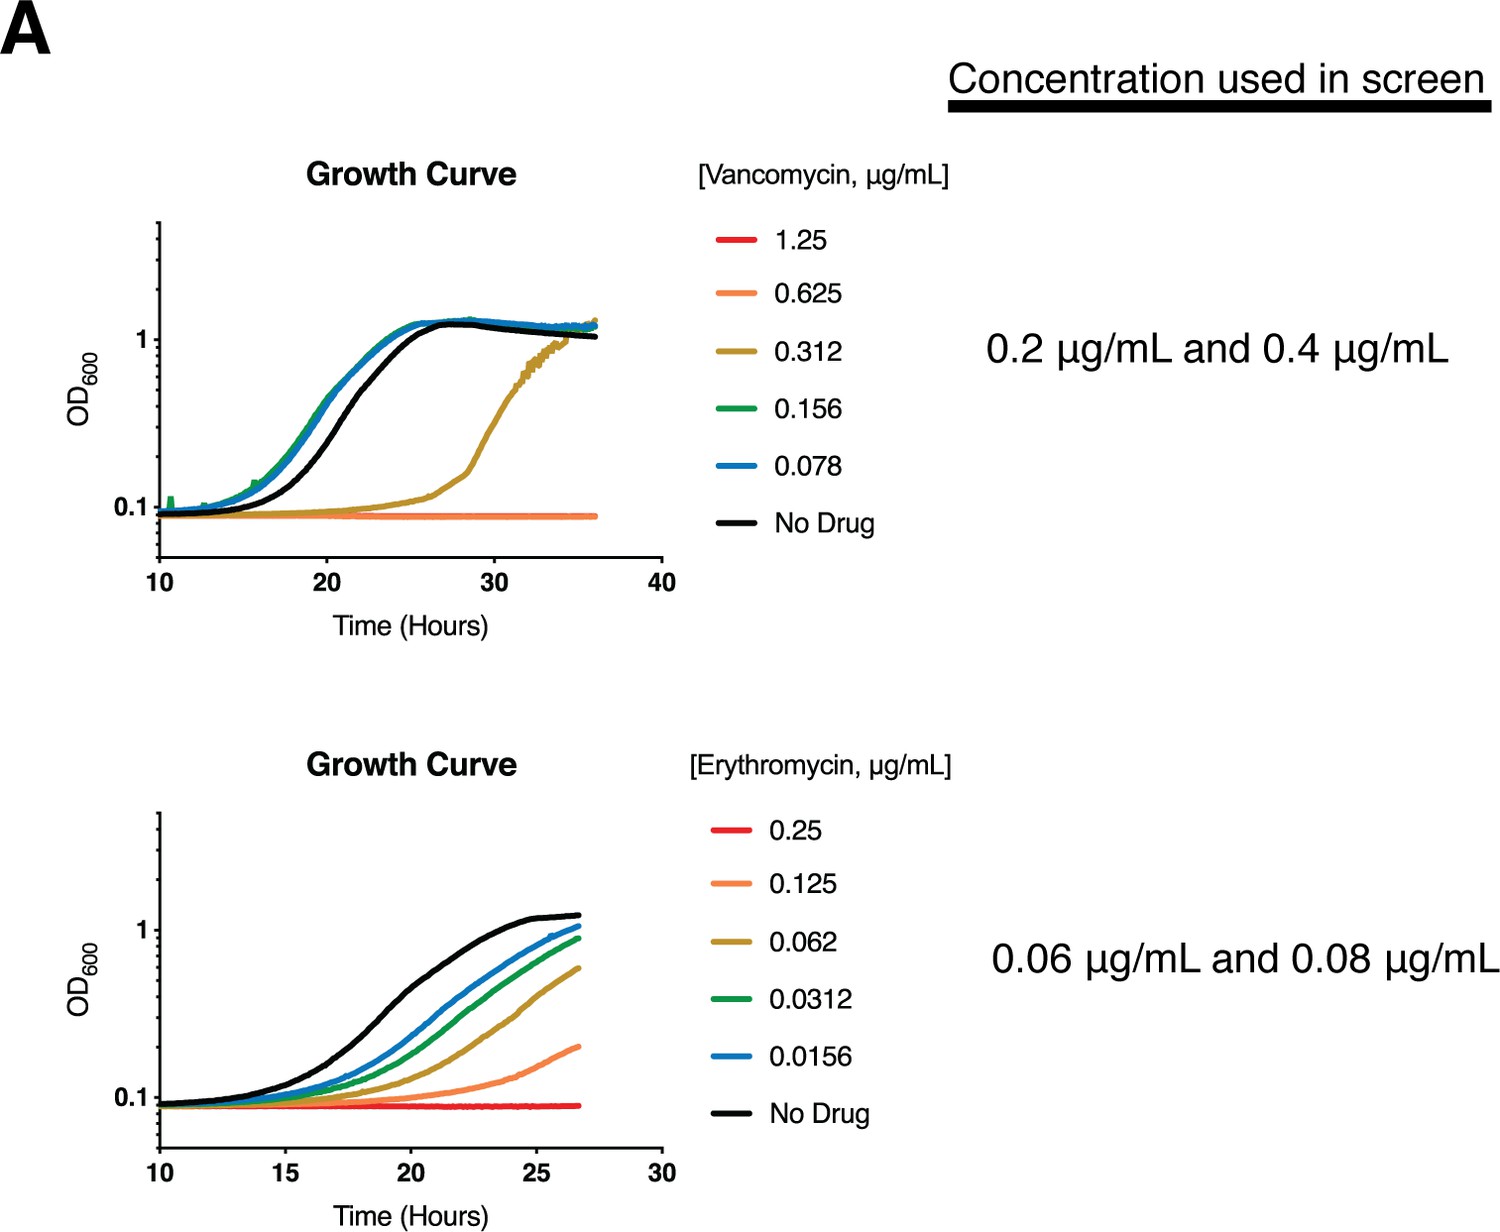
Example growth curves for Cglu treated with selected drugs.
(A) Cultures of wild-type Cglu were grown for 24–36 hr from a starting OD600 of 2.5 × 10⁻⁶ in BHI with the addition of the indicated concentration of drug. The culture OD600 was measured every 5 min using a Molecular Devices VersaMax Microplate Reader.
Figure 2 with 1 supplement
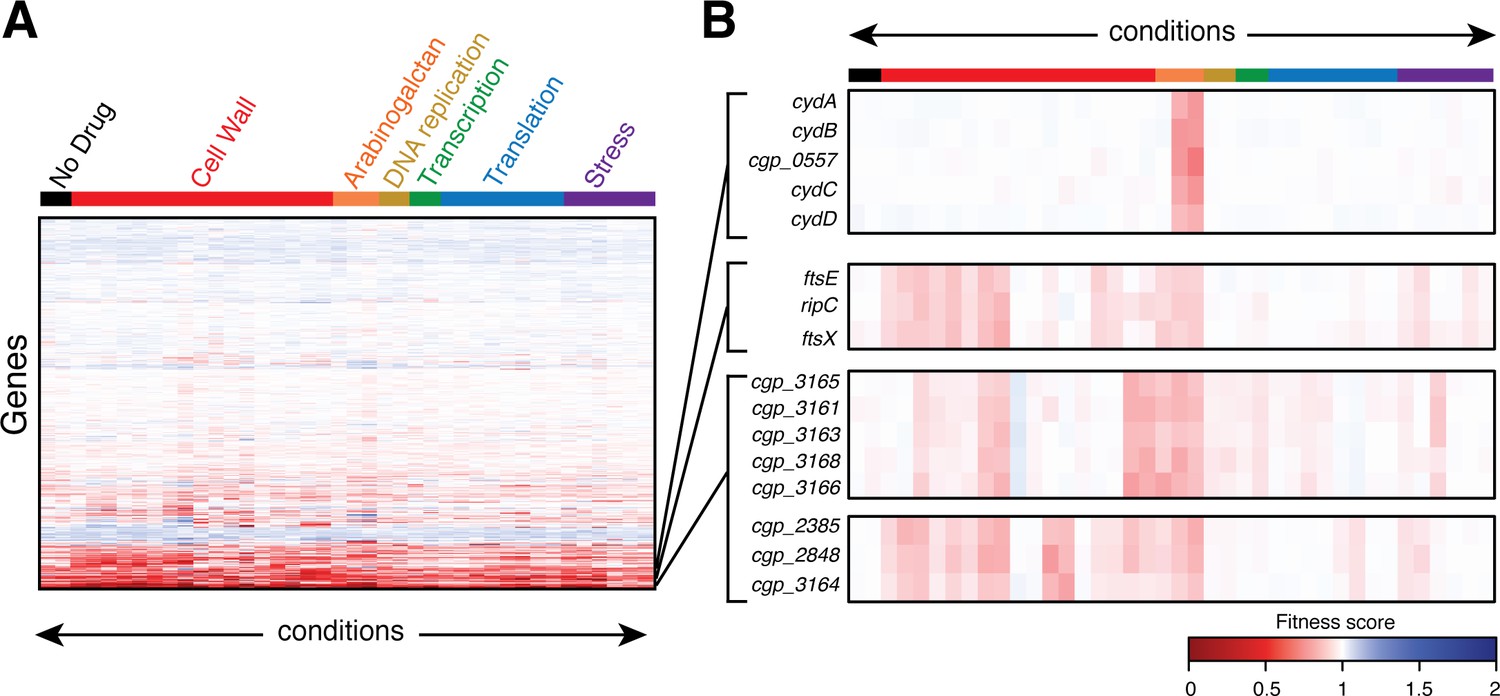
Clustering analysis of phenotypic profiles identifies genes with related functions.
(A) Heatmap showing clustered phenotypic profiles for all non-essential genes in Cglu. The test conditions are oriented along the abscissa and are ordered by the stress or the physiological process affected by antibiotic treatment. The 2488 non-essential genes (excluding tRNAs, rRNAs, and transposons) are clustered along the ordinate with neighboring genes sharing similar fitness profiles across all conditions. The intensity of the red color indicates the magnitude of the fitness defect (dark red has a fitness value close to 0), white indicates a fitness value of 1, and blue color indicates a fitness advantages in a given condition. The full dataset is available in Figure 2—source data 1. (B) Expanded view of the profiles for select genes. See text for details.
-
Figure 2—source data 1
Phenotypic profiling results.
The gene fitness for each gene under each growth condition is listed.
- https://cdn.elifesciences.org/articles/54761/elife-54761-fig2-data1-v2.xlsx
Figure 2—figure supplement 1
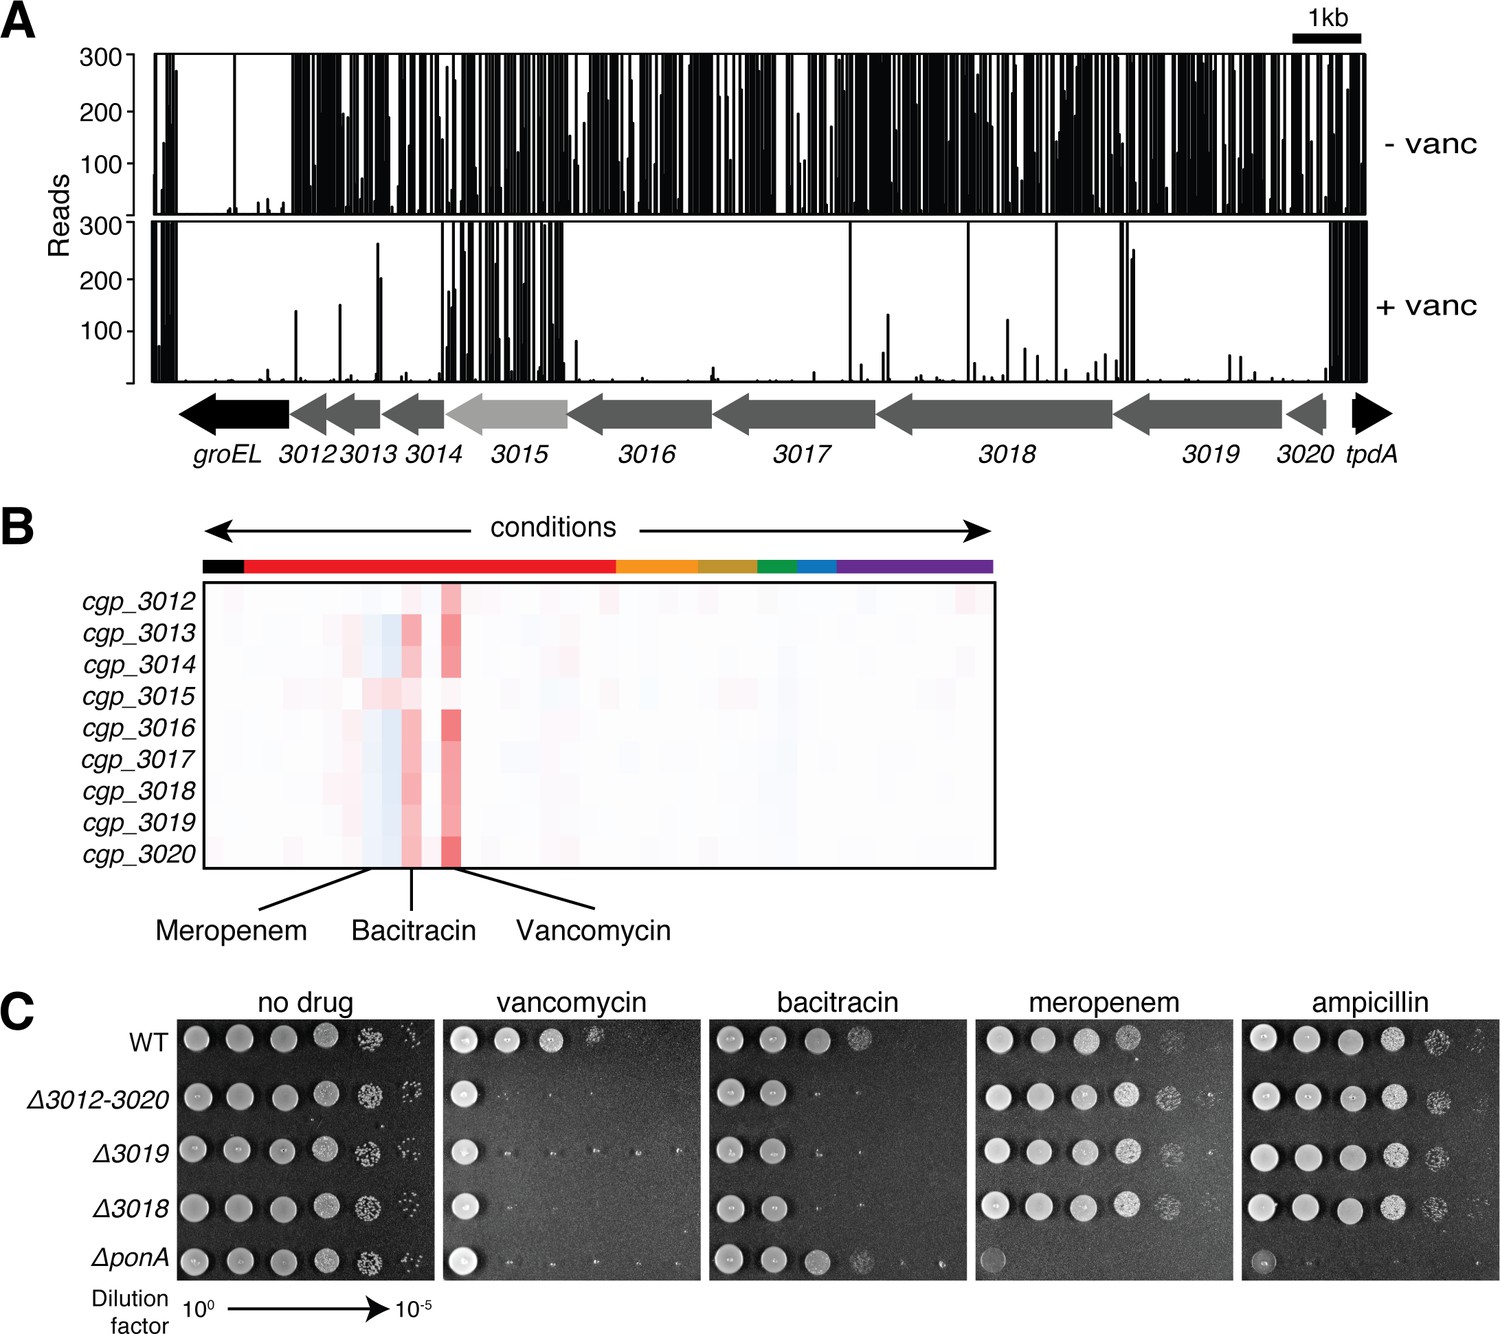
A genetic locus with a potential role in undecaprenol biogenesis or utilization.
(A) Shown is the transposon insertion profile for the cgp_3012–3020 genomic locus for untreated (top, -vanc) and vancomycin-treated (+vanc, 0.4 µg/ml, bottom) samples. (B) Phenotypic profiles for all genes in the cgp_3012–3020 locus displayed as in Figure 2. (C) Cultures of wild-type Cglu and the indicated deletion mutants were normalized to an OD600 of 0.5 and serially diluted. An aliquot (5 µl) of each dilution was spotted onto BHI agar medium supplemented with drug as indicated. Drug concentrations used were 0.3 μg/mL vancomycin, 0.07 μg/mL bacitracin, 0.06 μg/mL meropenem and 0.2 μg/mL ampicillin. Plates were incubated for 24 hr at 30°C and photographed.
Figure 3 with 1 supplement
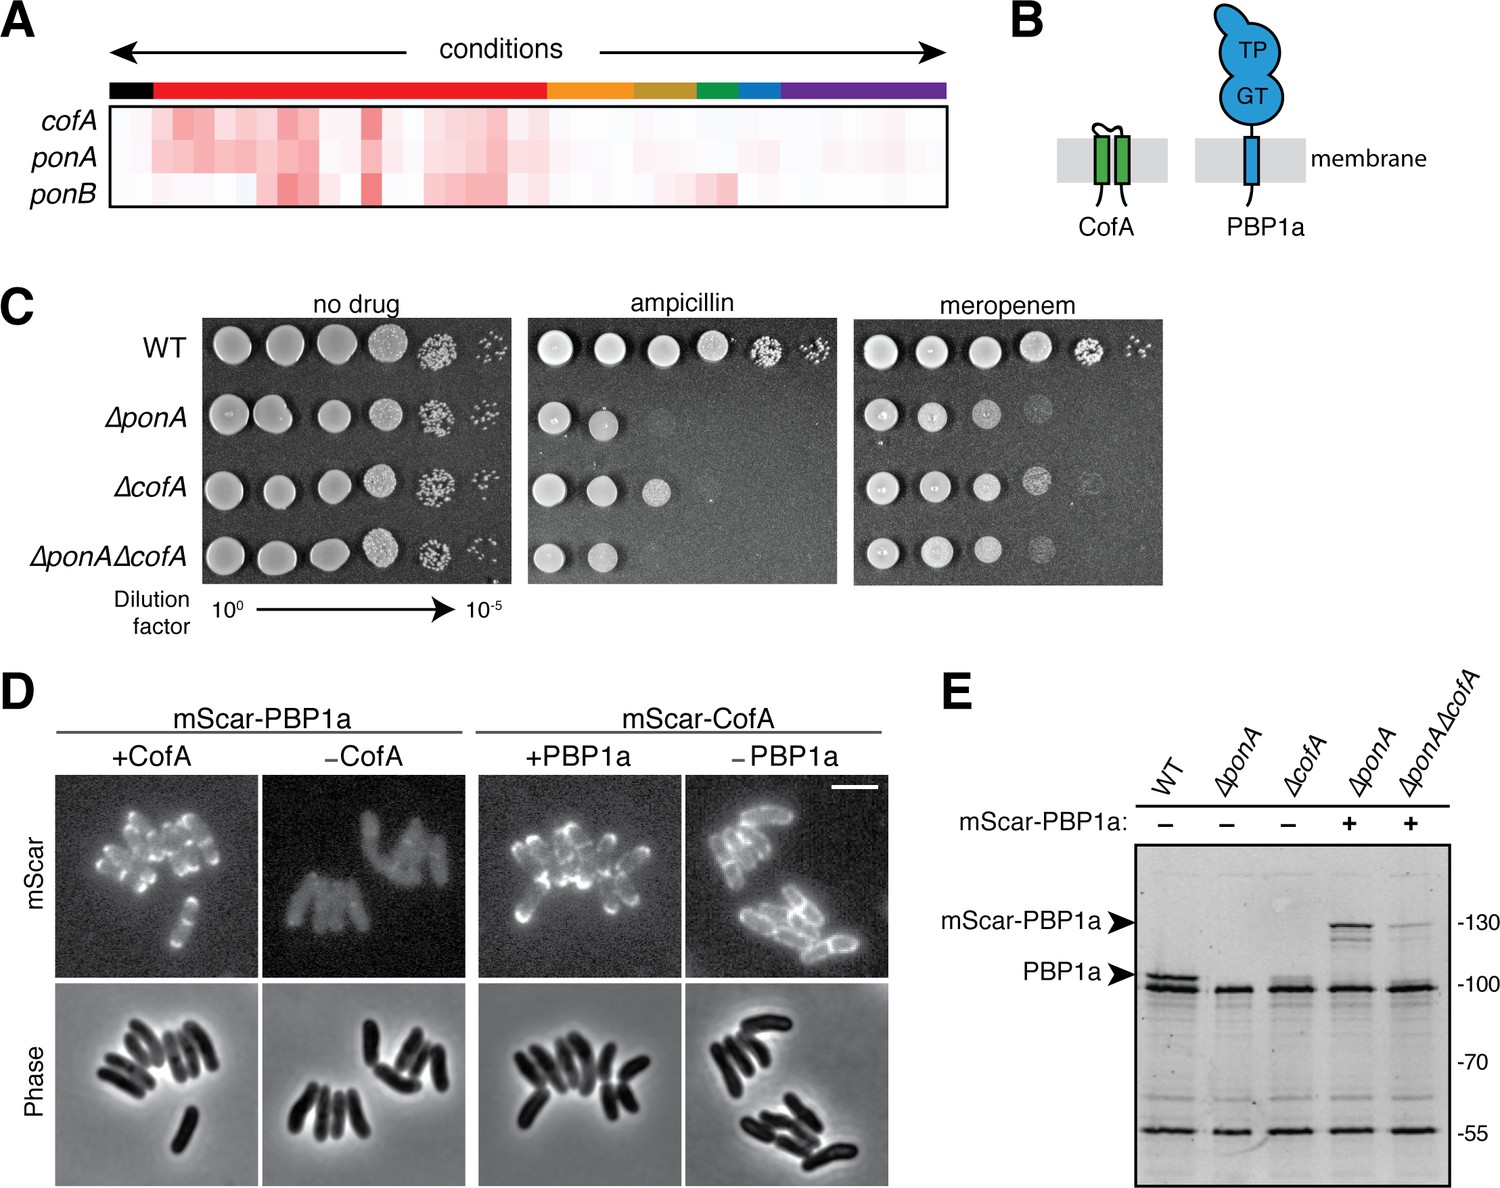
CofA is required for PBP1a accumulation.
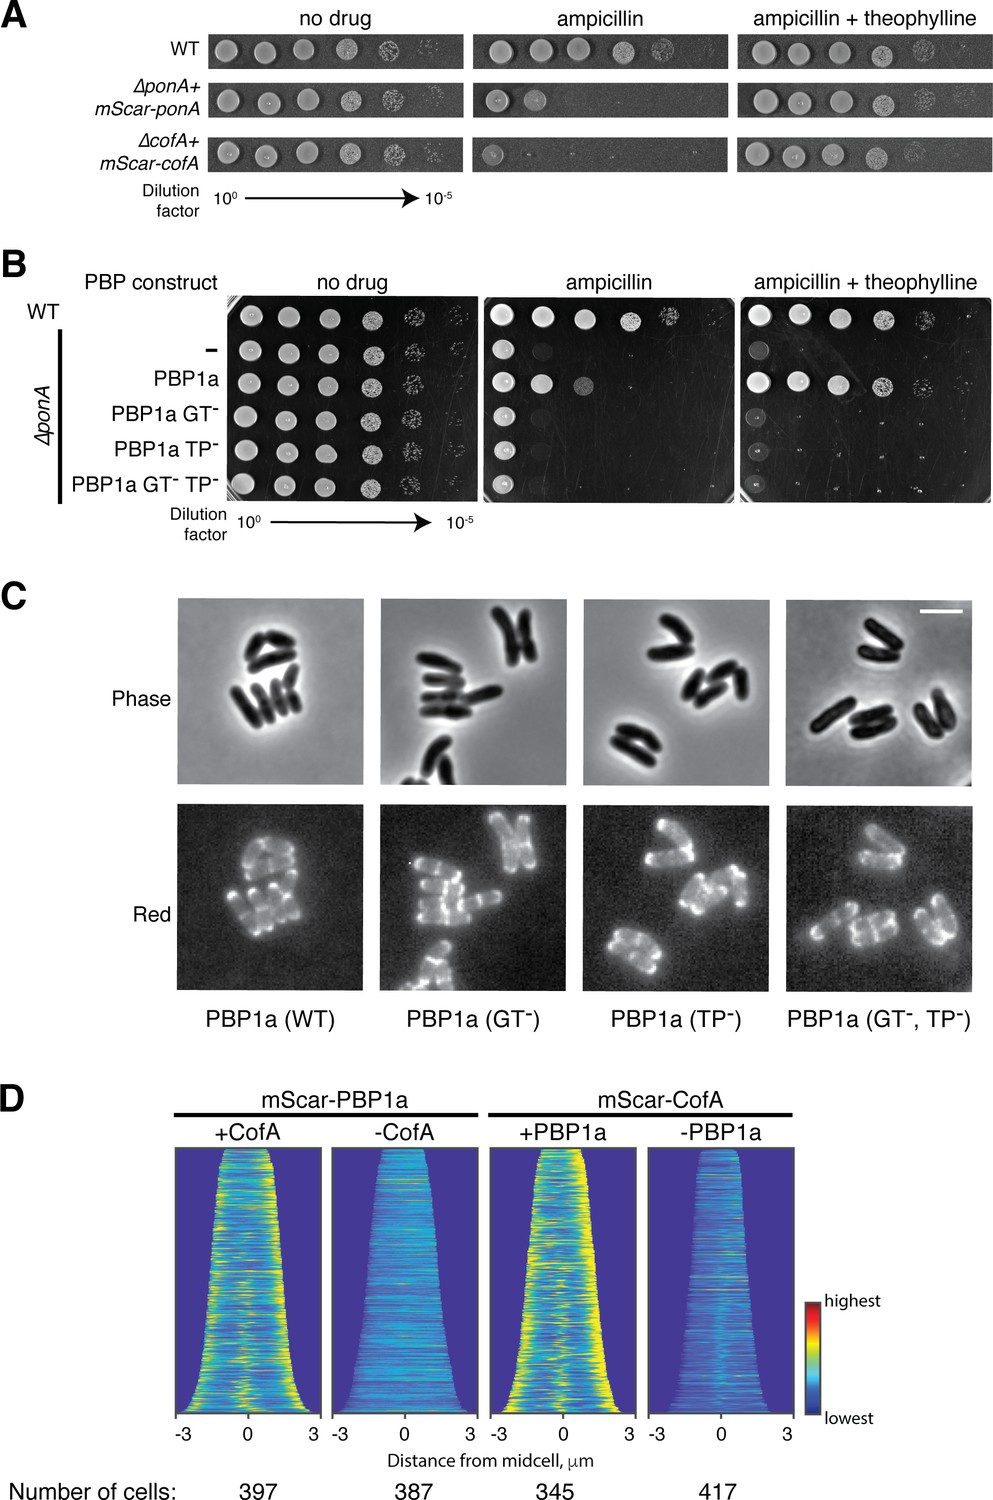
(A) Phenotypic profiles of cofA (cgp_0016), ponA (cgp_0336, encoding PBP1a), and ponB (cgp_3313, encoding PBP1b) displayed as in Figure 2. Note that cofA and ponA clustered tightly together in the analysis due to their similar profiles. Neither gene clustered near ponB, which is shown for reference. (B) Schematic showing the predicted membrane topology of CofA and PBP1a. (C) Cultures of wild-type Cglu and the indicated deletion mutants were grown, serially diluted, and plated as in Figure 2—figure supplement 1. The concentration of drugs used was 0.2 μg/mL ampicillin or 0.04 μg/mL meropenem as indicated. (D) Shown are mScarlet fluorescence (upper) and phase contrast (lower) micrographs of cells expressing the indicated fusion protein. Fusions were constitutively expressed from a construct integrated at the attB1 site. Translation of the fusions was controlled by the theophylline (riboE1) riboswitch and was induced with 0.3 mM theophylline in each case. The fusions were produced in strains deleted for the corresponding native untagged protein. Cells from an overnight culture were diluted 1:1000 in BHI supplemented with 0.3 mM theophylline and then imaged on CGX2 agarose pads after growth for 5.5 hr at 30°C. The brightness for the two mScar-PBP1a micrographs is normalized to allow for direct comparison. Bar equals 3 µm. (E) Bocillin labeling of PBPs in wild-type and mutant strains. Overnight cultures of the indicated strains were diluted 1:200 in BHI and grown until they reached an OD600 = 0.3. Cells were then treated with 10 μg/mL Bocillin-FL, and membrane fractions were isolated. Proteins (5 µg total) were then separated on a 10% SDS-PAGE gel and labeled bands were visualized using a Typhoon florescence scanner. Production of the mScar-PBP1a fusions was induced with 0.3 mM theophylline as for the microscopy analysis in panel D. Fluorescent band intensities for labeled PBP1a or mScar-PBP1a were quantified and normalized to the PBP2a band signal running just above 55 kDa. The PBP1a or mScar-PBP1a signal decreased by a factor of 5 in ΔcofA cells relative to the corresponding CofA+ strain.
Figure 3—figure supplement 1
Functionality of mScar fusion proteins and localization of catalytically defective PBP1a variants.
(A) Cultures of wild-type, ΔponA, and ΔcofA strains harboring the indicated mScar fusion under theophylline-inducible control were grown and plated as in Figure 3. The concentration of agar supplements was 0.2 μg/mL ampicillin and 0.3 mM theophylline as indicated. (B) Cultures of ΔponA strains harboring the indicated mScar-PBP1a fusion under theophylline-inducible control were grown and plated as in Figure 3. The concentration of agar supplements was 0.3 μg/mL ampicillin and 0.3 mM theophylline as indicated. (C) Shown are mScarlet fluorescence (upper) and phase contrast (lower) micrographs of cells expressing the indicated mScar-PBP1a fusions. mScar-PBP1a derivatives analyzed were mScar-PBP1a(E97A), mScar-PBP1a(S393A), and mScar-PBP1a(E97A,S393A), which are inactivated for the GTase, TPase, or both active sites, respectively. Cells were imaged on CGX2 with supplements agarose pads. Bar equals 3 µm. (D) Demographs reflecting protein localization throughout the indicated population of cells for each of the indicated strains. Heatmaps of fluorescence intensity across each cell analyzed were arranged according to cell length and stacked to generate the demograph. A custom-written MATLAB script was used to orient the cells such that the cell pole with the higher fluorescence was located on the right of the demograph.
Figure 4
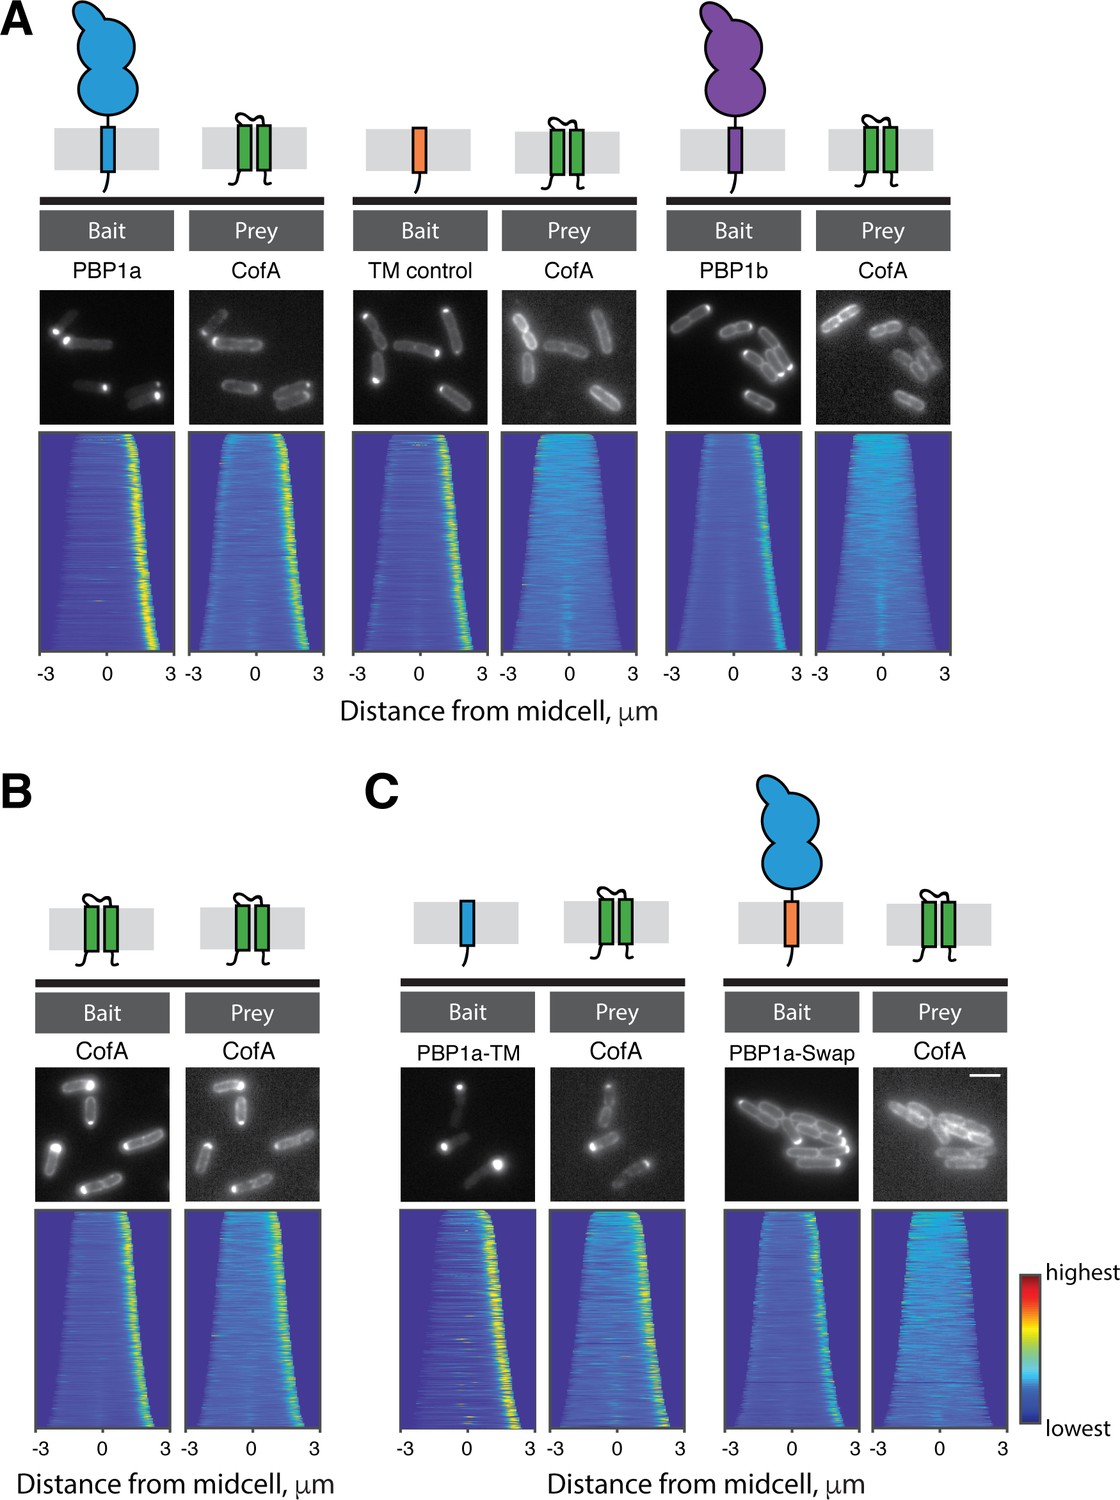
CofA specifically interacts with PBP1a.
Shown are results from the POLAR two-hybrid assay with proteins expressed in E. coli cells. Bait proteins were fused with GFP and the H3H4 peptide to target them to polar assemblies of the PopZ protein. Prey proteins were expressed as mScar fusions. Schematics of the proteins or protein domains used as bait or prey are shown above the micrographs for reference. In each panel, representative fluorescence images of E. coli cells expressing the indicated bait and prey proteins are shown. Below these images are demographs that reflect protein localization throughout a population of cells. For the demographs the distribution of fluorescence across at least 250 cells was quantified. The resulting heatmaps of fluorescence intensity for each cell were then arranged according to cell length and stacked to generate the demograph. A custom-written MATLAB script was used to orient the cells such that the cell pole with the higher bait fluorescence was located on the right of the demograph (available at https://github.com/jsher-Bernhardtlab/cofA; Sher, 2020; copy archived at https://github.com/elifesciences-publications/cofA). (A) (left) GFP-PBP1a bait with mScar-CofA prey. (middle) Control transmembrane domain fused to GFP (GFP-TM) as bait with mScar-CofA prey. (right) GFP-PBP1b bait with mScar-CofA prey. (B) GFP-CofA bait with mScar-CofA prey. (C) (left) GFP fused to the tramsmembrane domain of PBP1a (GFP-PBP1a-TM) with mScar-CofA prey. (right) GFP-PBP1a with a heterologous transmembrane domain (GFP-PBP1a-Swap) with mScar-CofA prey.
Figure 5 with 1 supplement
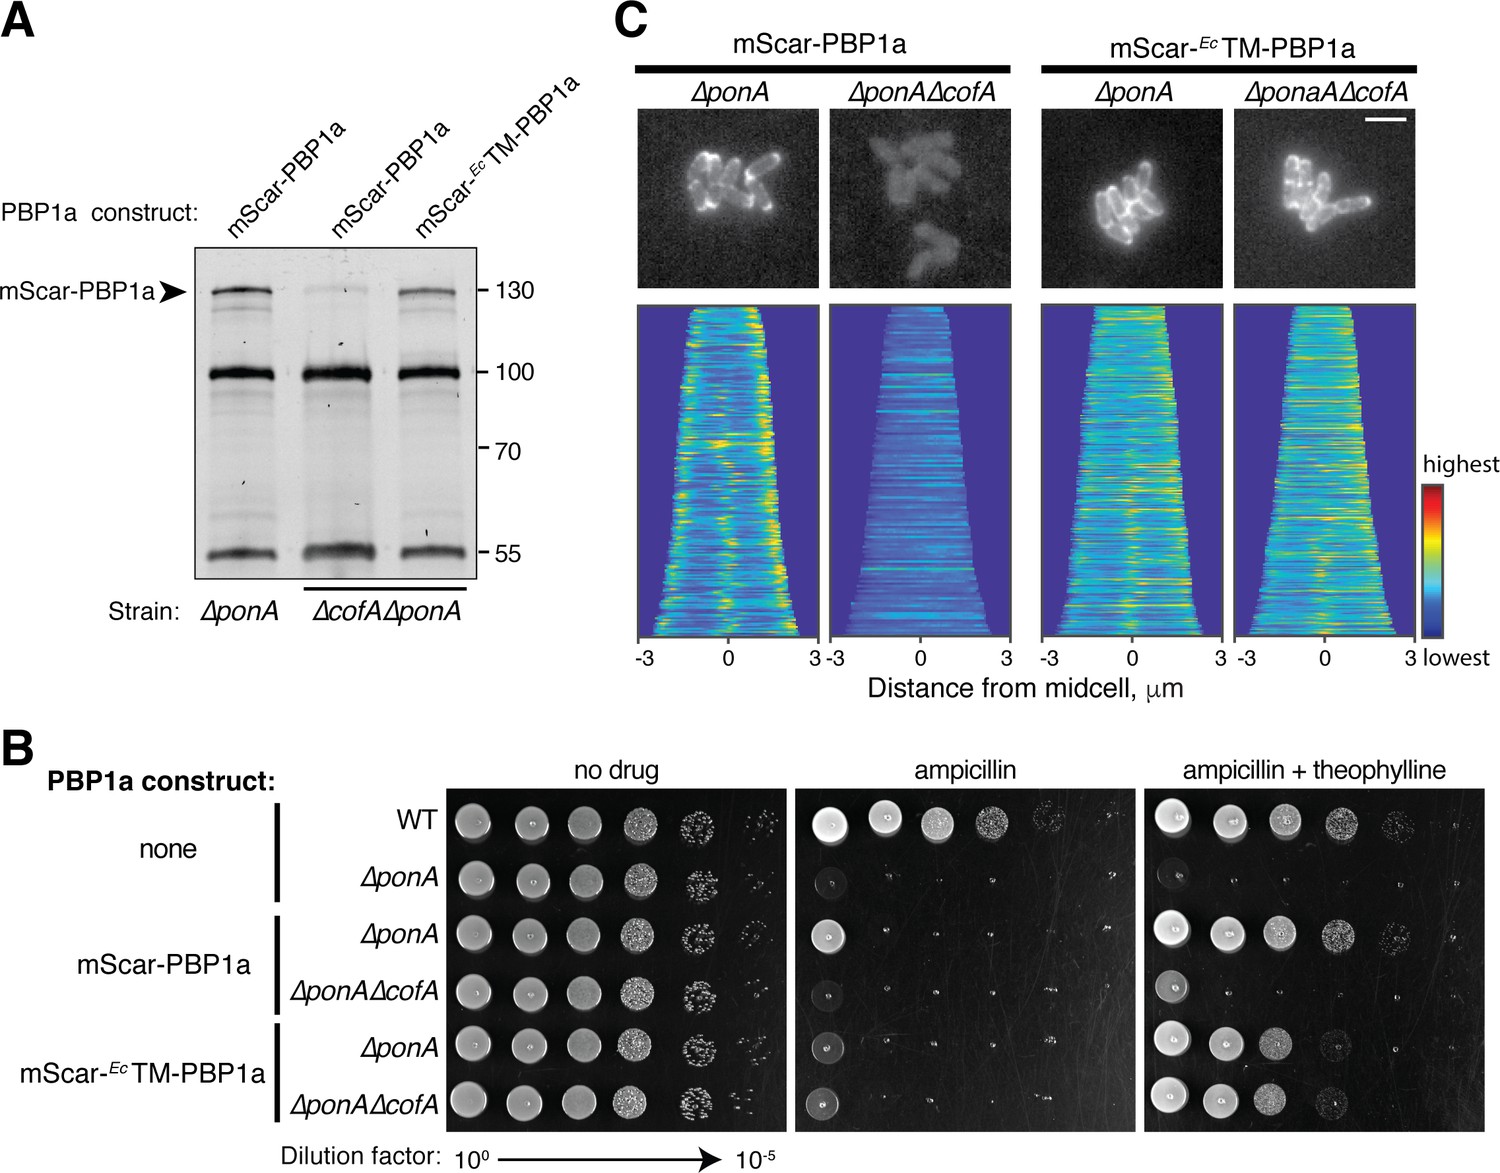
Interaction with CofA is required for polar localization of PBP1a.
(A) Bocillin labeling of mScar-PBP1a in the indicated strains. Production of the mScar fusions was induced with 0.3 mM theophylline as in Figure 3. For this gel, 7.5 μg of total protein was loaded for each sample. mScar-EcTM-PBP1a refers to the PBP1a derivative in which the transmembrane domain of E. coli PBP1a was used to replace the corresponding domain of native Cglu PBP1a. Fluorescent band intensities for labeled mScar-PBP1a derivatives was performed as in Figure 3E. The mScar-PBP1a band decreased in intensity by a factor of 8 in ΔcofA cells relative to the corresponding CofA+ strain, whereas the mScar-EcTM-PBP1a in ΔcofA cells was present at 74% of the mScar-PBP1a level in CofA+ cells. (B) Cultures of the indicated strains encoding mScar-PBP1a, mScar-EcTM-PBP1a, or no fusion as indicated were grown and plated as in Figure 2—figure supplement 1. Plates contained 0.3 μg/mL ampicillin with or without 0.3 mM theophylline to induce the production of the PBP1a fusions as indicated. (C) (top) Shown are representative micrographs of ΔponA or ΔponA ΔcofA cells producing the indicated mScar-PBP1a or mScar-EcTM-PBP1a fusion, which was induced upon addition of 0.3 mM theophylline. Cells were imaged on CGX2 with supplements agarose pads. (bottom) Demographs showing fluorescence distribution of the corresponding mScar fusions throughout a population of cells. At least 150 cells were analyzed for each demograph. Bar equals 3 µm.
Figure 5—figure supplement 1
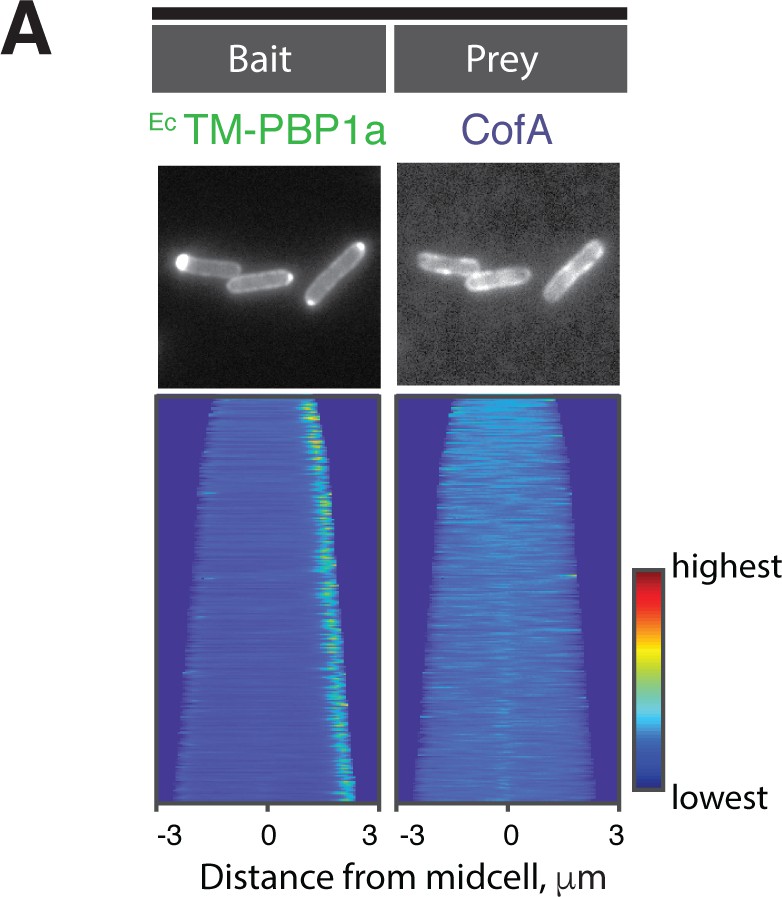
CofA does not interact with PBP1a with a heterologous transmembrane domain.
(A) POLAR two-hybrid assay assessing the interaction of Cglu mScar-CofA prey with GFP-EcTM-PBP1a bait. Results are displayed as in Figure 4.
Figure 6 with 1 supplement

The CofA-PBP1a interaction is conserved.
(A) Phylogenetic tree showing the distribution of CofA-like proteins containing the DUF3566 domain. (B) Schematics showing the genomic organization of loci encoding cofA-like genes in representative bacteria. The domain predictions are based on the NCBI conserved domain database. Not drawn to scale. (C–D) POLAR two-hybrid assay assessing the interaction of CofA paralogs from Corynebacterium jeikeium K411 (C) or Mycobacterium tuberculosis H37Rv (D) with PBPs from these organisms. Results are displayed as in Figure 4. (C) (left) GFP fused to the transmembrane domain of C. jeikeium PBP1a (GFP-CjPBP1a-TM) with mScar-CjCofA prey. Reading frames used were JK1977 (residues 1–44) and JK0012, respectively. (right) GFP fused to the transmembrane domain of C. jeikeium PBP1b (GFP-CjPBP1b-TM) with mScar-CjCofA prey. Reading frames for PBP1b used was JK2069 (residue 185–235). Bar equals 3 µm. (D) POLAR two-hybrid assay results with Mtb proteins. (left) GFP fused to the transmembrane domain (residues 1–41) of Mtb PonA2 (GFP-MtbPonA2-TM) with mScar-MtbCofA-ΔN prey. Note PonA2 (Rv3682) is the Mtb ortholog of Cglu PBP1a. The CofA fusion used is deleted for the N-terminal extension (residues 1–190) found on the Mtb CofA sequence (Rv0007). (right) GFP fused to the transmembrane domain (residues 120–167) of Mtb PonA1 (GFP-MtbPonA1-TM) with mScar-MtbCofA-ΔN prey. Note PonA1 (Rv0050) is the Mtb ortholog of Cglu PBP1b. Bar equals 3 µm.
Figure 6—figure supplement 1

Interaction of full length MtbCofA with PonA2.
(A) POLAR two-hybrid assay assessing the interaction of GFP-MtbPonA2-TM or GFP-MtbPonA1-TM baits with full-length mScar-MtbCofA prey. Results are displayed as in Figure 4.
Tables
Key resources table
| Reagent type (species) or resource | Designation | Source or reference | Identifiers | Additional information |
|---|---|---|---|---|
| Strain, strain background (Escherichia coli) | DH5α(λpir) | Gibco BRL | F– hsdR17 deoR recA1 endA1 phoA supE44 thi-1 gyrA96 relA1 Δ(lacZYA-argF)U169 ϕ80dlacZΔM15 ****add pir | |
| Strain, strain background (Escherichia coli) | TB28 | (Bernhardt and de Boer, 2003) | MG1655 ΔlacIZYA::frt | |
| Strain, strain background (Corynebacterium glutamicum) | MB001 | (Baumgart et al., 2013) | ATCC 13032 ΔCGP1 (cg1507-cg1524) ΔCGP2 (cg1746-cg1752) ΔCGP3 (cg1890-cg2071) | |
| Strain, strain background (Corynebacterium glutamicum) | HL18 | This work | MB001 ΔponA | Bernhardt lab (MB001/pHCL86, see Materials and methods) |
| Strain, strain background (Corynebacterium glutamicum) | JS5 | This work | MB001 Δcgp_3012-cgp_3020 | Bernhardt lab (MB001/pJWS1, see Materials and methods) |
| Strain, strain background (Corynebacterium glutamicum) | JS6 | This work | MB001 Δcgp_3019 | Bernhardt lab (MB001/pJWS2, see Materials and methods) |
| Strain, strain background (Corynebacterium glutamicum) | JS7 | This work | MB001 Δcgp_3018 | Bernhardt lab (MB001/pJWS3, see Materials and methods) |
| Strain, strain background (Corynebacterium glutamicum) | JS8 | This work | MB001 Δcgp_0016 | Bernhardt lab (MB001/pJWS4, see Materials and methods) |
| Strain, strain background (Corynebacterium glutamicum) | JS10 | This work | MB001 Δcgp_0016 ΔponA | Bernhardt lab (JS8/pHCL86, see Materials and methods) |
| Recombinant DNA reagent | pJWS1 | This work | KanR, pCRD206 derivative containing an insert covering upstream and downstream of cgp_3012-cgp_3020. | Bernhardt lab (see Supplementary file 2) |
| Recombinant DNA reagent | pJWS2 | This work | KanR, pCRD206 derivative containing an insert covering upstream and downstream of cgp_3019. | Bernhardt lab (see Supplementary file 2) |
| Recombinant DNA reagent | pJWS3 | This work | KanR, pCRD206 derivative containing an insert covering upstream and downstream of cgp_3018. | Bernhardt lab (see Supplementary file 2) |
| Recombinant DNA reagent | pJWS4 | This work | KanR, pCRD206 derivative containing an insert covering upstream and downstream of cgp_0016 (cofA). | Bernhardt lab (see Supplementary file 2) |
| Recombinant DNA reagent | pJWS18 | This work | KanR, pK-PIM derivative encoding Psod-riboE1-mscar-cgp_0016 (cofA) | Bernhardt lab (see Supplementary file 2) |
| Recombinant DNA reagent | pJWS19 | This work | KanR, pK-PIM derivative encoding Psod-riboE1-mscar-cgp_0336 (ponA) | Bernhardt lab (see Supplementary file 2) |
| Recombinant DNA reagent | pJWS97 | This work | KanR, pK-PIM derivative encoding Psod-riboE1-mscar-C. gluponA (E. coliTM) | Bernhardt lab (see Supplementary file 2) |
| Recombinant DNA reagent | pJWS102 | This work | KanR, pK-PIM derivative encoding Psod-riboE1-mscar-cgp_0336 (ponA) GT- (E97A) | Bernhardt lab (see Supplementary file 2) |
| Recombinant DNA reagent | pJWS103 | This work | KanR, pK-PIM derivative encoding Psod-riboE1-mscar-cgp_0336 (ponA) TP- (S393A) | Bernhardt lab (see Supplementary file 2) |
| Recombinant DNA reagent | pJWS104 | This work | KanR, pK-PIM derivative encoding Psod-riboE1-mscar-cgp_0336 (ponA) GT- and TP- (E97A and S393A) | Bernhardt lab (see Supplementary file 2) |
| Recombinant DNA reagent | pHCL86 | (Lim et al., 2019) | KanR, pCRD206 derivative containing an insert covering upstream and downstream of cgp_0336 (ponA). | |
| Recombinant DNA reagent | pHCL149 | (Lim and Bernhardt, 2019) | CmR, Para-popZ-rbs-H3H4-msfGFPN-tmponB. | |
| Recombinant DNA reagent | pHCL152 | (Lim and Bernhardt, 2019) | TetR, lacI-Plac-mscar. | |
| Recombinant DNA reagent | pJWS29 | This work | CmR, Para-popZ-rbs-H3H4-msfGFP-ponA | Bernhardt lab (see Supplementary file 2) |
| Recombinant DNA reagent | pJWS41 | This work | TetR, lacI-Plac-mscar-cgp_0016 | Bernhardt lab (see Supplementary file 2) |
| Recombinant DNA reagent | pJWS70 | This work | TetR, lacI-Plac-mscar-jk0012 | Bernhardt lab (see Supplementary file 2) |
| Recombinant DNA reagent | pJWS73 | This work | CmR Para-popZ-rbs-H3H4-msfGFP-ponATM | Bernhardt lab (see Supplementary file 2) |
| Recombinant DNA reagent | pJWS75 | This work | CmR, Para-popZ-rbs-H3H4-msfGFP-ponASwap | Bernhardt lab (see Supplementary file 2) |
| Recombinant DNA reagent | pJWS78 | This work | CmR, Para-popZ-rbs-H3H4-jk1977TM | Bernhardt lab (see Supplementary file 2) |
| Recombinant DNA reagent | pJWS80 | This work | CmR, Para-popZ-rbs-H3H4-msfGFP-ponB | Bernhardt lab (see Supplementary file 2) |
| Recombinant DNA reagent | pJWS81 | This work | CmR, Para-popZ-rbs-H3H4-ponA2TM | Bernhardt lab (see Supplementary file 2) |
| Recombinant DNA reagent | pJWS83 | This work | TetR, lacI-Plac-mscar-rv0007FL | Bernhardt lab (see Supplementary file 2) |
| Recombinant DNA reagent | pJWS88 | This work | CmR, Para-popZ-rbs-H3H4-ponA1TM | Bernhardt lab (see Supplementary file 2) |
| Recombinant DNA reagent | pJWS90 | This work | CmR, Para-popZ-rbs-H3H4-jk2069TM | Bernhardt lab (see Supplementary file 2) |
| Recombinant DNA reagent | pJWS114 | This work | TetR, lacI-Plac-mscar-rv0007ΔN | Bernhardt lab (see Supplementary file 2) |
| Recombinant DNA reagent | pJWS119 | This work | CmR, Para-popZ-rbs-H3H4-C. gluponA (E. coliTM) | Bernhardt lab (see Supplementary file 2) |
| Chemical compound | Bocillin | ThermoFisher Scientific | BOCILLIN FL Penicillin, Sodium Salt |
Additional files
-
Supplementary file 1
Growth conditions for the phenotypic profiling.
The different growth conditions used for the profiling analysis are listed. Samples 1 g_A, B, and C, correspond to those sequenced to analyze the transposon insertion profile in the original library following one generation of growth. Similarly, 11 g_A and 11 g_B correspond to samples grown for 11 generations without treatment.
- https://cdn.elifesciences.org/articles/54761/elife-54761-supp1-v2.docx
-
Supplementary file 2
Plasmid construction methods.
- https://cdn.elifesciences.org/articles/54761/elife-54761-supp2-v2.docx
-
Transparent reporting form
- https://cdn.elifesciences.org/articles/54761/elife-54761-transrepform-v2.docx
Download links
A two-part list of links to download the article, or parts of the article, in various formats.
Downloads (link to download the article as PDF)
Open citations (links to open the citations from this article in various online reference manager services)
Cite this article (links to download the citations from this article in formats compatible with various reference manager tools)
Global phenotypic profiling identifies a conserved actinobacterial cofactor for a bifunctional PBP-type cell wall synthase
eLife 9:e54761.
https://doi.org/10.7554/eLife.54761


