Metapopulation ecology links antibiotic resistance, consumption, and patient transfers in a network of hospital wards
- CIRI, Centre International de Recherche en Infectiologie, Université de Lyon, Inserm U1111, Ecole Normale Supérieure de Lyon, Université Lyon 1, CNRS, UMR5308, France
- Département de Pharmacie, Hospices Civils de Lyon, France
- Pôle de Santé Publique, Département d'Information Médicale, Hospices Civils de Lyon, France
- Institut des Agents Infectieux, Hospices Civils de Lyon, France
- Laboratoire de Biométrie et Biologie Evolutive, UMR CNRS 5558, University of Lyon, France
- Service des Maladies Infectieuses et Tropicales, Hospices Civils de Lyon, France
Figures
Figure 1 with 6 supplements
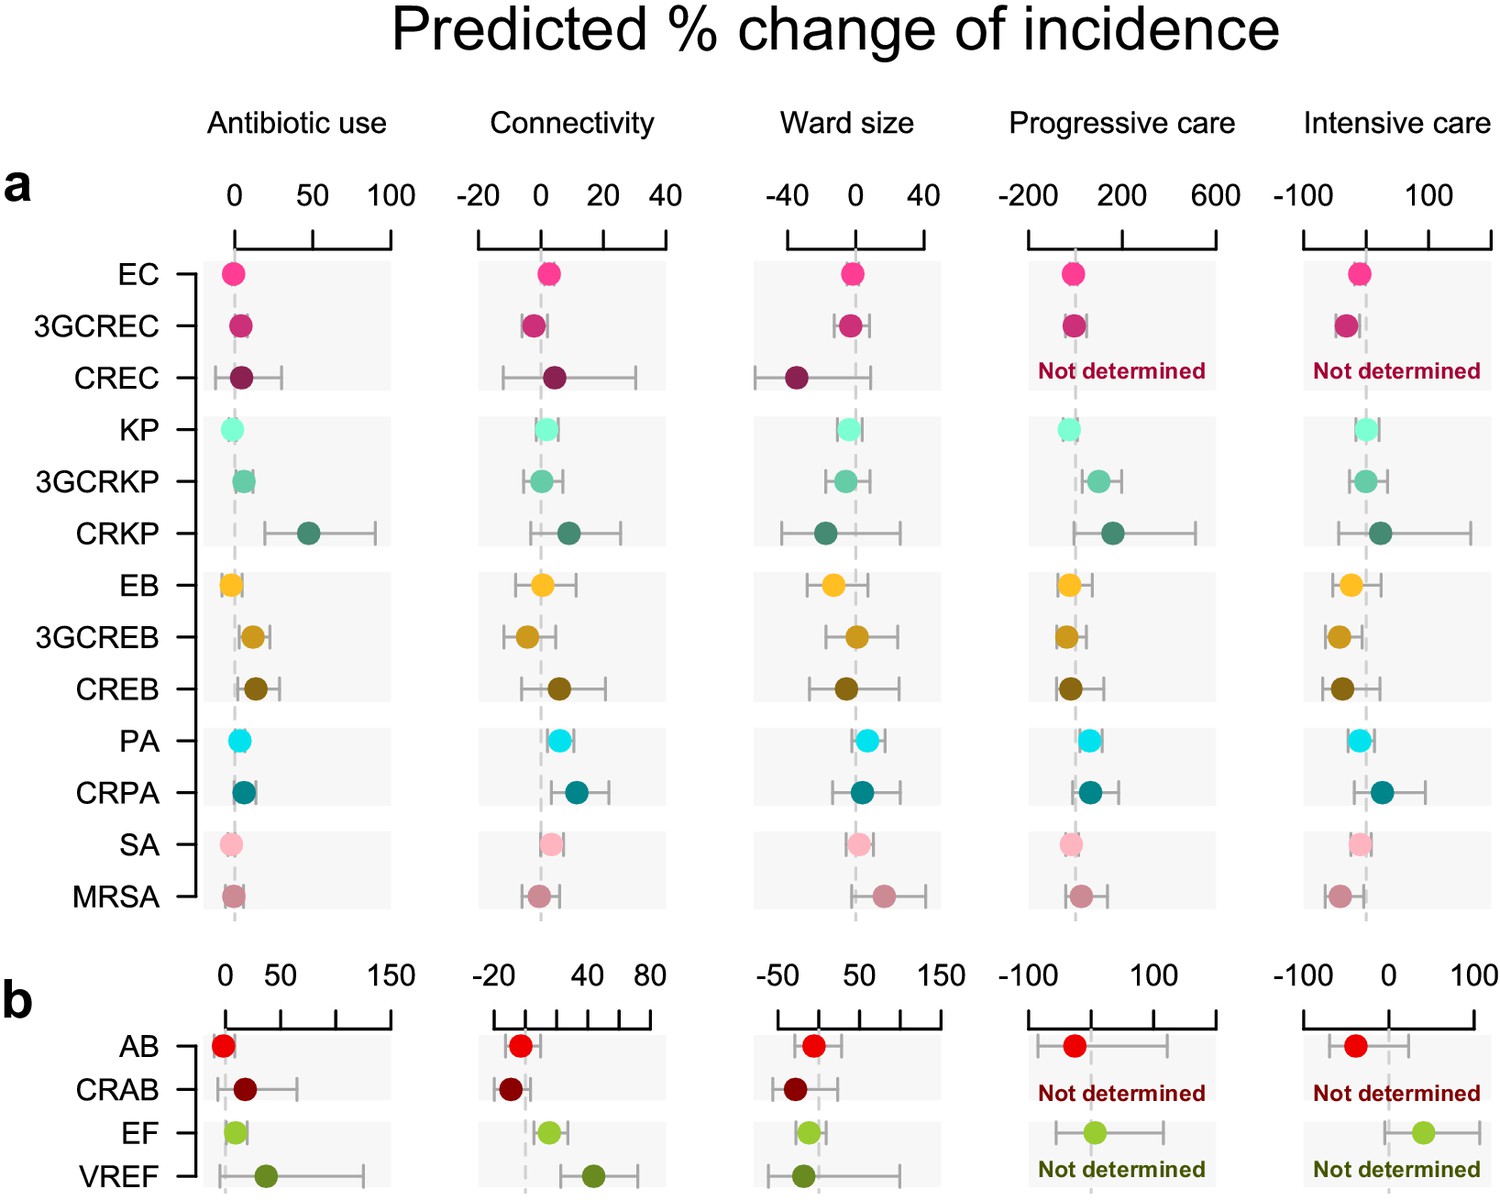
Antibiotic use and connectivity predict the incidence of infection with ESKAPE2 pathogen variants.
Shown are the predicted percent changes in incidence (points) with 95% confidence interval (bars) for each variant in each ward (n = 357) for every doubling of antibiotic use, connectivity (estimated no. of patients infected with the same variant entering the ward), ward size (no. of beds), and ward type. All models were multivariable quasi-Poisson regressions that included the incidence control covariate (see Materials and methods). Models involving A. baumannii and E. faecium, which exhibited larger 95% confidence intervals due to smaller incidence of the resistant variants, are shown with separate scales (panel b) for readability. In models of CREC, CRAB, and VREF incidence, small sample size in at least one ward category prevented the inclusion of ward type as a covariate and the estimation of the coefficient, marked as ‘not determined’. Variant acronyms are listed in Table 1.
Figure 1—figure supplement 1
Incidence of each variant during the study period.
Figure 1—figure supplement 2
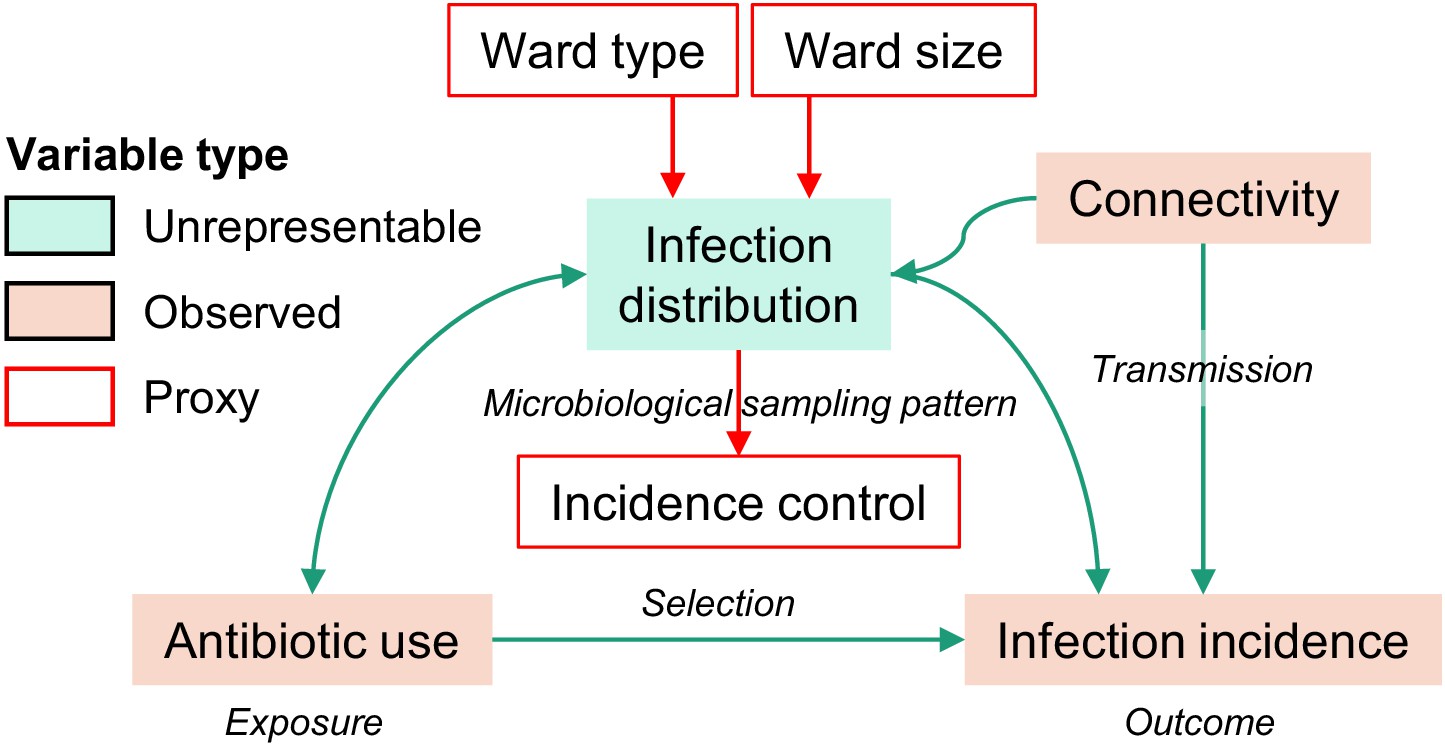
Directed acyclic graph representation of causal assumptions.
Boxes denote variables and arrows denote assumed causal relationships, from cause to effect. In the assumed model, the infection distribution variable opens a biasing path between antibiotic use (the exposure) and the incidence of infections with the pathogen variant of interest (the outcome). The infection distribution is an unrepresentable variable which cannot be directly adjusted for, but which might be represented by proxy variables (see Materials and methods). To define these proxy variables, we assume that ward type, size, and the incidence control value capture much of the variability of the unrepresentable infection distribution. Under this assumption, these measured variables are used as a proxy adjustment set to control for confounding by the infection distribution. Of note, the infection distribution influences the volume of antibiotic prescriptions, and antibiotic use also influences infections by altering the population structure of pathogens. Thus, the causal link between the infection distribution and antibiotic use is (possibly) bidirectional. However, the bidirectional link between antibiotic use and infection distribution does not prevent the identification of the causal effect under the assumption that the proxy adjustment set is valid.
Figure 1—figure supplement 3
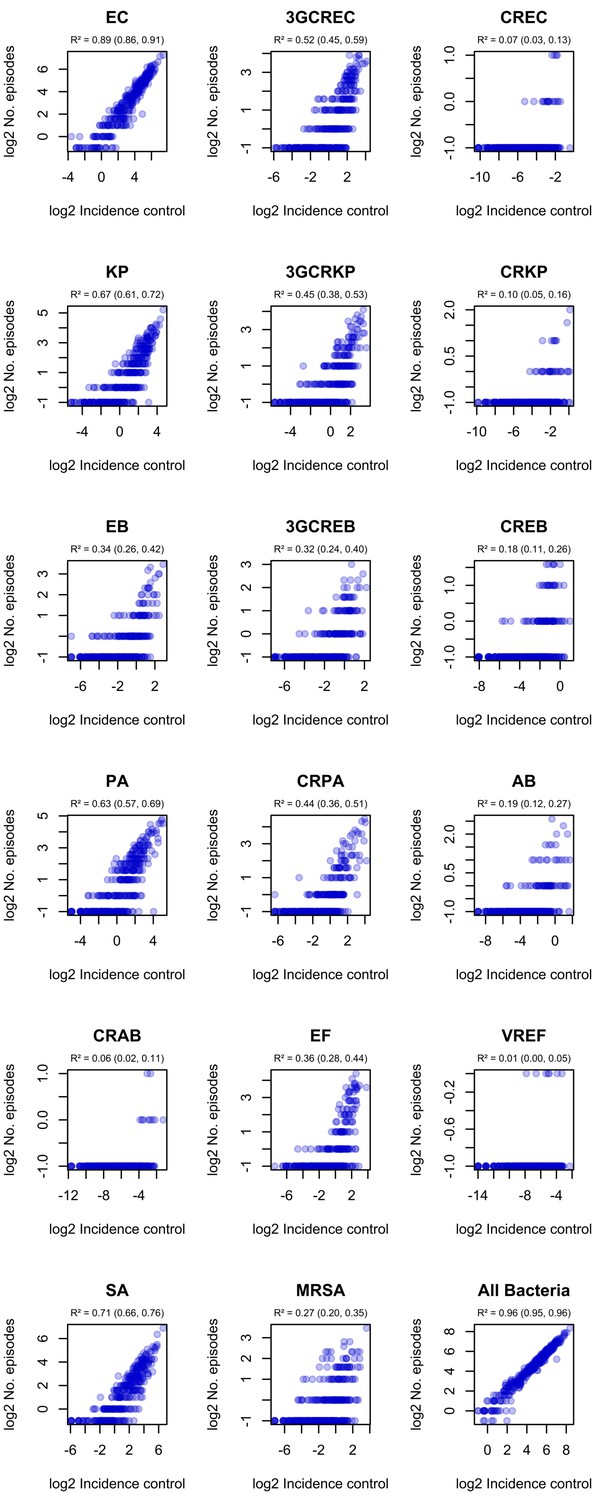
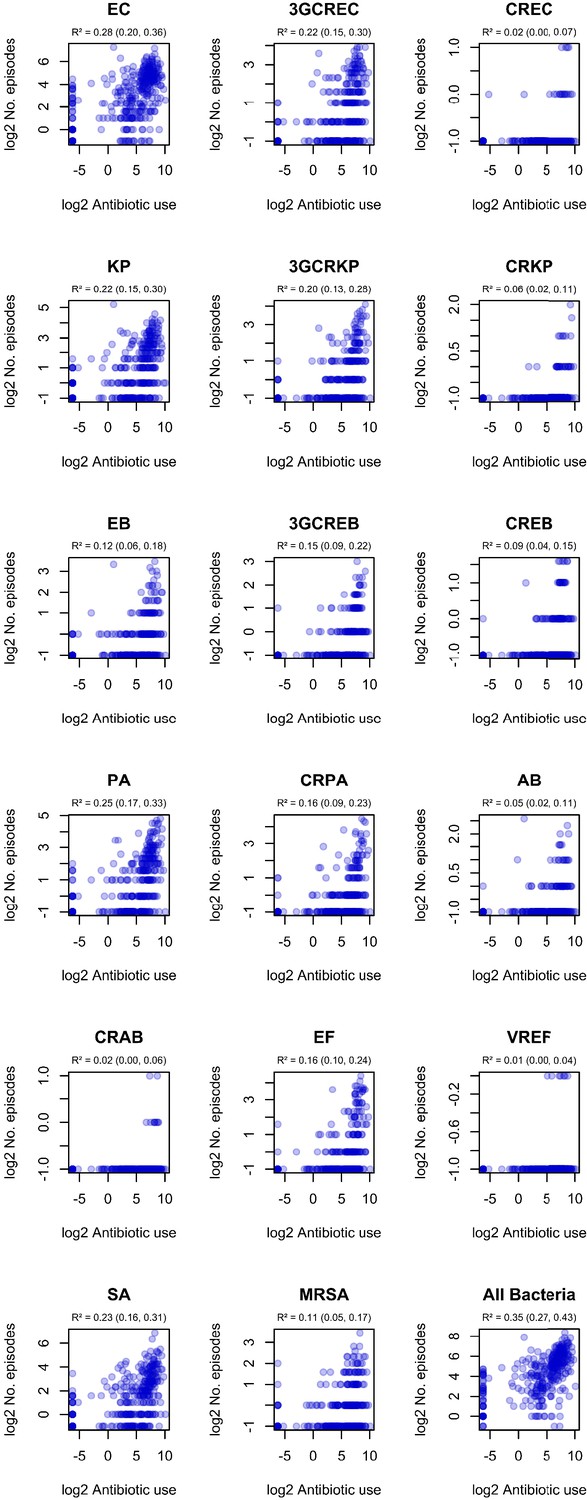
Correlation of ward-level incidence control values with infection incidence in ESKAPE2 pathogen variants.
R² and 95% confidence intervals (in parentheses) were obtained using simple linear regression on log2-transformed data.
Figure 1—figure supplement 4
Correlation of incidence control values with observed ward-level antibiotic consumption.
R² and 95% confidence intervals (in parentheses) were obtained using simple linear regression on log2-transformed data.
Figure 1—figure supplement 5
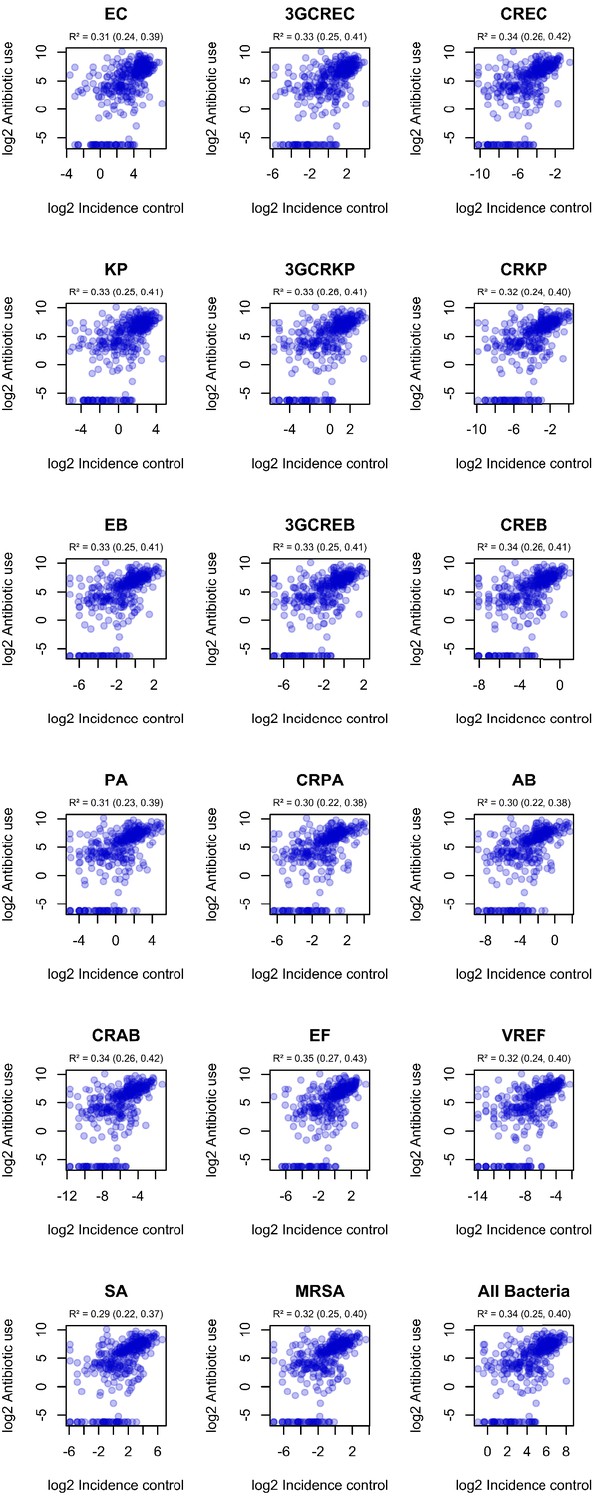
Correlation of ward-level antibiotic consumption and infection incidence in ESKAPE2 variants.
R² and 95% confidence intervals (in parentheses) were obtained using simple linear regression on log2-transformed data.
Figure 1—figure supplement 6
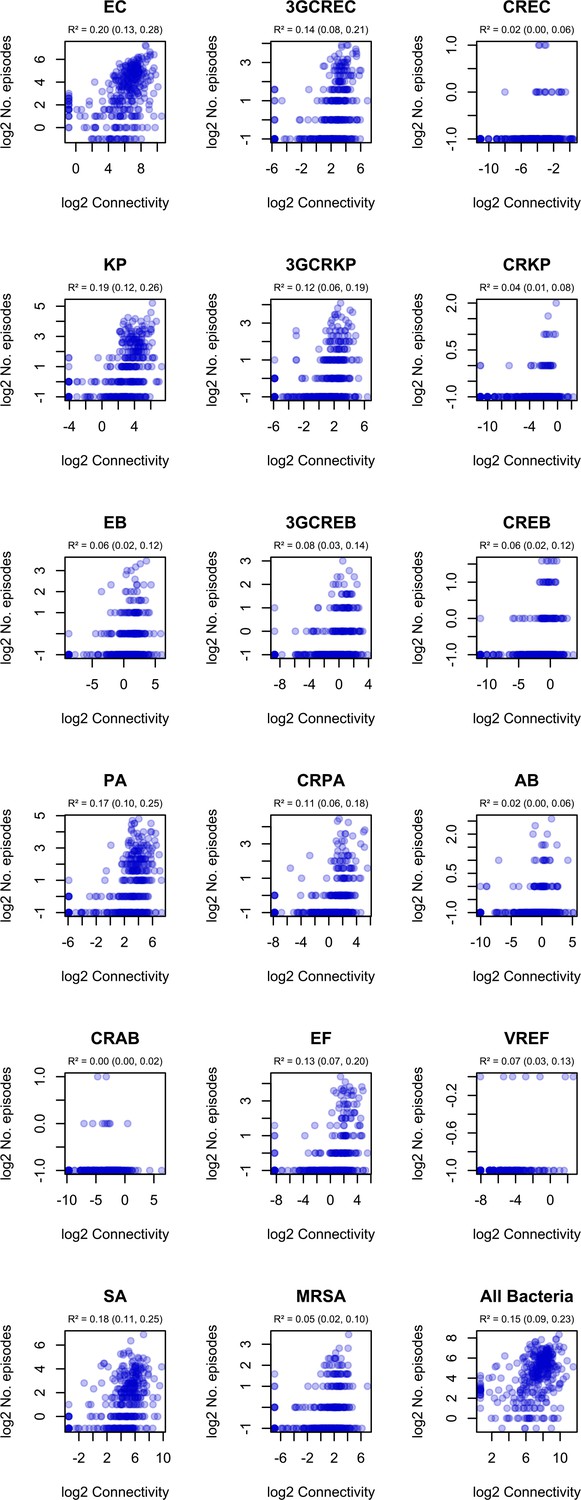
Correlation of ward-level connectivity and infection incidence in ESKAPE2 variants.
R² and 95% confidence intervals (in parentheses) were obtained using simple linear regression on log2-transformed data. .
Figure 2
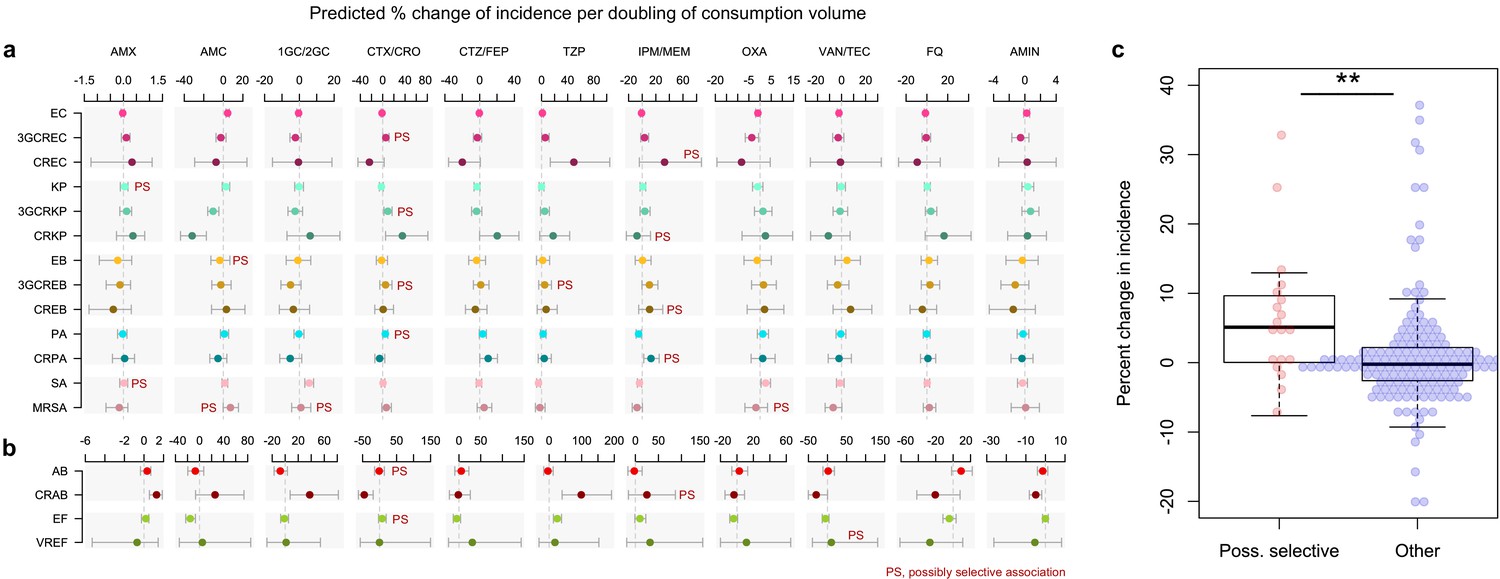
Possibly selective associations between the use of specific antibiotics and the incidence of infection with ESKAPE2 pathogen variants.
Shown are the predicted percent changes in incidence (points) with 95% confidence interval (bars) for each variant in each ward (n = 357) for every doubling in the consumption volume of 11 antibiotic groups, based on multivariable quasi-Poisson regression models of the incidence of each variant in each ward (n = 357) that included the connectivity and incidence control covariates (see Materials and methods). Associations classified as possibly selective (n = 19) are indicated by a ‘PS’ mark. Models involving A. baumannii and E. faecium, which exhibited larger 95% confidence intervals due to smaller incidence of the resistant variants, are shown with separate scales (panel b) for readability. (c), possibly selective associations had higher coefficients compared to other associations. The center line indicates the median; box limits indicate the upper and lower quartiles; whiskers indicate the 1.5x interquartile range; points indicate the individual coefficients. **p<0.01, two-sided Mann–Whitney U-test. Acronyms of pathogen variants and antibiotics are listed in Tables 1 and 2, respectively.
Figure 3

Global and specific antibiotics consumption predict the incidence of infection with 3rd-generation cepalosporin- or carbapenem-resistant ESKAPE2 pathogen variants.
(a) Predicted percent change in incidence (points) with the 95% confidence interval (bars) of all 3GCR and CR infections for every doubling of antibiotic use, connectivity (estimated no. of patients infected with the same variant entering the ward), ward size (no. of beds); and ward type, based on quasi-Poisson regression models of the pooled incidence of 3GCR and CR infections in each ward (n = 357) that included the incidence control covariate (see Materials and methods). (b) Predicted incidence and 95% confidence bands of infections with 3GCR and CR pathogen variants depending on the consumption of CTX/CRO, IPM/MEM, and TZP, in models that included connectivity, the incidence control, and the consumption of 8 other antibiotic groups as covariates. (c) Consumption patterns of CTX/CRO, IPM/MEM, and TZP per ward in the hospital network. Variants classified as 3GCR were 3GCREC, 3GCRKP, CRKP, 3GCREB, CREB, PA, CRPA, AB, CRAB, EF, VREF, and MRSA; the CR category included CREC, CRKP, CREB, CRPA, CRAB, EF, VREF, and MRSA. Acronyms of pathogen variants and antibiotics are listed in Tables 1 and 2, respectively.
Tables
Table 1
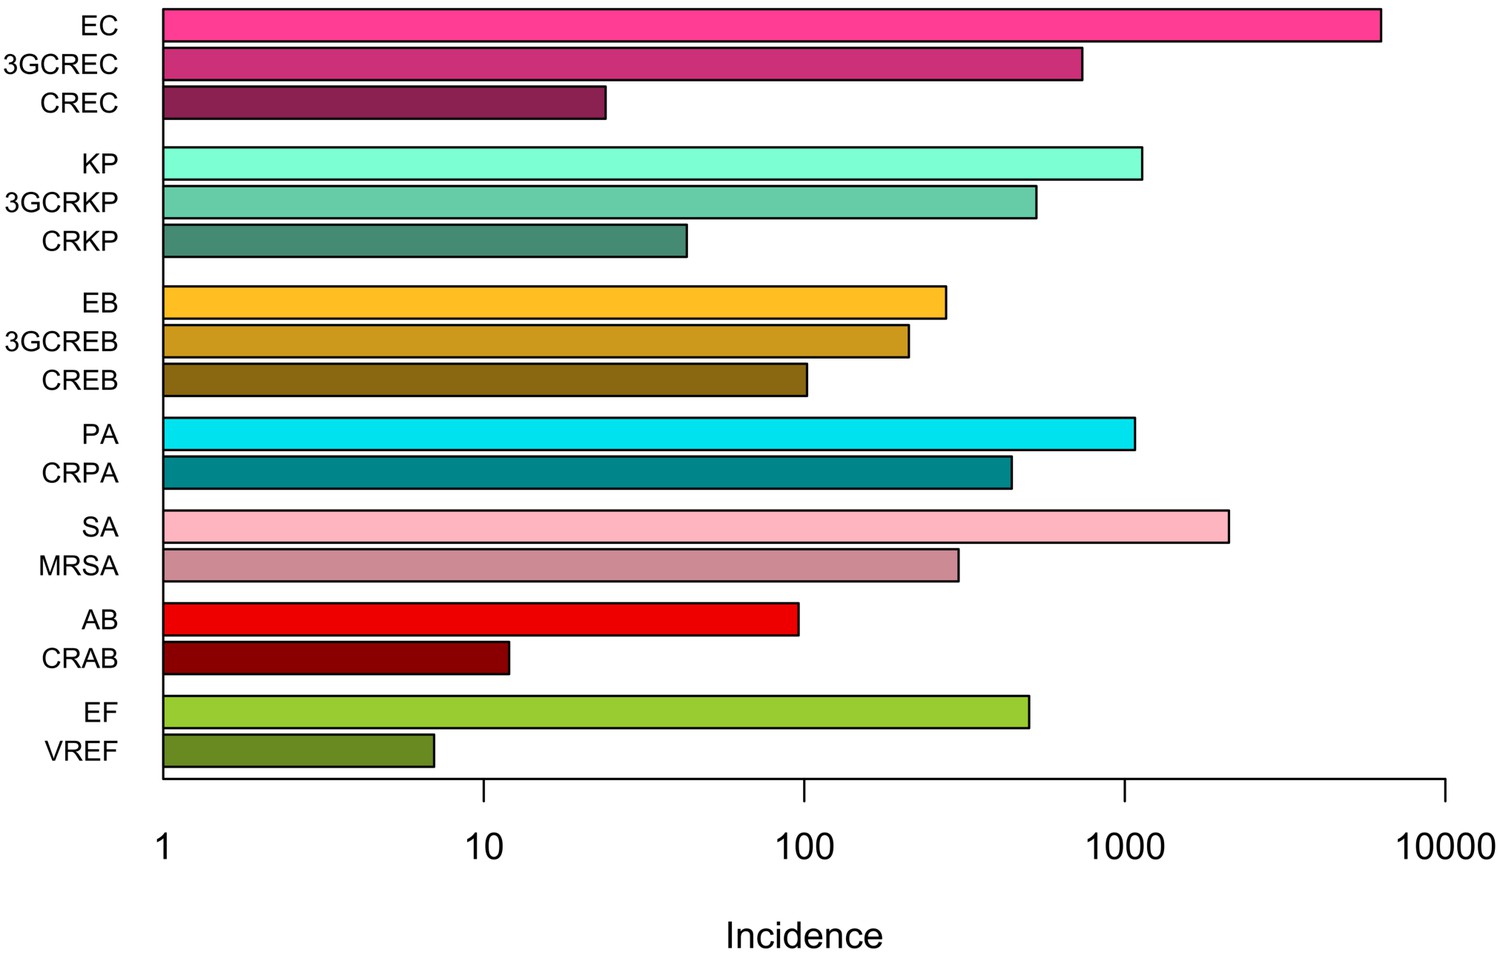
Distribution of ESKAPE2 pathogen infection episodes in 357 hospital wards.
| Species | Resistance profile | Acronym | No. of episodes (%), n = 13,915 | No. of wards (%), n = 357 | Concentration indexa (%) (95% CI) |
|---|---|---|---|---|---|
| E. coli | Susceptible to 3GC and carbapenems | EC | 6,303 (45.3) | 328 (91.9) | 0.6 (0.6, 0.7) |
| 3GC-resistant | 3GCREC | 737 (5.3) | 207 (58.0) | 0.7 (0.6, 0.8) | |
| Carbapenem-resistant | CREC | 24 (0.2) | 24 (5.6) | 1.4 (0.0, 3.9) | |
| K. pneumoniae | Susceptible to 3GC and carbapenems | KP | 1,133 (8.1) | 249 (69.7) | 0.7 (0.6, 0.8) |
| 3GC-resistant | 3GCRKP | 530 (3.8) | 175 (49.0) | 0.9 (0.7, 1.0) | |
| Carbapenem-resistant | CRKP | 43 (0.3) | 32 (9.0) | 1.7 (0.0, 3.5) | |
| E. cloacae complex | Susceptible to 3GC and carbapenems | EB | 277 (2.0) | 140 (39.2) | 1.0 (0.7, 1.3) |
| 3GC-resistant | 3GCREB | 212 (1.5) | 116 (32.5) | 0.8 (0.5, 1.0) | |
| Carbapenem-resistant | CREB | 102 (0.7) | 74 (20.7) | 0.7 (0.3, 1.1) | |
| P. aeruginosa | Carbapenem-susceptible | PA | 1,076 (7.7) | 231 (64.7) | 0.8 (0.7, 0.9) |
| Carbapenem-resistant | CRPA | 444 (3.2) | 148 (41.5) | 1.5 (1.2, 1.7) | |
| A. baumannii | Carbapenem-susceptible | AB | 96 (0.7) | 61 (17.1) | 1.3 (0.5, 2.1) |
| Carbapenem-resistant | CRAB | 12 (0.1) | 10 (2.8) | 3.0 (0.0, 9.8) | |
| E. faecium | Vancomycin-susceptible | EF | 503 (3.6) | 133 (27.3) | 1.4 (1.2, 1.6) |
| Vancomycin-resistant | VREF | 7 (<0.1) | 7 (2.0) | 0.0 (0.0, 9.6) | |
| S. aureus | Methicillin-susceptible | SA | 2,113 (15.2) | 273 (76.5) | 1.1 (1.0, 1.1) |
| Methicillin-resistant | MRSA | 303 (2.2) | 151 (42.3) | 0.7 (0.5, 0.9) |
-
NOTE. aThe concentration index estimates the probability that two episodes taken at random occurred in the same ward. Here we report the concentration index as a percent (0–100%). 3GC, 3rd-generation cephalosporins.
Table 2
Distribution of the use of 11 antibiotics in 357 hospital wards.
| Antibiotics | Acronym | Prescription volume in ddd/y (%) | No. of wards (%), n = 357 | Concentration indexa (%), (95% CI) |
|---|---|---|---|---|
| Amoxicillin | AMX | 141,293 (24.0) | 252 (70.6) | 1.8 (1.7, 1.8) |
| Coamoxiclav | AMC | 78,072 (13.3) | 247 (69.3) | 1.0 (0.9, 1.0) |
| First- and second- generation cephalosporins | 1GC/2GC | 12,915 (2.2) | 191 (53.5) | 1.2 (1.1, 1.3) |
| Non-antipseudomonal 3GCs, cefotaxime and ceftriaxone | CTX/CRO | 53,406 (9.1) | 259 (72.5) | 0.8 (0.8, 0.9) |
| Antipseudomonal 3GCs, ceftazidime and cefepime | CTZ/FEP | 29,204 (5.0) | 184 (51.5) | 1.9 (1.8, 1.9) |
| Piperacillin-tazobactam | TZP | 27,593 (4.7) | 198 (55.5) | 1.9 (1.7, 1.9) |
| Carbapenems | IPM/MEM | 25,093 (4.3) | 204 (57.1) | 1.5 (1.4, 1.6) |
| Oxacillin | OXA | 12,374 (2.1) | 143 (40.1) | 3.6 (3.1, 3.7) |
| Vancomycin and teicoplanin | VAN/TEC | 25,376 (4.3) | 206 (57.7) | 1.5 (1.4, 1.5) |
| Fluoroquinolones | FQ | 52,549 (8.9) | 249 (69.7) | 0.8 (0.8, 0.8) |
| Aminoglycosides | AMIN | 12,745 (2.2) | 207 (58.0) | 1.9 (1.5, 1.9) |
| All antibioticsb | - | 589,014 (100) | 308 (86.3) | 0.8 (0.8, 0.8) |
-
NOTE. aThe concentration index estimates the probability that two antibiotic ddds taken at random were prescribed in the same ward. Here we report the concentration index as a percent (0–100%). bTotal consumption of systemic-use antibiotics (ATC class J01) including those not considered in the 11 specific drug groups. 3GC, 3rd-generation cephalosporin; ddd, defined daily dose.
Table 3
Associations between the consumption volume of 11 antibiotics and the cumulative incidence of 3GC- and/or carbapenem-resistant infections in 357 wards.
| Predicted percent change in incidence (95% CI) per doubling of consumption volume | |||
|---|---|---|---|
| Antibiotics | 3GCR incidence model | CR incidence model | 3GCR or CR incidence model |
| TZP | 5.9 (2.9, 9.0) | 10.3 (5.0, 16.0) | 6.1 (3.1, 9.2) |
| CTX/CRO | 4.8 (1.5, 8.2) | 1.8 (-3.7, 7.6) | 4.6 (1.4, 8.0) |
| AMX | 2.7 (-1.5, 7.0) | 3.6 (-3.4, 11.2) | 2.7 (-1.4, 7.0) |
| CTZ/FEP | 1.7 (-1.0, 4.5) | 3.3 (-1.5, 8.3) | 1.6 (-1.1, 4.4) |
| IPM/MEM | 1.4 (-1.8, 4.7) | 5.1 (-0.6, 11.1) | 1.5 (-1.6, 4.8) |
| FQ | 0.5 (-1.9, 2.9) | −1.2 (-5.2, 3.0) | 0.4 (-1.9, 2.8) |
| OXA | −0.6 (-2.2, 1.1) | −2.0 (-4.6, 0.7) | −0.6 (-2.2, 1.0) |
| AMIN | −1.7 (-4.3, 0.9) | −1.1 (-5.4, 3.6) | −1.7 (-4.3, 0.9) |
| VAN/TEC | −2.3 (-4.9, 0.4) | −3.8 (-8.3, 0.9) | −2.3 (-4.9, 0.5) |
| 1GC/2GC | −2.1 (-4.0,–0.2) | −2.3 (-5.4, 1.0) | −2.1 (-4.0,–0.3) |
| AMC | −4.1 (-7.0,–1.1) | −5.8 (-10.6,–0.7) | −4.1 (-7.0,–1.1) |
-
NOTE. a Percent change was estimated from multivariable quasi-Poisson regression models that included the connectivity and the incidence control covariates (see Materials and methods). 3GCR, 3rd-generation cephalosporins-resistant infections; CR, carbapenem-resistant infections. Acronyms of antibiotics are listed in Table 2.
Additional files
-
Supplementary file 1
Supplementary tables.
(a) Summary statistics (mean, interquartile range) of connectivity for each variant. (b) Comparison of log-likelihood values from multivariable Poisson and negative binomial regressions and overdispersion parameters from quasi-Poisson multivariable regression of the incidence of infections with 17 pathogen variants. All models included total antibiotic consumption, connectivity, ward size, ward type, and the incidence control value as variables.
- https://cdn.elifesciences.org/articles/54795/elife-54795-supp1-v2.docx
-
Transparent reporting form
- https://cdn.elifesciences.org/articles/54795/elife-54795-transrepform-v2.docx
Download links
A two-part list of links to download the article, or parts of the article, in various formats.
Downloads (link to download the article as PDF)
Open citations (links to open the citations from this article in various online reference manager services)
Cite this article (links to download the citations from this article in formats compatible with various reference manager tools)
Metapopulation ecology links antibiotic resistance, consumption, and patient transfers in a network of hospital wards
eLife 9:e54795.
https://doi.org/10.7554/eLife.54795


