Altered hippocampal-prefrontal communication during anxiety-related avoidance in mice deficient for the autism-associated gene Pogz
- Department of Psychiatry, Weill Institute for Neurosciences, and Kavli Institute for Fundamental Neuroscience, University of California, San Francisco, United States
Figures
Figure 1 with 3 supplements
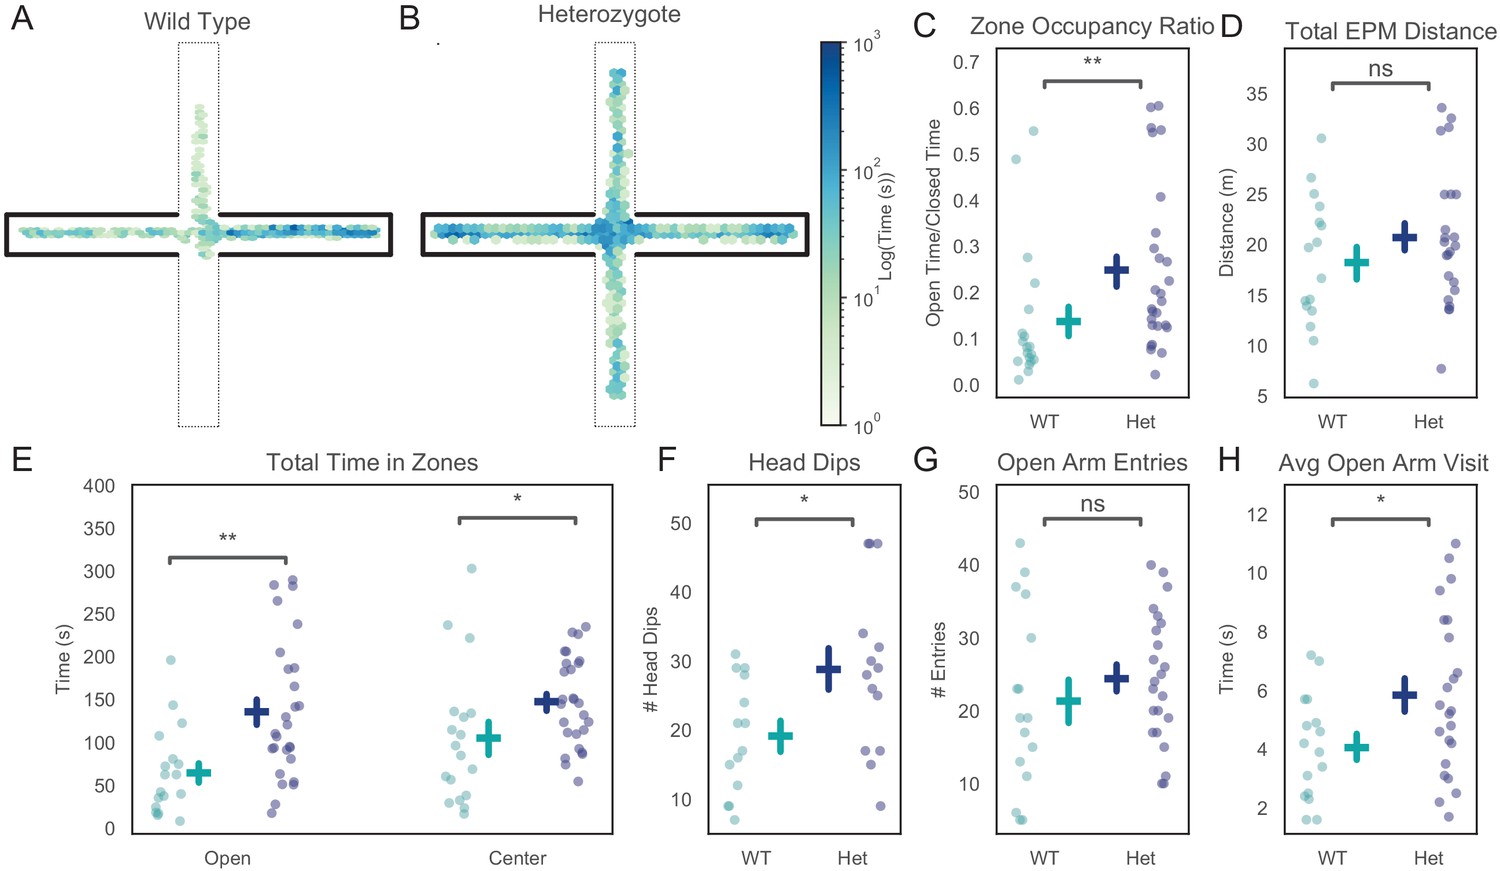
Pogz+/- mice exhibit reduced avoidance in the elevated plus maze (EPM).
(A, B) Occupancy plot for a 15 min EPM session for a representative wildtype (A) and Pogz+/- (B) mouse. (C) Ratio of time spent in open vs. closed arms of the EPM. Wilcoxon rank-sum test, U = −2.8857, p=0.003, WT N = 18, Het N = 27. (D) Total distance traveled during EPM sessions. Wilcoxon rank-sum test U = −1.9434, p=0.35, WT N = 16, Het N = 23. (E) Total time spent in exposed areas of EPM, open arms: statistic = −3.0753, p=0.001, center: U = −2.2112, p=0.02. Wilcoxon rank-sum test, WT N = 18, Het N = 27. (F) Total number of head dips for each mouse, U = −1.9434, p=0.03. Wilcoxon rank-sum test, WT N = 14, Het N = 14. (G) Number of open arm entries, U = −0.9993, p=0.32. Wilcoxon rank-sum test, WT N = 16, Het N = 23. (H) Average duration of each open arm visit, U = −1.984, p=0.047. Wilcoxon rank-sum test, WT N = 16, Het N = 23.
-
Figure 1—source data 1
Source data for Figure 1.
- https://cdn.elifesciences.org/articles/54835/elife-54835-fig1-data1-v2.csv
Figure 1—figure supplement 1
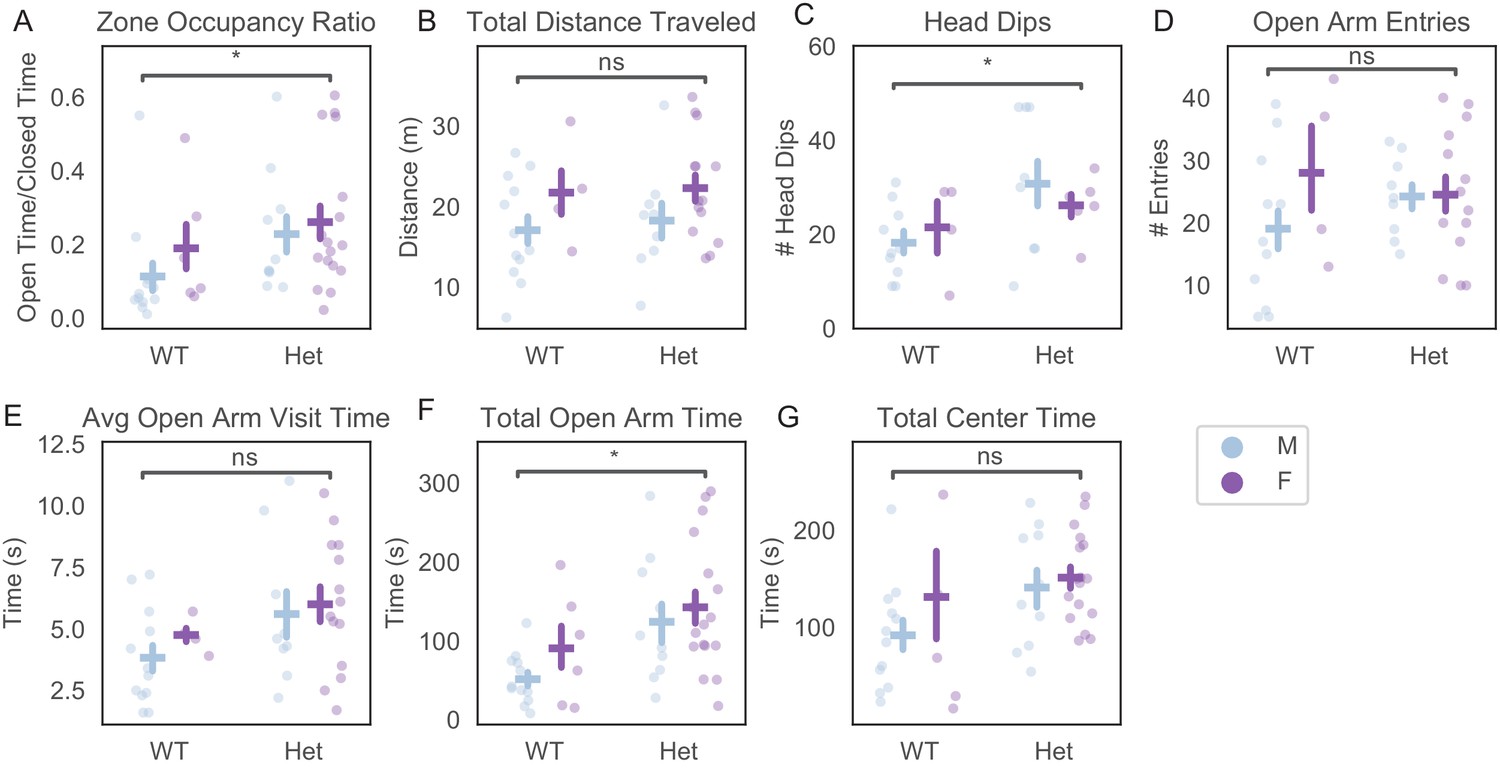
Sex differences do not account for elevated-plus maze (EPM) phenotypes.
EPM metrics divided by sex. For normally distributed data, two-way ANOVA was used to separate effects of genotype and sex. For non-normal data, effects of sex were tested by correcting all values by the median wildtype value for that sex. (A) Ratio of time in open vs closed arms. Pearson’s normality test, statistic = 8.4985, p=0.014. Genotype rank-sum test for sex-adjusted values, U = −2.4455, p=0.014. Rank-sum test for sex difference in Het mice, U = 0.52698, p=0.60. WT N = 12 males, 4 females. Het N = 10 males, 17 females. (B) Total distance traveled in EPM. Pearson’s normality test, statistic = 14.70185, p=0.00064. Genotype rank-sum test for sex-adjusted values, U = −0.2594, p=0.79. WT N = 12 males, four females. Het N = 9 males, 14 females. (C) Head dips. Pearson’s normality test, statistic = 2.0271, p=0.44. Two-way ANOVA, effect of genotype, F = 4.776, p=0.02, effect of sex, F = 0.88, p=0.81, interaction, F = 0.365, p=0.36. Rank-sum test for sex difference in Het mice, U = −0.6123, p=0.54. WT N = 10 males, 4 females. Het N = 8 males, 6 females. (D) Number of open arm entries. Pearson’s normality test, statistic = 3.02627, p=0.22. Two-way ANOVA, effect of genotype, F = 0.264, p=0.61, effect of sex, F = 0.85, p=0.32, interaction, F = 1.31, p=0.26. WT N = 12 males, 4 females. Het N = 9 males, 14 females. (E) Average open arm visit length. Pearson’s normality test, statistic = 3.16358, p=0.22. Two-way ANOVA, effect of genotype, F = 3.42, p=0.07, effect of sex, F = 0.479, p=0.49, interaction, F = 0.092, p=0.76. WT N = 12 males, 4 females. Het N = 9 males, 14 females. (F) Total time in open arms. Pearson’s normality test, statistic = 6.4703, p=0.040. Genotype rank-sum test for sex-adjusted values, U = −2.479, p=0.013. Rank-sum test for sex difference in Het mice, U = 0.6527, p=0.61. WT N = 12 males, 4 females. Het N = 10 males, 17 females. (G) Total time in center. Pearson’s normality test, statistic = 1.2337, p=0.54. Two-way ANOVA, effect of genotype, F = 3.06, p=0.087, effect of sex, F = 1.14, p=0.29, interaction, F = 0.50, p=0.48. WT N = 12 males, 4 females. Het N = 10 males, 17 females.
Figure 1—figure supplement 2
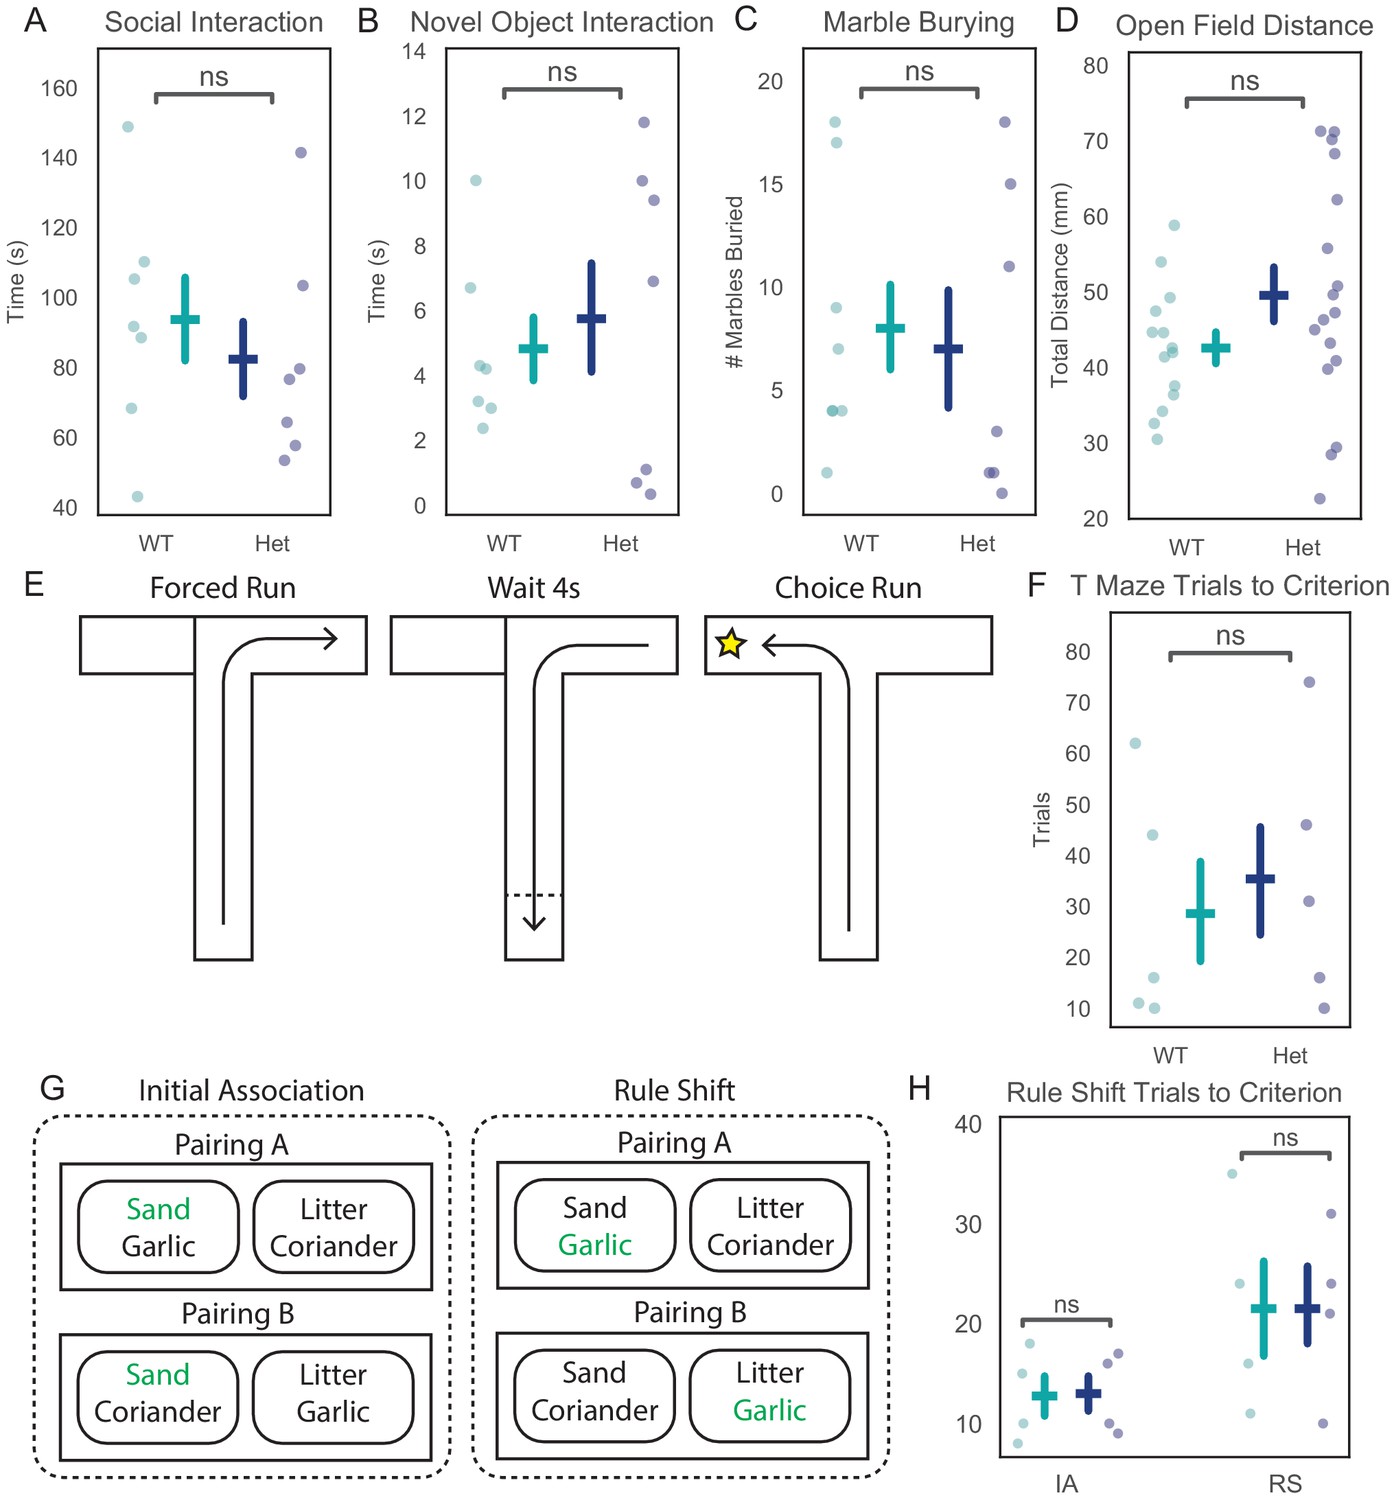
Other behavioral assays in Pogz+/- mice.
(A) Time that Pogz+/- mice or wild-type littermates spend interacting with a novel juvenile conspecific, U = 0.96, p=0.34. Wilcoxon rank sum, WT N = 7, Het N = 7. (B) Time that Pogz+/- mice or wild-type littermates spend interacting with a novel object, U = −0.063, p=0.95. Wilcoxon rank sum, WT N = 7, Het N = 7. (C) Number of marbles buried by Pogz+/- mice or wild-type littermates during 20 min, U = 0.7522, p=0.45. Wilcoxon rank sum, WT N = 8, Het N = 7. (D) Distance traveled in an open field by Pogz+/- mice or wild-type littermates, U = −1.4289, p=0.15. Wilcoxon rank sum, WT N = 14, Het N = 17. (E) Schematic of the T-maze delayed match to sample task. Mice must recall the direction of the forced run during the sample phase to successfully obtain reward from the opposite arm during the choice phase. (F) Number of trials Pogz+/- mice or wild-type littermates need to reach a learning criterion (80% accuracy) in the T-maze task, U = −0.5222, p=0.60. Wilcoxon rank sum, WT N = 5, Het N = 5. (G) Schematic of the odor-texture rule shift task. Mice must initially learn that a texture cue signals the location of a hidden food reward. Once they learn this initial rule, there is an extra-dimensional rule shift such that an odor now signals the reward location. (H) Number of trials Pogz+/- mice or wild-type littermates need to reach a learning criterion (80% accuracy) during the initial association or rule shift, IA: U = −0.1443, p=0.89; RS: U = 0.1443, p=0.89. Wilcoxon rank sum, WT N = 4, Het N = 4.
Figure 1—figure supplement 3
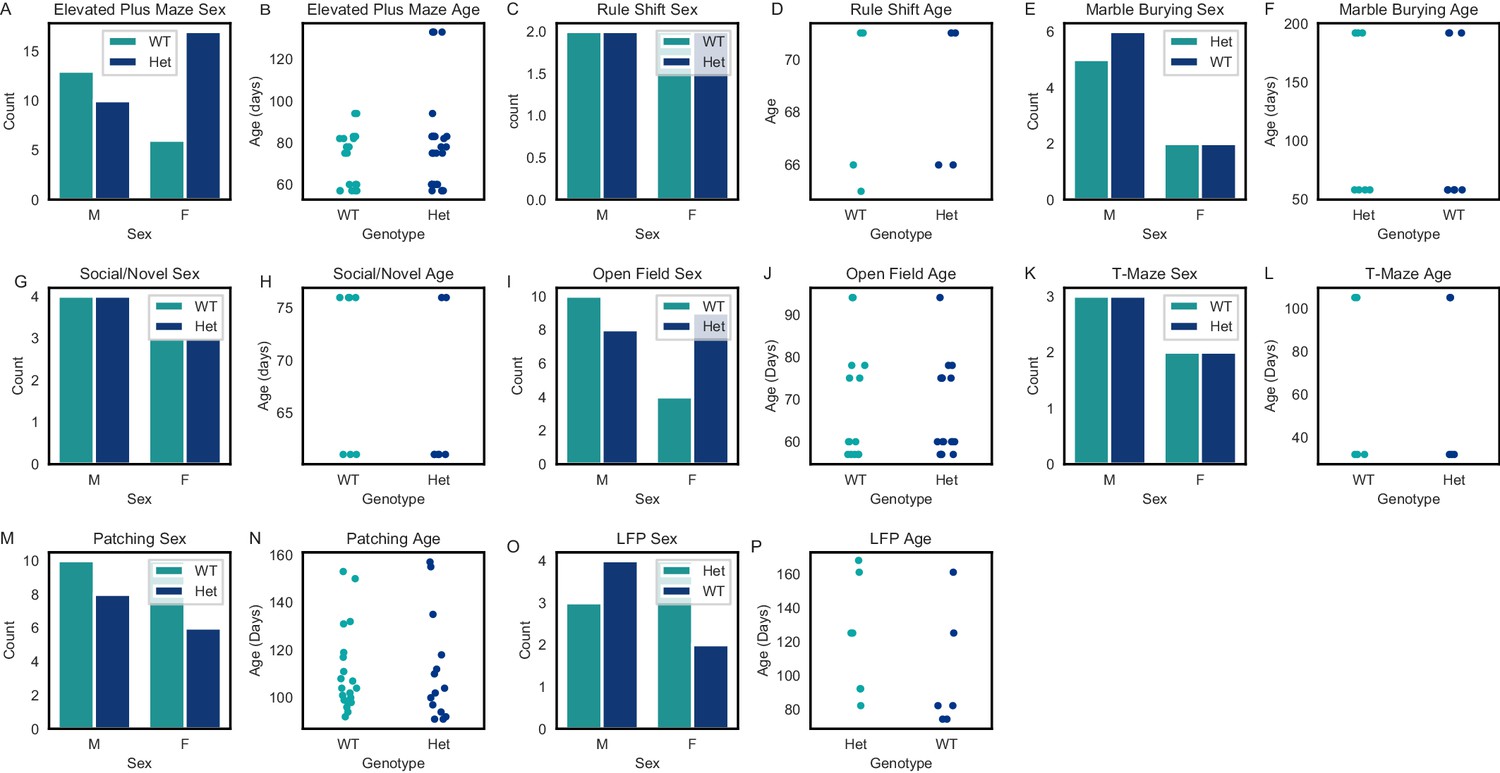
Distributions of sex and age for WT and Pogz Het mice used in all experiments.
Age and sex breakdown for all experimental animals; age listed at date of testing. (A) Elevated-plus maze (EPM) sex. WT males: 13, Het males: 10, WT females: 6, Het females: 17. (B) EPM age. WT: 72 ± 13 days, Het: 72 ± 22 days. (C) Rule shift sex. WT males: 3, Het males: 2, WT females: 2, Het females: 2. (D) Rule shift age. WT: 68 ± 3 days, Het: 68 ± 3 days. (E) Marble burying sex. WT males: 6, Het males: 5, WT females: 2, Het females: 2. (F) Marble burying age. WT: 108 ± 69 days, Het: 115 ± 72 days. (G) Social interaction and novel object exploration sex. WT males: 4, Het males: 4, WT females: 3, Het females: 3. (H) Social interaction and novel objection exploration age. WT: 69 ± 8 days, Het: 65 ± 7 days. (I) Open field sex. WT males: 10, Het males: 8, WT females: 4, Het females: 9. (J) Open field age. WT: 69 ± 14 days, Het: 67 ± 11 days. (K) T-maze sex. WT males: 3, Het males: 3, WT females: 2, Het females: 2. (L) T-maze age. WT: 61 ± 40 days, Het: 61 ± 40 days. (M) Patch clamp recordings sex. WT males: 10, Het males: 8, WT females: 10, Het females: 6. (N) Patch clamp recordings age. WT: 110 ± 18 days, Het: 11 ± 22 days. (O–P) Local field potential recordings sex. WT males: 4, Het males: 3, WT females: 2, Het females: 4. (P) Local field potential recordings age. WT: 99 ± 36 days, Het: 121 ± 34 days.
Figure 2 with 2 supplements
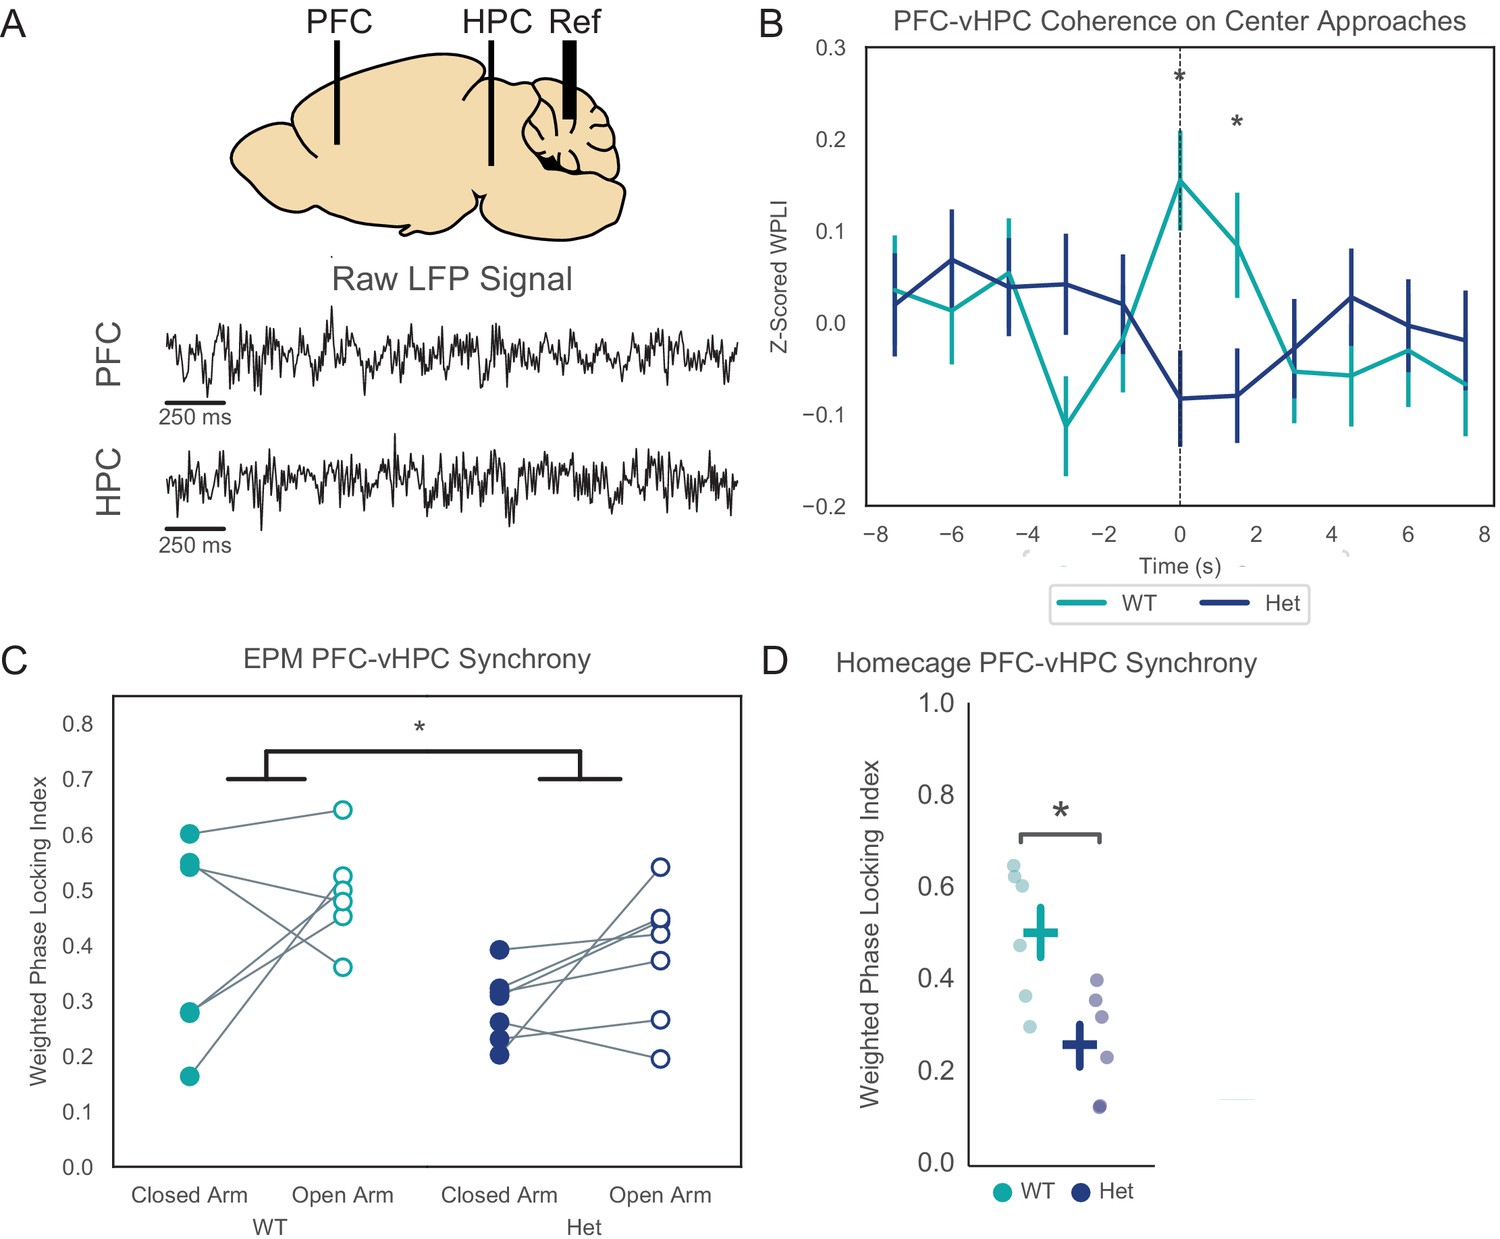
Pogz+/- mice have reduced vHPC-PFC theta synchrony both at baseline and in the elevated-plus maze (EPM).
(A) Recording schematic and examples of raw local field potential traces. (B) Z-scored theta band weighted-phase locking index (WPLI) as mice approach the center of the EPM. Linear mixed effects model using timepoint (−3,–1.5, 0, and +1.5 s relative to center zone entry), genotype, mouse, and timepoint X genotype interaction as fixed factors and individual run as a random factor, p=0.00039 for timepoint X genotype interaction, t-statistic = −3.55, DF = 2355 for fixed factors, n = 274 and 316 closed-center runs from 7 WT mice and 6 Het mice, respectively. Wilcoxon rank-sum test for t = 0: U = 3.3738, p=0.0007, for t = 1.5: U = 2.0275, p=0.043 (n = 274 closed-center runs from 7 WT mice and 316 from 6 Het mice). (C) Average theta band WPLI in the open vs. closed arms of the EPM. Two-way ANOVA including arm and genotype as factors - significant effect of genotype: p=0.03 (d.f. = 1, N = 6 WT and 7 Het mice, F = 5.66). (D) Theta band WPLI for mice in their homecages: U = 2.2417, p=0.031 (Wilcoxon rank-sum with N = 6 WT and 7 Het mice).
-
Figure 2—source data 1
Source data for Figure 2.
- https://cdn.elifesciences.org/articles/54835/elife-54835-fig2-data1-v2.csv
Figure 2—figure supplement 1
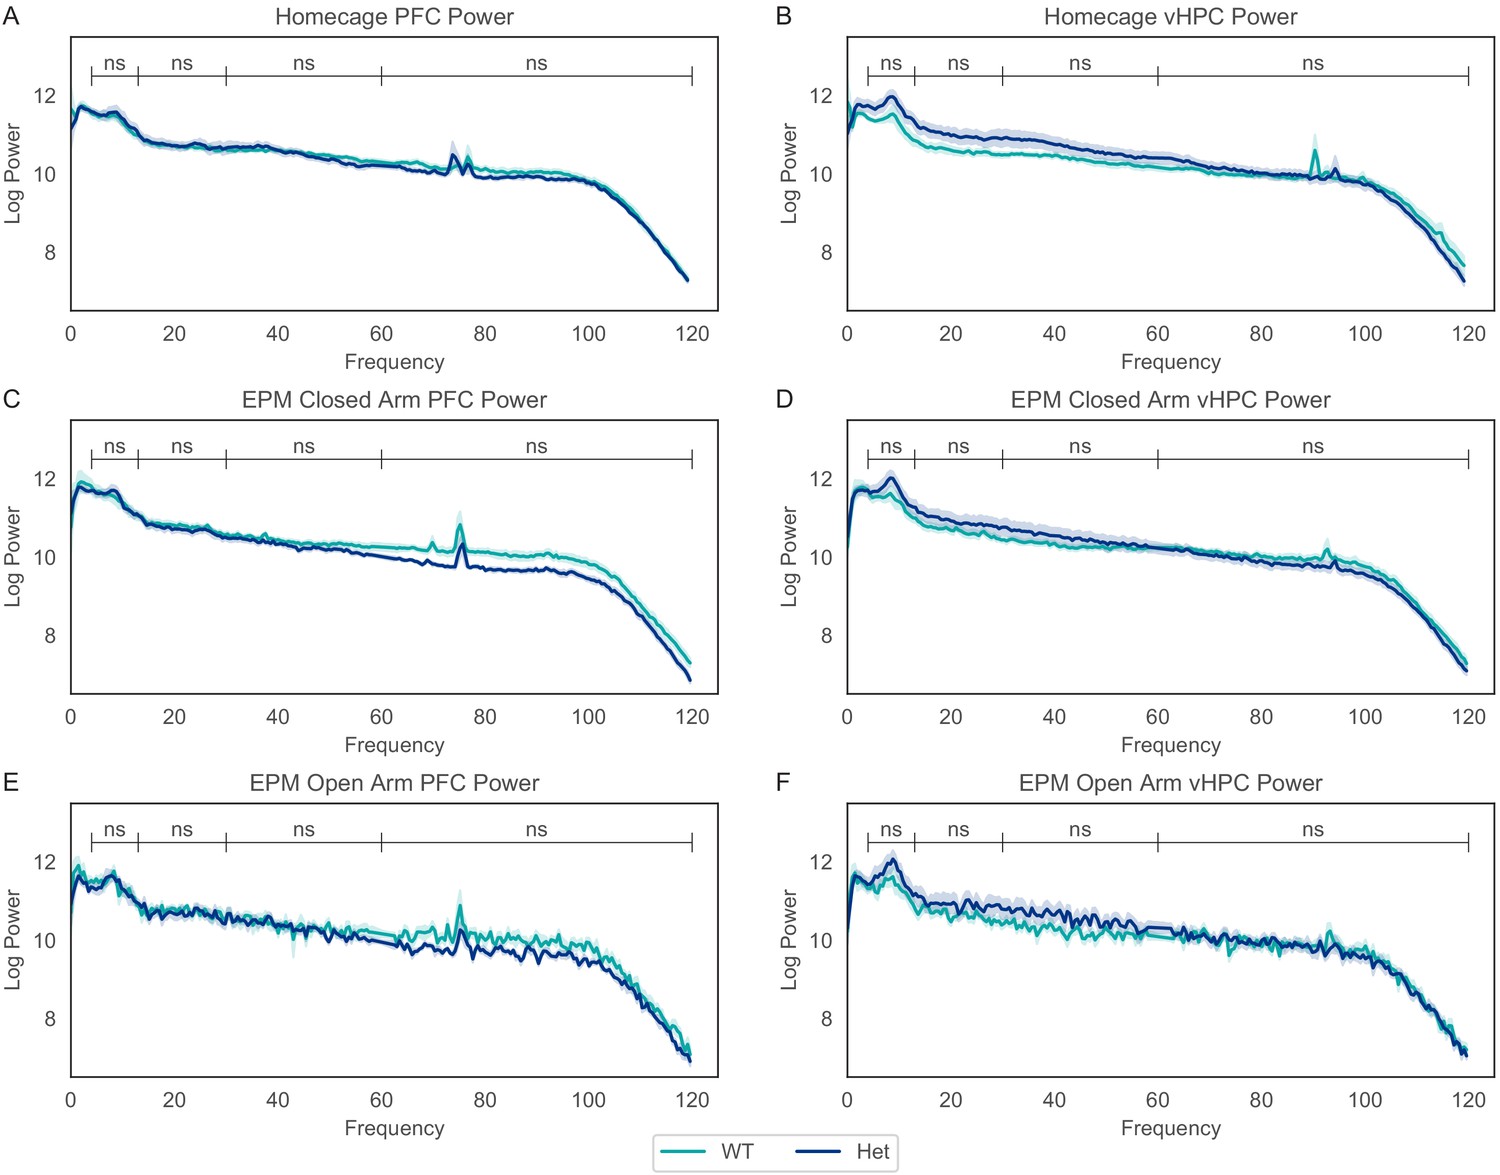
LFP power in various frequency bands in the vHPC and mPFC is not changed in Pogz+/- mice.
(A) mPFC LFP power in home cage: θ (4–12 Hz), U = −0.3202, p=0.81; β (12–30 Hz), U = 0, p=0.94; low γ (30–55 Hz), U = −0.801, p=0.47; high γ (65–100 Hz), U = −0.3202, p=0.8. (B) vHPC LFP power in the home cage: θ, U = −1.281, p=0.23; β, U = −1.761, p=0.093; low γ, U = −1.441, p=0.17; high γ, U = 0, p=0.94. (C) mPFC LFP power in EPM closed arm: θ, U = −0.142, p=0.88; β, U = 0, p=1.0; low γ, U = 1.285, p=0.20; high γ, U = 1.642, p=0.10. (D) vHPC LFP power in EPM closed arm: θ, U = −1.142, p=0.25; β, U = −1.428, p=0.15; low γ, U = −0.714, p=0.47; high γ, U = 0.1428, p=0.89. (E) mPFC LFP power in EPM open arm: θ, U = −0.142, p=0.89; β, U = −0.1428, p=0.89; low γ, U = 0, p=1.0; high γ, U = 1.428, p=0.15. (F) vHPC LFP power in EPM open arm: θ, U = −1.0, p=0.32; β, U = −1.285, p=0.20; low γ, U = −1.142, p=0.25; high γ, U = 0.0, p=1.0. All statistics from Wilcoxon Rank-Sum Tests, WT N = 6, Het N = 7.
Figure 2—figure supplement 2
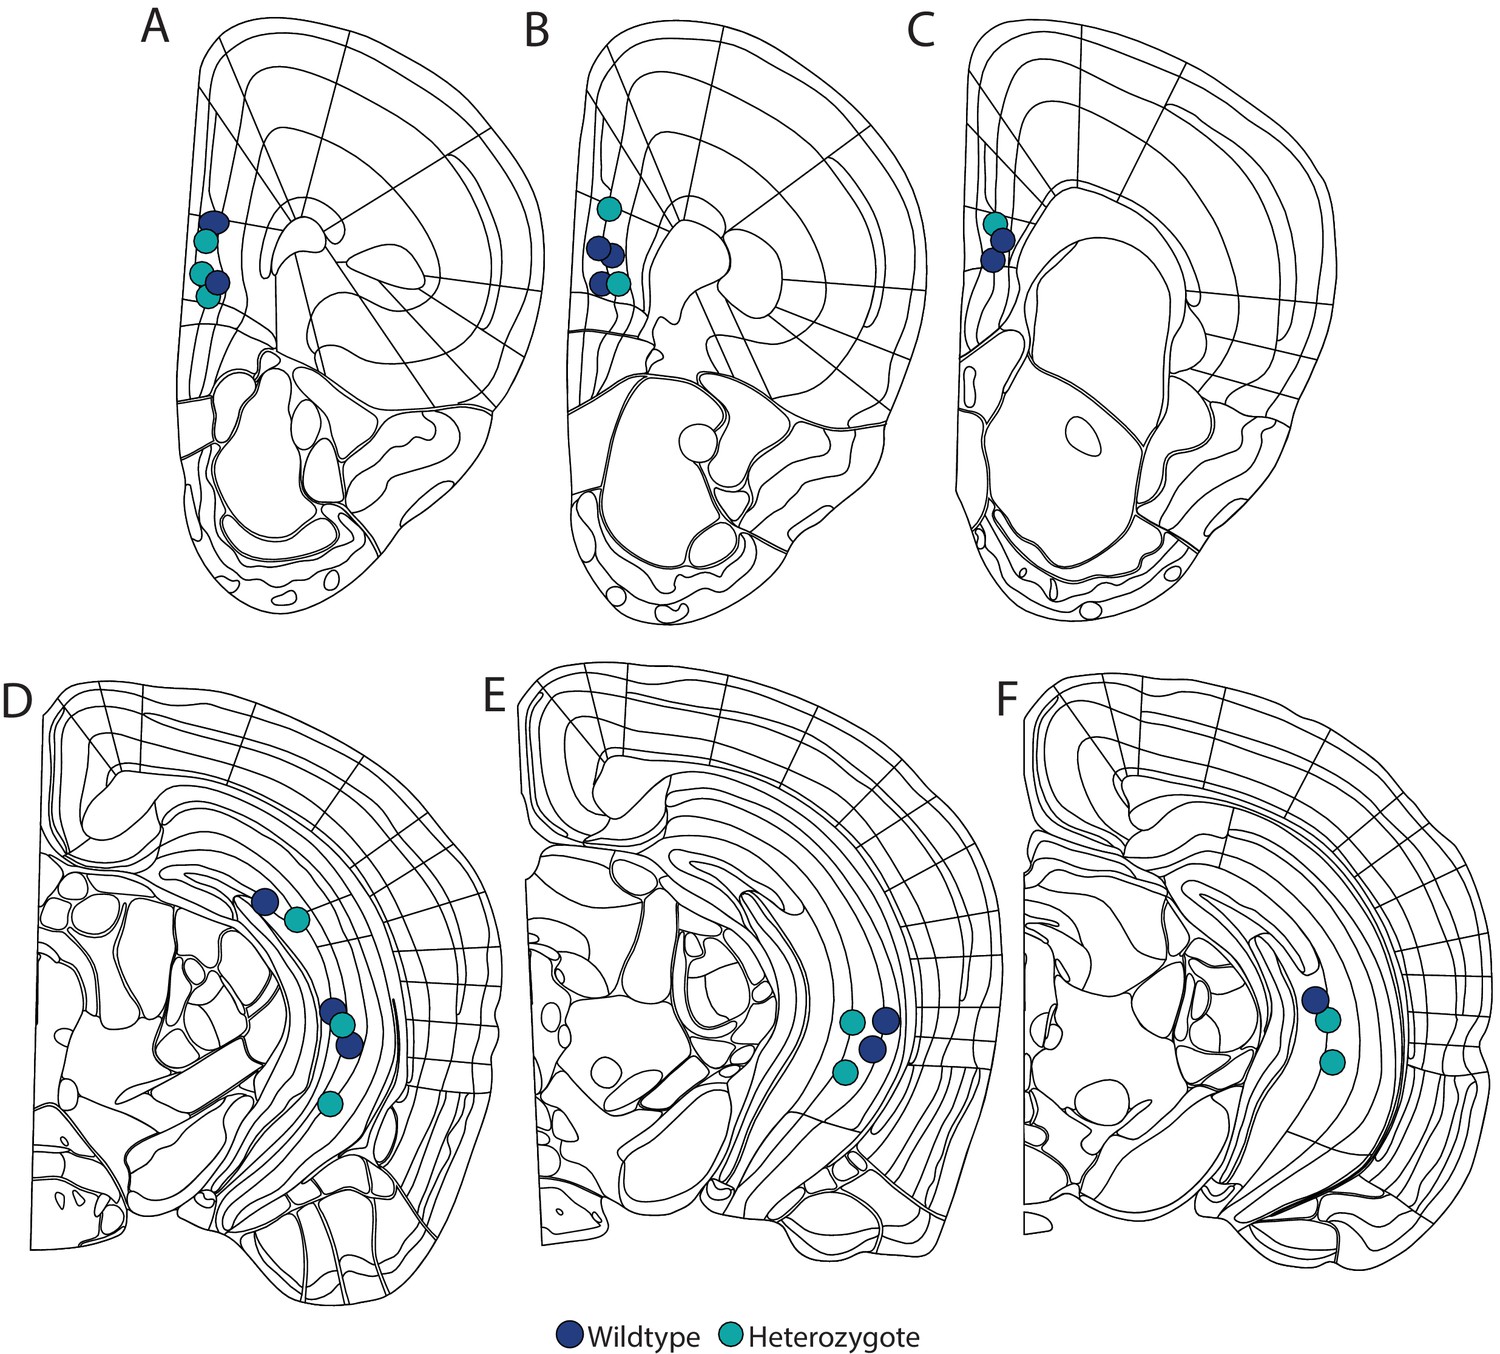
Location of LFP electrodes (A–C) mPFC electrode locations.
(A) AP 1.745, (B) AP 1.645, (C) AP 1.42. (D–F) vHPC electrode locations. (D) AP −2.78, (E) AP −2.98, (F) AP −3.18. Images from Allen Mouse Brain Atlas (Lein et al., 2007).
Figure 3 with 1 supplement
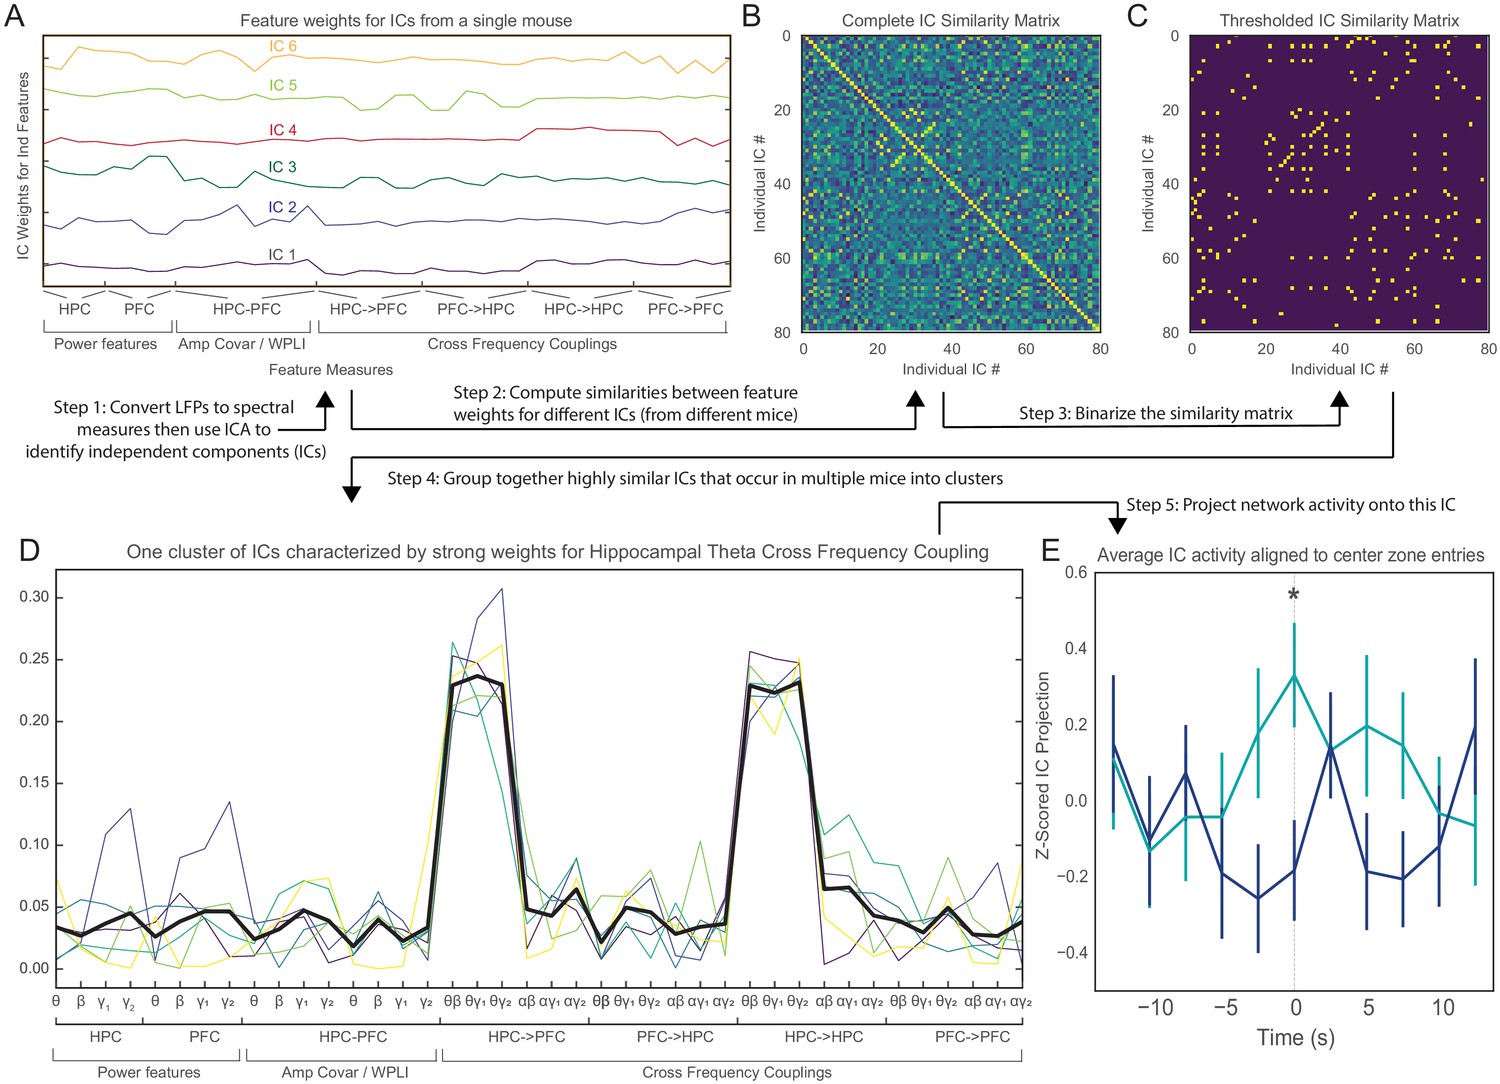
An unbiased, data-driven approach confirms that theta-frequency vHPC-mPFC communication is behaviorally-relevant and deficient in Pogz+/- mice.
(A) Example weight vectors showing how various LFP features (x-axis) contribute to different independent components (ICs) in one mouse. The y-axis shows the weight of each feature. (B) Correlation matrix showing the similarity of weight vectors corresponding to different ICs, from all mice. (C) Binarized version of the correlation matrix showing pairs of ICs that have a correlation coefficient > 0.7. (D) Example weights vectors (light, colored traces) for ICs from one cluster. This cluster is characterized by strong weights for cross-frequency coupling between vHPC theta activity and higher-frequency activity in either vHPC or mPFC. The bold black trace shows the average of these weight vector. (F) The projection of network activity onto the characteristic (averaged) weight vector (from E) as a function of time during approaches to the center of the EPM, for wild-type or Pogz+/- mice. As mice approach the center, activity in this characteristic IC rises sharply and reaches a peak in WT mice, but this is absent in Pogz+/- mice. Linear mixed effects model using timepoints (t = 0 vs. baseline based on the average of the first/last points), mouse, genotype, and timepoint X genotype interaction as fixed factors, and individual runs as random factors, timepoint X genotype interaction p=0.01, DF = 147, t-statistic = 2.60; Wilcoxon rank-sum test for t = 0: p=0.007, U = 2.6864; n = 39 closed-center-open runs from 6 WT mice and 37 runs from 7 Het mice.
Figure 3—figure supplement 1
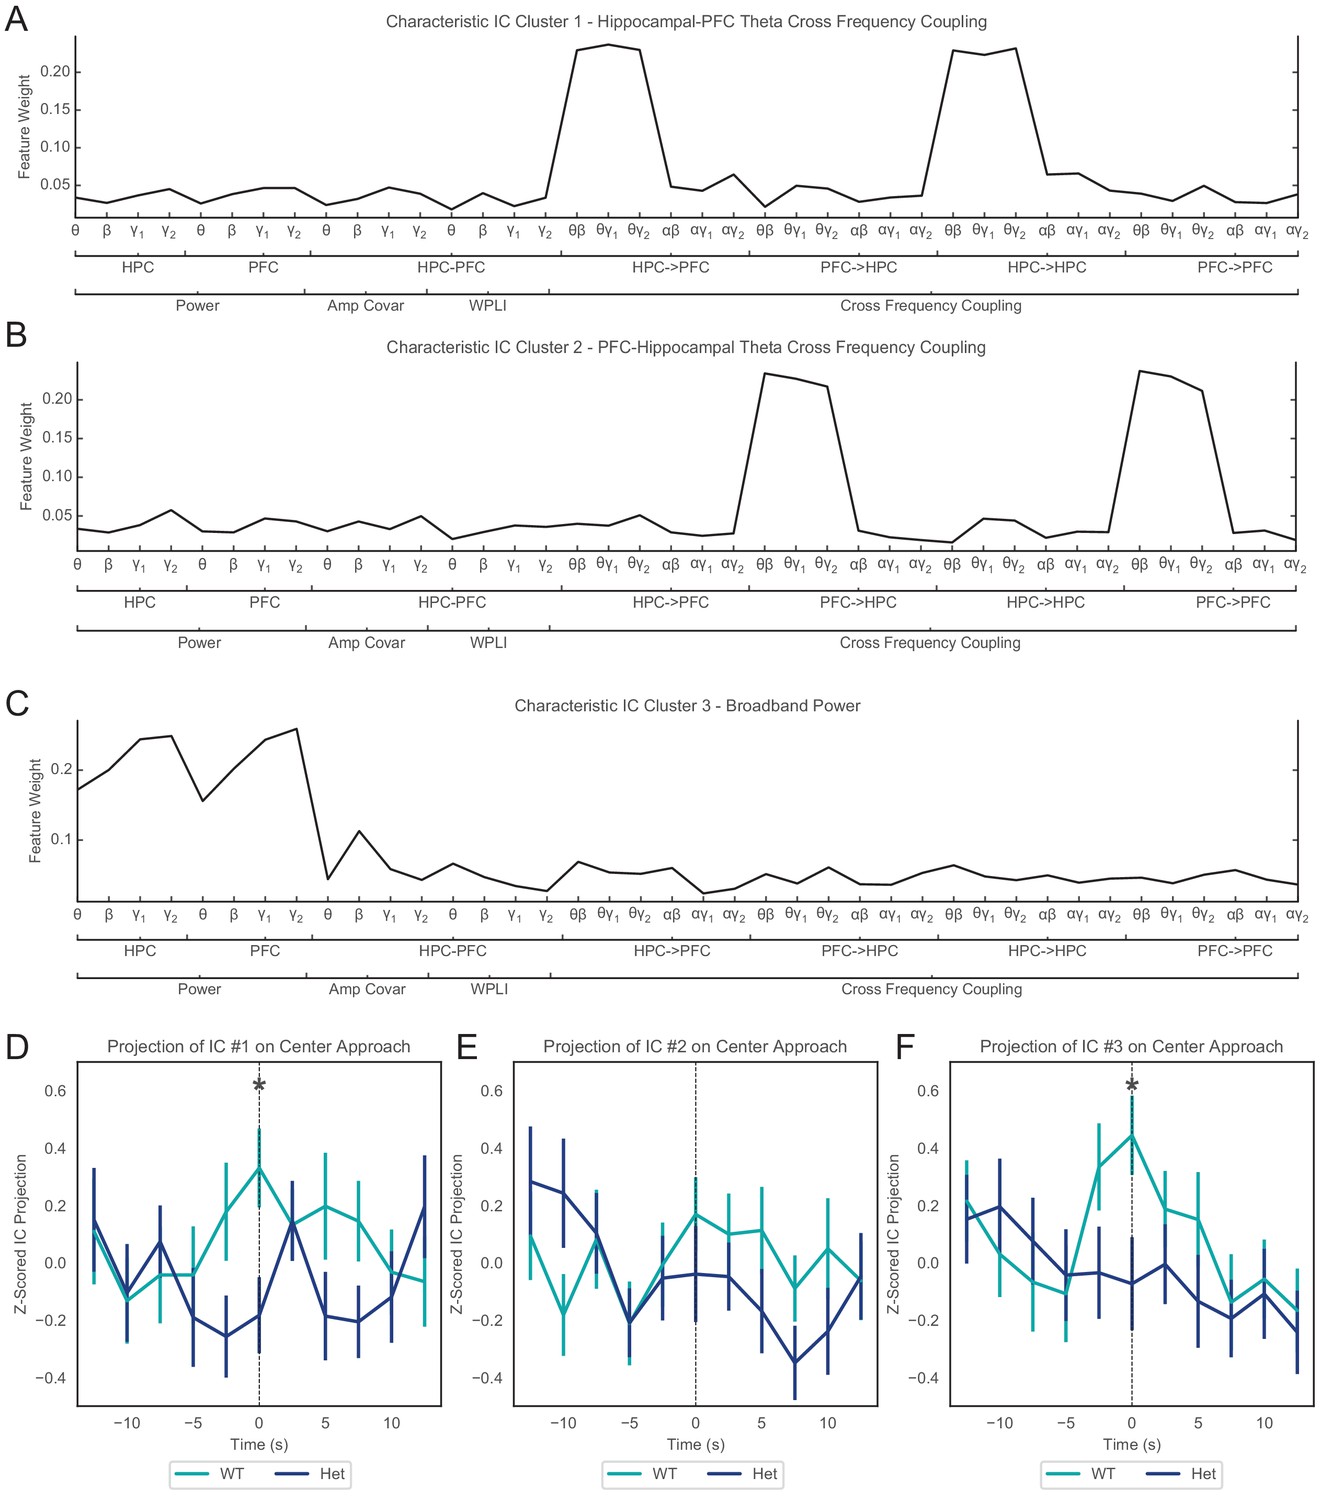
Activity in conserved independent components (ICs) during approaches to the center of the EPM.
(A–C) Weights for the three ICs that were conserved across mice, i.e., were defined by clusters of ICs that were from different mice but were very similar, as indicated by strong correlations (we averaged the weights of the individual ICs in each cluster to obtain the weights shown here). (A) Shows weights for the characteristic IC highlighted in Figure 3, which corresponds to cross-frequency phase-amplitude coupling between hippocampal-theta and beta or gamma activity in the hippocampus or PFC. The characteristic IC shown in (B) corresponds to cross-frequency phase-amplitude coupling between prefrontal theta and beta or gamma activity in the hippocampus or PFC. The characteristic IC shown in (C) corresponds to broadband power across all frequency bands in the hippocampus and PFC. (D–F) The projection of network activity onto each characteristic (averaged) weight vector (from A-C) as a function of time during approaches to the center of the EPM, for wild-type or Pogz+/- mice. The first and third characteristic ICs (panels D and F) both exhibit increased activity during center approaches in WT mice, but this increase was absent/deficient in Pogz mutant mice: U = 2.6864, p=0.007 and U = 2.4266, p=0.015 for IC #1 and IC #3, respectively, by Wilcoxon rank-sum test, n = 39 closed-center-open runs from 6 WT mice and 37 runs from 7 Het mice. Linear mixed effects model for IC #1 is described in Figure 3E. For IC #3, the same linear mixed effects model yields p=0.052 (t statistic = 1.96) for the timepoint X genotype interaction.
Figure 4 with 1 supplement
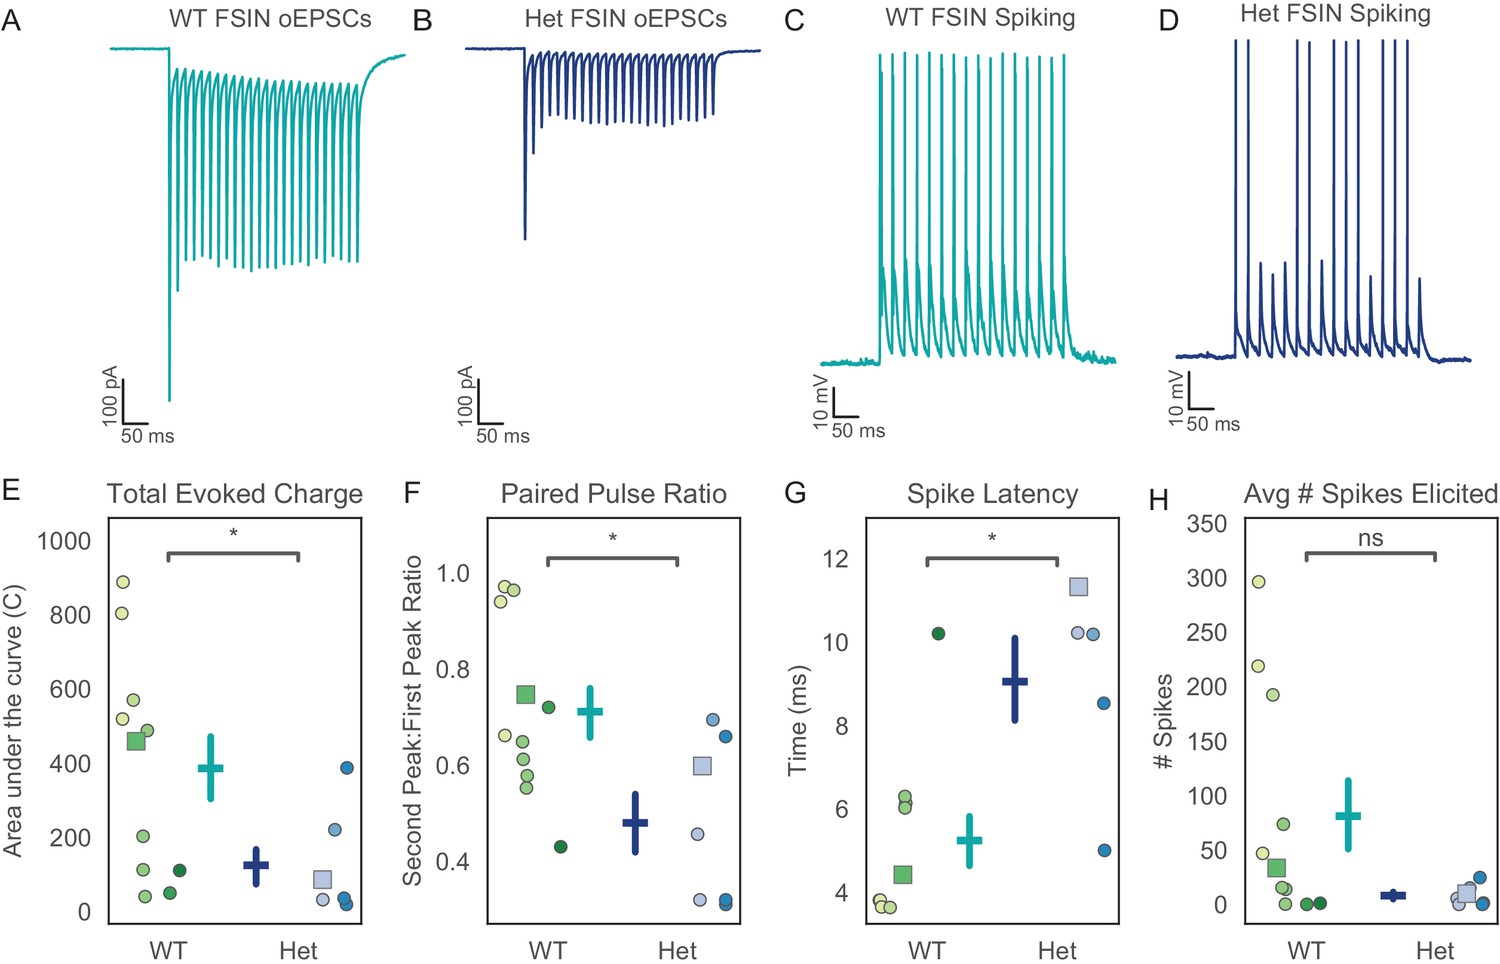
Excitatory hippocampal input to prefrontal fast-spiking interneurons (FSINs) is reduced in Pogz mutants.
(A, B) Representative examples of optically-evoked excitatory post-synaptic currents (oEPSCs) recorded from prefrontal FSINs in wildtype (A) or Pogz+/- mice (B). (C, D) Representative traces of optically-evoked excitatory post-synaptic potentials (oEPSPs) and action potentials recorded from FSINs in wildtype (C) or Pogz+/- mice (D). (E) The total oEPSC charge in FSINs is reduced in Pogz+/- mice, U = 2.7652, p=0.006. (F) The paired- pulse ratio (PPR) for oEPSCs is reduced in Pogz+/- FSINs, U = 2.128, p=0.03. (G) The latency of the first optically-evoked action potential is increased in Pogz+/- FSINs, U = −2.490, p=0.013. (H) The number of action potentials elicited by oEPSPs is non-significantly altered, U = 1.766, p=0.08. In E-H, different hues correspond to specific mice, and squares indicate datapoints from cells that were used for the representative traces shown in A-D. All p-values from Wilcoxon rank sum, WT N = 6 animals, n = 11 cells. Het N = 3 animals, n = 7 cells.
-
Figure 4—source data 1
Source data for Figure 4.
- https://cdn.elifesciences.org/articles/54835/elife-54835-fig4-data1-v2.csv
Figure 4—figure supplement 1
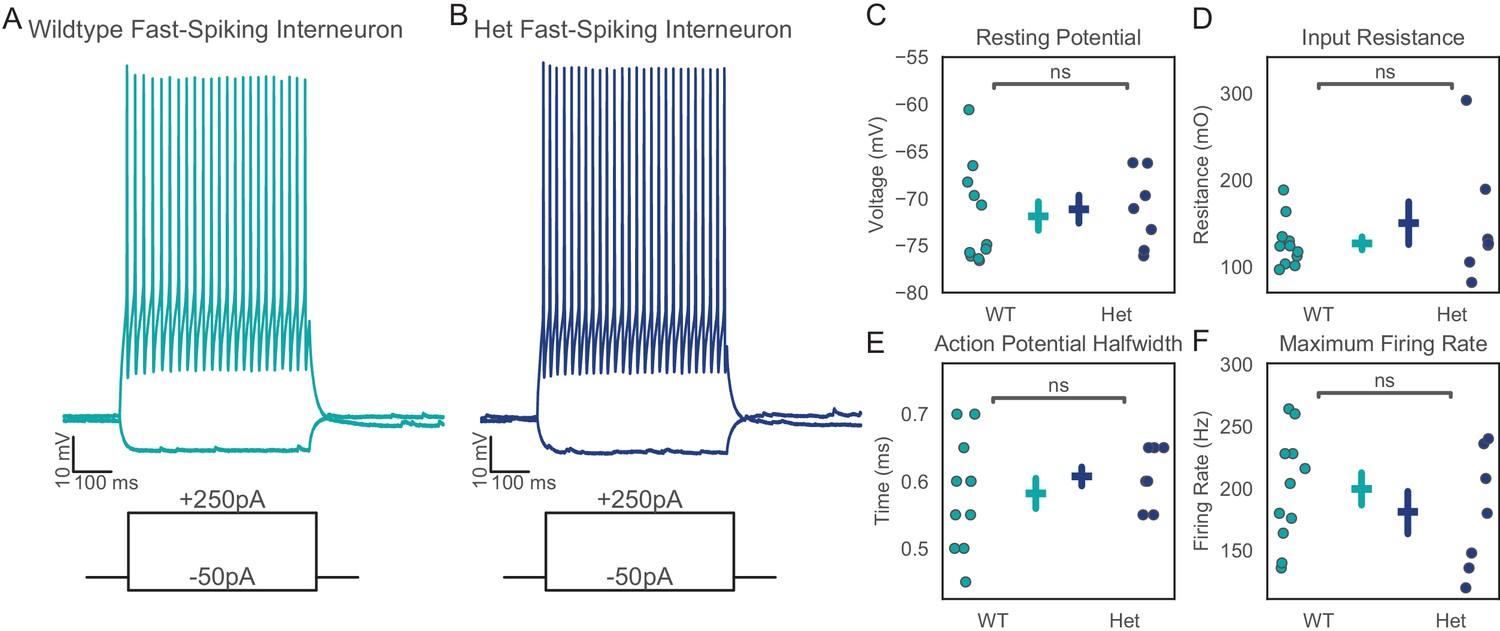
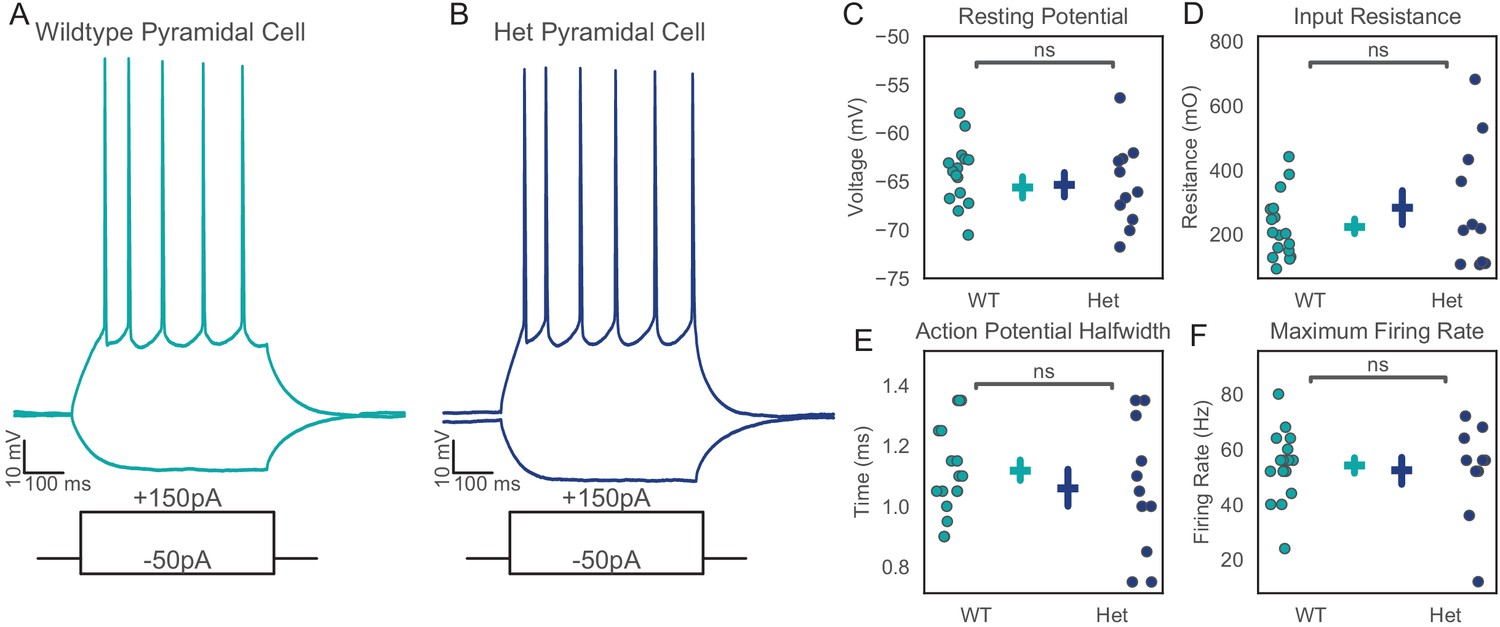
Intrinsic properties of prefrontal FSIN are not changed in Pogz+/- mice.
(A, B) Representative examples of FSIN responses to current injection in WT (left) or Pogz+/- (right) mice. (C) Membrane resting potential, U = −0.6792, p=0.50. (D) Input resistance, U = −0.7698, p=0.44. (E) Action potential halfwidth, U = −0.724, p=0.47. (F) Maximum firing rate, U = 0.6792, p=0.50. All p-values from Wilcoxon rank sum, WT N = 6 animals, n = 11 cells. Het N = 3 animals, n = 7 cells.
Figure 5 with 1 supplement
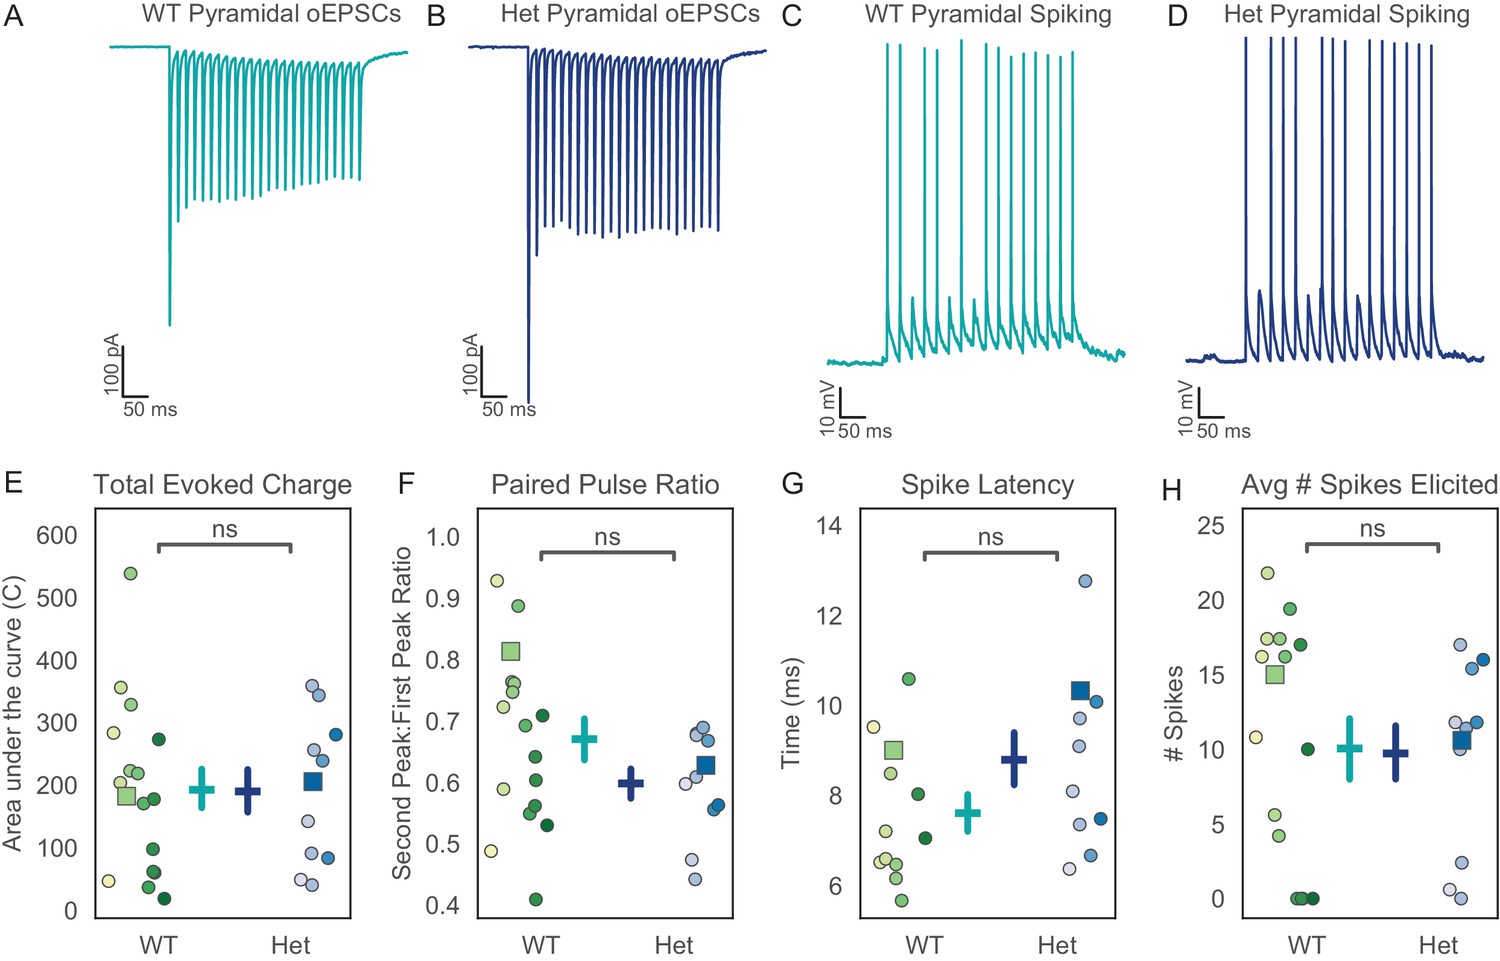
Excitatory hippocampal input to prefrontal pyramidal neurons is not changed in Pogz mutants.
(A, B) Representative examples of optically-evoked excitatory post-synaptic currents (oEPSCs) recorded from prefrontal pyramidal neurons in wildtype (A) or Pogz+/- mice (B). (C, D) Optically-evoked excitatory post-synaptic potentials (oEPSPs) and action potentials in wildtype (C) or Pogz+/- (D) pyramidal neurons. (E) Total oEPSC charge in pyramidal neurons, U = 1.0736, p=0.28. (F) Paired-pulse ratio for oEPSCs in pyramidal neurons, U = 1.4347, p=0.15 (G) Latency to first optically-evoked action potential in pyramidal neurons, U = −0.305, p=0.76. (H) Number of action potentials elicited by oEPSPs in pyramidal neurons, U = 0.2822, p=0.78. In E-H, different hues correspond to specific mice, and squares indicate datapoints from cells that were used for the representative traces shown in A-D. All p-values from Wilcoxon rank sum, WT N = 13 animals, n = 17 cells. Het N = 8 animals, n = 11 cells.
-
Figure 5—source data 1
Source data for Figure 5.
- https://cdn.elifesciences.org/articles/54835/elife-54835-fig5-data1-v2.csv
Figure 5—figure supplement 1
Pyramidal cell properties are not changed in Pogz+/-mice.
(A, B) Representative examples of pyramidal neuron responses to current injection in WT (left) or Pogz+/- (right) mice. (C) Membrane resting potential, U = 0.0705, p=0.94. (D) Input resistance, U = −0.258, p=0.80. (E) Action potential halfwidth, U = 0.7291, p=0.46. (F) Maximum firing rate, U = 0.0940, p=0.93. All p-values from Wilcoxon rank sum, WT N = 13 animals, n = 17 cells. Het N = 8 animals, n = 11 cells.
Figure 6 with 2 supplements
Reducing the excitatory drive onto prefrontal FSINs impairs the transmission of hippocampal inputs.
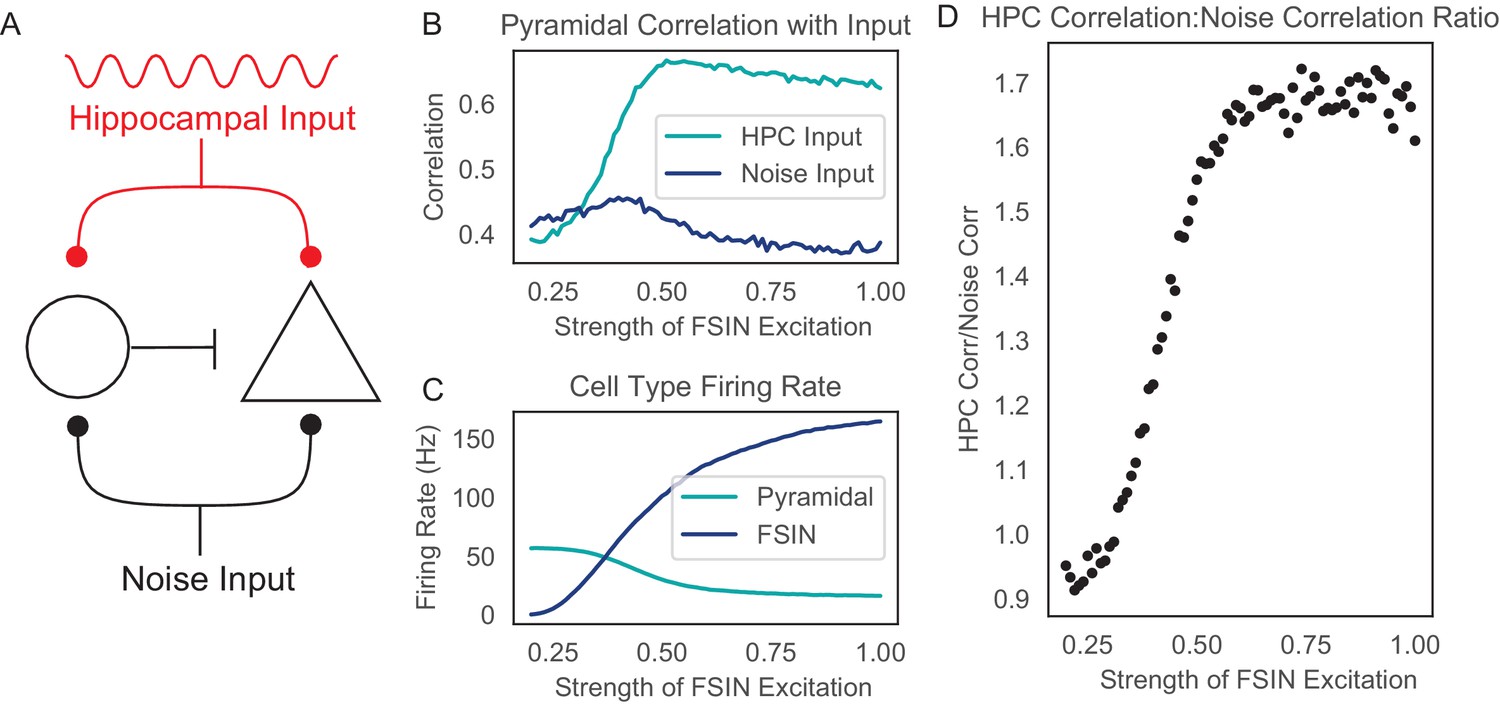
(A) Computational model schematic. Both a model pyramidal neuron (triangle) and a model FSIN (circle) receive simulated hippocampal input (which is rhythmically modulated at 8 Hz), and additional input which represents noise. (B) The correlation between the pyramidal neuron output spike rate and the rate of either noise inputs (dark blue) or hippocampal spikes (turquoise), as functions of a single parameter which represents how strongly hippocampal and noise inputs excite the model FSIN. (C) The spike rate of the model pyramidal neuron (turquoise) and FSIN (dark blue) as functions of a single parameter representing how strongly hippocampal and noise inputs excite the model FSIN. (D) The ratio of the correlation between pyramidal neuron output spikes and either hippocampal input or noise input.
Figure 6—figure supplement 1
Adding feedforward disinhibition does not change the relationship between inhibitory strength and hippocampal correlation.
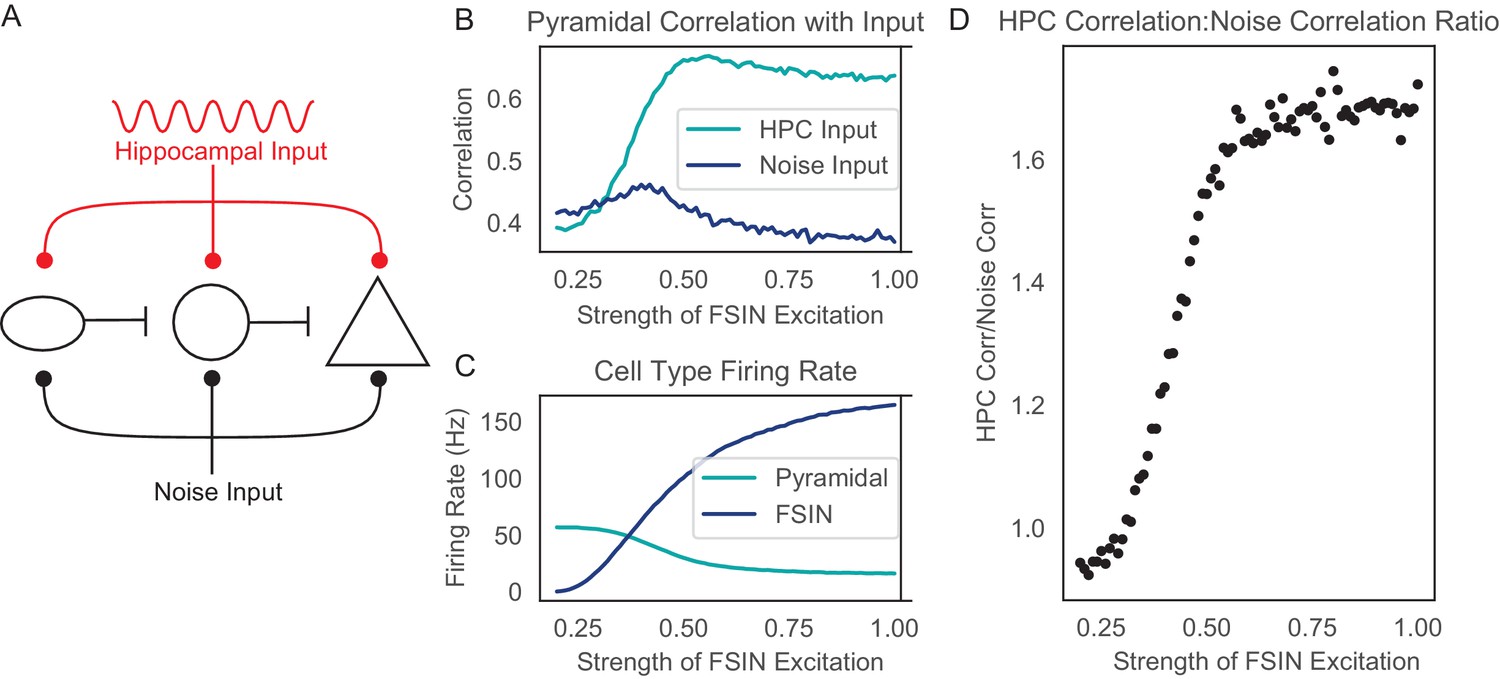
(A) Schematic of the computational model including cells and input sources. In comparison to the original model (Figure 6), this model includes an additional interneuron (ellipse) which receives feedforward excitation representing noise or hippocampal input. This new interneuron inhibits the first interneuron (circle), providing disinhibition. (B) The correlation between the pyramidal neuron output spike rate and the rate of either noise inputs (dark blue) or hippocampal spikes (turquoise), as functions of a single parameter which represents how strongly hippocampal and noise inputs excite the model FSIN. (C) The spike rate of the model pyramidal neuron (turquoise) and FSIN (dark blue) as functions of a single parameter representing how strongly hippocampal and noise inputs excite the model FSIN. (D) The ratio of the correlation between pyramidal neuron output spikes and either hippocampal input or noise input.
Figure 6—figure supplement 2
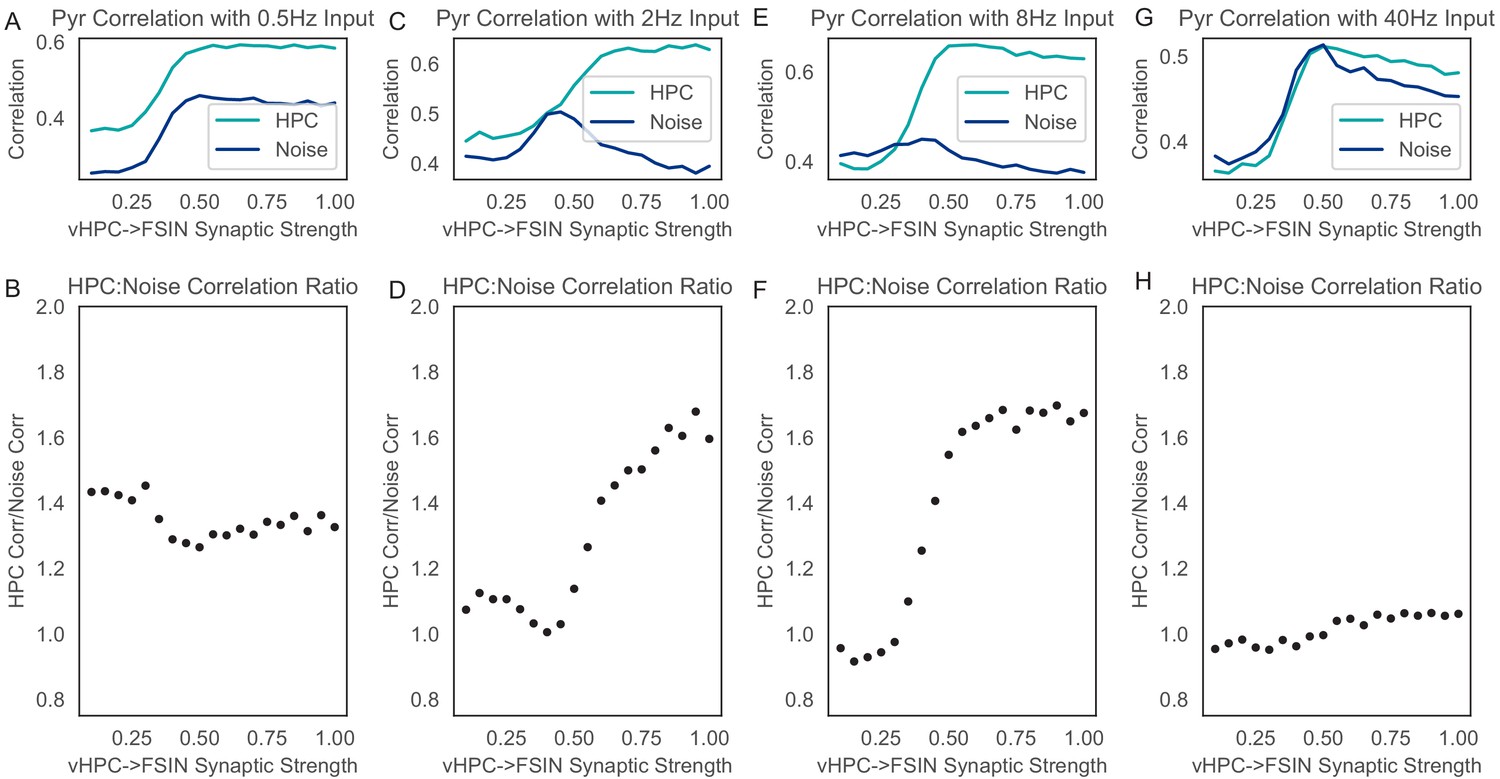
The effect of reducing inhibition on the transmission of signals across hippocampal-prefrontal synapses depends on the frequency of hippocampal input.
We simulated the same model shown in Figure 6 using non-rhythmic noise together with hippocampal input that varied sinusoidally at various-frequencies: 0.5 Hz (A, B), 2 Hz (C, D), 8 Hz (E, F), or 40 Hz (G, H). Similar to Figure 6 and Figure 6—figure supplement 1, we plotted the correlation between the pyramidal neuron output spike rate and the rate of either noise inputs (dark blue) or hippocampal spikes (turquoise), as functions of how strongly hippocampal and noise inputs excite the model FSIN. Inhibition serves to enhance the signal-to-noise ratio when hippocampal input is modulated at 2 or 8 Hz, but not for higher (40 Hz) or lower (0.5 Hz) frequencies.
Author response image 1

Tables
Table 1
Single frequency LFP measures used as features in PCA/ICA analysis.
| Measure | Region | Frequencies |
|---|---|---|
| Power | HPC | Theta (4–12 Hz) |
| Beta (13–30 Hz) | ||
| Low Gamma (30–55 Hz) | ||
| High Gamma (65–100 Hz) | ||
| PFC | Theta (4–12 Hz) | |
| Beta (13–30 Hz) | ||
| Low Gamma (30–55 Hz) | ||
| High Gamma (65–100 Hz) | ||
| Amplitude Covariation | HPC-PFC | Theta (4–12 Hz) |
| Beta (13–30 Hz) | ||
| Low Gamma (30–55 Hz) | ||
| High Gamma (65–100 Hz) | ||
| Weighted-Phase Locking | HPC-PFC | Theta (4–12 Hz) |
| Beta (13–30 Hz) | ||
| Low Gamma (30–55 Hz) |
-
High Gamma (65–100 Hz).
Table 2
Multiple frequency LFP measures used as features in PCA/ICA analysis.
| Measure | Regions | Frequencies |
|---|---|---|
| Cross-Frequency Coupling | HPC (low) → PFC (high) | Theta (2–6 Hz) → Beta (13–30 Hz) |
| Theta (2–6 Hz) → Low Gamma (30–55 Hz) | ||
| Theta (2–6 Hz) → High Gamma (65–100 Hz) | ||
| Alpha (6–10 Hz) → Beta (13–30 Hz) | ||
| Alpha (6–10 Hz) → Low Gamma (30–55 Hz) | ||
| Alpha (6–10 Hz) → High Gamma (65–100 Hz) | ||
| PFC (low) → HPC (high) | Theta (2–6 Hz) → Beta (13–30 Hz) | |
| Theta (2–6 Hz) → Low Gamma (30–55 Hz) | ||
| Theta (2–6 Hz) → High Gamma (65–100 Hz) | ||
| Alpha (6–10 Hz) → Beta (13–30 Hz) | ||
| Alpha (6–10 Hz) → Low Gamma (30–55 Hz) | ||
| Alpha (6–10 Hz) → High Gamma (65–100 Hz) | ||
| HPC (low) → HPC (high) | Theta (2–6 Hz) → Beta (13–30 Hz) | |
| Theta (2–6 Hz) → Low Gamma (30–55 Hz) | ||
| Theta (2–6 Hz) → High Gamma (65–100 Hz) | ||
| Alpha (6–10 Hz) → Beta (13–30 Hz) | ||
| Alpha (6–10 Hz) → Low Gamma (30–55 Hz) | ||
| Alpha (6–10 Hz) → High Gamma (65–100 Hz) | ||
| PFC (low) → PFC (high) | Theta (2–6 Hz) → Beta (13–30 Hz) | |
| Theta (2–6 Hz) → Low Gamma (30–55 Hz) | ||
| Theta (2–6 Hz) → High Gamma (65–100 Hz) | ||
| Alpha (6–10 Hz) → Beta (13–30 Hz) | ||
| Alpha (6–10 Hz) → Low Gamma (30–55 Hz) |
-
Alpha (6–10 Hz) → High Gamma (65–100 Hz).
Key resources table
| Reagent type (species) or resource | Designation | Source or reference | Identifiers | Additional information |
|---|---|---|---|---|
| Strain, strain background (Mus. Musculus) | C57BL6/J | Jackson Labs | Stock No: 000664 | |
| Genetic reagent (Mus. Musculus) | PogZ+/- | Rubenstein Lab | ||
| Recombinant DNA reagent | AAV5-CaMKIIa-hChR2(H134R)-EYFP | UNC Vector Core | RRID:Addgene_26969 | |
| Recombinant DNA reagent | AAV5-DlxI12b-mCherry | Virovek, Sohal lab | ||
| Software, algorithm | Sirenia Acquisition | Pinnacle | RRID:SCR_016183 | |
| Software, algorithm | ANY-maze tracking software | ANY-maze | RRID:SCR_014289 | |
| Software, algorithm | Python | Python | RRID:SCR_008394 | Packages: Numpy, Scipy, Matplotlib, Seaborn |
| Software, algorithm | MATLAB | Mathworks | RRID:SCR_001622 | Signal Processing Toolbox |
| Software, algorithm | PClamp | Molecular Devices | RRID:SCR_011323 |
Table 3
Details of all statistical tests N indicates biological replicates for example individual cells or behavior trials.
| Figure | Data | Test | P val | WT Animals | Het Animals | WT n | Het n |
|---|---|---|---|---|---|---|---|
| Figure 1C | Zone occupancy | Wilcoxon rank sum | 0.003 | 18 | 27 | ||
| Figure 1D | EPM Distance | Wilcoxon rank sum | 0.35 | 16 | 23 | ||
| Figure 1E | Open time | Wilcoxon rank sum | 0.001 | 18 | 27 | ||
| Figure 1E | Center time | Wilcoxon rank sum | 0.02 | 18 | 27 | ||
| Figure 1F | Head dips | Wilcoxon rank sum | 0.03 | 14 | 14 | ||
| Figure 1G | Open entries | Wilcoxon rank sum | 0.32 | 16 | 23 | ||
| Figure 1H | Open visit | Wilcoxon rank sum | 0.047 | 16 | 23 | ||
| Figure 2B | WPLI, t = 0 | Wilcoxon rank sum | 0.0007 | 6 | 7 | 274 | 316 |
| Figure 2B | WPLI, t = 1.5 | Wilcoxon rank sum | 0.043 | 6 | 7 | 274 | 316 |
| Figure 2B | WPLI, t = −3,–1.5, 0, +1.5 during closed-center runs | Linear mixed effects model timepoint mouse genotype timept X genotype | 0.0026 0.47 0.059 0.0004 | 6 | 7 | 274 | 316 |
| Figure 2C | Avg zone WPLI, genotype | Two-way ANOVA | 0.03 | 6 | 7 | ||
| Figure 2C | Avg zone WPLI, zone | Two-way ANOVA | 0.063 | 6 | 7 | ||
| Figure 2C | Avg zone WPLI, interaction | Two-way ANOVA | 0.98 | 6 | 7 | ||
| Figure 2D | Theta WPLI | Wilcoxon rank sum | 0.031 | 6 | 7 | ||
| Figure 3E | IC zone projection, t = 0 | Wilcoxon rank sum | 0.007 | 6 | 7 | 39 | 37 |
| Figure 3E | ICA zone projection t = 0 vs. baseline (average of first and last timepoints) during closed-center-open runs | Linear mixed effects model timepoint mouse genotype timept X genotype | 0.085 0.16 0.0044 0.010 | 6 | 7 | 39 | 37 |
| Figure 4E | FSIN charge | Wilcoxon rank sum | 0.006 | 6 | 3 | 11 | 7 |
| Figure 4F | FSIN PPR | Wilcoxon rank sum | 0.03 | 6 | 3 | 11 | 7 |
| Figure 4G | FSIN latency | Wilcoxon rank sum | 0.013 | 6 | 3 | 11 | 7 |
| Figure 4H | FSIN # spikes | Wilcoxon rank sum | 0.08 | 6 | 3 | 11 | 7 |
| Figure 5E | Pyr charge | Wilcoxon rank sum | 0.28 | 13 | 8 | 17 | 11 |
| Figure 5F | Pyr PPR | Wilcoxon rank sum | 0.15 | 13 | 8 | 17 | 11 |
| Figure 5G | Pyr latency | Wilcoxon rank sum | 0.76 | 13 | 8 | 17 | 11 |
| Figure 5H | Pyr # spikes | Wilcoxon rank sum | 0.78 | 13 | 8 | 17 | 11 |
| Figure 1—figure supplement 1 | Sex-corrected zone occupancy | Wilcoxon rank sum | 0.013 | 18 | 27 | ||
| Figure 1—figure supplement 1A | Zone occupancy for Het M vs. F | Wilcoxon rank sum | 0.60 | M: 10, F: 17 | |||
| Figure 1—figure supplement 1B | Sex-corrected EPM distance | Wilcoxon rank sum | 0.79 | 16 | 23 | ||
| Figure 1—figure supplement 1C | Head dips: genotype | 2-way ANOVA | 0.02 | M: 10, F: 4 | M: 8, F: 6 | ||
| Figure 1—figure supplement 1C | Head dips: sex | 2-way ANOVA | 0.81 | M: 10, F: 4 | M: 8, F: 6 | ||
| Figure 1—figure supplement 1C | Head dips: genotype X sex | 2-way ANOVA | 0.36 | M: 10, F: 4 | M: 8, F: 6 | ||
| Figure 1—figure supplement 1C | Head dips for Het M vs. F | Wilcoxon rank sum | 0.54 | M: 8, F: 6 | |||
| Figure 1—figure supplement 1D | Open arm entries: genotype | 2-way ANOVA | 0.22 | M: 12, F: 4 | M: 9, F: 14 | ||
| Figure 1—figure supplement 1D | Open arm entries: sex | 2-way ANOVA | 0.61 | M: 12, F: 4 | M: 9, F: 14 | ||
| Figure 1—figure supplement 1D | Open entries: genotype X sex | 2-way ANOVA | 0.32 | M: 12, F: 4 | M: 9, F: 14 | ||
| Figure 1—figure supplement 1E | Open visit length: genotype | 2-way ANOVA | 0.22 | M: 12, F: 4 | M: 9, F: 14 | ||
| Figure 1—figure supplement 1E | Open visit length: sex | 2-way ANOVA | 0.49 | M: 12, F: 4 | M: 9, F: 14 | ||
| Figure 1—figure supplement 1E | Open visit length: genotype X sex | 2-way ANOVA | 0.76 | M: 12, F: 4 | M: 9, F: 14 | ||
| Figure 1—figure supplement 1F | Sex-corrected open arm time | Wilcoxon rank sum | 0.013 | 16 | 23 | ||
| Figure 1—figure supplement 1F | Open arm time: Het M vs. F | Wilcoxon rank sum | 0.61 | M: 10, F: 17 | |||
| Figure 1—figure supplement 1G | Center time: genotype | 2-way ANOVA | 0.087 | M: 12, F: 6 | M: 10, F: 17 | ||
| Figure 1—figure supplement 1G | Center time: sex | 2-way ANOVA | 0.29 | M: 12, F: 6 | M: 10, F: 17 | ||
| Figure 1—figure supplement 1G | Center time: genotype X sex | 2-way ANOVA | 0.48 | M: 12, F: 6 | M: 10, F: 17 | ||
| Figure 1—figure supplement 2A | Social interaction | Wilcoxon rank sum | 0.34 | 7 | 7 | ||
| Figure 1—figure supplement 2B | Novel objection | Wilcoxon rank sum | 0.95 | 7 | 7 | ||
| Figure 1—figure supplement 2C | Marble burying | Wilcoxon rank sum | 0.45 | 8 | 7 | ||
| Figure 1—figure supplement 2D | OF distance | Wilcoxon rank sum | 0.15 | 14 | 17 | ||
| Figure 1—figure supplement 2F | T-maze trials | Wilcoxon rank sum | 0.6 | 5 | 5 | ||
| Figure 1—figure supplement 2H | Rule shift IA | Wilcoxon rank sum | 0.89 | 4 | 4 | ||
| Figure 1—figure supplement 2H | Rule shift RS | Wilcoxon rank sum | 0.89 | 4 | 4 | ||
| Figure 2—figure supplement 1A | PFC theta power | Wilcoxon rank sum | 0.91 | 6 | 7 | ||
| Figure 2—figure supplement 1A | PFC beta power | Wilcoxon rank sum | 0.94 | 6 | 7 | ||
| Figure 2—figure supplement 1A | PFC low gamma power | Wilcoxon rank sum | 0.47 | 6 | 7 | ||
| Figure 2—figure supplement 1A | PFC high gamma power | Wilcoxon rank sum | 0.8 | 6 | 7 | ||
| Figure 2—figure supplement 1B | HPC Theta power | Wilcoxon rank sum | 0.23 | 6 | 7 | ||
| Figure 2—figure supplement 1B | HPC Beta power | Wilcoxon rank sum | 0.093 | 6 | 7 | ||
| Figure 2—figure supplement 1B | HPC low gamma power | Wilcoxon rank sum | 0.17 | 6 | 7 | ||
| Figure 2—figure supplement 1B | HPC high gamma power | Wilcoxon rank sum | 0.94 | 6 | 7 | ||
| Figure 2—figure supplement 1C | PFC closed theta power | Wilcoxon rank sum | 0.88 | 6 | 7 | ||
| Figure 2—figure supplement 1C | PFC closed beta power | Wilcoxon rank sum | 1 | 6 | 7 | ||
| Figure 2—figure supplement 1C | PFC closed LG power | Wilcoxon rank sum | 0.29 | 6 | 7 | ||
| Figure 2—figure supplement 1C | PFC closed HG power | Wilcoxon rank sum | 0.1 | 6 | 7 | ||
| Figure 2—figure supplement 1D | HPC closed theta power | Wilcoxon rank sum | 0.25 | 6 | 7 | ||
| Figure 2—figure supplement 1D | HPC closed beta power | Wilcoxon rank sum | 0.15 | 6 | 7 | ||
| Figure 2—figure supplement 1D | HPC closed LG power | Wilcoxon rank sum | 0.48 | 6 | 7 | ||
| Figure 2—figure supplement 1D | HPC closed HG power | Wilcoxon rank sum | 0.89 | 6 | 7 | ||
| Figure 2—figure supplement 1E | PFC open theta power | Wilcoxon rank sum | 0.89 | 6 | 7 | ||
| Figure 2—figure supplement 1E | PFC open beta power | Wilcoxon rank sum | 0.89 | 6 | 7 | ||
| Figure 2—figure supplement 1E | PFC open LG power | Wilcoxon rank sum | 1 | 6 | 7 | ||
| Figure 2—figure supplement 1E | PFC open HG power | Wilcoxon rank sum | 0.15 | 6 | 7 | ||
| Figure 2—figure supplement 1F | HPC open theta power | Wilcoxon rank sum | 0.32 | 6 | 7 | ||
| Figure 2—figure supplement 1F | HPC open beta power | Wilcoxon rank sum | 0.2 | 6 | 7 | ||
| Figure 2—figure supplement 1F | HPC open LG power | Wilcoxon rank sum | 0.25 | 6 | 7 | ||
| Figure 2—figure supplement 1F | HPC open HG power | Wilcoxon rank sum | 1 | 6 | 7 | ||
| Figure 3—figure supplement 1D | IC #1 zone projection | Wilcoxon rank sum | 0.007 | 6 | 7 | 39 | 37 |
| Figure 3—figure supplement 1D | IC #1 zone projection t = 0 vs. baseline (average of first and last timepoints) during closed-center-open runs | Linear mixed effects model timepoint mouse genotype timept X genotype | 0.085 0.16 0.0044 0.010 | 6 | 7 | 39 | 37 |
| Figure 3—figure supplement 1F | IC #3 zone projection | Wilcoxon rank sum | 0.015 | 6 | 7 | 39 | 37 |
| Figure 3—figure supplement 1F | IC #3 zone projection t = 0 vs. baseline (average of first and last timepoints) during closed-center-open runs | Linear mixed effects model timepoint mouse genotype timept X genotype | 0.0094 0.50 0.026 0.052 | 6 | 7 | 39 | 37 |
| Figure 4—figure supplement 1C | FSIN resting potential | Wilcoxon rank sum | 0.50 | 6 | 3 | 11 | 7 |
| Figure 4—figure supplement 1D | FSIN input resistance | Wilcoxon rank sum | 0.44 | 6 | 3 | 11 | 7 |
| Figure 4—figure supplement 1E | FSIN halfwidth | Wilcoxon rank sum | 0.47 | 6 | 3 | 11 | 7 |
| Figure 4—figure supplement 1F | FSIN max firing rate | Wilcoxon rank sum | 0.50 | 6 | 3 | 11 | 7 |
| Figure 5—figure supplement 1C | Pyr resting potential | Wilcoxon rank sum | 0.94 | 13 | 8 | 17 | 11 |
| Figure 5—figure supplement 1D | Pyr input resistance | Wilcoxon rank sum | 0.80 | 13 | 8 | 17 | 11 |
| Figure 5—figure supplement 1E | Pyr halfwidth | Wilcoxon rank sum | 0.46 | 13 | 8 | 17 | 11 |
| Figure 5—figure supplement 1F | Pyr max firing rate | Wilcoxon rank sum | 0.93 | 13 | 8 | 17 | 11 |
Additional files
Download links
A two-part list of links to download the article, or parts of the article, in various formats.
Downloads (link to download the article as PDF)
Open citations (links to open the citations from this article in various online reference manager services)
Cite this article (links to download the citations from this article in formats compatible with various reference manager tools)
Altered hippocampal-prefrontal communication during anxiety-related avoidance in mice deficient for the autism-associated gene Pogz
eLife 9:e54835.
https://doi.org/10.7554/eLife.54835


