Tumor control via targeting PD-L1 with chimeric antigen receptor modified NK cells
- Translational Tumor Immunology Program, National Institute on Deafness and Other Communication Disorders, National Institutes of Health, United States
- Tumor Biology Section, National Institute on Deafness and Other Communication Disorders, National Institutes of Health, United States
- Laboratory of Tumor Immunology and Biology, National Cancer Institute, National Institutes of Health, United States
- Genitourinary Malignancies Branch, National Cancer Institute, National Institutes of Health, United States
- NantKWest, United States
- Department of Otolaryngology-Head and Neck Surgery, Johns Hopkins School of Medicine, United States
Figures
Figure 1 with 3 supplements
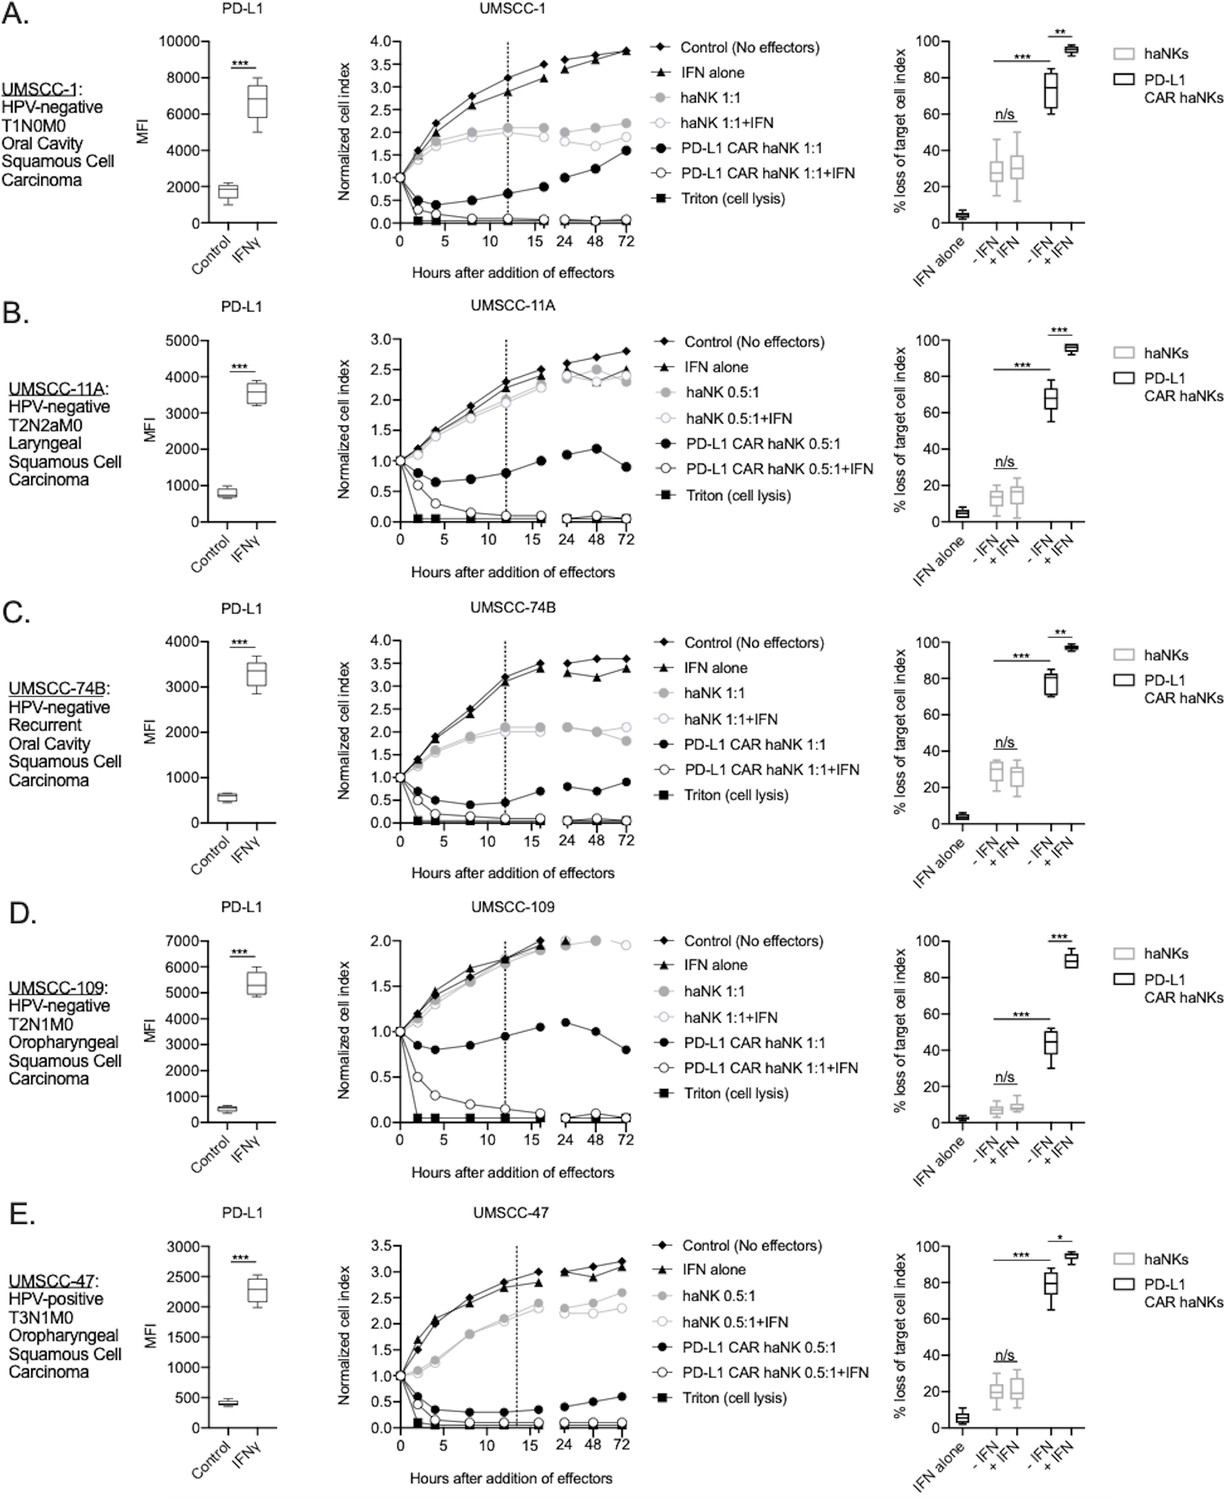
PD-L1 CAR haNKs demonstrated superior killing of human HNSCC targets compared to haNKs.
Cell surface PD-L1 expression was measured by flow cytometry in the presence or absence of IFNγ (20 ng/mL for 24 hr, left panels) and killing of control or IFNγ pre-treated tumor cells (20 ng/mL for 24 hr) by haNKs or PD-L1 CAR haNKs was measured by impedance analysis for human UMSCC-1 (A), UMSCC-11A (B), UMSCC-74B (C), UMSCC-109 (D) and UMSCC-47 (E) HNSCC cells. Representative impedance curves are shown in the central panels, and plots of quantification of effector cell killing (% loss of cell index) at 12 hr are shown in the right panels. Cumulative data from at least three independent experiments for each cell line are shown. MFI, median fluorescent intensity. *, p<0.05; **, p<0.01; ***, p<0.001.
Figure 1—figure supplement 1
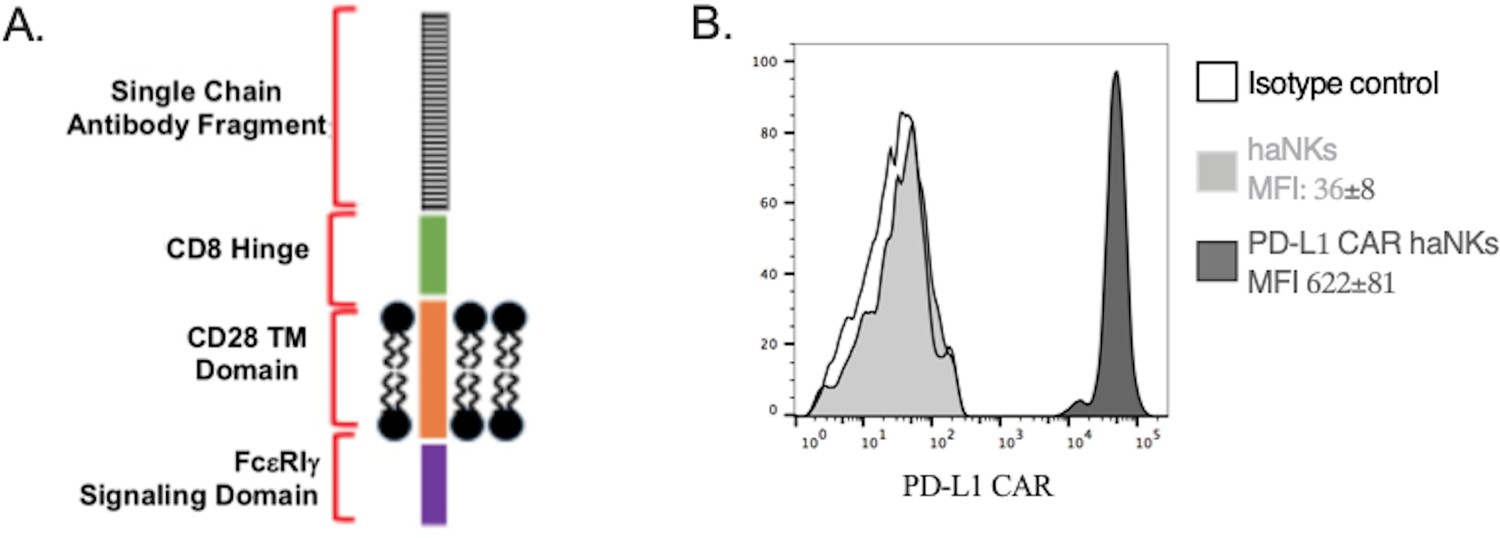
PD-L1 CAR haNKs express a PD-L1 CAR.
(A) Schematic of the design of the second-generation PD-L1 CAR. (B) haNKs or PD-L1 CAR haNKs were assayed for PD-L1 CAR expression via flow cytometry. Representative histograms are shown, with MFI of CAR expressed inset into the legend.
Figure 1—figure supplement 2
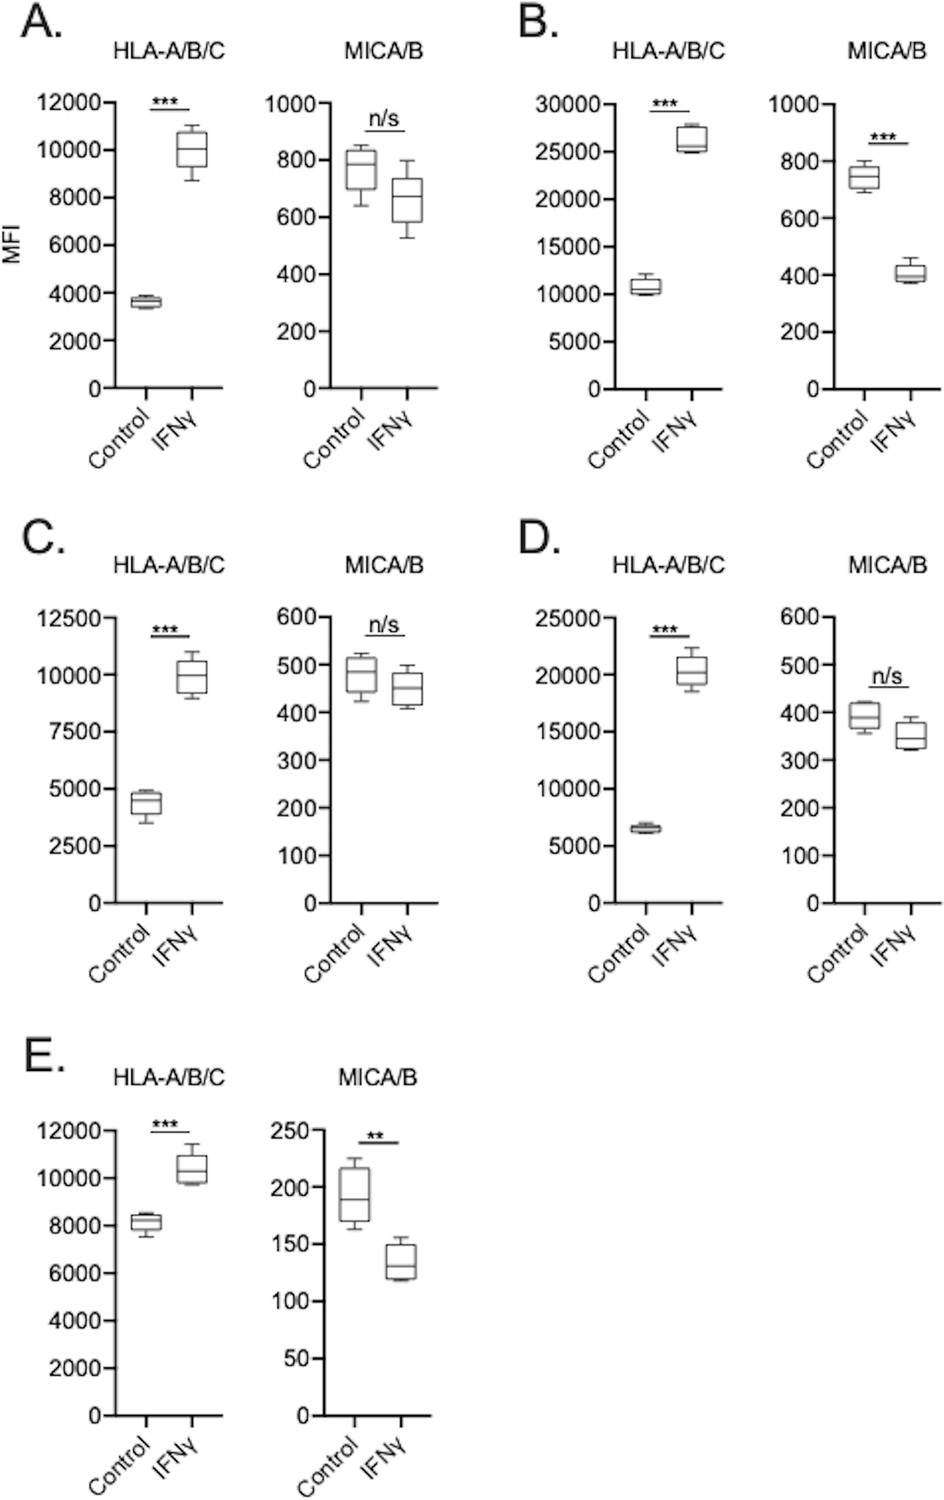
UMSCC cells express variable degrees of HLA class I and MICA/B.
Cell surface HLA-A/B/C and MICA/B expression was measured by flow cytometry in the presence or absence of IFNγ (20 ng/mL for 24 hr, left panels) on human UMSCC-1 (A), UMSCC-11A (B), UMSCC-74B (C), UMSCC-109 (D) and UMSCC-47 (E) HNSCC cells. n/s, non-significant. **, p<0.01; ***, p<0.001.
Figure 1—figure supplement 3
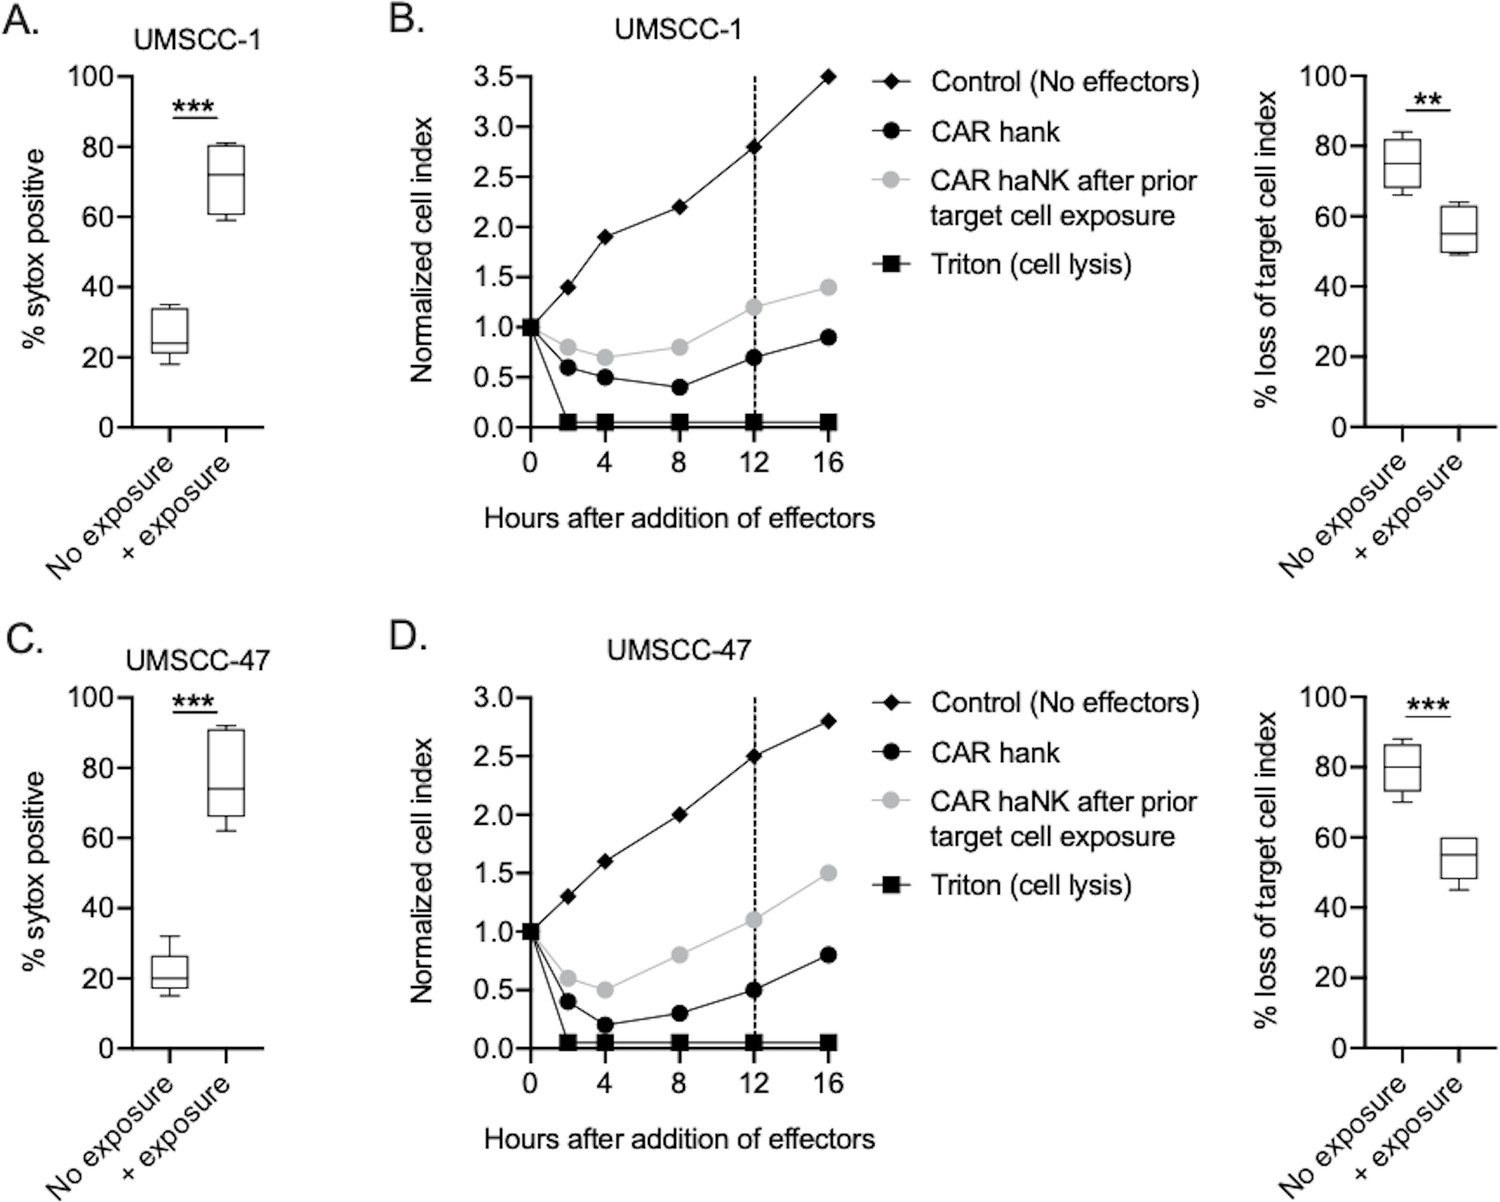
PD-L1 CAR haNKs exhibit minimal exhaustion.
PD-L1 CAR haNKs were exposed to UMSCC-1 or UMSCC-47 target cells at an E:T ratio of 1:1 for four hours, then target cells were assessed for viability via sytox staining on flow cytometry (A, C) to verify killing. PD-L1 CAR haNKs exposed to target cells were harvested and compared to target-naive PD-L1 CAR haNKs for their ability to kill UMSCC-1 or UMSCC-47 cells, respectively (B, D). Representative impedance curves are shown in the left panels, and plots of quantification of effector cell killing (% loss of cell index) at 12 hr are shown in the right panels. **, p<0.01; ***, p<0.001.
Figure 2 with 1 supplement
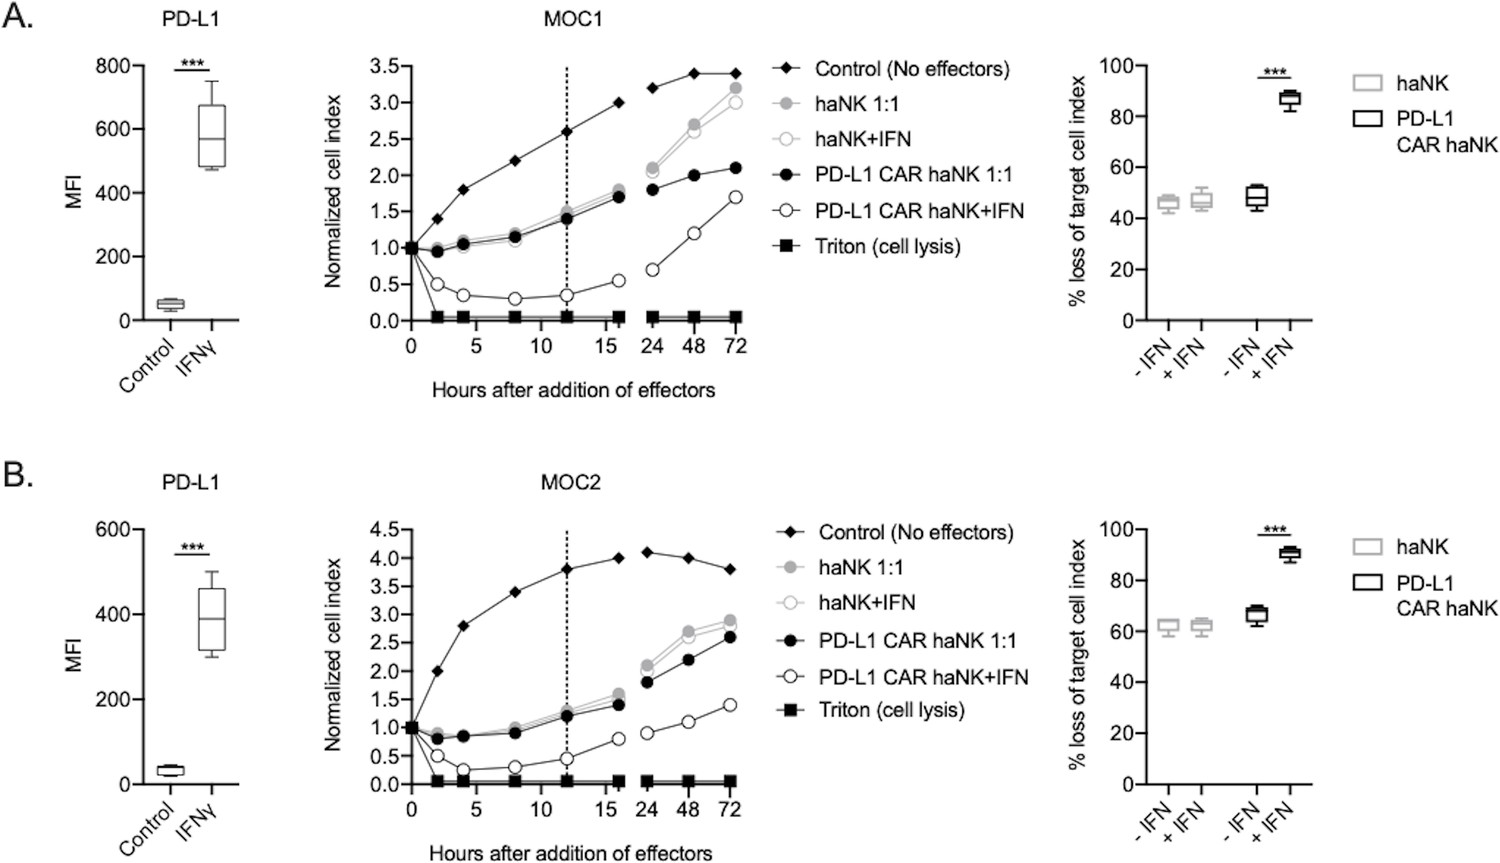
PD-L1 CAR haNKs demonstrated superior killing of murine HNSCC targets compared to haNKs.
Cell surface PD-L1 expression was measured by flow cytometry in the presence or absence of IFNγ (20 ng/mL for 24 hr, left panels) and killing of control or IFNγ pre-treated tumor cells (20 ng/mL for 24 hr) by haNKs or PD-L1 CAR haNKs was measured by impedance analysis for murine MOC1 (A) or MOC2 (B) HNSCC cells. Representative impedance curves are shown in the central panels, and plots of quantification of effector cell killing (% loss of cell index) at 12 hr are shown in the right panels. Cumulative data from at least three independent experiments for each cell line are shown. MFI, median fluorescent intensity. ***, p<0.001.
Figure 2—figure supplement 1
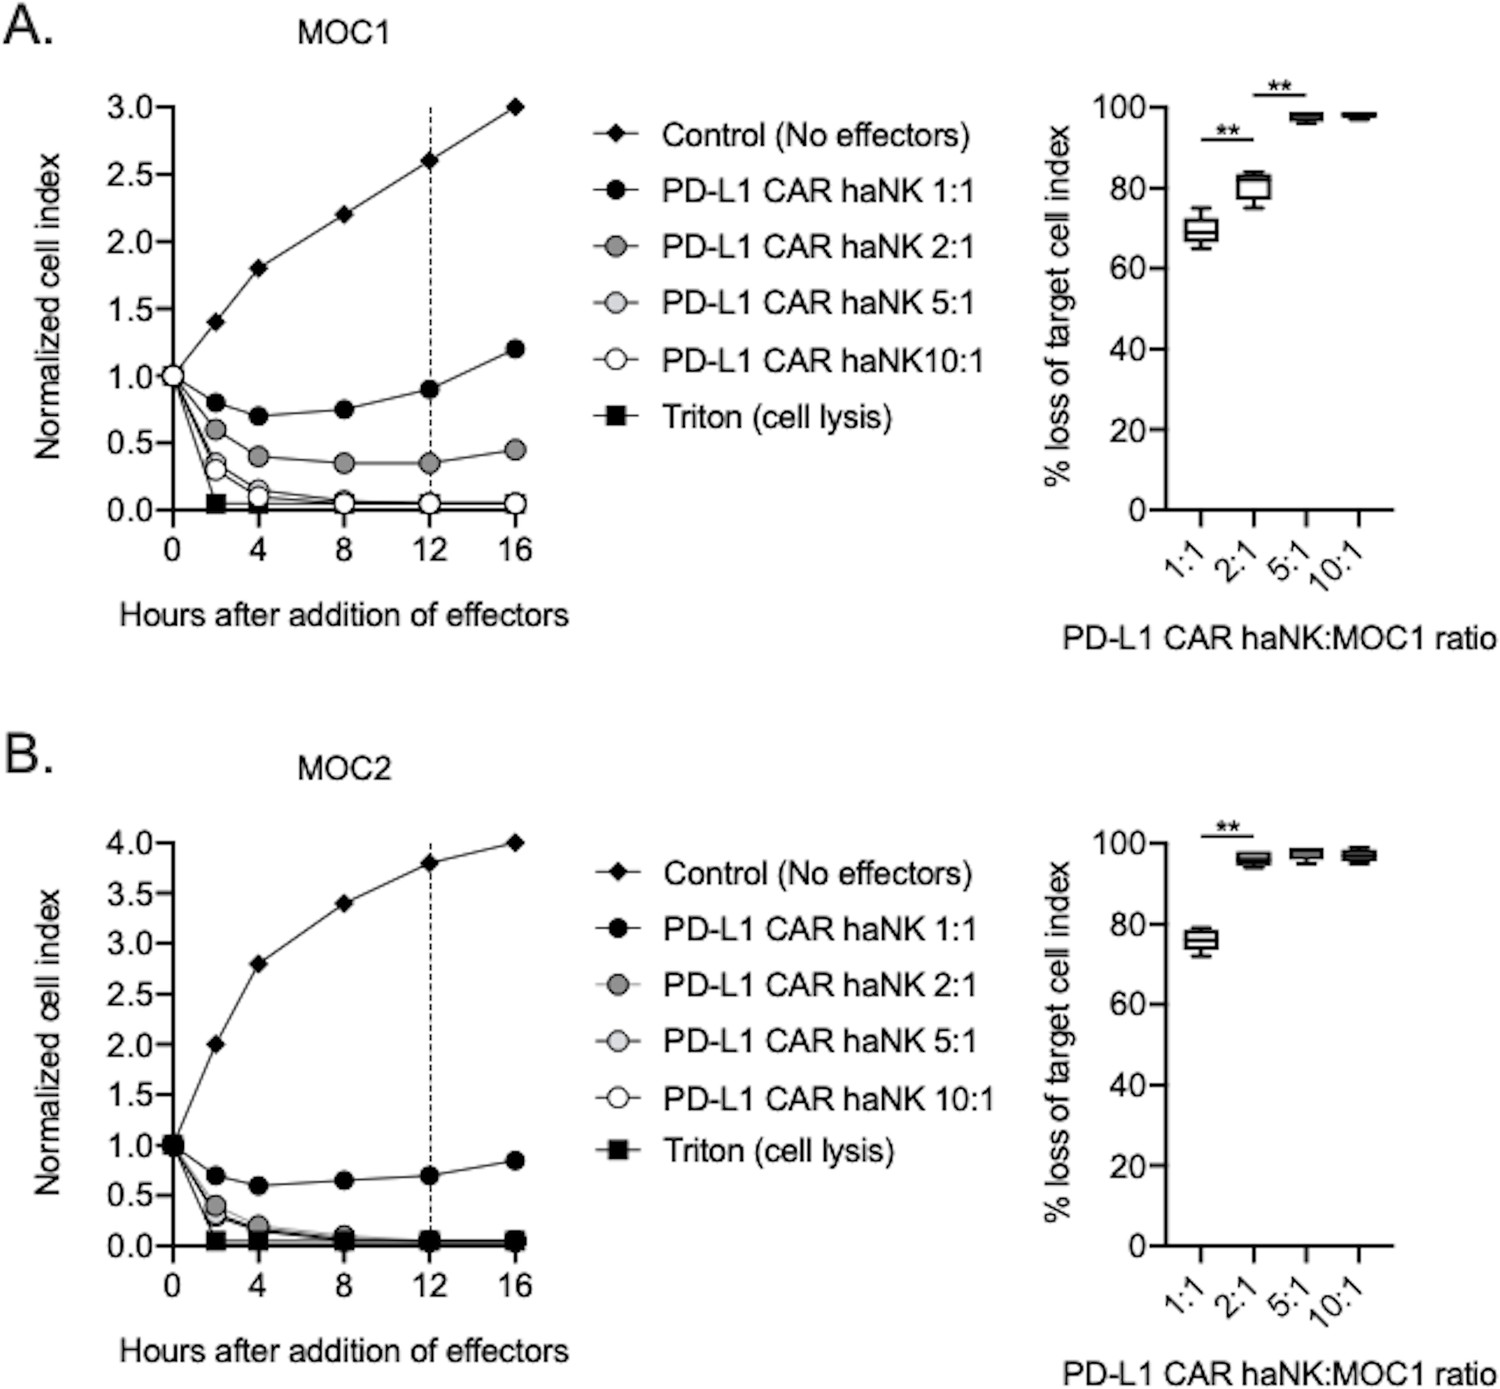
PD-L1 CAR haNKs kill murine HNSCC cells in a dose-dependent fashion.
Killing of IFNγ pre-treated tumor cells (20 ng/mL for 24 hr) by PD-L1 CAR haNKs was measured by impedance analysis for murine MOC1 (A) or MOC2 (B) HNSCC cells. Representative impedance curves are shown in the left panels, and plots of quantification of effector cell killing (% loss of cell index) at 12 hr are shown in the right panels. Cumulative data from at two independent experiments for each cell line are shown. **, p<0.01.
Figure 3 with 1 supplement
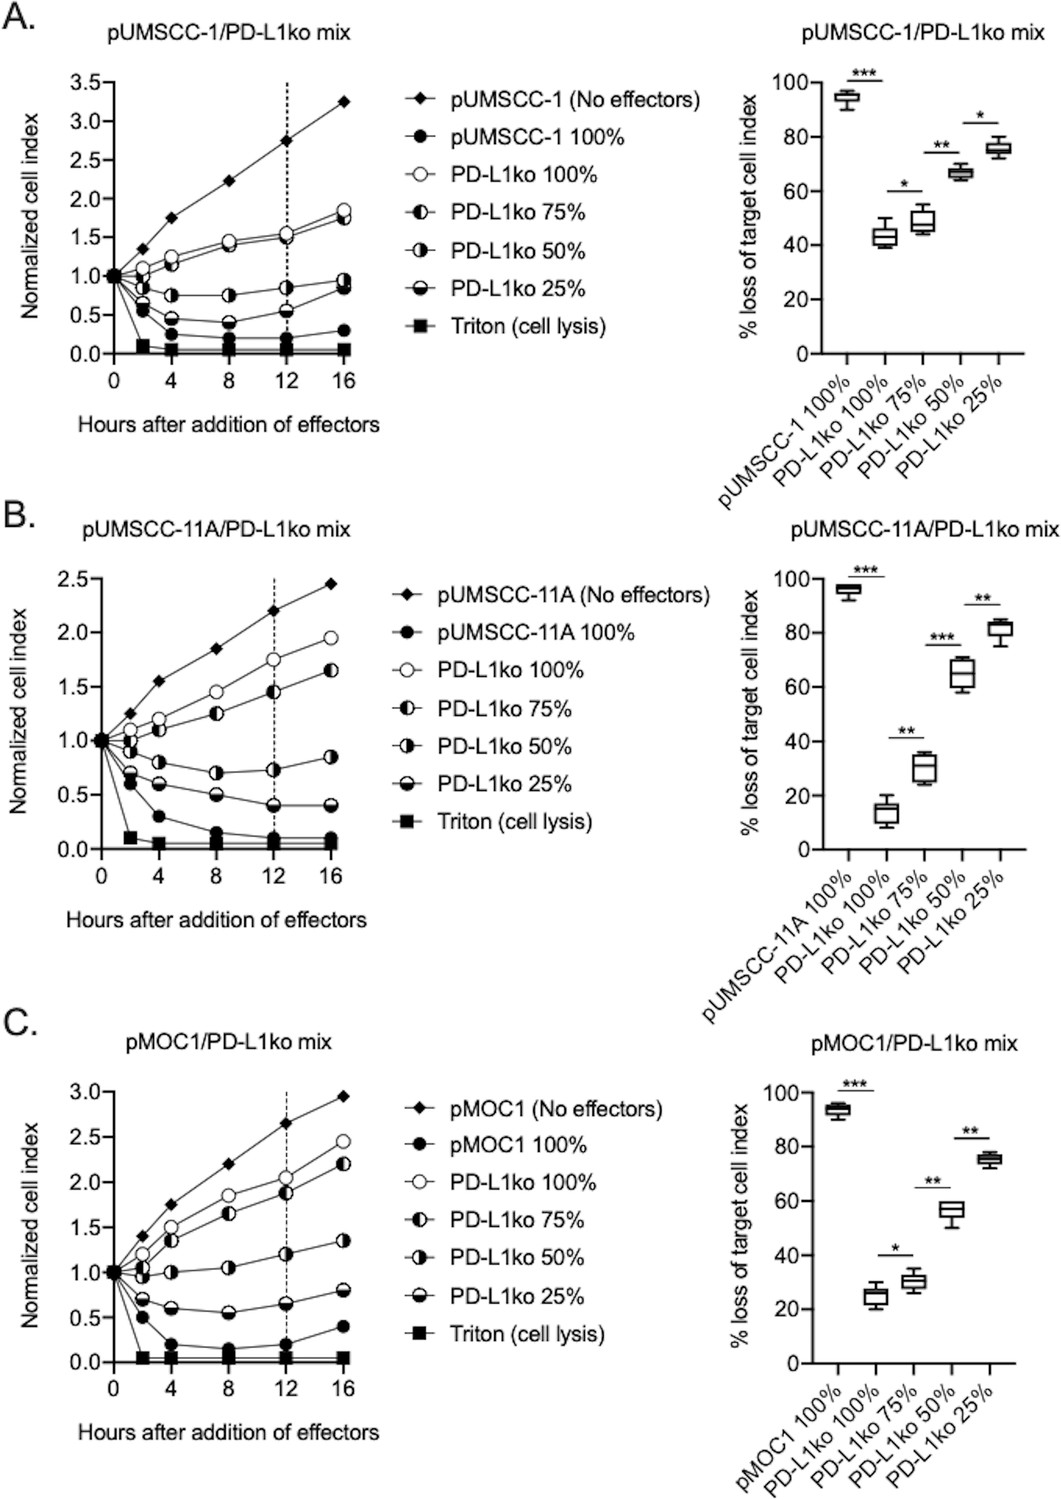
PD-L1 CAR haNKs demonstrated both direct and PD-L1 CAR-dependent killing.
The ability of PD-L1 CAR haNK cells (1:1 effector:target ratio) to kill IFNγ pretreated parental and PD-L1 knockout UMSCC-1 (A), UMSCC-11A (B) and MOC1 (C) cells mixed at different ratios was measured by impedance analysis. Representative impedance plots are shown on the left, and plots of quantification of killing are shown on the right. Cumulative data from two independent experiments for each cell line are shown. *, p<0.05; **, p<0.01; ***, p<0.001.
Figure 3—figure supplement 1

PD-L1 knockout cells maintained IFN responsiveness but lacked PD-L1 expression.
PD-L1 knockout cells were generated via CRISPR/Cas9 gene editing and control or IFNγ pre-treated UMSCC-1 (A), UMSCC-11A (B) or MOC1 (C) HNSCC tumor cells (20 ng/mL for 24 hr) were assayed for PD-L1 or HLA-A/B/C expression via flow cytometry. Isotype control MFI shown in the bar graphs. **, p<0.01; ***, p<0.001.
Figure 4 with 1 supplement

PD-L1 CAR haNKs induced PD-L1-dependent rejection or tumor growth inhibition in wild-type mice bearing MOC1 tumors.
Wild-type C57BL/6 mice bearing parental (A) or PD-L1 knockout (B) MOC1 tumors were treated with PD-L1 CAR haNKs (1 × 10⁷ cells IP, beginning day 10, twice weekly for six doses, n = 10 mice/group) or 1xPBS control and primary tumors were followed for growth. Individual tumor growth curves shown on the left, with summary growth curves shown on the right. The number of mice that rejected established tumors is inset. C, wild-type C57BL/6 mice bearing parental MOC1 tumors were treated with PD-L1 CAR haNKs (1 × 10⁷ cells IP, beginning day 14, twice weekly for six doses, n = 10 mice/group) or 1xPBS control with and without antibody-based depletion (CD8 clone YTS 169.4, IFNγ clone XMG1.2, TNFα clone XT3.11, each 200 μg IP twice weekly starting on day 13, n = 5–10 mice/group) and primary tumors were followed for growth. Summary growth curve shown. D, one day after the final CD8 depletion and two days after the final PD-L1 CAR haNK treatment, some tumors (n = 4) were assessed for tumor cell-specific PD-L1 expression by flow cytometry. Representative histograms shown with median fluorescent intensity (MFI) inset. Significance of summary growth curves was determined by 2-way ANOVA of repeat measures with the treatment condition as the variable. Results from one of three independent experiments with similar results are shown. *, p<0.05.
Figure 4—figure supplement 1
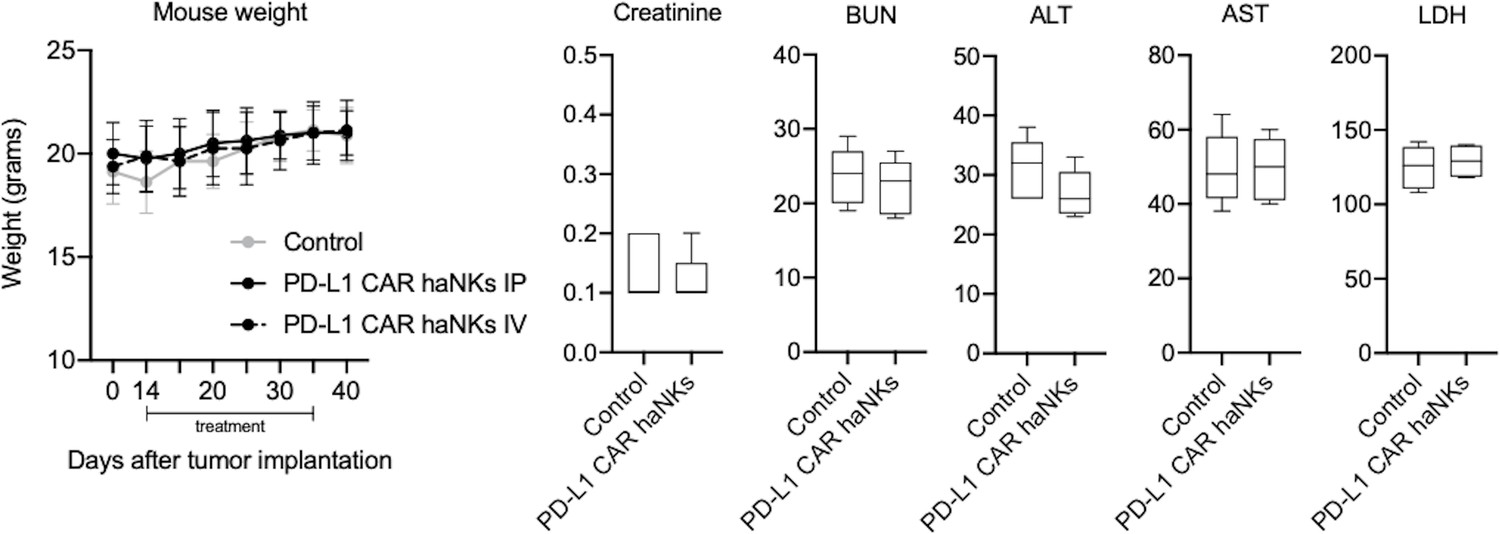
PD-L1 CAR haNKs exhibit no measurable toxicity.
Wild-type C57BL/6 mice bearing parental (A) or PD-L1 knockout (B) MOC1 tumors were treated with IP or IV PD-L1 CAR haNKs (1 × 10⁷ cells IP, beginning day 10, twice weekly for six doses, n = 5–10 mice/group) or 1xPBS control (administered IP) and mice were weighed twice weekly. 24 hr after the final treatment, peripheral blood was drawn from a subset of mice (n = 5/group) and assayed for standard blood chemistries. BUN, blood urea nitrogen; ALT, alanine aminotransferase; AST, aspartate aminotransferase; LDH, lactate dehydrogenase.
Figure 5 with 2 supplements
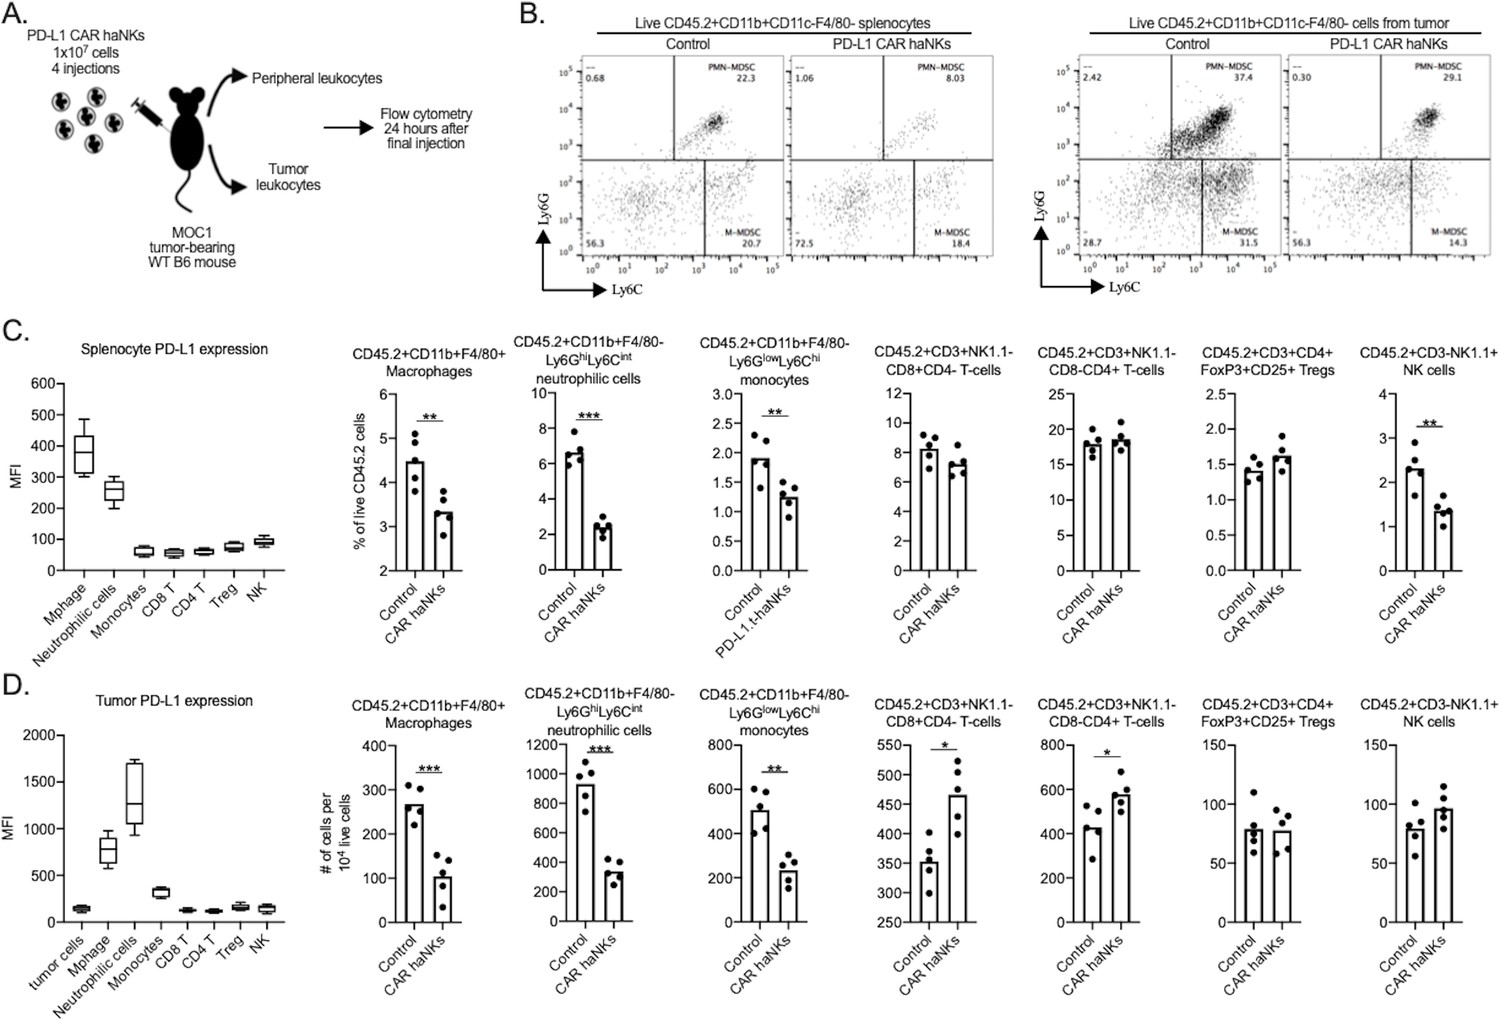
PD-L1 CAR haNK treatment remodels the tumor microenvironment immune composition in wild-type mice bearing.
MOC1 tumors Wild-type C57BL/6 mice bearing parental MOC1 tumors were treated with four PD-L1 CAR haNK administrations (1 × 10⁷ cells IP, each four days apart) and 24 hr after the last treatment, spleens and tumors were harvested and assessed for immune composition via flow cytometry (schema shown in A). (B) representative dot plots of live CD11c-F4/80- myeloid cells from the spleen (left panels) or tumor (right panels) are shown. Baseline cell surface PD-L1 expression on immune cell subsets along with changes in immune cell composition following PD-L1 CAR haNK treatment are shown from the spleen (C) and tumor (D) compartments (n = 5 spleens or tumors/group). Cell surface markers used to identify immune cell subsets are shown. *, p<0.05; **, p<0.01; ***, p<0.001.
Figure 5—figure supplement 1
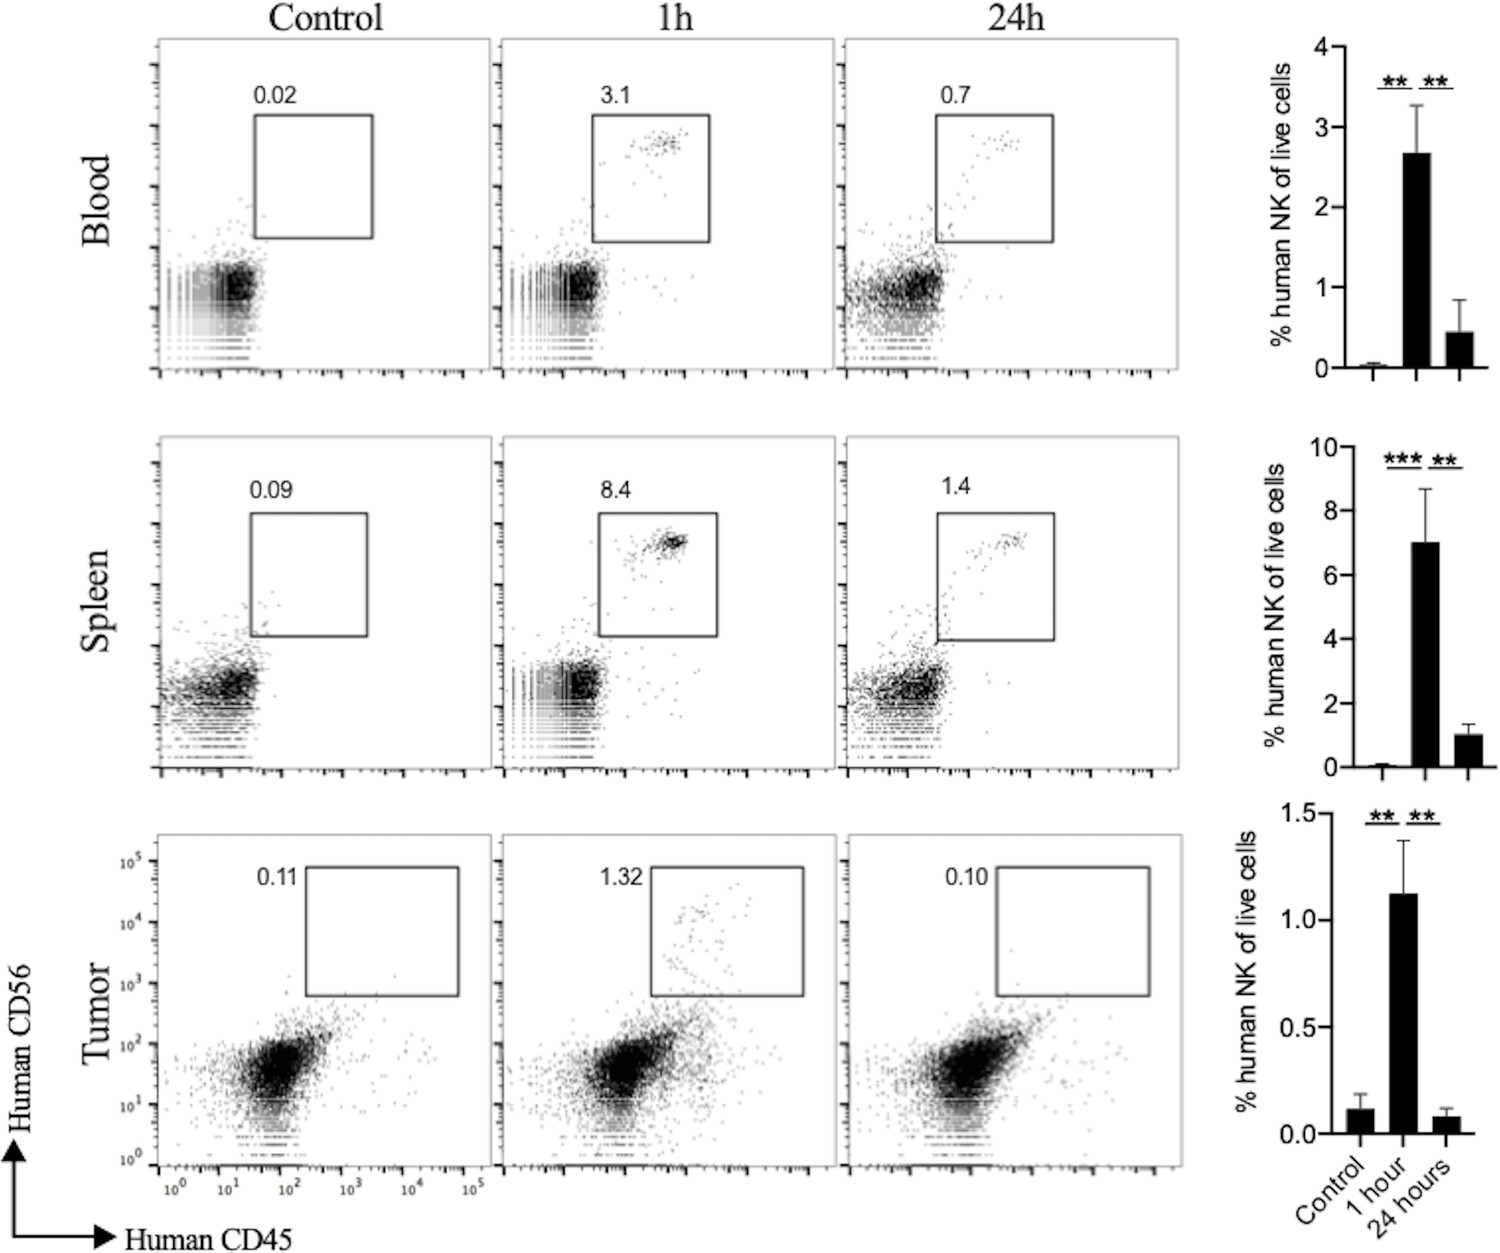
Kinetics of PD-L1 CAR haNKs in bloods, spleens and tumors.
Wild-type C57BL/6 mice bearing parental MOC1 tumors were treated with one PD-L1 CAR haNK administration (1 × 10⁷ cells IP) or 1xPBS control and 1 hr or 24 hr later, peripheral blood, spleens and tumors were harvested and assessed for PD-L1 CAR haNKs composition via flow cytometry (n = 5/group). Representative dot plots of control or PD-L1 CAR haNKs treated tumors are shown on the left, with quantification of PD-L1 CAR haNKs infiltration on the right. **, p<0.01, ***, p<0.001.
Figure 5—figure supplement 2
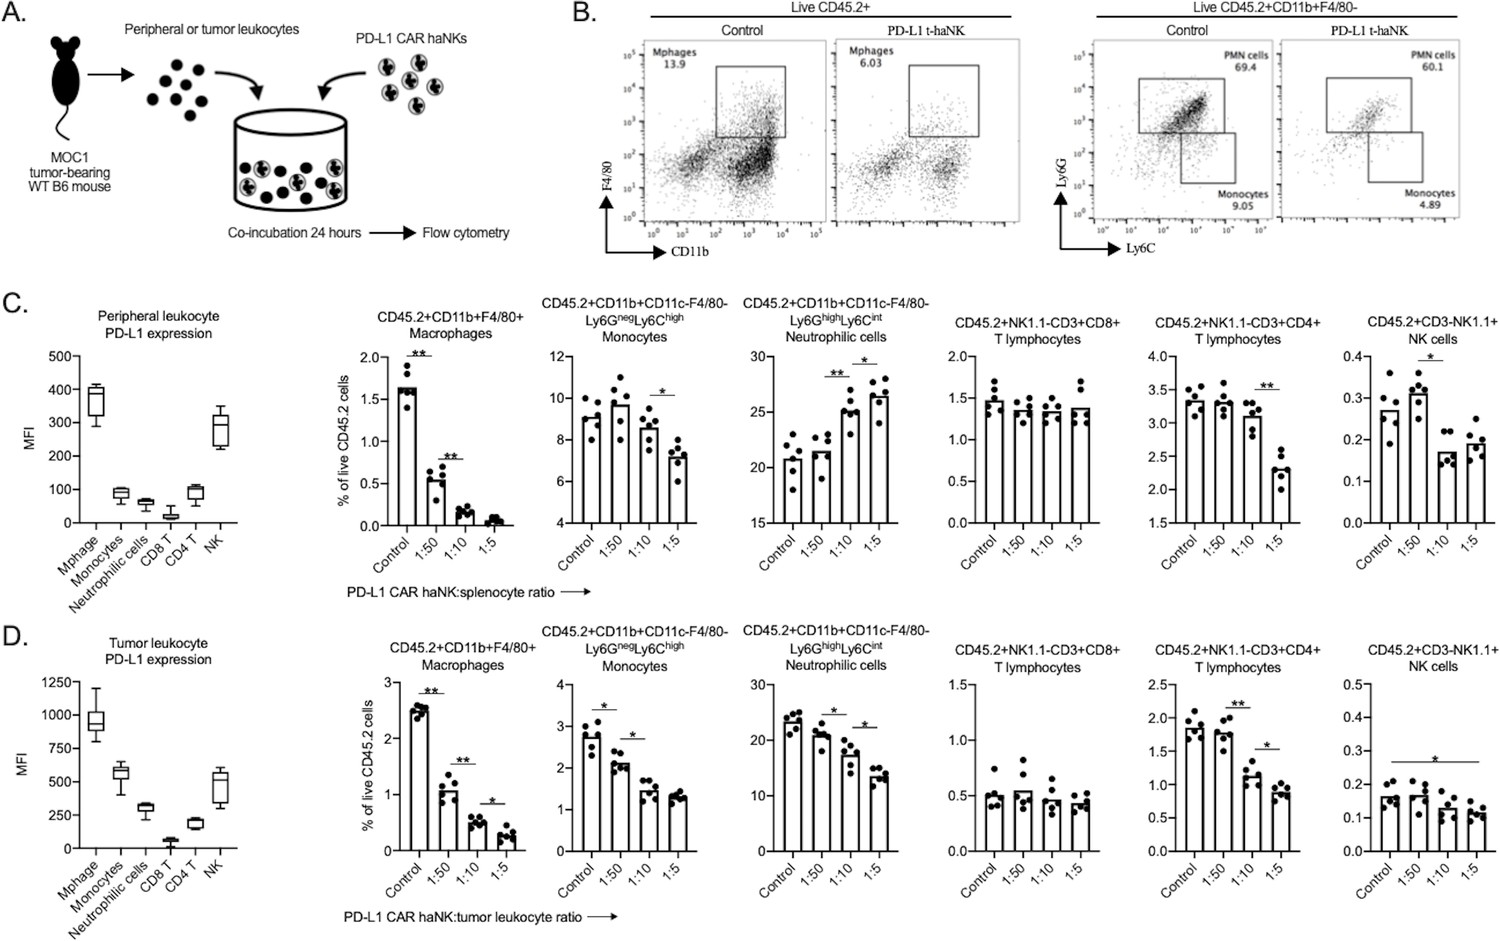
PD-L1 CAR haNKs deplete PD-L1 high myeloid cells from the spleen and tumors of MOC1 tumor bearing mice.
Spleens and tumors from wild-type C57BL/6 mice bearing parental day 14 MOC1 tumors were co-incubated with PD-L1 CAR haNKs for 24 hr, then changes in immune composition was assessed via flow cytometry (schema shown in A). (B) representative dot plots of myeloid cell subsets from tumors are shown. Baseline cell surface PD-L1 expression on immune cell subsets along with changes in immune cell composition following PD-L1 CAR haNK co-incubation are shown from the spleen (C) and tumor (D) compartments (n = 5 spleens or tumors/group). Cell surface markers used to identify immune cell subsets are shown. *, p<0.05; **, p<0.01.
Figure 6 with 1 supplement
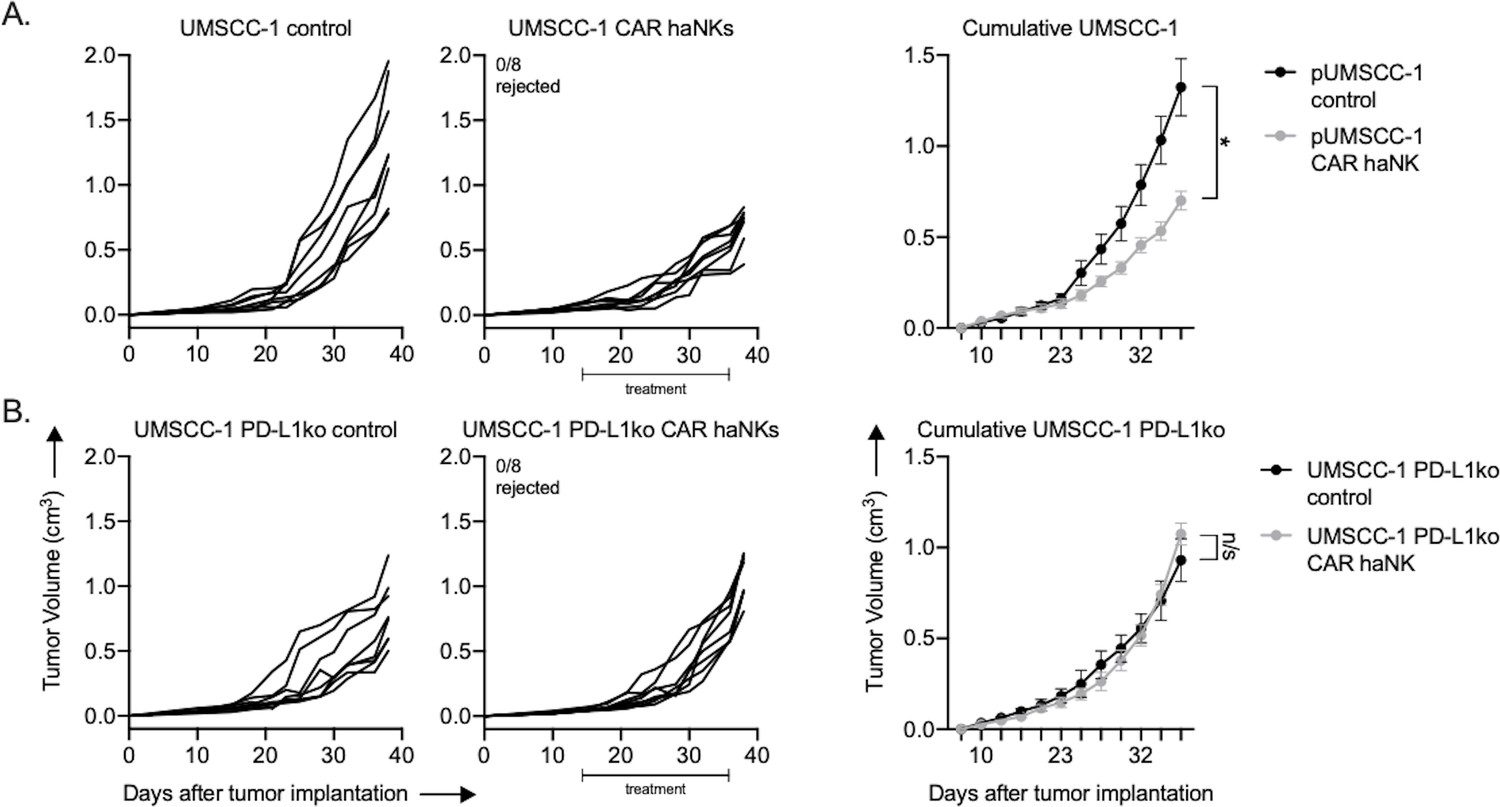
PD-L1 CAR haNKs induced PD-L1-dependent tumor growth inhibition in NSG mice bearing UMSCC-1 tumors.
NOD-scid IL2Rgammanull (NSG) mice bearing parental (A) or PD-L1 knockout (B) UMSCC-1 tumors were treated with PD-L1 CAR haNKs (1 × 10⁷ cells IP, beginning day 14, twice weekly for six doses, n = 10 mice/group) or 1xPBS control and primary tumors were followed for growth. Individual tumor growth curves shown on the left, with summary growth curves shown on the right. The number of mice that rejected established tumors is inset. Significance was determined by 2-way ANOVA of repeat measures with the treatment condition as the variable. Results from one of two independent experiments with similar results are shown. *, p<0.05.
Figure 6—figure supplement 1
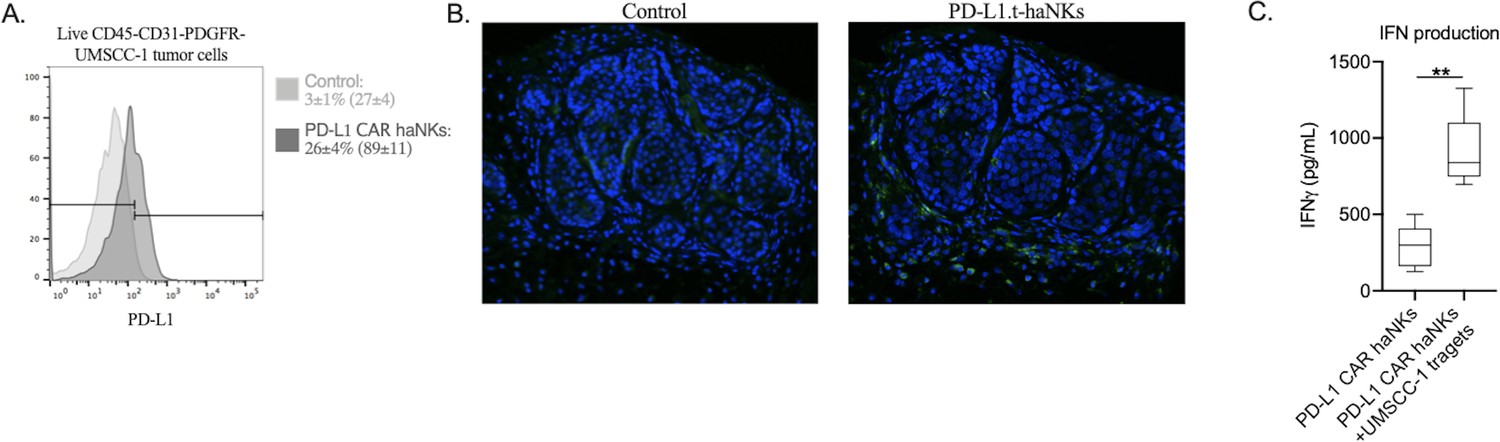
UMSCC-1 tumor cells express greater levels of PD-L1 after a treatment with PD-L1 CAR haNKs.
NOD-scid IL2Rgammanull (NSG) mice bearing parental UMSCC-1 tumors were treated with one dose of PD-L1 CAR haNKs (1 × 10⁷ cells IP) or 1xPBS control. 24 hr after treatment, tumor cell PD-L1 expression was determined by flow cytometry (A). Representative histograms shown, and MFI inset into legend. PD-L1 expression was also assessed by immunofluorescence (B, PD-L1 in green, DAPI nucleus stain in blue). (C) IFNγ production by PD-L1 CAR haNK cells alone or 4 hr after co-incubation at a 1:1 E:T ratio with UMSCC-1 cells was measured by ELISA. **, p<0.01.
Figure 7
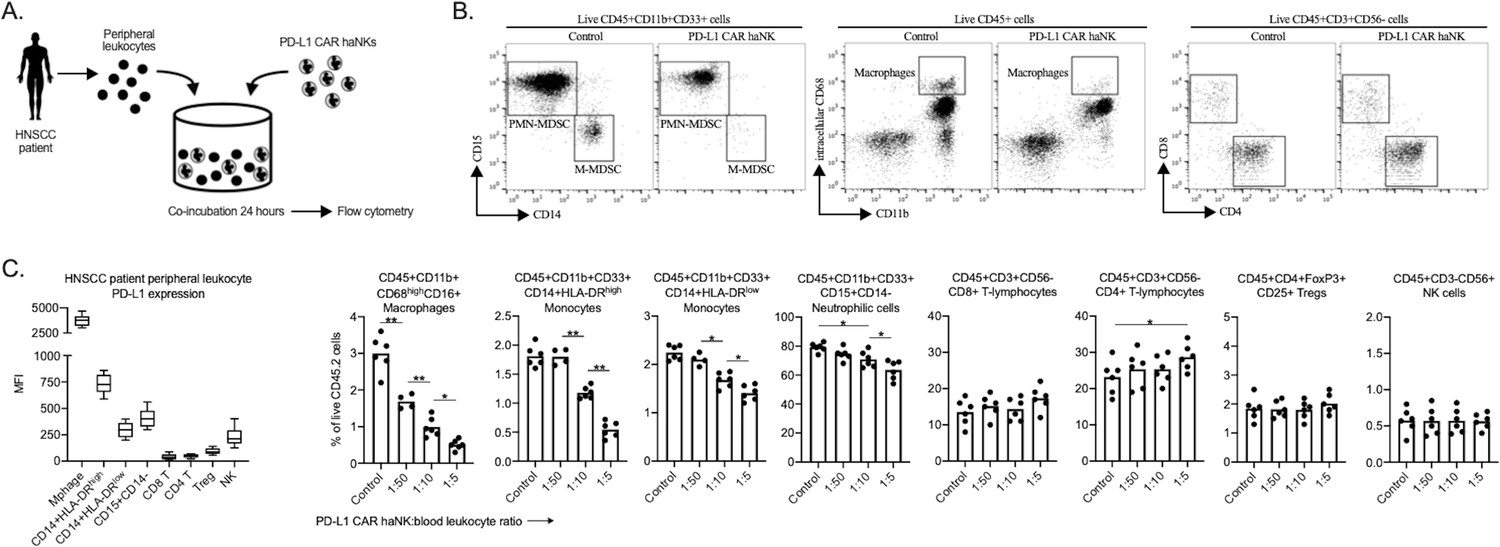
PD-L1 CAR haNKs deplete PD-L1 high myeloid cells from the peripheral blood of HNSCC patients PD-L1.
CAR haNKs were co-incubated for 24 hr at different effector:target ratios with HNSCC patient peripheral blood leukocytes (n = 5 patients) and changes in immune composition were assessed via flow cytometry (schema shown in A). (B) Representative dot plots of myeloid and lymphoid cell subsets are shown. (C) Baseline cell surface PD-L1 expression on immune cell subsets along with changes in immune cell composition following PD-L1 CAR haNK co-incubation are shown. *, p<0.05; **, p<0.01.
Tables
Key resources table
| Reagent type (species) or resource | Designation | Source or reference | Identifiers | Additional information |
|---|---|---|---|---|
| Cell line (human) | UM-SCC-1 | U of Michigan | Available from EMDMillipore | |
| Cell line (human) | UM-SCC-11A | U of Michigan | ||
| Cell line (human) | UM-SCC-74B | U of Michigan | Available from EMDMillipore | |
| Cell line (human) | UM-SCC-109 | U of Michigan | ||
| Cell line (human) | UM-SCC-47 | U of Michigan | Available from EMDMillipore | |
| Cell line (mouse) | MOC1 | WashU St. Louis | Available from Kerafast | |
| Cell line (mouse) | MOC2 | WashU St. Louis | Available from Kerafast | |
| Cell line (human) | UM-SCC-1 PD-L1 ko | This paper | Knockout by Synthego, cells available from senior author | |
| Cell line (human) | UM-SCC-11A PD-L1 ko | This paper | Knockout by Synthego, cells available from senior author | |
| Cell line (mouse) | MOC1 PD-L1 ko | This paper | Sc-425636 | Santa Cruz knockout reagents, cells available from senior author |
| NK cell therapy | haNKs | NantKWest | Effector cells | |
| NK cell therapy | PD-L1 CAR haNKs | NantKWest | Effector cells | |
| Recombinant protein | Human IFNγ | Peprotech | 300–02 | In vitro stim (20 ng/mL) |
| Recombinant protein | Murine IFNγ | Biolegend | 575304 | In vitro stim (20 ng/mL) |
| Antibody | CD8 | BioXCell | YTS 169.4 | In vivo depletion (200 μg/injection) |
| Antibody | IFNγ | BioXCell | XMG1.2 | In vivo depletion (200 μg/injection) |
| Antibody | TNFα | BioXCell | XT3.11 | In vivo depletion (200 μg/injection) |
| Commercial assay or kit | IFNγ ELISA | R and D Systems | DIF50 | |
| Antibody | PD-L1 | Cell Signaling | E1L3 | IF (1:1000) |
Additional files
Download links
A two-part list of links to download the article, or parts of the article, in various formats.
Downloads (link to download the article as PDF)
Open citations (links to open the citations from this article in various online reference manager services)
Cite this article (links to download the citations from this article in formats compatible with various reference manager tools)
Tumor control via targeting PD-L1 with chimeric antigen receptor modified NK cells
eLife 9:e54854.
https://doi.org/10.7554/eLife.54854


