STK25 suppresses Hippo signaling by regulating SAV1-STRIPAK antagonism
- Department of Pharmacology, University of Texas Southwestern Medical Center, United States
- Department of Biophysics University of Texas Southwestern Medical Center, United States
Figures
Figure 1 with 4 supplements
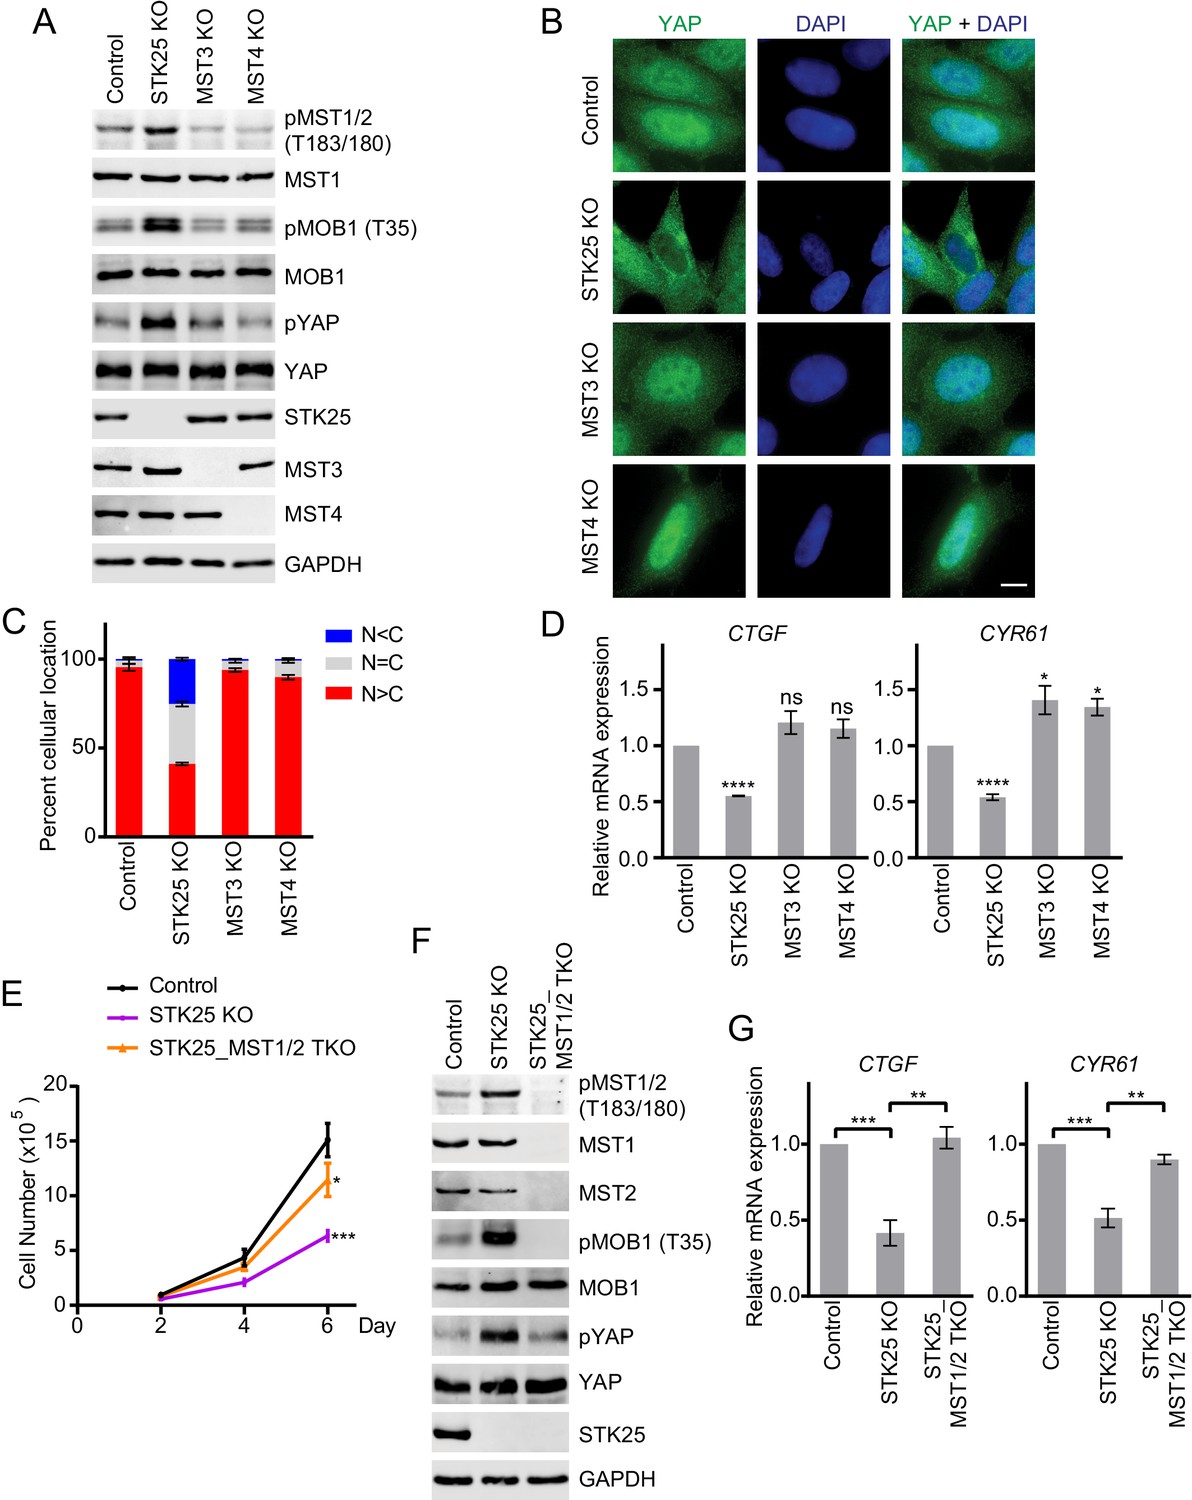
STK25 inhibits the Hippo pathway in human cells.
(A) Immunoblots of total lysates of control, and GCKIII (STK25, MST3 and MST4) knockout (KO) 293A cells with the indicated antibodies. Anti-GAPDH blot was used as the loading control. (B) Immunofluorescence staining of YAP localization in control and the indicated GCKIII KO 293A cells. Cells were fixed, permeabilized, and stained with anti-YAP (green) and DAPI (blue). Scale bar, 5 μm. (C) Quantification of immunofluorescence signal intensities in (B). Approximately 100 cells were counted from five random fields of each sample. N < C (blue), N = C (grey), and N > C (red) categories indicate YAP localization in cytoplasm, both cytoplasm and nucleus, and nucleus, respectively. Data are plotted as mean ± SEM of three biological replicates. (D) Quantitative RT-PCR. Relative mRNA expression of YAP target genes CTGF and CYR61 in control and the indicated GCKIII kinase KO 293A cells. Data are plotted as mean ± SEM of three biological replicates (*p<0.05; ****p<0.0001; ns, non-significant). (E) Cell proliferation assay was performed in 293A cells. Cell proliferation curves in control (black), STK25 KO (purple), and STK25_MST1/2 TKO (orange) cells were plotted, respectively. Cells were counted on days 2, 4, and 6 after seeding. Data shown are the means ± SEM of three independent experiments. Numbers of STK25 KO or STK25_MST1/2 TKO cells on day 6 was compared to that of control cells (*p<0.05; ***p<0.001). (F) Immunoblots of control, STK25 KO, and STK25_MST1/2 TKO 293A cell lysates with the indicated antibodies. (G) Relative mRNA expression of YAP target genes CTGF and CYR61 in control, STK25 KO, and STK25_MST1/2 TKO 293A cells. Data are plotted as mean ± SEM of three biological replicates (**p<0.01; ***p<0.001).
Figure 1—figure supplement 1
STK25 inhibits the Hippo pathway in human cells.
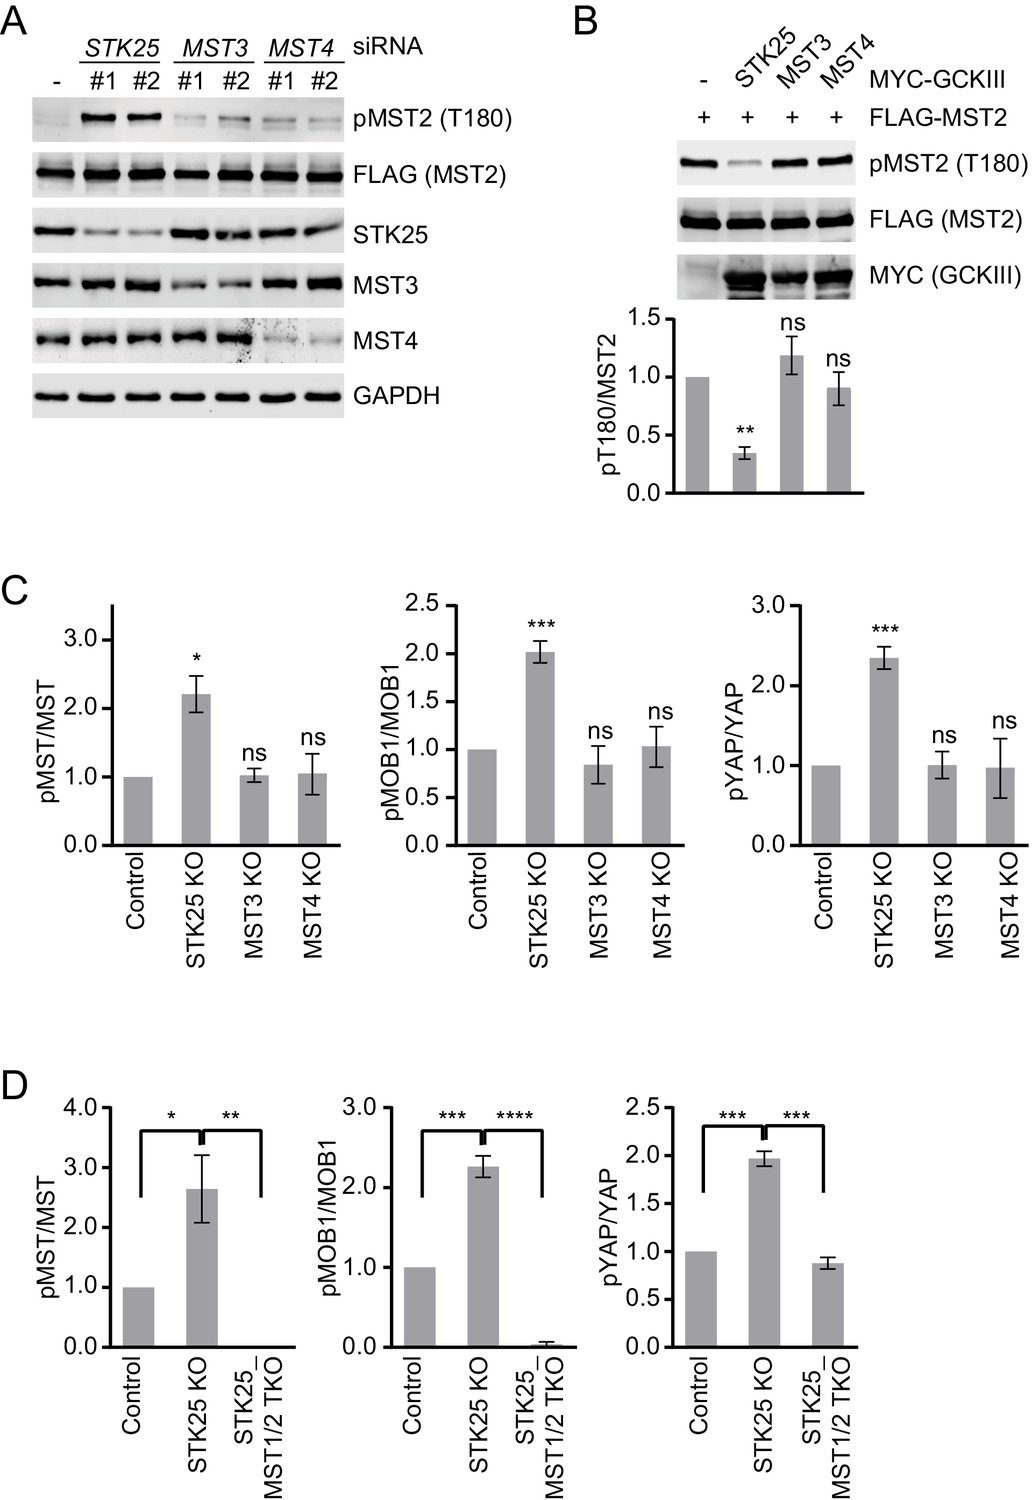
(A) 293FT cells were transfected with FLAG-MST2 and the indicated siRNAs. The total cell lysates were blotted with the indicated antibodies. Anti-GAPDH blot was used as the loading control. (B) Immunoblots and quantification of MST2 pT180 levels of lysates of 293FT cells co-transfected with FLAG-MST2 and the indicated MYC-GCKIII kinase plasmids. Data are plotted as mean ± SEM of three biological replicates (**p<0.01; ns, non-significant). (C) Quantification of the ratios of pMST/MST, pMOB1/MOB1, and pYAP/YAP signals in Figure 1A. The total and phosphorylated protein levels were individually normalized to GAPDH levels. Normalized values were used to calculate the ratios. Data are plotted as mean ± SEM of three biological replicates (***p<0.001; *p<0.05; ns, non-significant). (D) Quantification of the ratios of pMST/MST, pMOB1/MOB1, and pYAP/YAP signals in Figure 1F. Data are plotted as mean ± SEM of three biological replicates (****p<0.0001; ***p<0.001; **p<0.01; *p<0.05).
Figure 1—figure supplement 2
STK25 inhibits MST2-mediated LATS1 activation.
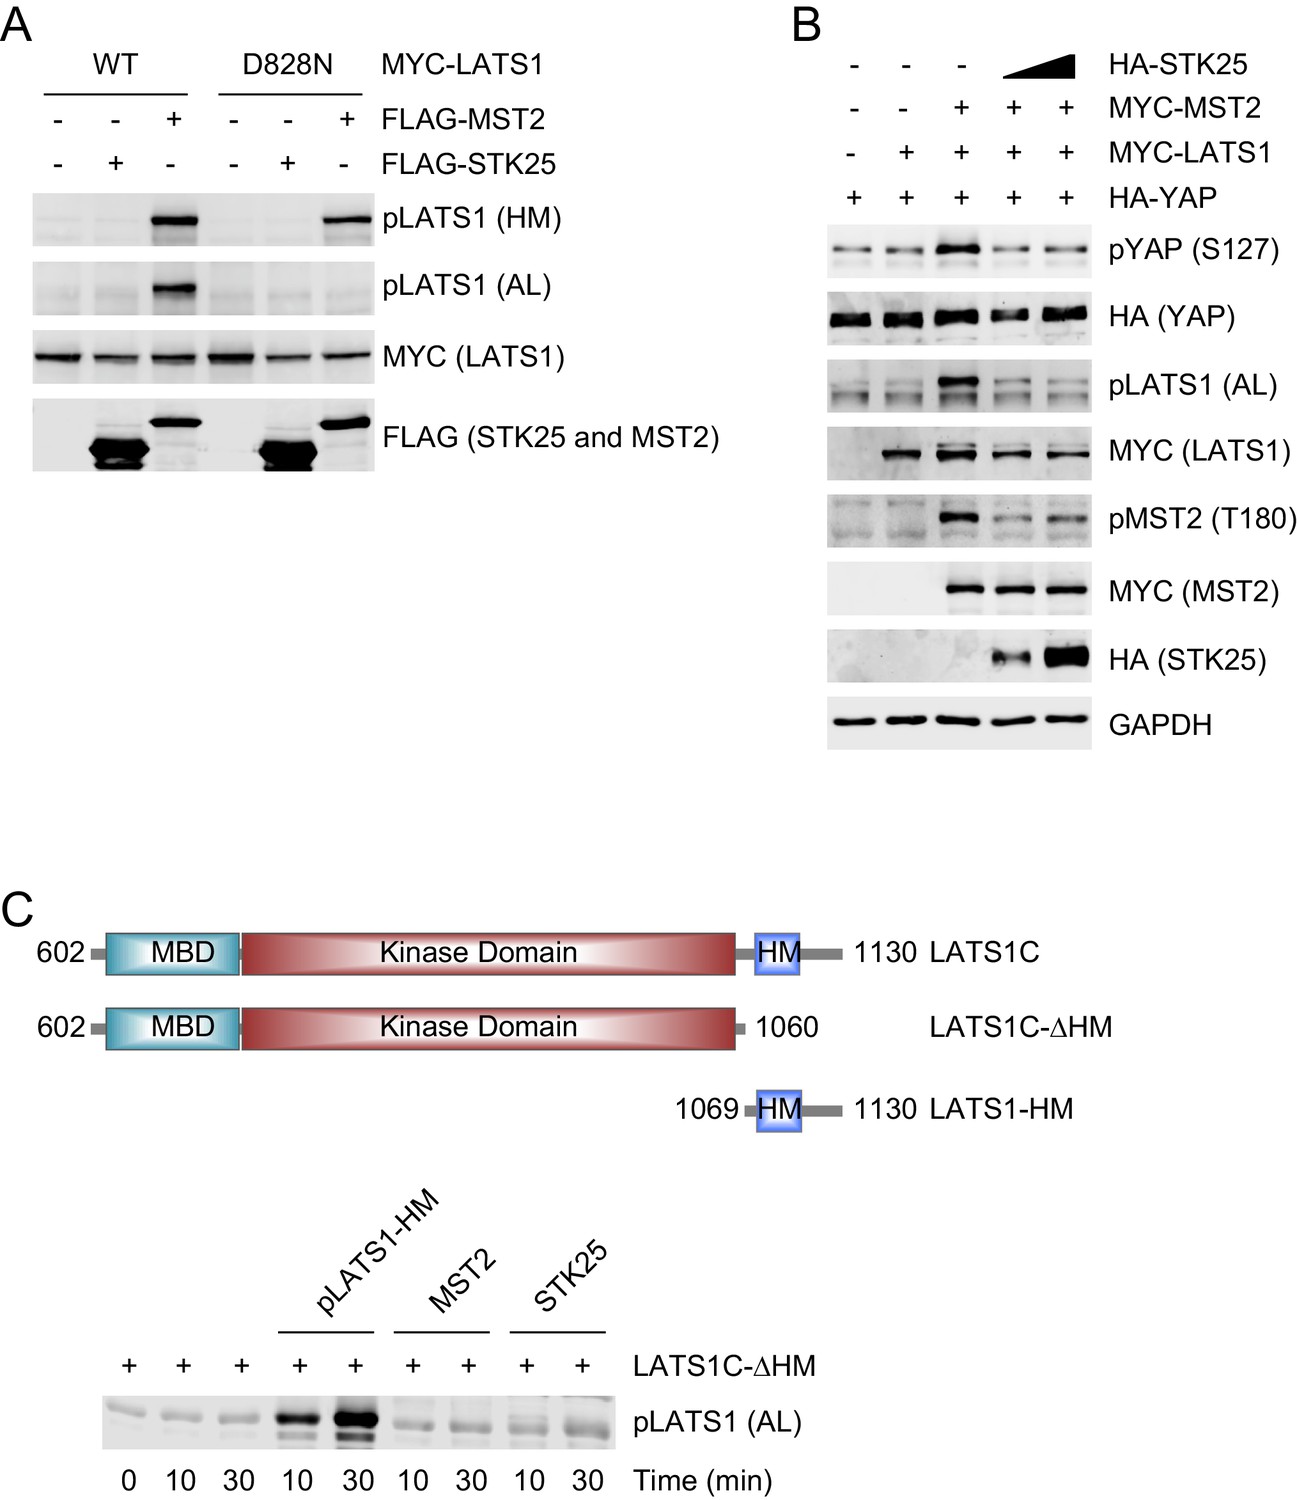
(A) Immunoblots of cell lysates of 293FT cells co-transfected with the indicated plasmids. HM, hydrophobic motif; AL, activation loop. (B) 293FT cells were co-transfected with HA-YAP and the indicated MYC-LATS1, MYC-MST2, and/or HA-STK25 plasmids. The total cell lysates were blotted with the indicated antibodies. (C) pLATS1 (AL, pS909) blot (shown in the lower panel) of kinase reactions containing LATS1C-∆HM and the indicated pLATS1-HM, MST2, and STK25 proteins. The LATS1 proteins used in the kinase reactions were depicted in the upper panel.
Figure 1—figure supplement 3
STK25 depletion does not inhibit Hippo activation induced by cytoskeleton disruption.
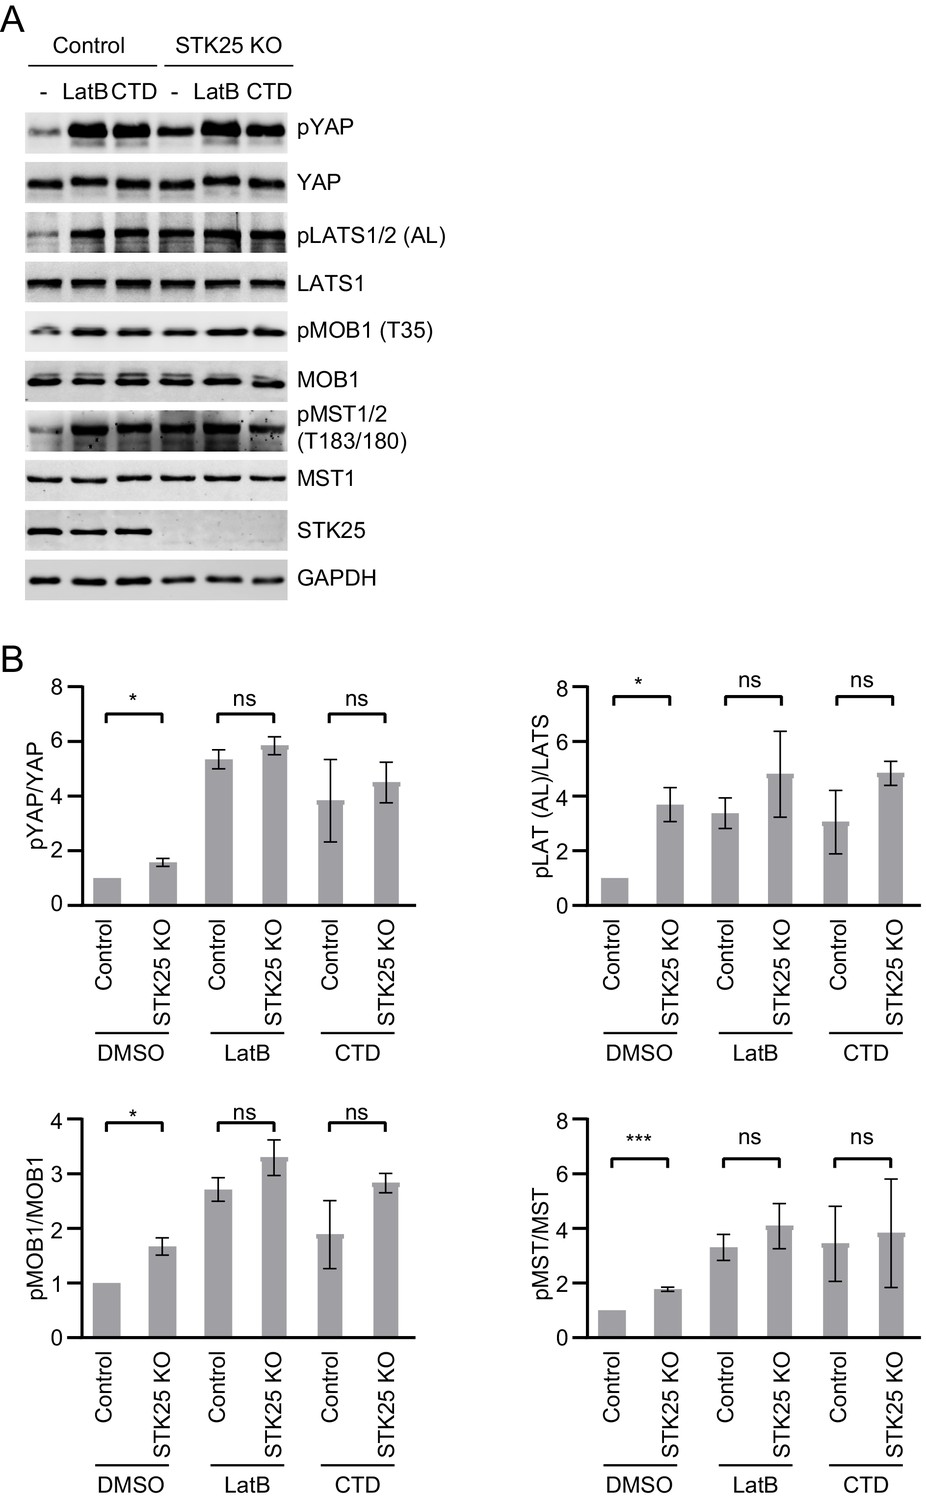
(A) Immunoblots of cell lysates of control and STK25 KO 293A cells treated with DMSO, LatB (1 μg/ml), or CTD (0.4 μM) for 1 hr, respectively. The total cell lysates were blotted with the indicated antibodies. Anti-GAPDH blot was used as the loading control. (B) Quantification of the ratios of pMST/MST, pMOB1/MOB1, pLATS (AL)/LATS and pYAP/YAP signals in (A). Data are plotted as mean ± SEM of three biological replicates (***p<0.001; *p<0.05; ns, non-significant).
Figure 1—figure supplement 4
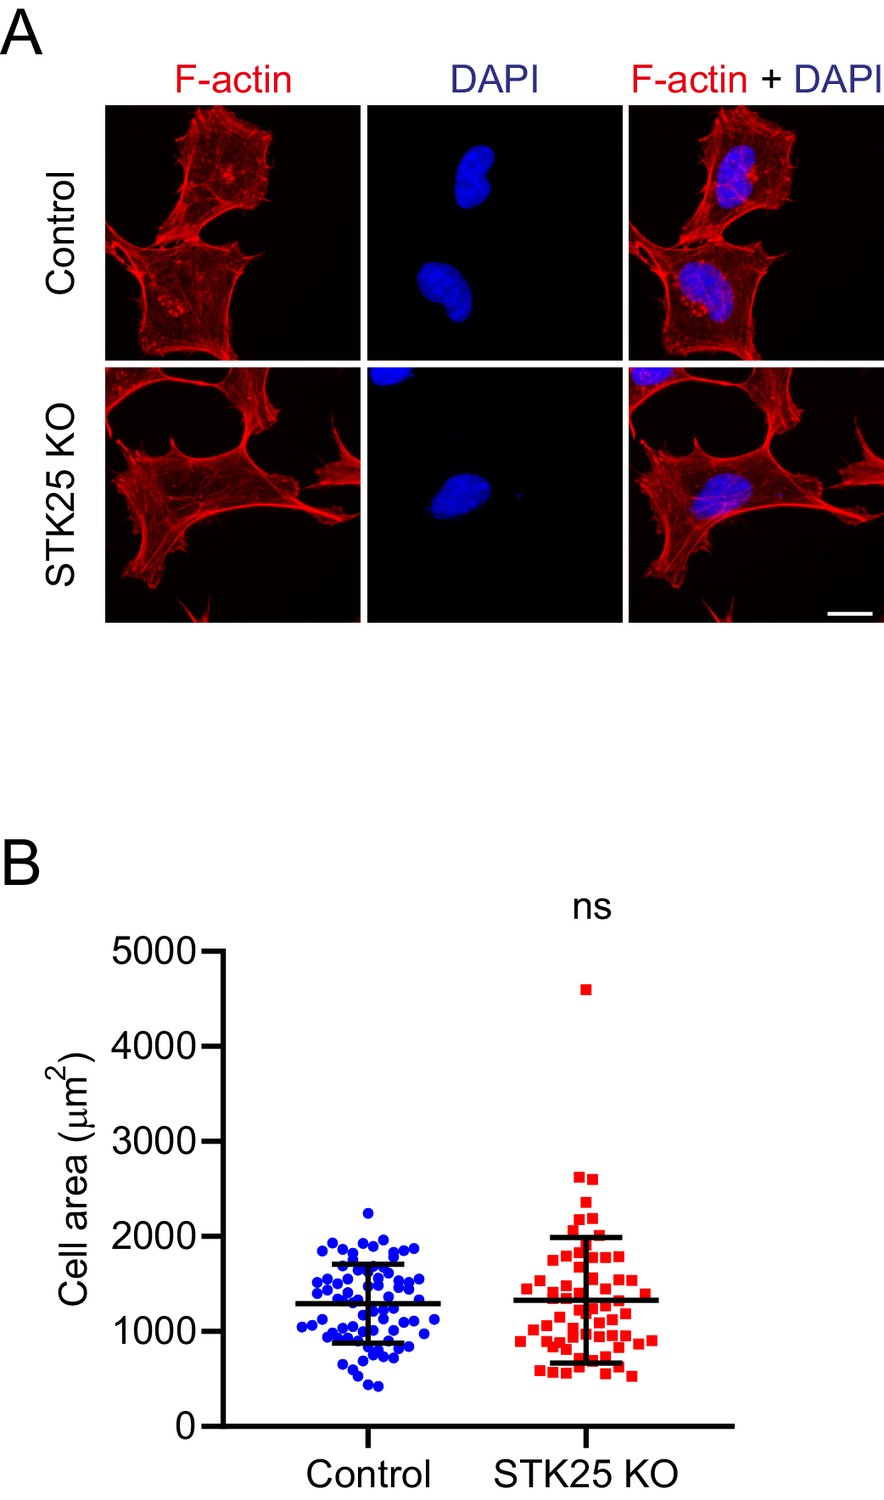
STK25 depletion does not affect the F-actin cytoskeleton.
(A) Immunofluorescence of control and STK25 KO 293A cells stained with phalloidin (F-actin; red) and DAPI (blue). Scale bar, 20 μm. (B) Quantification of the cell area (in µm2) based on F-actin staining. ns, non-significant; control, 1294 ± 415, n = 77; STK25 KO, 1329 ± 660, n = 65.
Figure 2 with 1 supplement

STK25 inactivates MST2 as a component of STRIPAKSLMAP.
(A) Model for STRIPAKSLMAP-mediated MST2 inactivation. (B) 293FT cells were co-transfected with HA-STK25 and the indicated FLAG-MST2 plasmids. The total cell lysates were blotted with the indicated antibodies. (C) 293FT cells were transfected with the indicated FLAG-MST2 plasmids. The total cell lysates (input) and anti-FLAG immunoprecipitation (IP) were blotted with the indicated antibodies. Anti-GAPDH blot was used as the loading control. (D) 293FT cells were co-transfected with the indicated siRNA and plasmids. The total cell lysates (input) and anti-FLAG IP were blotted with the indicated antibodies. Anti-Tubulin blot was used as the loading control. Asterisk denotes a non-specific band. (E) Immunoblots of 293FT cell lysates co-transfected with the indicated siRNAs and FLAG-MST2. (F) The total cell lysates (input) and anti-IgG or anti-STRN3 IP of control 293A cells and STK25 KO 293A cells were blotted with the indicated antibodies.
Figure 2—figure supplement 1

STK25 is not required for STRIPAK assembly or its interaction with MST1/2.
(A and B) 293FT cells were co-transfected with the indicated plasmids. The total cell lysates (input) and anti-FLAG IP were subjected to immunoblotting analysis.
Figure 3 with 2 supplements
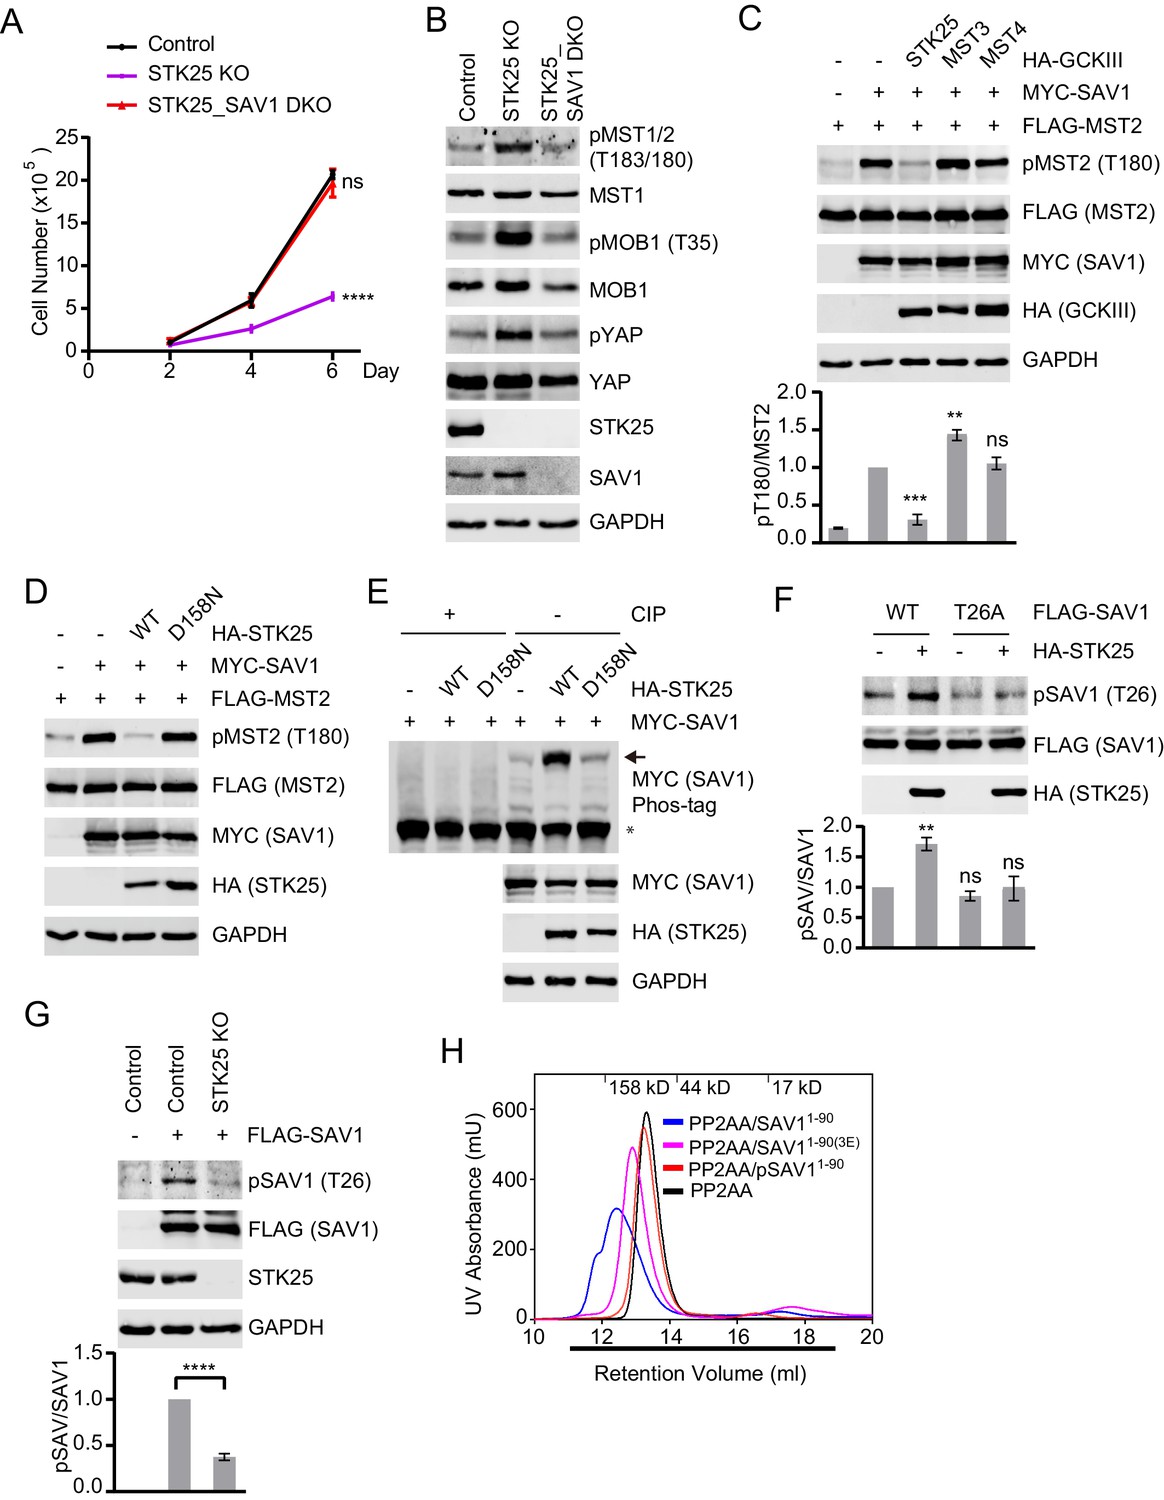
STK25 inhibits the ability of SAV1 to counteract STRIPAK.
(A) Cell proliferation assay. Cell proliferation curves in control (black), STK25 KO (purple), and STK25_SAV1 DKO (red) 293A cells were plotted, respectively. Cells were counted on days 2, 4, and 6 after seeding. Data shown are the means ± SEM of three independent experiments. Numbers of STK25 KO or STK25_SAV1 DKO cells on day 6 was compared to that of control cells (****p<0.0001; ns, non-significant). (B) Immunoblots of control, STK25 KO, and STK25_SAV1 DKO 293A cell lysates with the indicated antibodies. (C) Immunoblots of lysates of 293FT cells co-transfected with FLAG-MST2 and the indicated plasmids. The relative anti-pT180 intensities were normalized to MST2. Data are plotted as mean ± SEM of three biological replicates (***p<0.001; **p<0.01; ns, non-significant). (D) 293FT cells were co-transfected with FLAG-MST2 and the indicated plasmids. The total cell lysates were subjected to immunoblotting. (E) 293FT cells were co-transfected with MYC-SAV1 and HA-STK25. The cell lysates were treated with or without CIP (Calf Intestinal Alkaline phosphatase). CIP-treated and non-CIP-treated lysates were subjected to phos-tag gel analysis and immunoblotting. Asterisk and arrow designate non-phosphorylated SAV1 and phosphorylated SAV1, respectively. (F) Immunoblots and quantification of phosphorylated SAV1 (T26) levels of 293FT cells co-transfected with the indicated plasmids. (G) Control and STK25 KO 293A cells were transfected with FLAG-SAV1. The total cell lysates were blotted with the indicated antibodies. (F and G) The relative anti-pSAV1 intensities were normalized to SAV1. Data are plotted as mean ± SEM of three biological replicates (****p<0.0001; **p<0.01; ns, non-significant). (H) UV traces of the PP2AA and SAV11-90 complex (blue line), PP2AA and phosphorylated-SAV11-90 mixture (pSAV11-90, red line), PP2AA and SAV11-90(3E) mixture (magenta line), and PP2AA alone (black line) fractionated on a Superdex 200 gel filtration column, respectively. Corresponding molecular weight standards are indicated in kDa. The running buffer for Superdex 200 column containing 20 mM Tris (pH 8.0), 30 mM NaCl, and 1 mM TCEP. The underlined fractions were separated on SDS-PAGE and stained with Coomassie shown in Figure 3—figure supplement 1E.
Figure 3—figure supplement 1
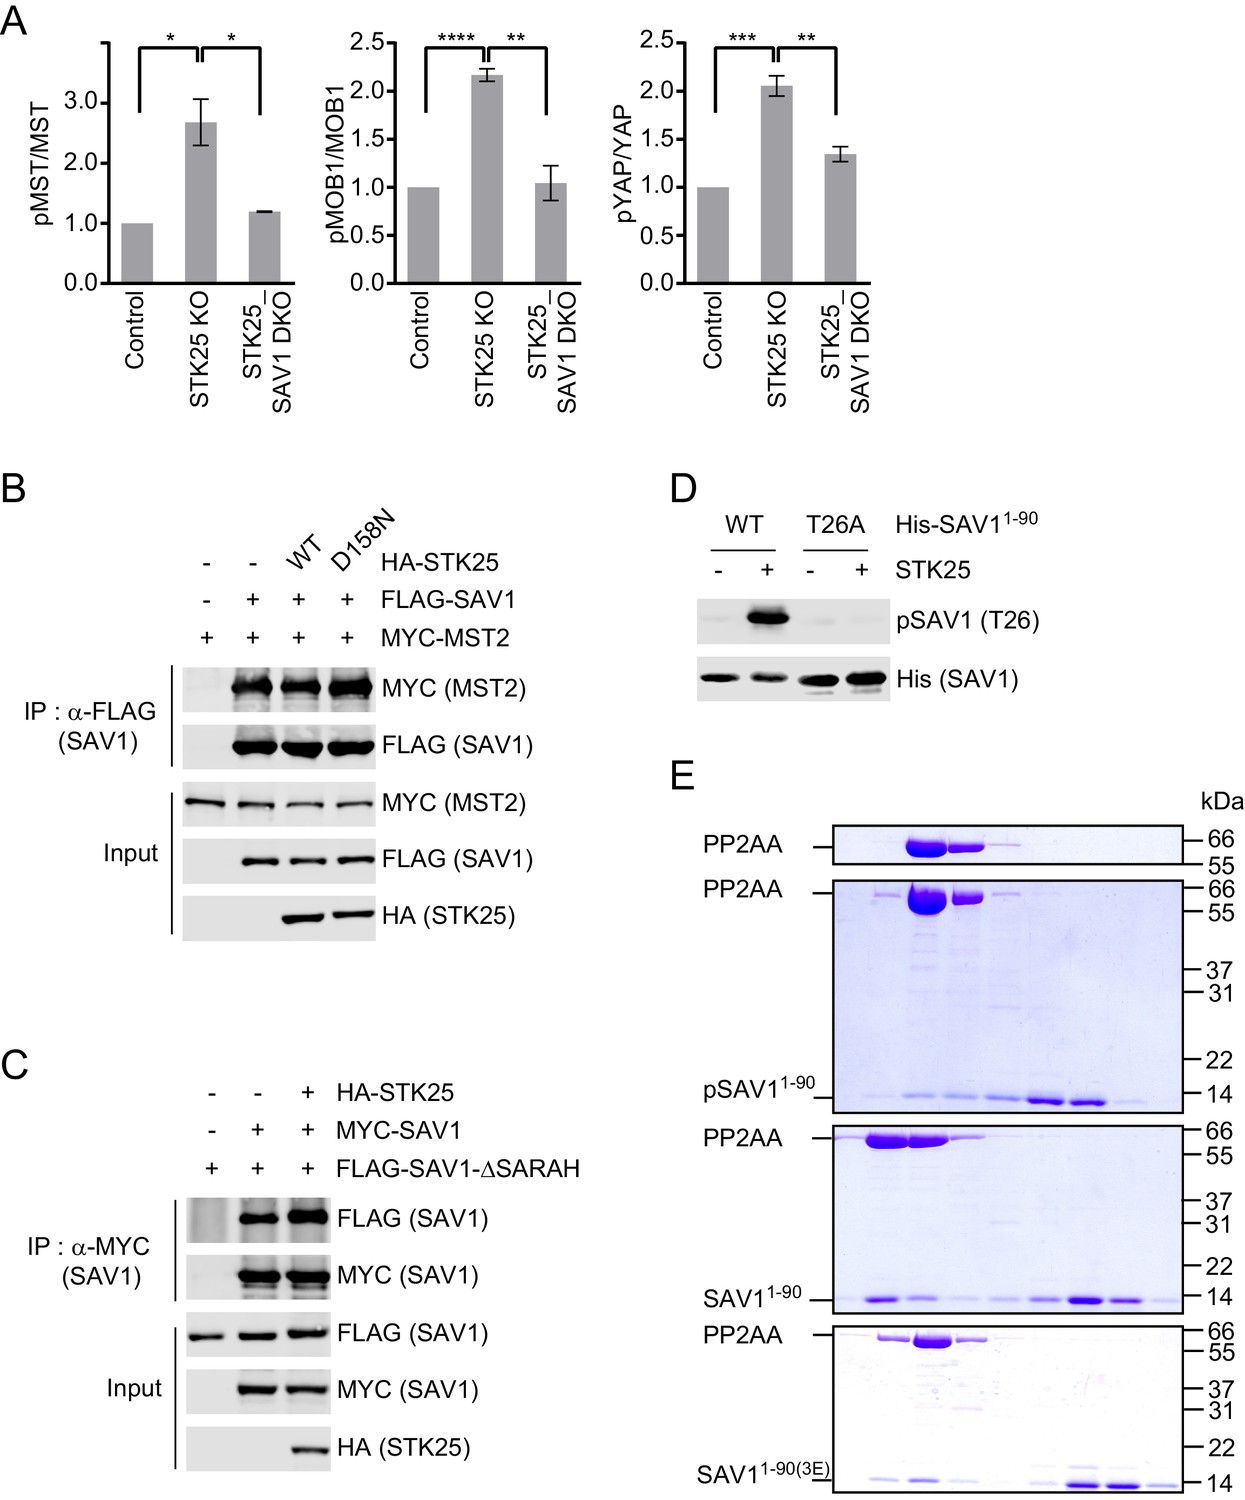
STK25 inhibits the ability of SAV1 to counteract STRIPAK.
(A) Quantification of the ratios of pMST/MST, pMOB1/MOB1, and pYAP/YAP signals in Figure 3B. Data are plotted as mean ± SEM of three biological replicates (****p<0.0001; ***p<0.001; **p<0.01; *p<0.05). (B and C) 293FT cells were co-transfected with the indicated plasmids. The total cell lysates (input) and anti-FLAG or anti-MYC IP were subjected to immunoblotting analysis. (D) In vitro kinase assays were performed using the indicated His-SAV11-90 proteins and recombinant STK25, and the reaction mixtures were blotted with the indicated antibodies. (E) Coomassie stained SDS-PAGE for the underlined fractions of PP2AA alone, PP2AA and pSAV11-90 mixture, the PP2AA and SAV11-90 complex, and PP2AA and SAV11-90(3E) mixture in Figure 3H.
Figure 3—figure supplement 2

SAV1 partially co-localizes with STK25 at the Golgi apparatus.
(A, B and C) 293A cells were transfected with the indicated plasmids. Cells were fixed and stained with anti-MYC (green), DAPI (blue), anti-GM130 (red), or anti-FLAG (red). Close-up images show co-localized regions. Scale bar, 2 μm.
Figure 4 with 2 supplements
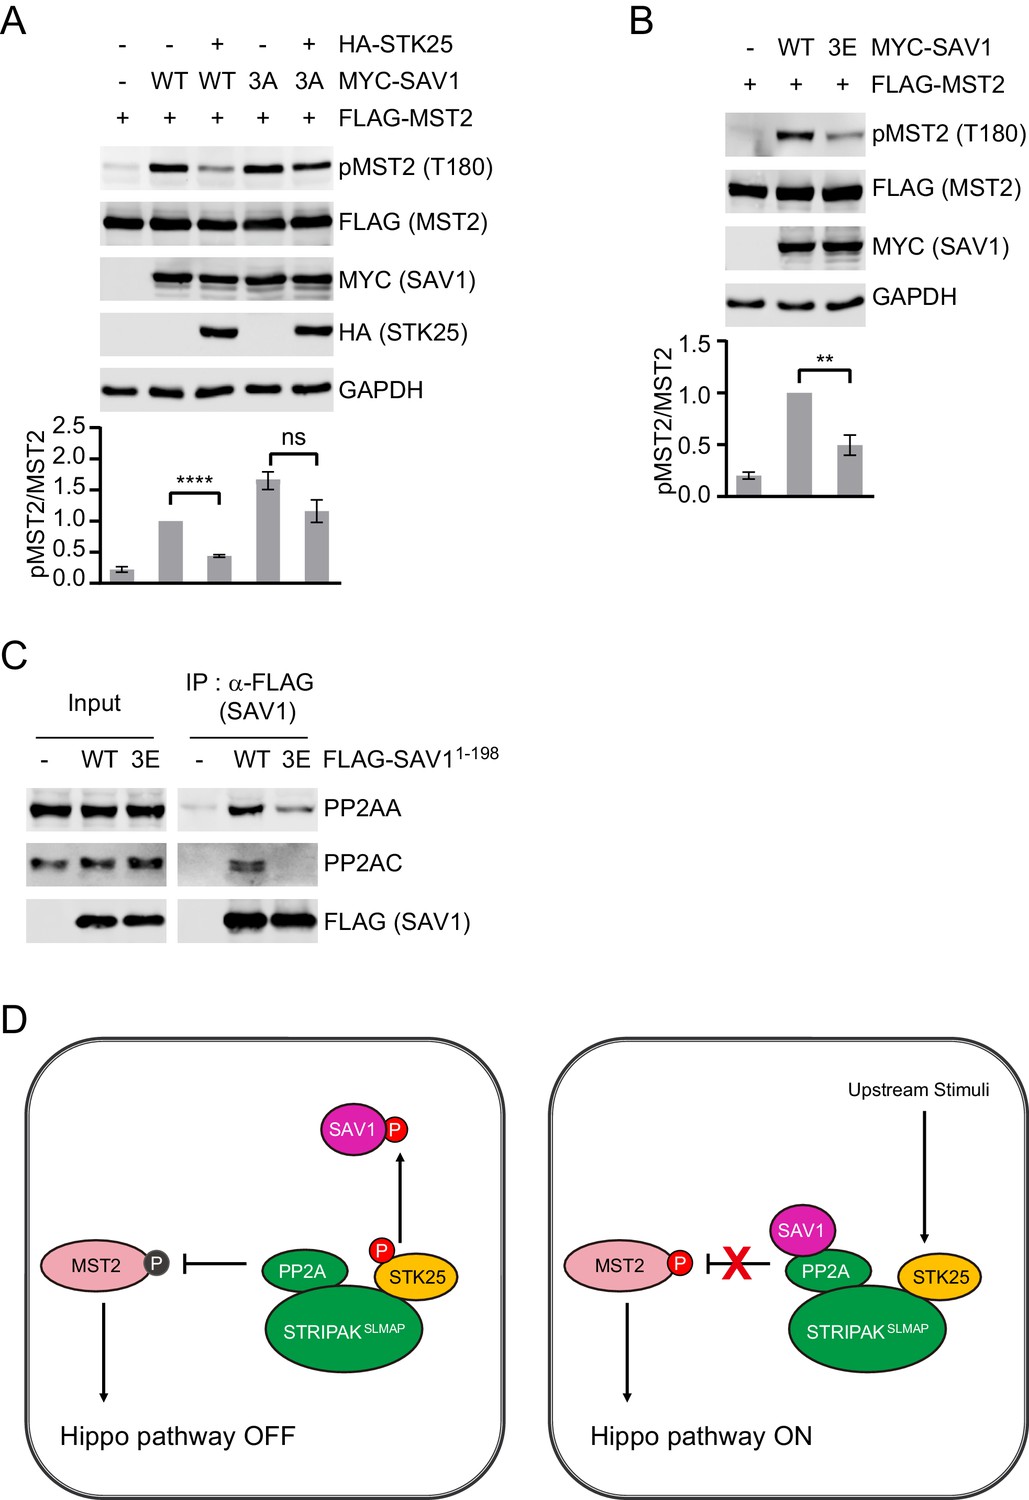
SAV1 phosphorylation by STK25 inhibits SAV1-dependent activation of MST1/2.
(A and B) Immunoblots and quantification of pT180 levels of lysates of 293FT cells co-transfected with FLAG-MST2 and the indicated plasmids. The relative anti-pT180 intensities were normalized to MST2. Data are plotted as mean ± SEM of three biological replicates (****p<0.0001; **p<0.01; ns, non-significant). (C) 293FT cells were transfected with the indicated FLAG-SAV1 plasmids. The total cell lysates (input) and anti-FLAG IP were blotted with the indicated antibodies. (D) Model for regulation of SAV1-STRIPAK antagonism by STK25.
Figure 4—figure supplement 1
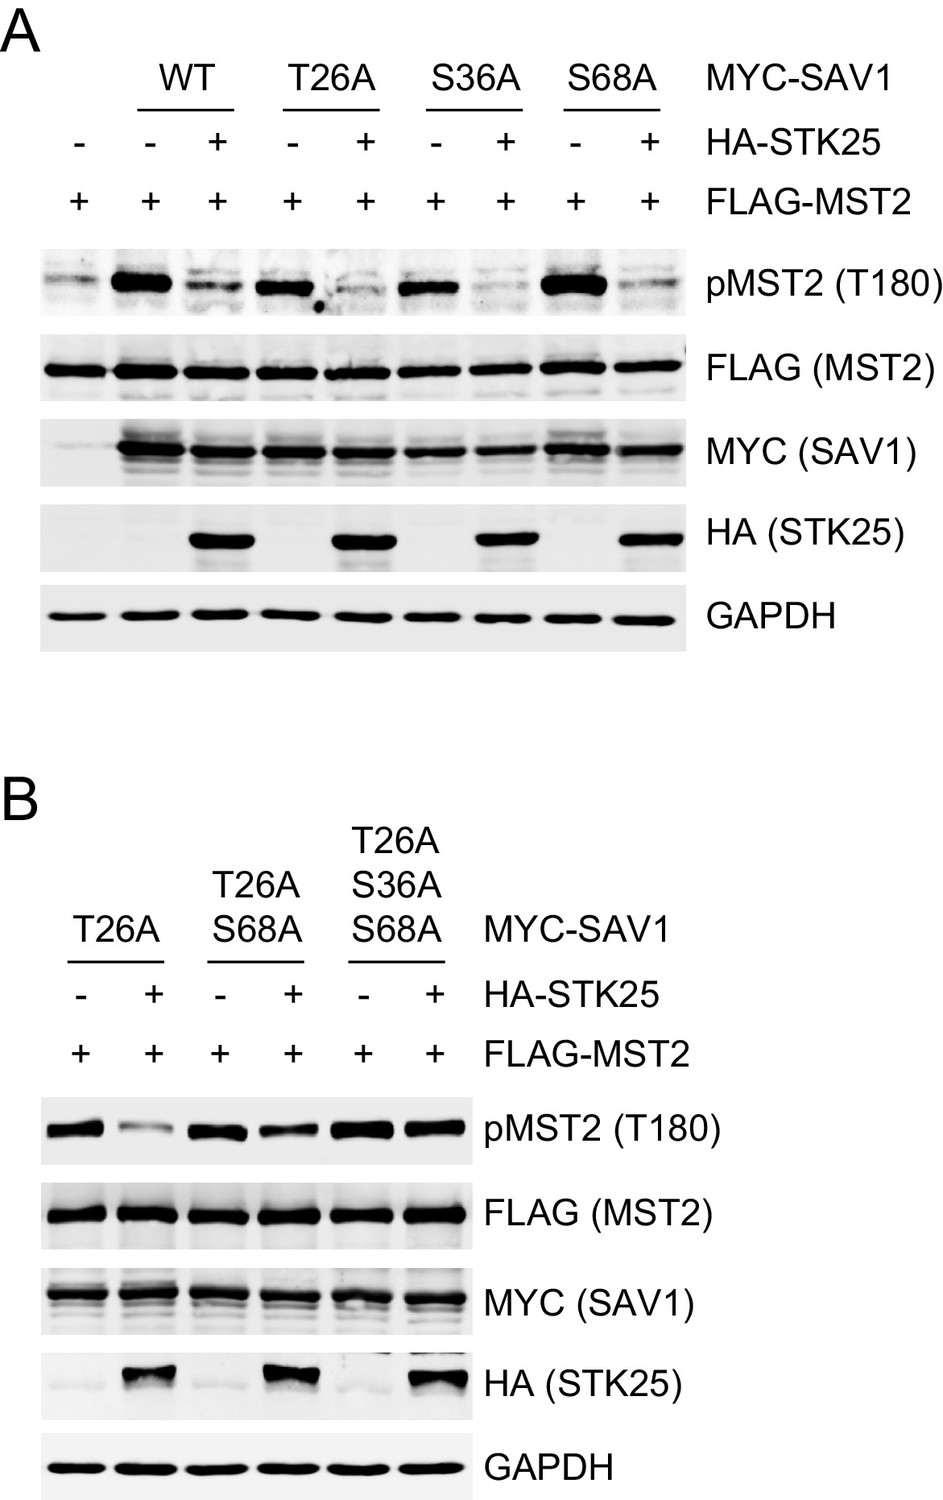
Single or double mutants of SAV1 are inhibited by STK25.
(A and B) Immunoblots of cell lysates of 293FT cells co-transfected with FLAG-MST2, HA-STK25, and the indicated MYC-SAV1 plasmids.
Figure 4—figure supplement 2
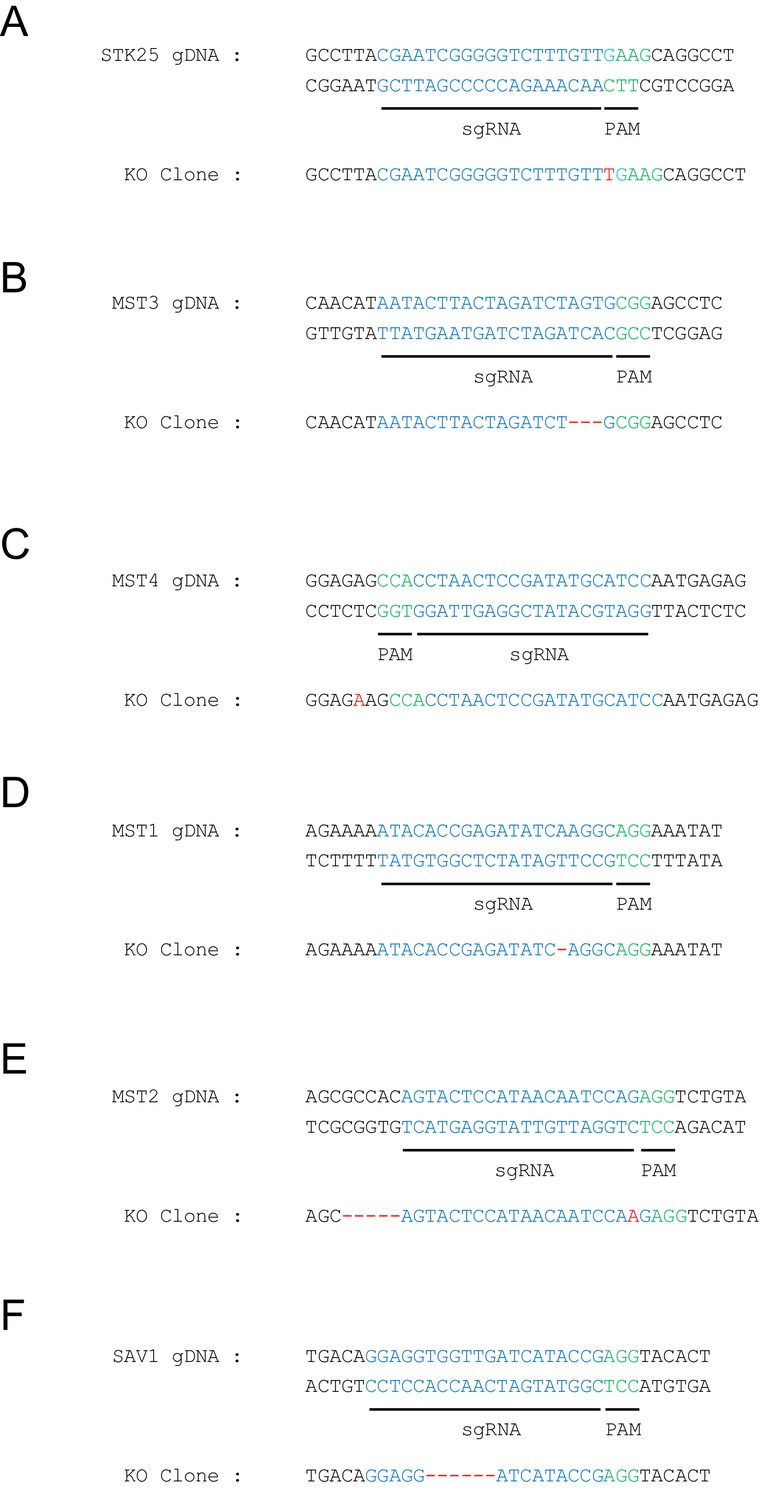
CRISPR/Cas9-induced indel mutations in 293A cells.
(A to F) Intact genomic sequences of STK25, MST3, MST4, MST1, MST2, and SAV1 are shown in the top panels. The indel mutations in corresponding KO cell lines are shown in the bottom panels.
Additional files
Download links
A two-part list of links to download the article, or parts of the article, in various formats.
Downloads (link to download the article as PDF)
Open citations (links to open the citations from this article in various online reference manager services)
Cite this article (links to download the citations from this article in formats compatible with various reference manager tools)
STK25 suppresses Hippo signaling by regulating SAV1-STRIPAK antagonism
eLife 9:e54863.
https://doi.org/10.7554/eLife.54863


