Universally high transcript error rates in bacteria
- Department of Biology, Indiana University, United States
- Center for Mechanisms of Evolution, The Biodesign Institute, Arizona State University, United States
Figures
Figure 1 with 2 supplements
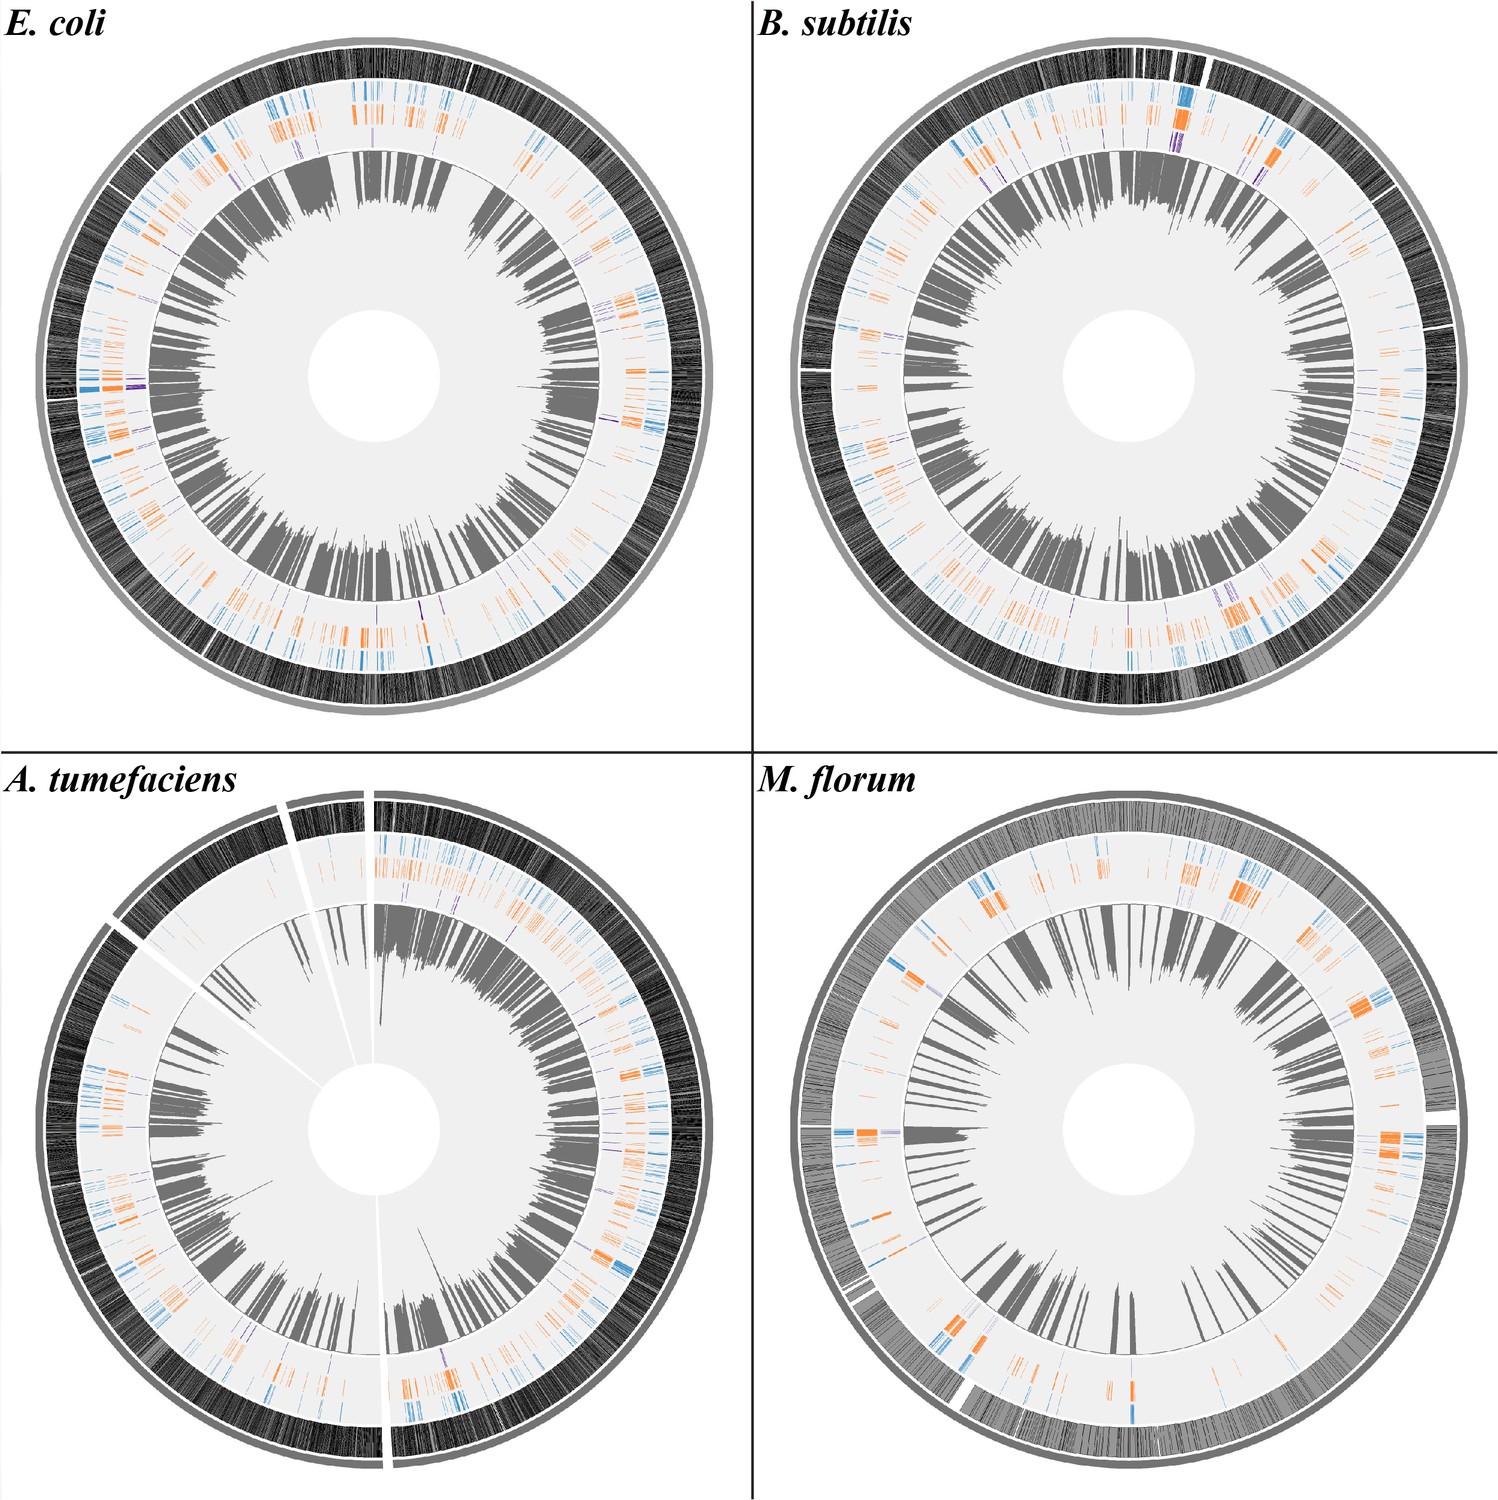
The distribution of transcript errors across the whole transcriptomes of E. coli, B. subtilis, A. tumefaciens, and M. florum.
The first nucleotide of the circular chromosome starts at the 12 o’clock position. For A. tumefaciens, chromosomes and plasmids are arranged from the largest to smallest size in a clockwise orientation. From the outer ring to the inner ring: bacterial chromosomes (dark gray), protein-coding region (grey, black strokes indicate gene densities), synonymous substitutions (blue), missense substitutions (orange), nonsense substitutions (purple) and average transcript-error rates (plots in dark gray) in a 10 kb sliding window with a step size of 1 bp (1 kb windows for M. florum). Windows without sufficient sequencing coverages to detect transcript errors are left blank.
-
Figure 1—source data 1
Numerical data that are represented as a graph in Figure 1.
- https://cdn.elifesciences.org/articles/54898/elife-54898-fig1-data1-v1.zip
Figure 1—figure supplement 1
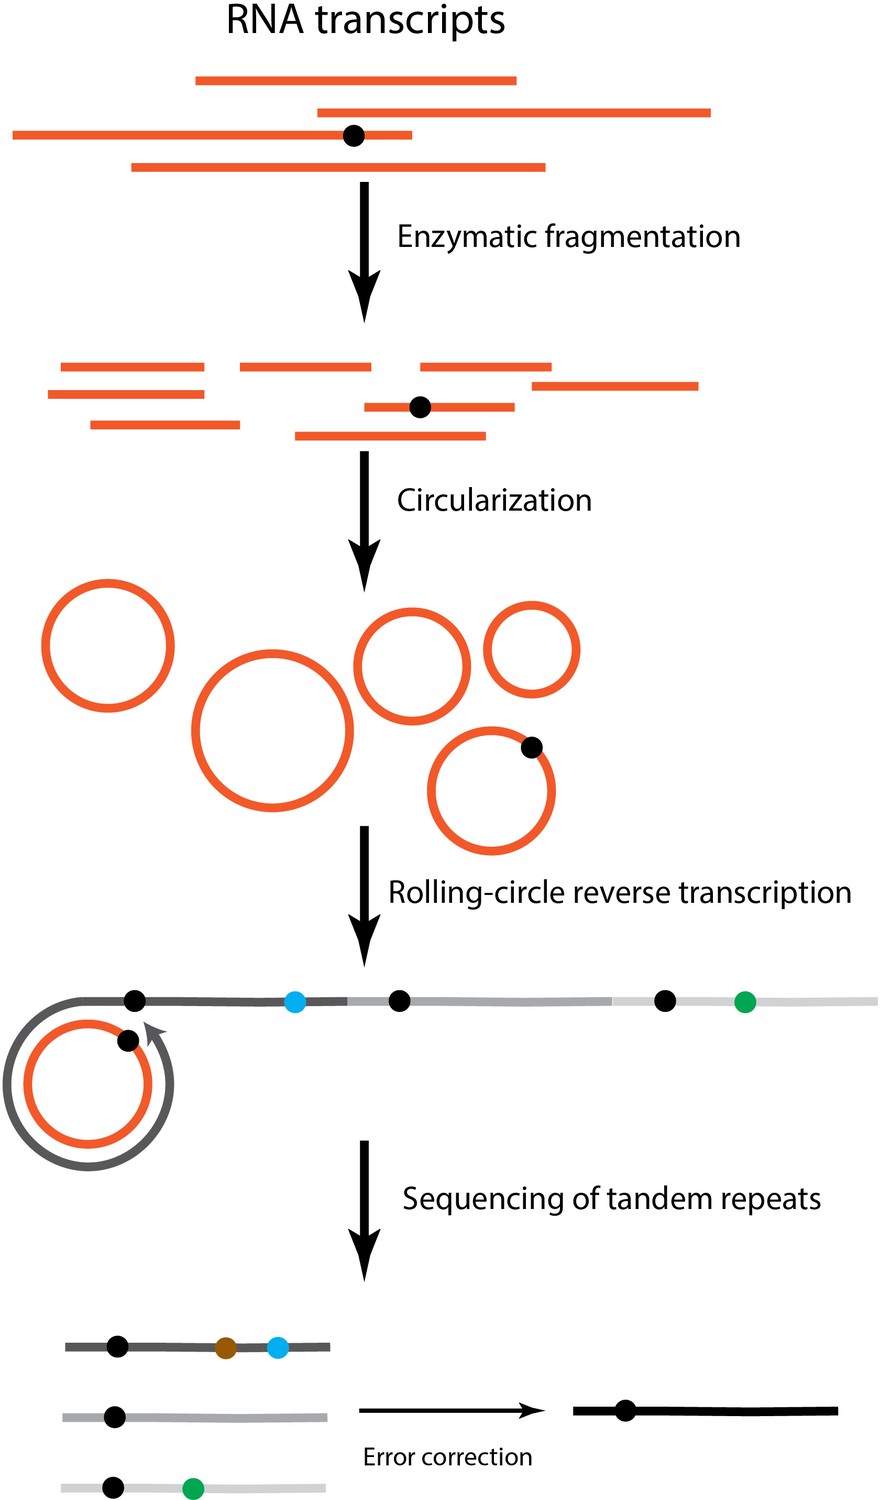
The flowchart of CirSeq method.
Total RNA transcripts are extracted, rRNA-depleted, and enzymatically fragmented. Afterwards, RNA fragments are circularized and go through rolling-circle reverse transcription. cDNAs with tandem repeats are generated to make sequencing libraries. The black dot indicates a transcript error. Dots in blue and green refer to errors that emerged during reverse transcription. The brown dot denotes a sequencing error. Transcript errors tend to appear on all repeats of sequencing reads while reverse transcription and sequencing errors are likely to be shown as singletons.
Figure 1—figure supplement 2
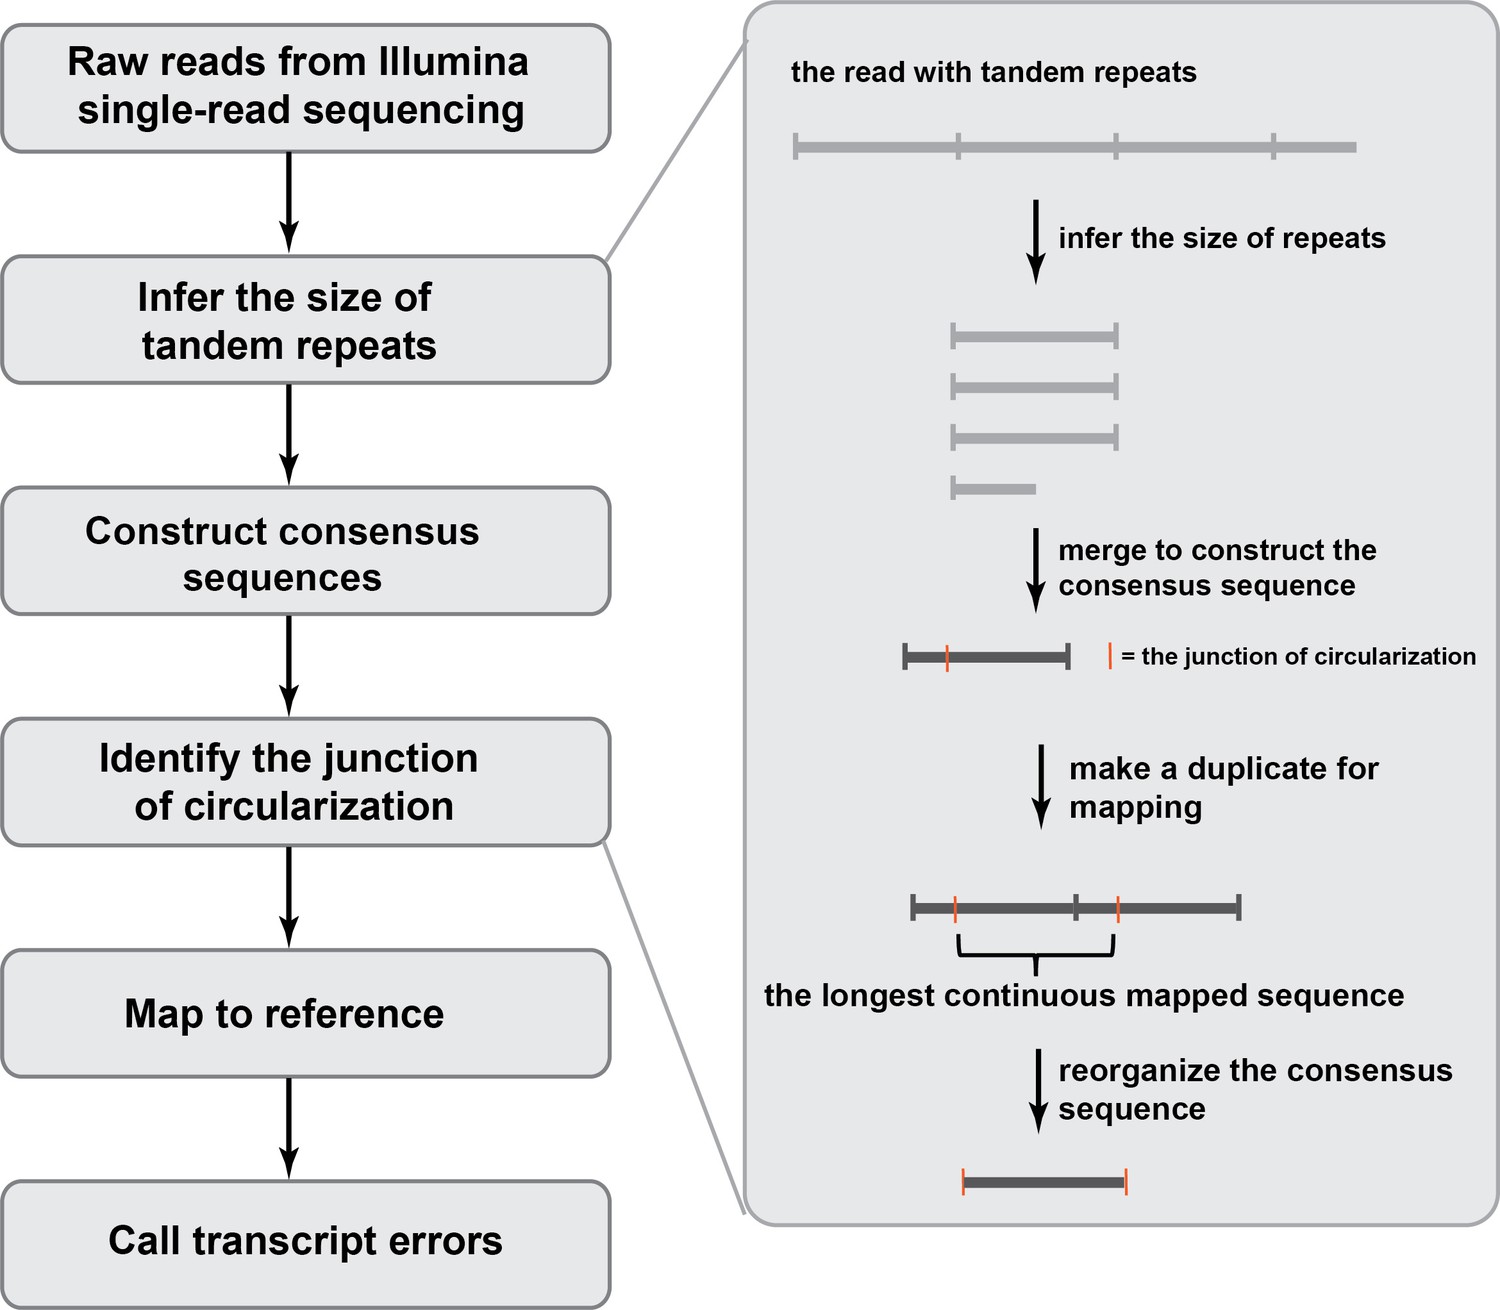
An overview of the bioinformatic pipeline to process CirSeq reads to identify transcript errors.
Different from reads generated by conventional RNA-seq, CirSeq reads may contain multiple tandem repeats and the size of the repeat needs to be inferred first. Afterwards, repeats within one read are merged to a construct consensus sequence. This is the error-correction step where technical errors get corrected and the sequencing quality score is recalculated. To reorganize the consensus sequence, we used a duplicate-based mapping approach and the longest continues mapped region corresponds to the original RNA fragment.
Figure 2
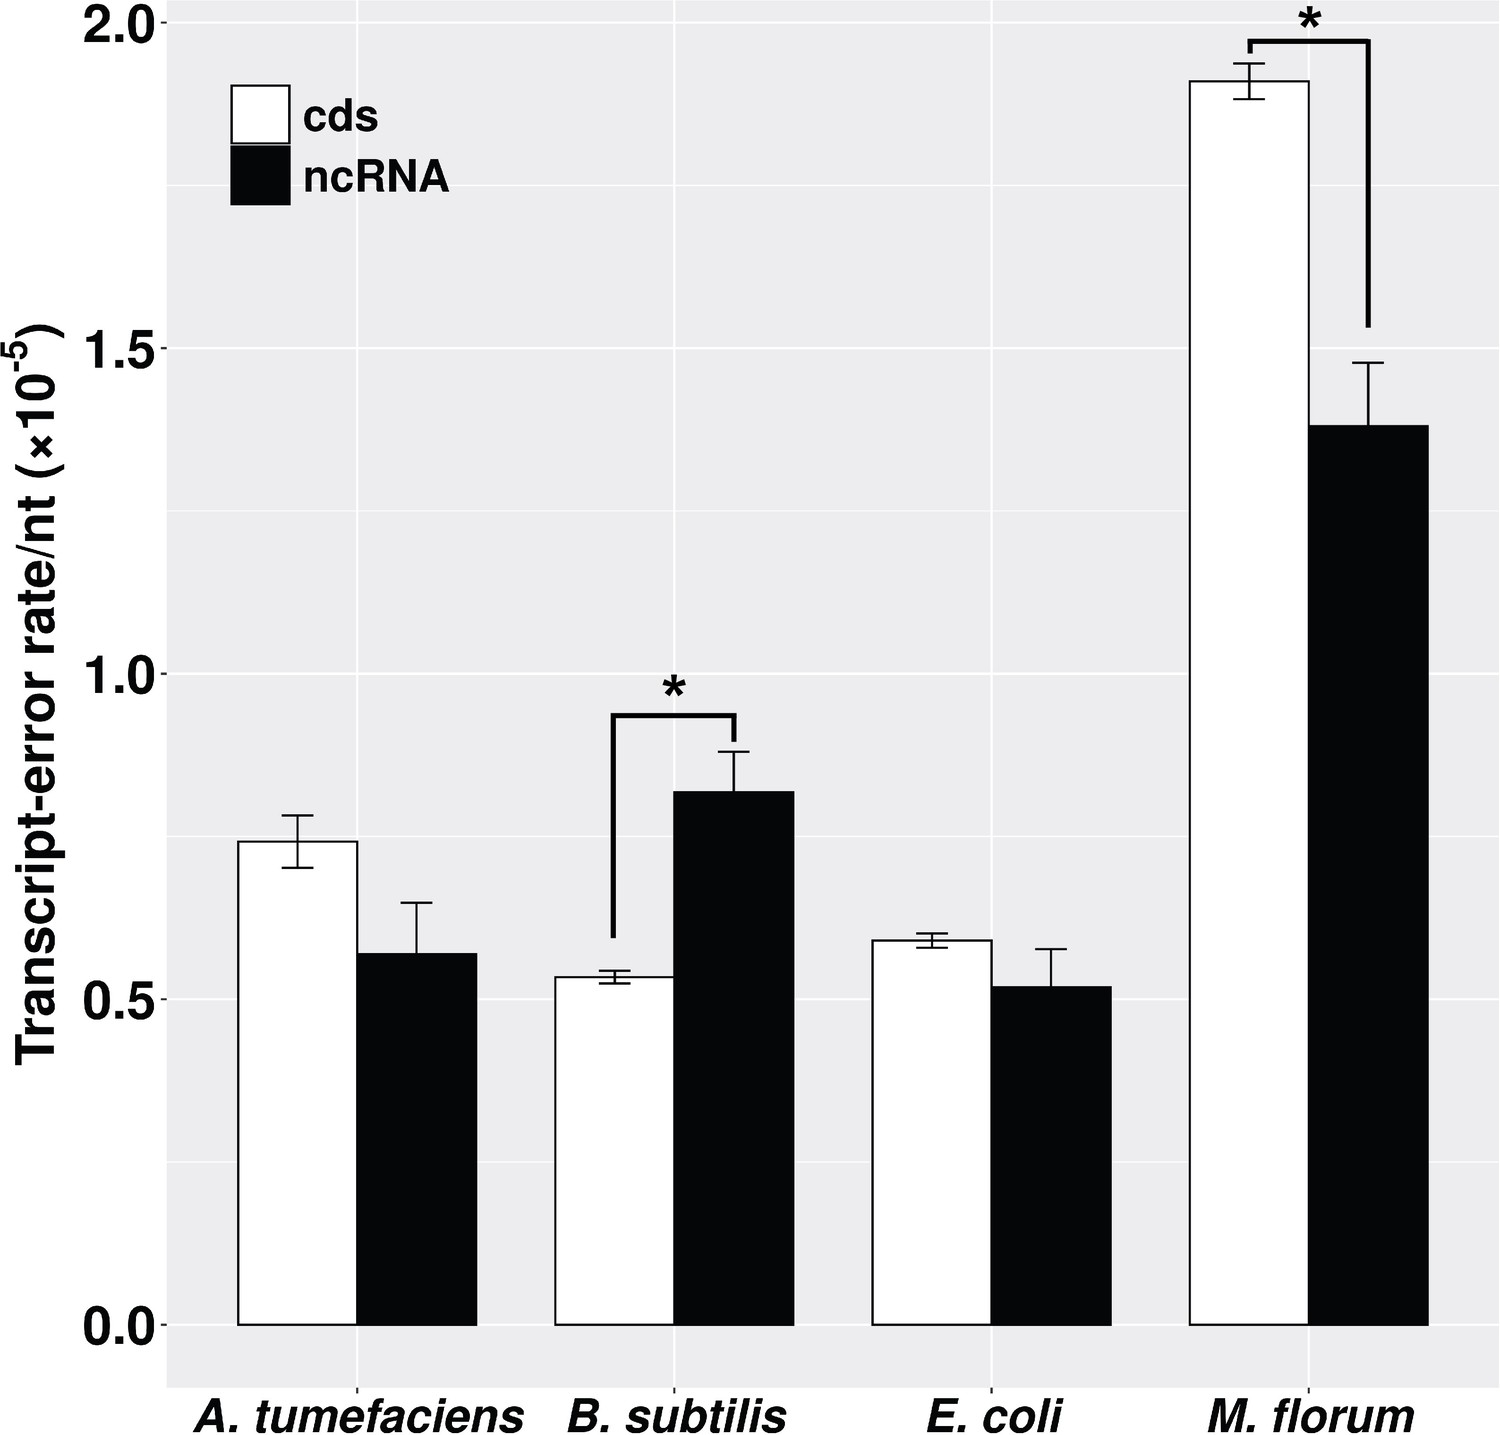
Transcript-error rates of protein-coding and ncRNA regions.
cds includes all protein-coding genes that were sequenced in this study. ncRNA refers to RNAs that are functional but not translated into proteins, for example tRNA and rRNA. Transcript-error rates were calculated by dividing the number of errors by the number of nucleotides assayed in corresponding regions. Error bars indicate standard errors. The level of significance difference is indicated by asterisks (*p<0.05, paired t-test).
-
Figure 2—source data 1
Numerical data that are represented as a graph in Figure 2.
- https://cdn.elifesciences.org/articles/54898/elife-54898-fig2-data1-v1.txt
Figure 3
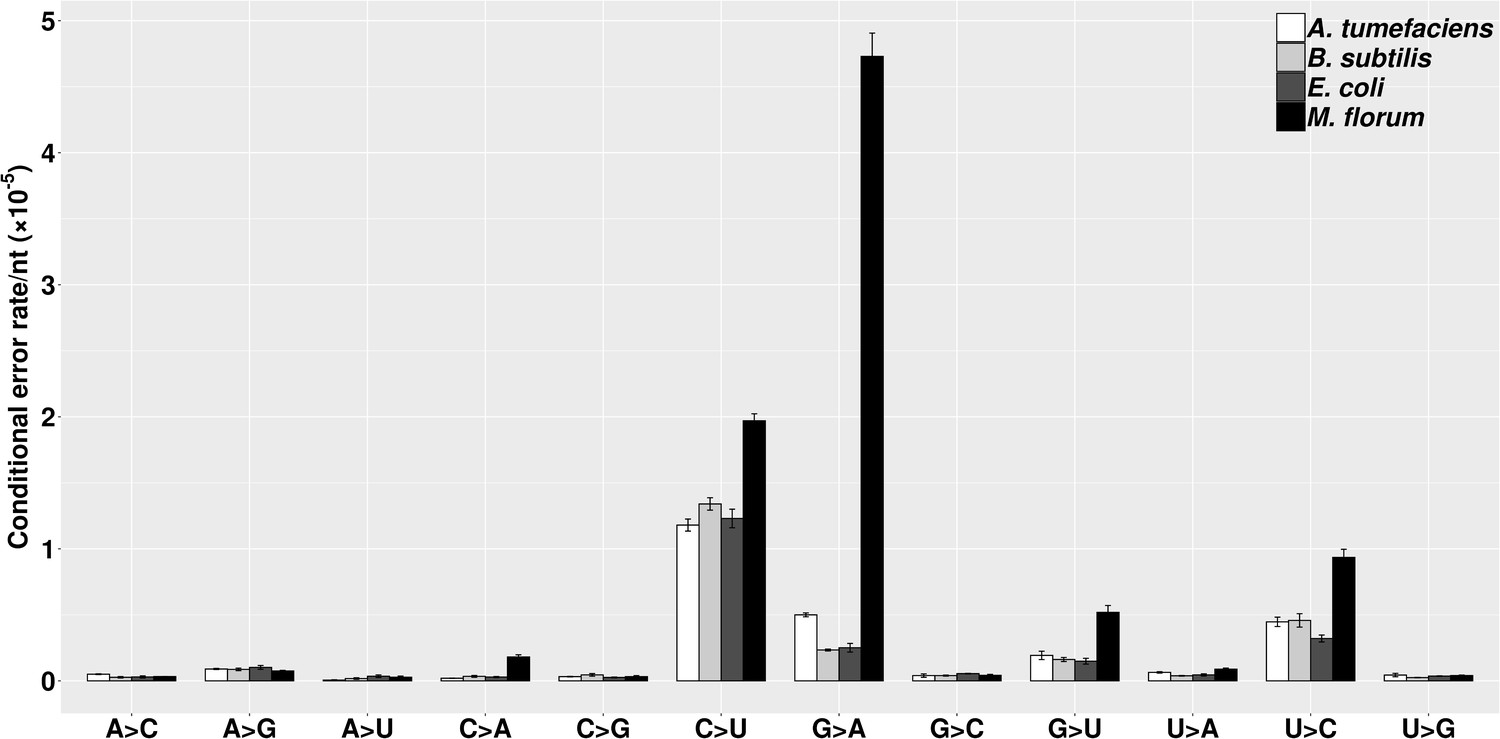
The molecular spectra of transcript errors for four bacterial species.
The conditional error rates of each type of substitutions were calculated from the number of particular transcript errors, divided by the number of corresponding ribonucleotides assayed. Error bars indicate standard errors.
-
Figure 3—source data 1
Numerical data that are represented as a graph in Figure 3.
- https://cdn.elifesciences.org/articles/54898/elife-54898-fig3-data1-v1.txt
Figure 4 with 2 supplements
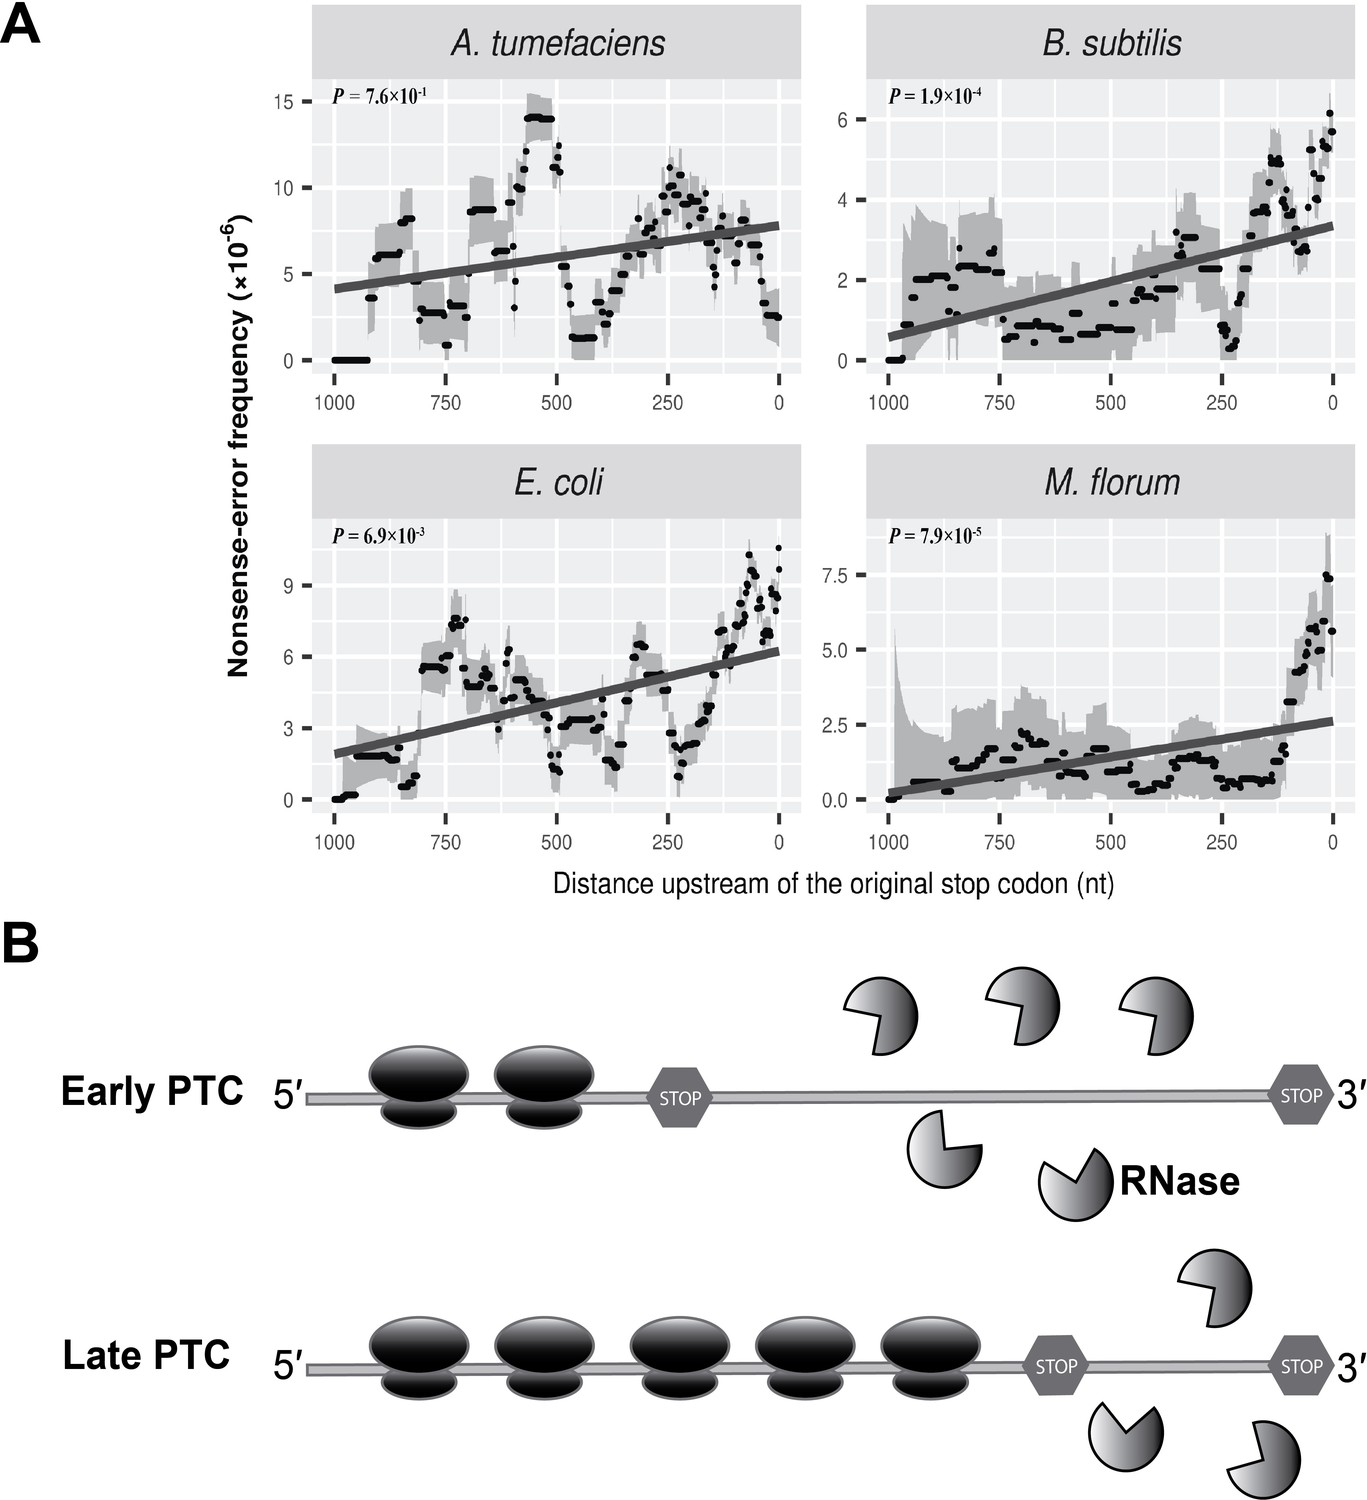
Nonsense errors in prokaryotic transcripts.
(A) Distributions of nonsense errors across mRNA transcripts. The frequency of nonsense errors is calculated in a 100-nt sliding window with a step size of 1 nt for data visualization. Grey intervals represent standard deviations assuming the number of errors at each locus follows a binomial distribution. Linear regression between the distance to the original stop codon and the frequency of nonsense errors of each window is indicated in dark grey lines. P values were calculated from weighted linear regressions of individual data points before binning into a window. (B) The ribosome-release model for PTCs degradation in prokaryotes. Compared to a late PTC, an early PTC results in a larger portion of ribonucleotides unprotected by ribosomes, and therefore a higher probability of being digested by cellular ribonuclease.
-
Figure 4—source data 1
Numerical data that are represented as a graph in Figure 4A.
- https://cdn.elifesciences.org/articles/54898/elife-54898-fig4-data1-v1.txt
Figure 4—figure supplement 1
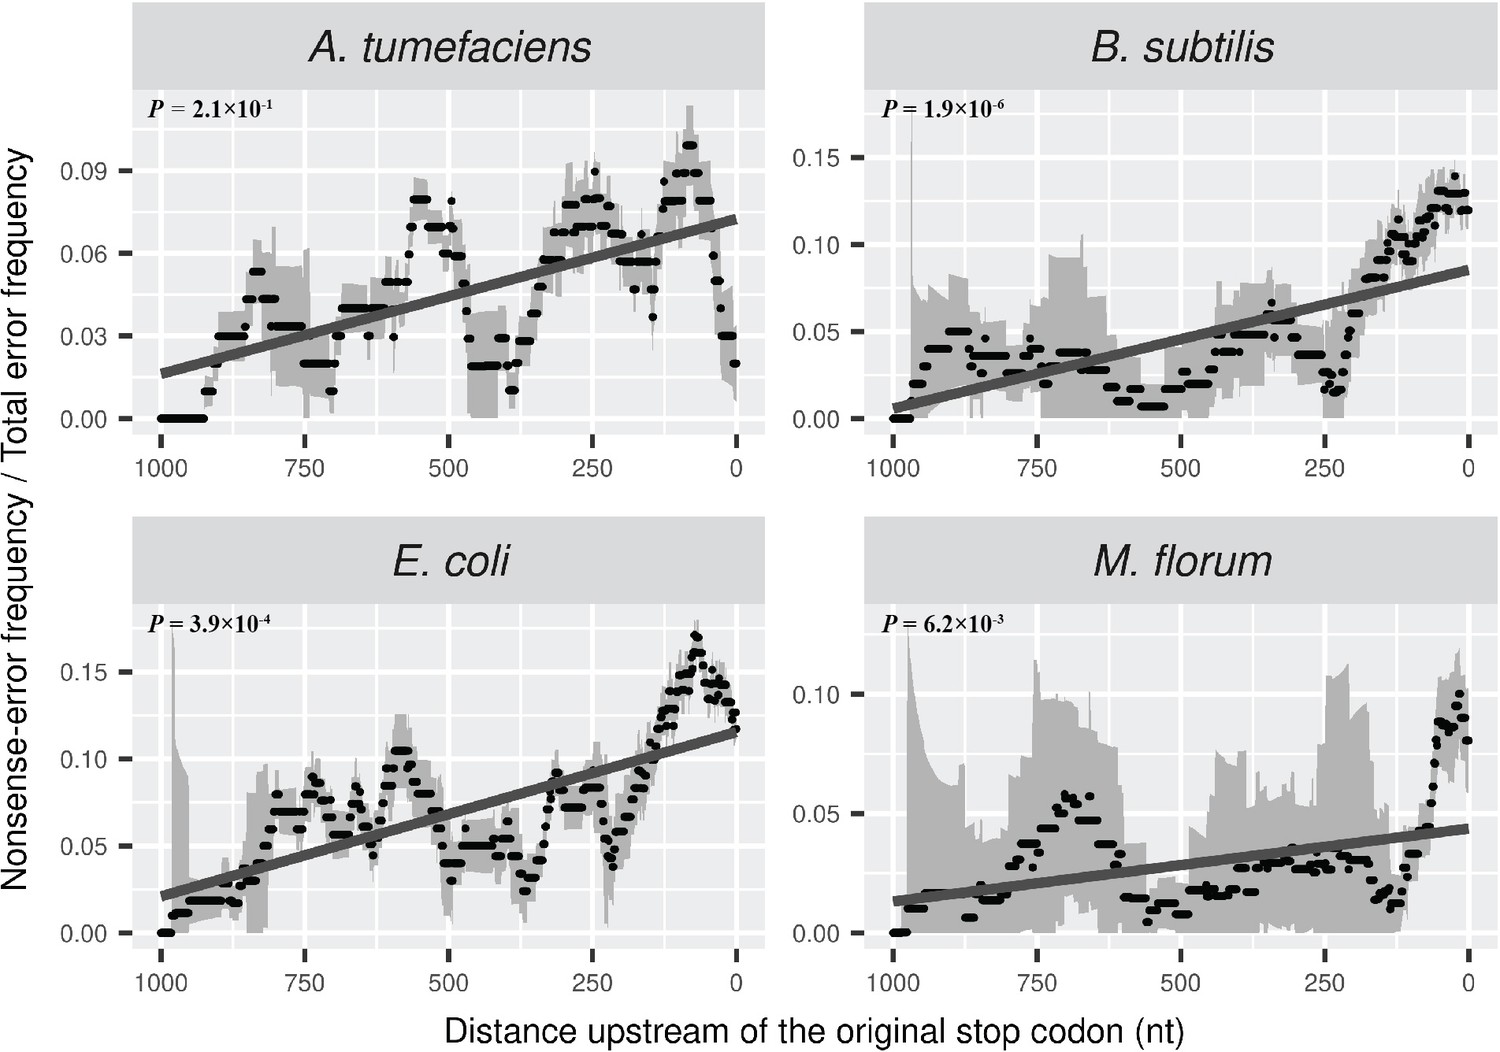
Distributions of the ratio of nonsense error frequency to total error frequency across mRNA transcripts.
The ratio is calculated in a 100-nt sliding window with a step size of 1 nt for data visualization. Grey intervals represent standard deviations. Linear regression between the distance to the original stop codon and the frequency of nonsense errors of each window is indicated in dark grey lines. P values were calculated from weighted linear regressions of individual data points before binning into a window.
-
Figure 4—figure supplement 1—source data 1
Numerical data that are represented as a graph in Figure 4—figure supplement 1.
- https://cdn.elifesciences.org/articles/54898/elife-54898-fig4-figsupp1-data1-v1.txt
Figure 4—figure supplement 2
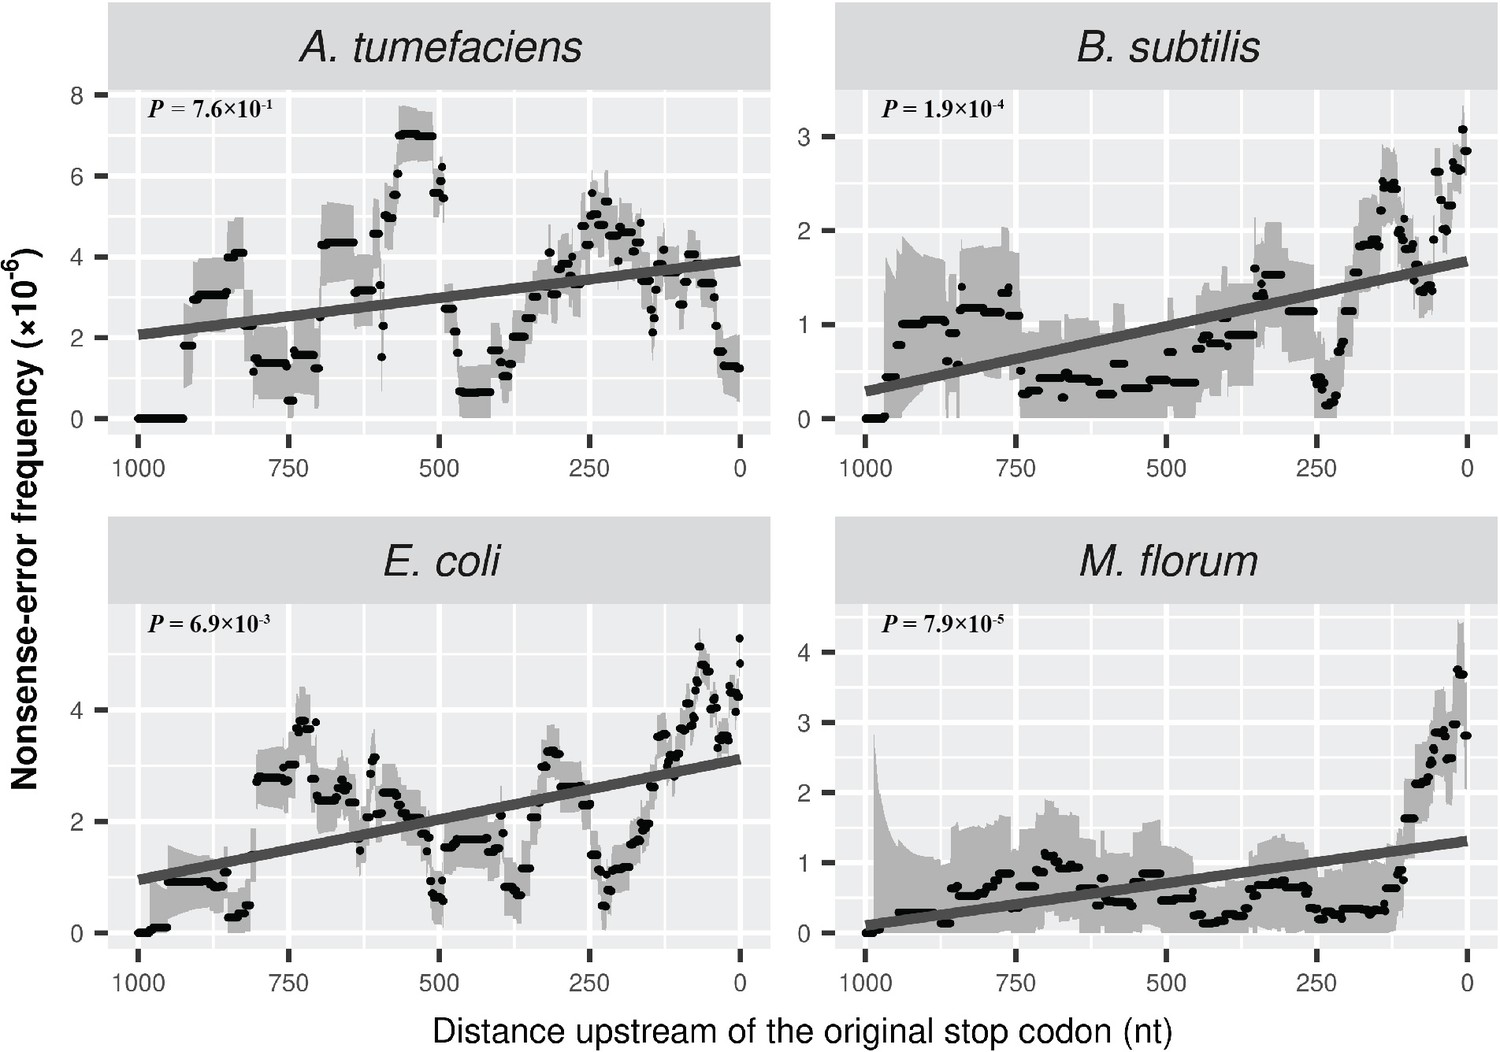
Distribution of PTCs across the length of mRNA transcripts.
Compared to Figure 4A, the frequency is further normalized by the number of one-off codons within each sliding window. Grey intervals represent standard deviations. Linear regression between the distance to the original stop codon and the frequency of nonsense errors of each window is indicated in dark grey lines. P values were calculated from weighted linear regressions of individual data points before binning into a window.
-
Figure 4—figure supplement 2—source data 1
Numerical data that are represented as a graph in Figure 4—figure supplement 2.
- https://cdn.elifesciences.org/articles/54898/elife-54898-fig4-figsupp2-data1-v1.txt
Author response image 1
Tables
Table 1
Percentages of transcript errors in mRNAs that are synonymous, missense, or nonsense (other potential types of transcript errors with small percentages, such as start/stop codon loss-errors, are not shown).
Observed and expected (in parentheses) percentages are presented. Based on the bias of observed rNTP substitution rates and codon usages of each bacterium, expected percentages are calculated assuming a random generation of errors and an absence of error-correction processes. The level of significant difference is indicated by asterisks (*P < 0.05, ** P < 0.005, χ2 test).
| Species | Synonymous | Missense | Nonsense |
|---|---|---|---|
| E. coli | 40.18 (34.35) ** | 56.25 (59.79) * | 3.57 (5.62) ** |
| B. subtilis | 32.76 (31.86) | 61.69 (61.63) | 5.15 (6.15) |
| A. tumefaciens | 40.68 (36.76) * | 56.36 (59.17) | 2.96 (3.86) |
| M. florum | 17.58 (24.12) ** | 79.27 (70.58) ** | 2.37 (4.85) ** |
Additional files
-
Supplementary file 1
Supplementary Table 1.
Estimates of transcript indel error rates of four bacterial species. Standard error of the mean from three biological replicates are displayed. Supplementary Table 2—5. The Observed and expected numbers of transcript errors in genes of four bacterial species. Supplementary Table 6. The transition/transversion error bias revealed in four bacterial species. Supplementary Table 7. The observed and expected numbers/percentages of transcript errors that are synonymous, nonsynonymous, or nonsense. Supplementary Table 8. The numbers and rates of detected transcript errors that are from ncRNA transcripts in four bacterial species.
- https://cdn.elifesciences.org/articles/54898/elife-54898-supp1-v1.xlsx
-
Transparent reporting form
- https://cdn.elifesciences.org/articles/54898/elife-54898-transrepform-v1.docx
Download links
A two-part list of links to download the article, or parts of the article, in various formats.
Downloads (link to download the article as PDF)
Open citations (links to open the citations from this article in various online reference manager services)
Cite this article (links to download the citations from this article in formats compatible with various reference manager tools)
Universally high transcript error rates in bacteria
eLife 9:e54898.
https://doi.org/10.7554/eLife.54898


