Mayday sustains trans-synaptic BMP signaling required for synaptic maintenance with age
- Department of Biological Sciences, Lehigh University, United States
Figures
Figure 1

Progressive loss of flight in 3PM71 mutants.
(A) Illustration depicting the location and morphology of the dorsal longitudinal muscles within the thorax. (B) The six muscle fibers and five motor neurons that innervate them are highlighted. (C) Further magnification of a single muscle fiber reveals the en passant boutons and NMJ structures. (D) Side and (E) Dorsal view of motor neuron cell bodies located within the thoracic ganglion. (F) The average landing height of Wild Type (WT) and 3PM71 mutants at days 3 and 25. Each dot represents a single fly in the violin plot. Sample sizes for each plot: WT Day 3 n = 51, with a landing average of 77.6 cm, 3PM71 Day 3 n = 54, landing average 74.1 cm, Day 25 WT n = 65, landing average 68.3 cm, and 3PM71 Day 25 n = 51, and landing average 9.4 cm. 3PM71 mutants have a progressive loss of flight ability in comparison to WT. Black bars represent median values. ****, p-value<0.0001 using A Brown-Forsythe and Welch ANOVA tests with Post hoc Games-Howell’s multiple comparisons. N.S. = Not Significant.
-
Figure 1—source data 1
Raw data for Figure 1 flight scores.
- https://cdn.elifesciences.org/articles/54932/elife-54932-fig1-data1-v1.xlsx
Figure 2

Progressive loss of NMJ integrity in 3PM71 mutants.
(A–D) Confocal images of DLM NMJs labeled with FITC-conjugated HRP (green) at 63X magnification. (E–G) Quantification of (E) Total Branch Length, (F) Branch number, and (G) Bouton Number at both WT and 3PM71 NMJs. Sample size was n = 20 for each group. Black bars represent mean values. The mean total branch lengths for each data set from left to right as depicted in the graph (530.5 µM, 519.5 µM, 495.1 µM, and 274.9 µM). The mean branch number for each group as follows: 45, 39, 40, and 15. The mean bouton number (G) for each group as ordered in the panel, 185, 179, 161, and 43. ****, p-value<0.0001, *** p-value<0.001 using a Brown-Forsythe and Welch ANOVA tests with Post Hoc Dunnett’s multiple comparisons. N.S. = Not Significant. Scale bar in D represents 20 µM for all confocal images.
-
Figure 2—source data 1
Raw data for synaptic morphology.
- https://cdn.elifesciences.org/articles/54932/elife-54932-fig2-data1-v1.xlsx
Figure 3 with 1 supplement
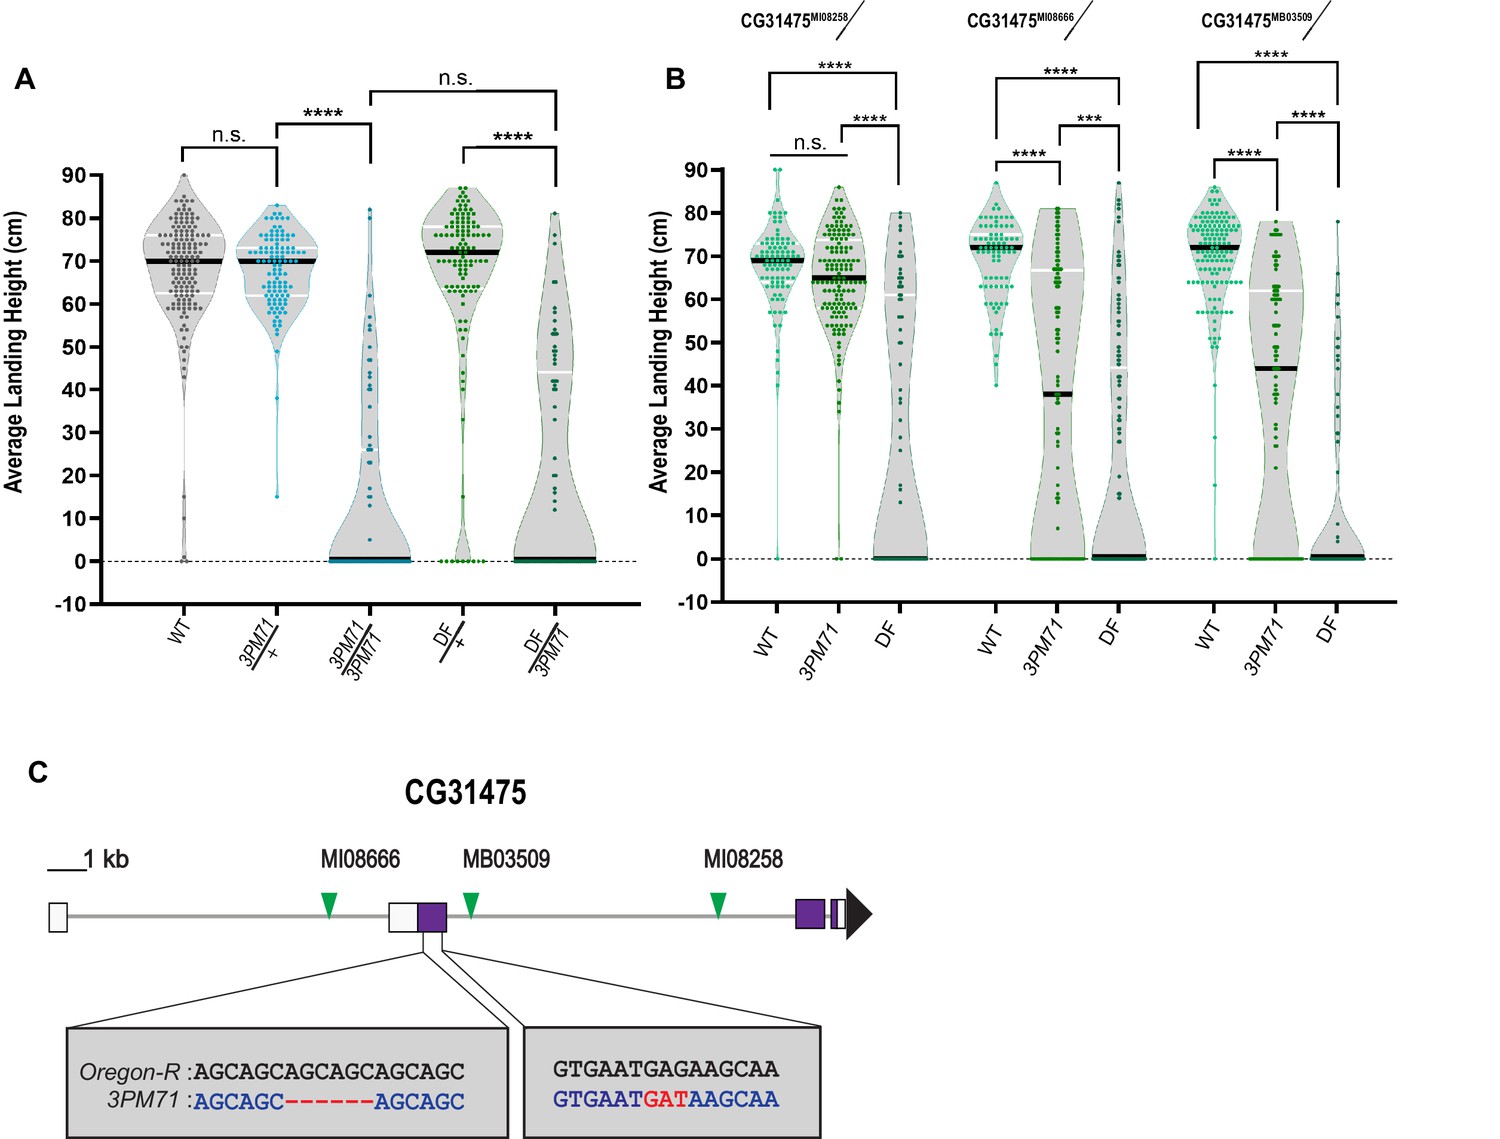
3PM71 mutation maps to CG31475.
(A) Deficiency mapping of 3PM71 mutants to a small region of chromosome 3R using Df(3R)ED5938. The average landing height (cm) and sample size for each group as ordered in the figure are, WT 67.4 cm, n = 149, 3PM71/+ 67.4 cm, n = 108, 3PM71 13.3 cm, n = 77, Df(3R)ED5938/+ 65.4 cm, n = 113, and Df(3R)ED5938/3PM71 20.2 cm, n = 73. (B) Flight performance of insertion alleles in CG31475 (CG31475MI08258, CG31475MI08666, and CG31475MB03509) alone and in combination with 3PM71 and Df(3R)ED5938. For each group, the landing average (cm) and sample size are as follows: CG31475MI08258/+ 67.5 cm, n = 92, CG31475MI08258/3PM71 64.3 cm, n = 140, CG31475MI08258/Df 26.9 cm, n = 78, CG31475MI08666/+ 69.3 cm, n = 81, CG31475MI08666/3PM71 36.2 cm, n = 108, CG31475MI08666/Df 20.4 cm, n = 156, CG31475MB03509/+ 69.3 cm, n = 137, CG31475MB03509/3PM71 36.9 cm, n = 101, and CG31475MB03509/Df 11.6 cm, n = 72. (C) 3PM71 mutants map to the previously uncharacterized gene, CG31475. Green arrows represent the location of current CG31475 alleles. White and purple boxes represent exons. Black bars represent the median values. and ****p<0.0001, ***p<0.001, using A Brown-Forsythe and Welch ANOVA tests with Post hoc Games-Howell’s multiple comparisons. N.S. = Not Significant.
-
Figure 3—source data 1
Raw data for Figure 3 flight scores.
- https://cdn.elifesciences.org/articles/54932/elife-54932-fig3-data1-v1.xlsx
-
Figure 3—source data 2
Raw data for transcript expression.
- https://cdn.elifesciences.org/articles/54932/elife-54932-fig3-data2-v1.xlsx
Figure 3—figure supplement 1
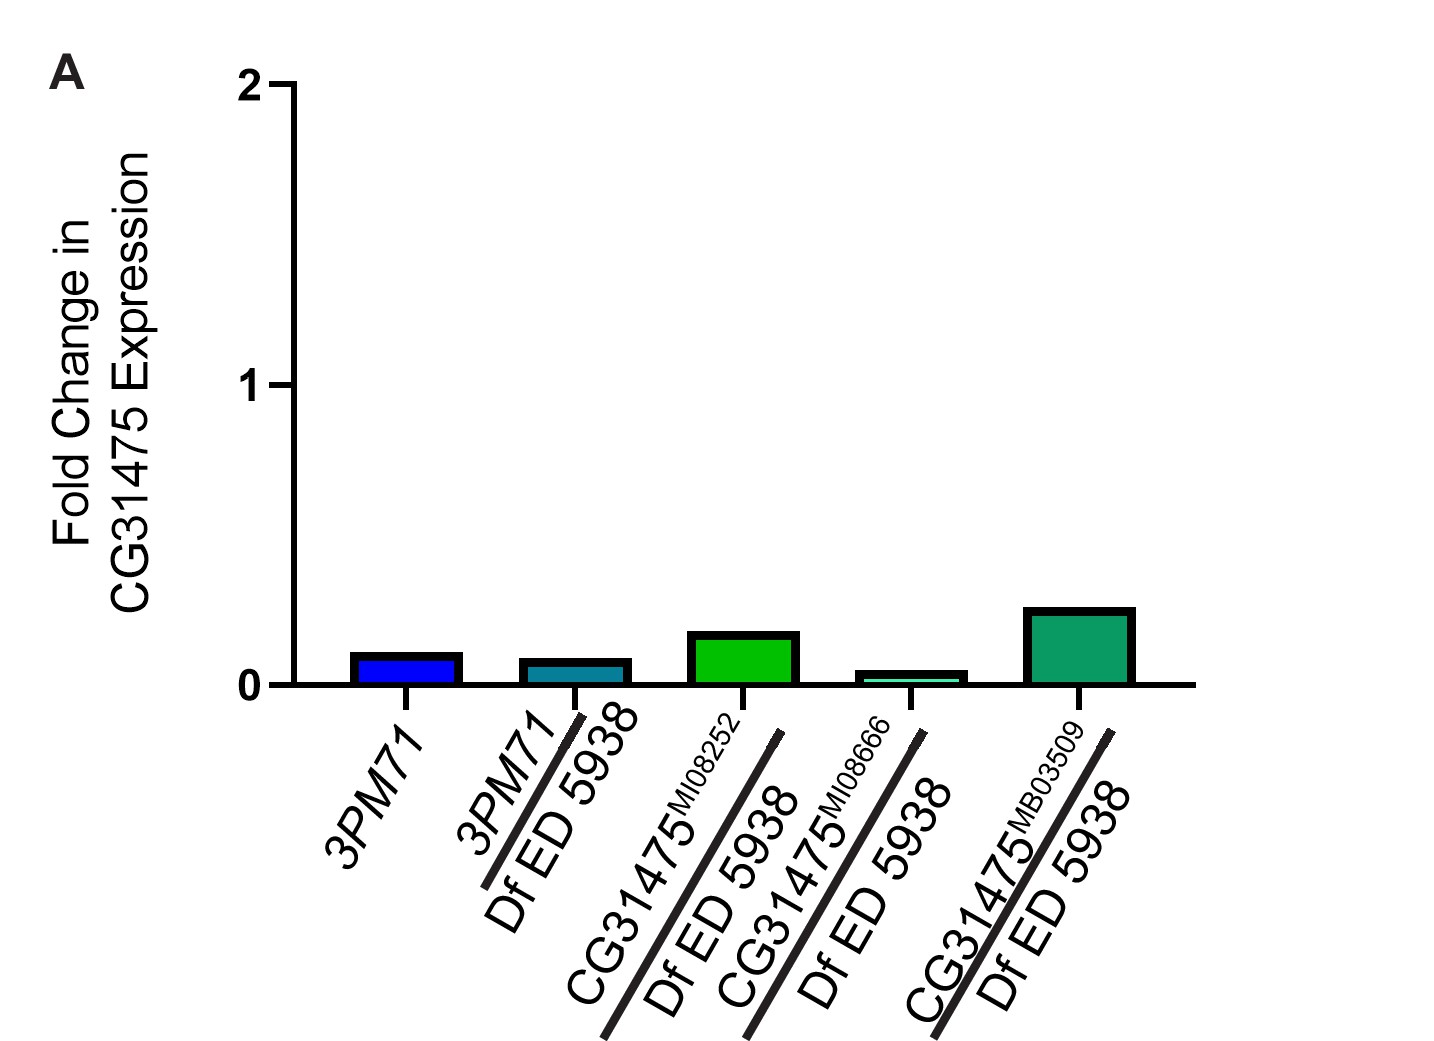
qPCR results.
The fold change in CG31475 expression in comparison to WT. qPCR results were calculated by comparison of CG31475 transcript levels to Actin5C as an internal control using the 2(-▲▲CT) method. The fold change for 3PM71, 0.11, 3PM71/Df ED 5938 0.09, CG31475MI08282/Df ED 5938 0.18, CG31475MI08866/Df ED 5938 0.05 and CG31475MB03509/Df ED 5938 0.26, respectively.
Figure 4 with 3 supplements
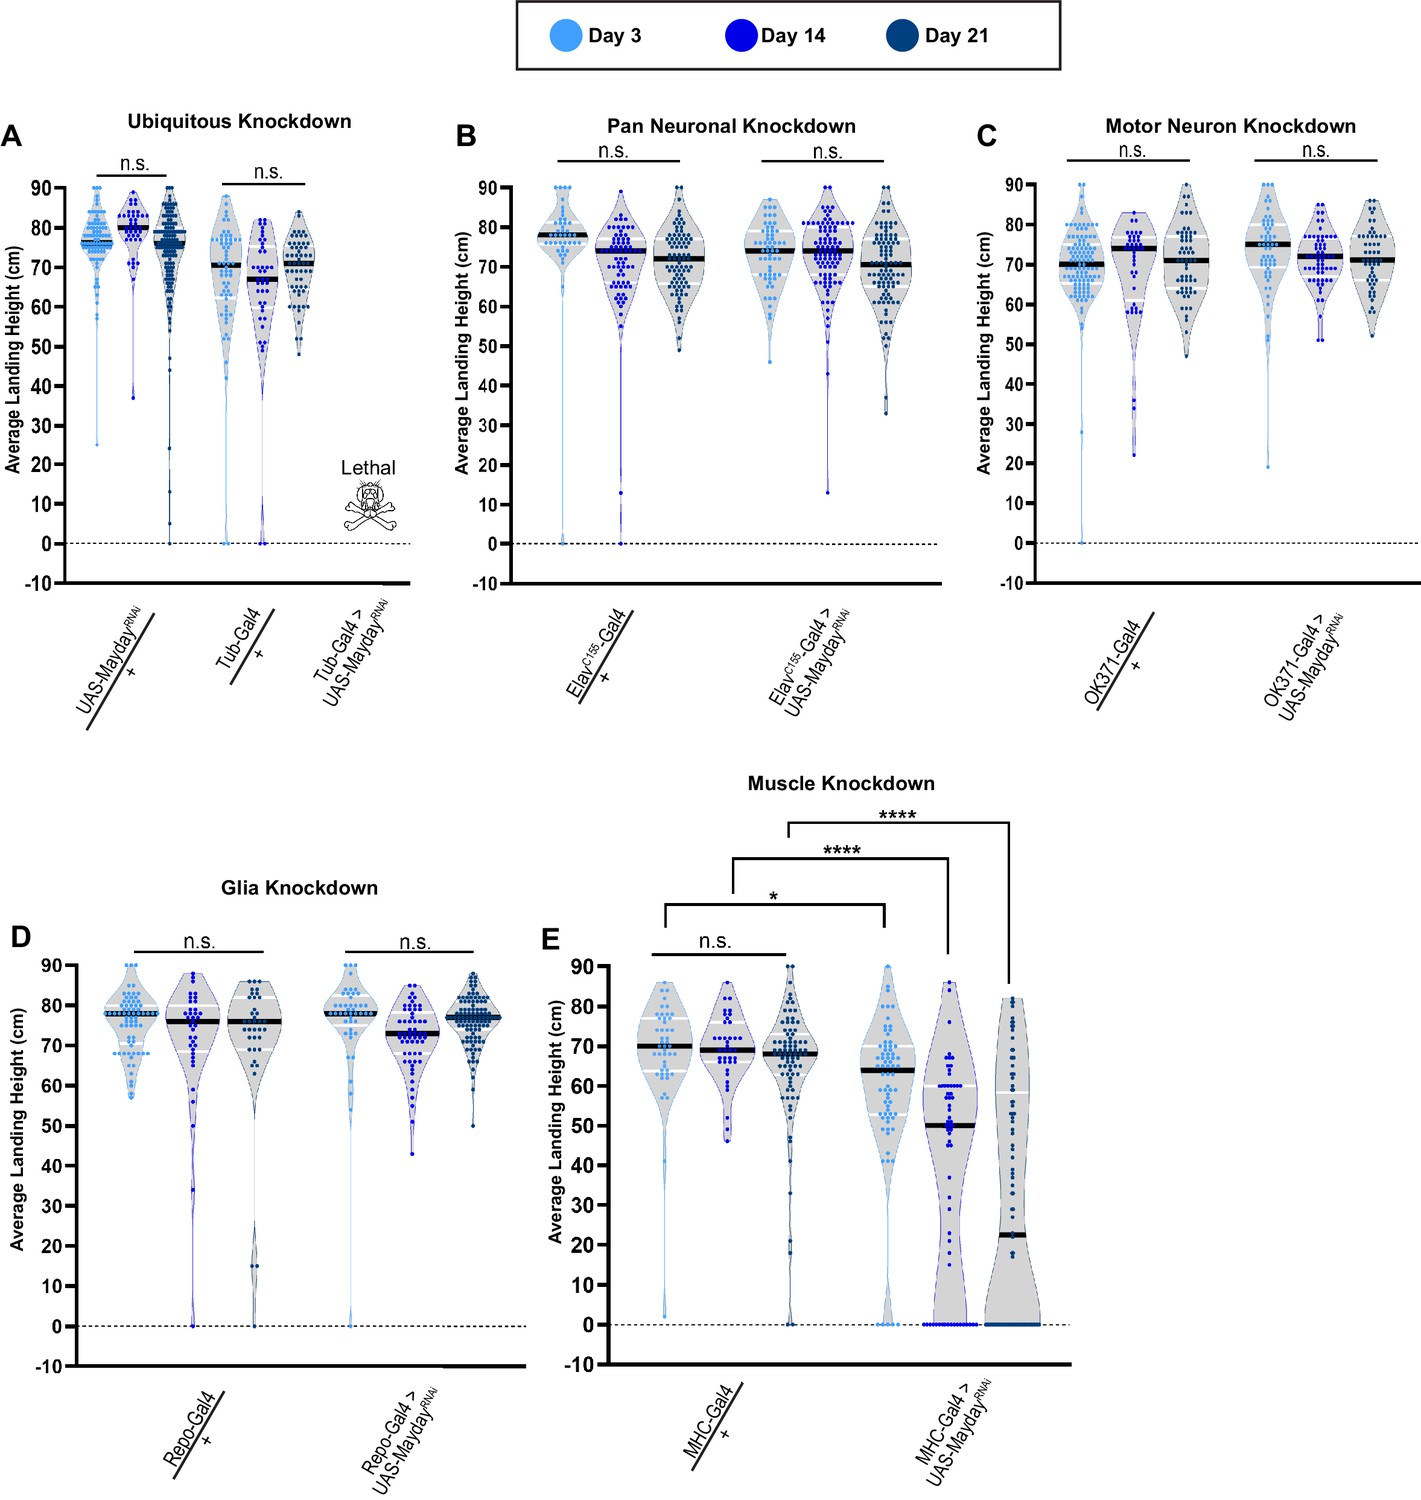
Mayday is required in postsynaptic muscle tissue.
(A–E) Flight performance upon tissue-specific knockdown of myd with UAS-Dicer 2. Knockdown was assessed ubiquitously (A), pan-neuronally (B), in motor neurons (C), in glia (D), and in muscles (E). All lines used in the RNAi screen were also crossed to WT for controls. The average landing height and sample size for A-E are listed in Supplementary file 1. Black bars represent the median values. ****, p-value<0.0001, *, p-value<0.05, using A Brown-Forsythe and Welch ANOVA tests with Post hoc Games-Howell’s multiple comparisons. N.S. = Not Significant.
-
Figure 4—source data 1
Raw data for Figure 4 flight scores.
- https://cdn.elifesciences.org/articles/54932/elife-54932-fig4-data1-v1.xlsx
Figure 4—figure supplement 1
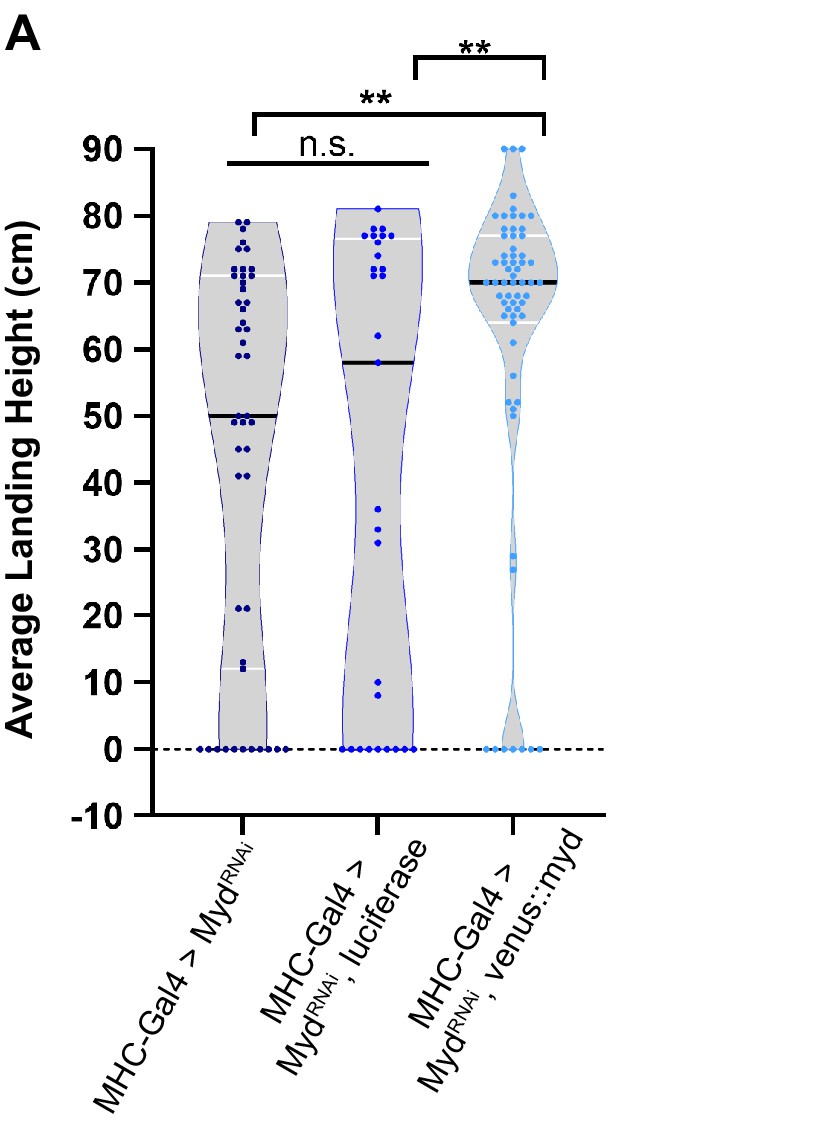
Validation of UAS-mydRNAi transgene.
Landing height of flies upon muscle-specific knockdown of myd using UAS-mydRNAi. Flight defect from RNAi is rescued by co-expression of UAS-Venus::Myd, but not by UAS-luciferase. Black bars represent median values. The landing average (cm) and sample size (n) for each condition are: MHC-Gal4 > mydRNAi44.5 cm, n = 47, MHC-Gal4 > mydRNAi, luciferase 42.0 cm, n = 29, and MHC-Gal4 > mydRNAi, venus::myd 62.0 cm, n = 63. **, p-value<0.01 using a one-way ANOVA with Turkey Post hoc multiple comparisons. N.S. = Not Significant.
-
Figure 4—figure supplement 1—source data 1
Raw data for Figure 4—figure supplement 1.
- https://cdn.elifesciences.org/articles/54932/elife-54932-fig4-figsupp1-data1-v1.xlsx
Figure 4—figure supplement 2
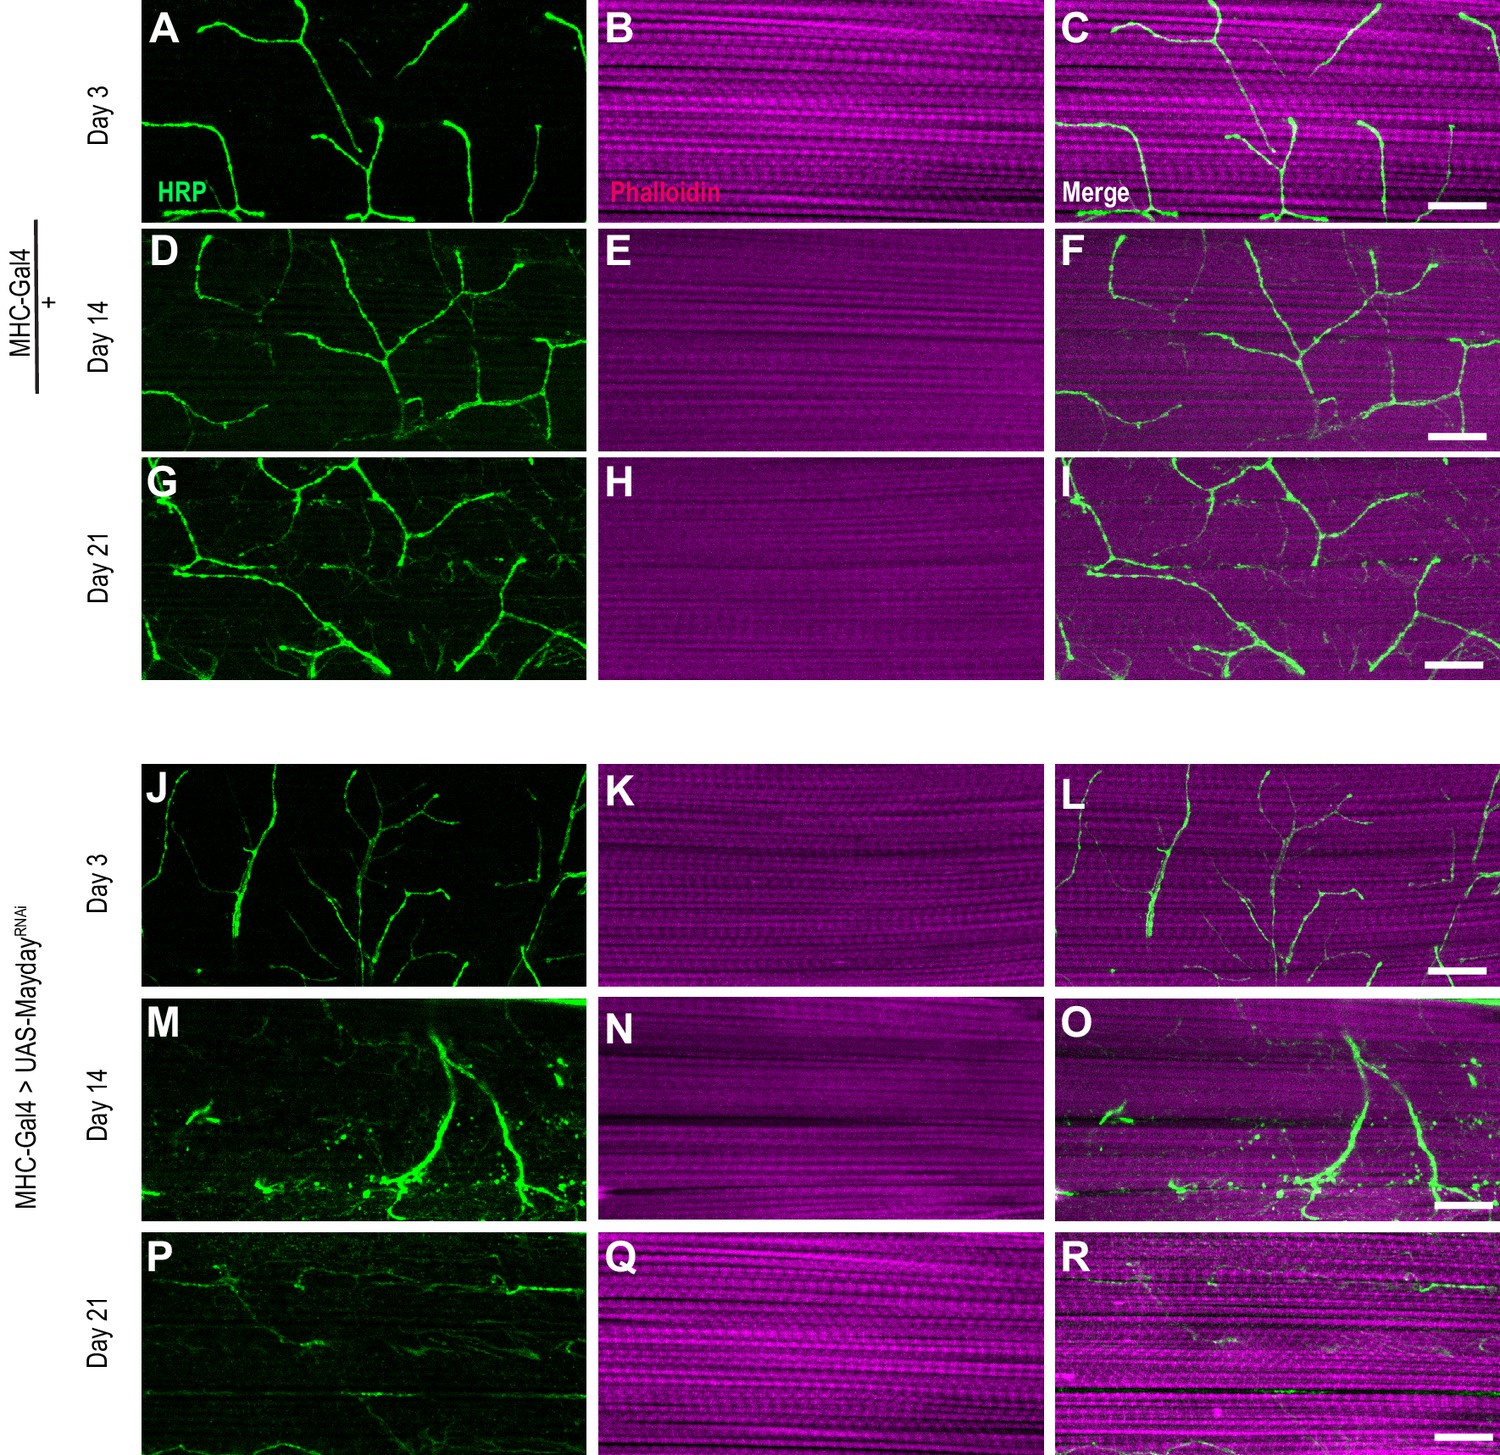
Morphology of Myd RNAi NMJs.
Confocal Images of DLM NMJs labeled with FITC-conjugated HRP (green) and Phalloidin 647 (magenta) at ×63 magnification in both control flies (A-I) and those with muscle-specific knockdown of myd (J-R). Scale bar in R represents 20 µM for all panels.
Figure 4—figure supplement 3

Adult-specific knockdown of UAS-mydRNAi.
(A–B) Transient knockdown of myd with UAS-Dicer-2 using Tubulin-Gal4 (A) as well as MHC-Gal4 (B) using a temperature-sensitive Gal80 to repress Gal4 expression until after eclosion. Flies were kept at 18°C until eclosion, then shifted to 29°C. Flight performance was measured at both Day 3 and Day 28. The average landing height (cm) and sample size (n) for panel A for each condition: TsGal80,Tub-Gal4/+ Day 3 82.2 cm, n = 29, TsGal80-Tub-Gal4 > mydRNAi Day 3 66.7 cm, n = 28, TsGal80,Tub-Gal4/+ Day 28 71.7 cm, n = 50, and TsGal80-Tub-Gal4 > mydRNAi Day 28 24.1 cm, n = 41. For B, the average landing height (cm) and sample size (n) for each group are: UAS-mydRNAi /+ Day 3. 71.2 cm, n = 53, TsGal80,MHC-Gal4/+ Day 3 76.1 cm, n = 42, TsGal80,MHC-Gal4 > mydRNAi Day 3 70.7 cm, n = 40, UAS-mydRNAi /+ Day 28 63.5 cm, n = 43, TsGal80,MHC-Gal4/+ Day 28 68.8 cm, n = 38, and TsGal80,MHC-Gal4 > mydRNAi Day 28 18.9 cm, n = 58. Black bars represent median values. ****, p-value<0.0001 using Brown-Forsythe and Welch ANOVA tests with Post hoc Dunnett’s multiple comparisons. N.S. = Not Significant.
-
Figure 4—figure supplement 3—source data 1
Raw data for Figure 4—figure supplement 3.
- https://cdn.elifesciences.org/articles/54932/elife-54932-fig4-figsupp3-data1-v1.xlsx
Figure 5
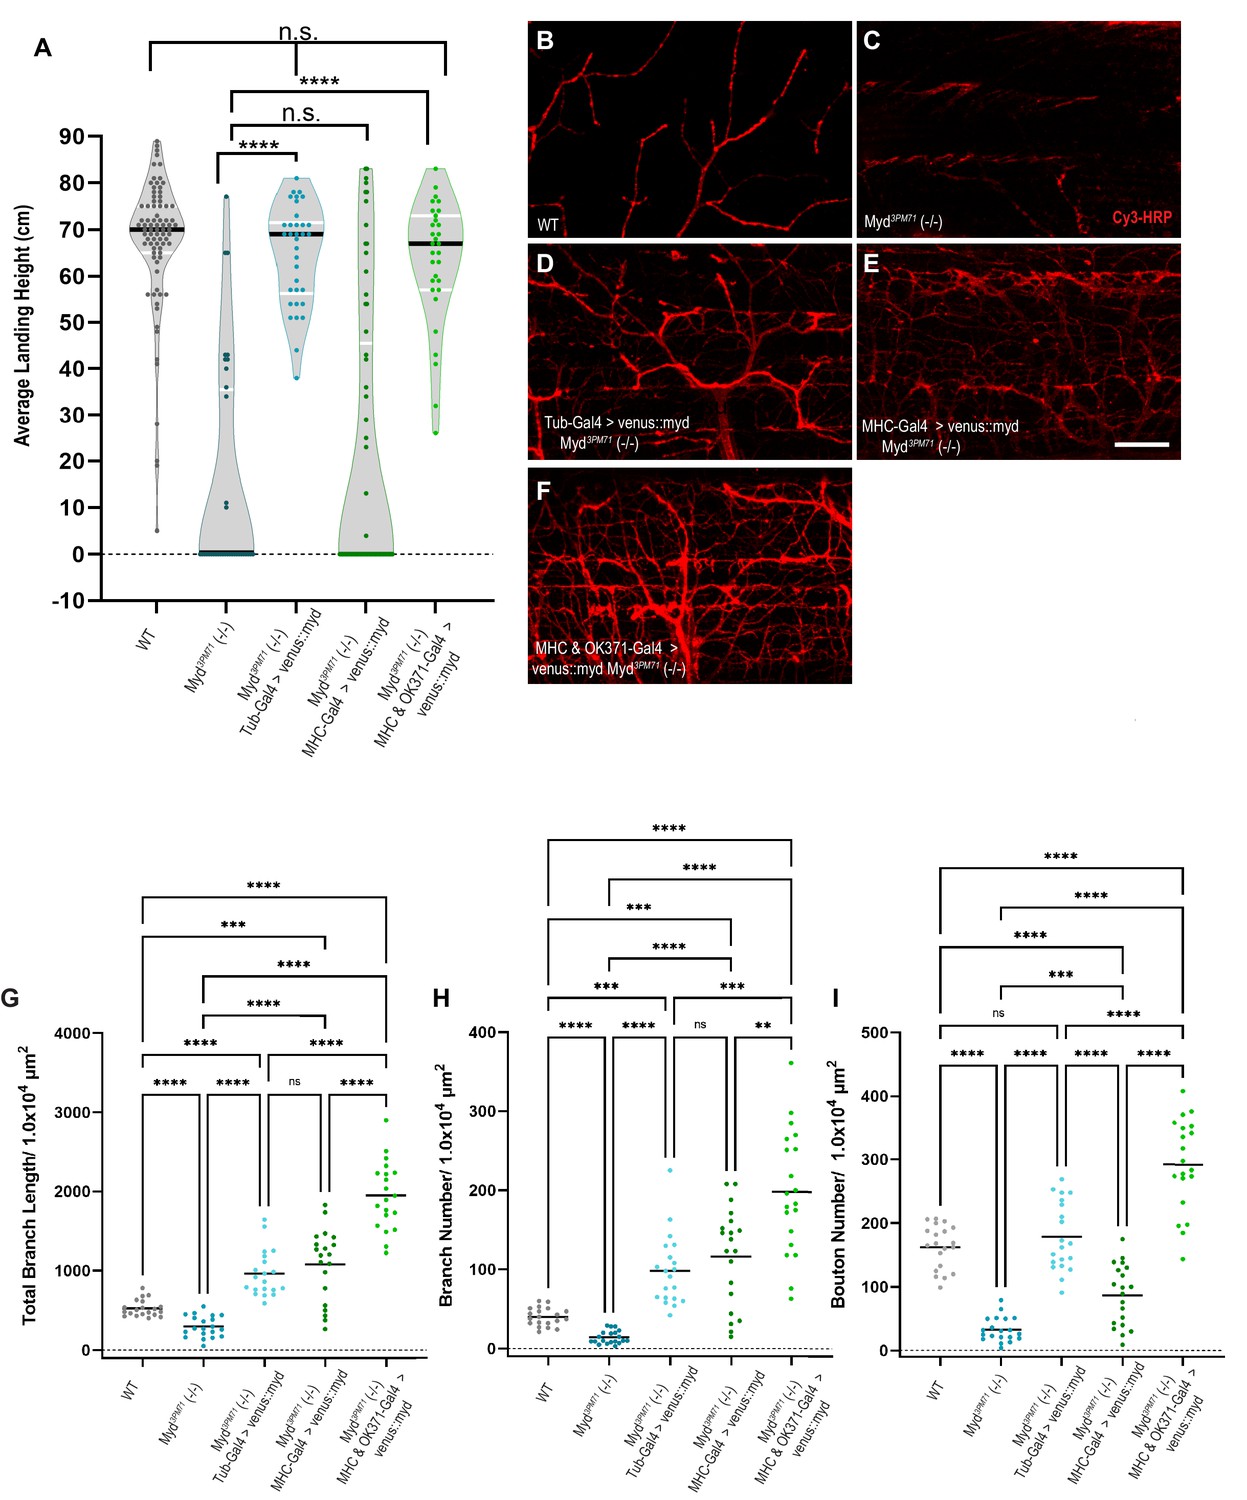
Mayday expression in muscles and motor neurons is necessary for synaptic integrity.
(A) Average landing height of flies expressing UAS-venus::Myd either ubiquitously, in muscles, or in both muscles and motor neurons at Day 25 the in a myd3PM71 mutant background. The average landing height (cm) and the sample size (n) for each are as follows: WT 67.3 cm, n = 81, myd3PM71 14.1 cm, n = 36, Tub-Gal4>venus::myd, myd3PM71 64.8 cm, n = 34, MHC-Gal4>venus::myd, myd3PM71 20.8 cm, n = 65, and MHC-Gal4 and OK371-Gal-4>venus::myd, myd3PM71 63.2 cm and n = 31. (B-F) Confocal images of Myd rescue of gross morphology of DLM NMJs stained with Cy3-conjugated-HRP (red) at 63X. (G-I) Measurements of Total branch length, branch number, and bouton number for each condition, sample size n = 20 per genotype. The mean Total Branch Length (µM), mean branch number (n), and mean bouton number (n) for each genotype are as follows: WT 525.0 µM, n = 40, n = 163, myd3PM71 296.3 µM, n = 14, n = 33, Tub-Gal4>venus::myd, myd3PM71 962.9 µM, n = 98, n = 179, MHC-Gal4>venus::myd, myd3PM71 1082.0 µM, n = 116, n = 87, and MHC-Gal4 and OK371-Gal-4>venus::myd, myd3PM71 1952.0 µM, n = 198, n = 292, respectively. Black bars in A represent median values. Black bars in G-I represent mean values. ****, p-value<0.0001, ***, p-value<0.001, using a Brown-Forsythe and Welch ANOVA tests with Post hoc Dunnett’s multiple comparisons. N.S. = Not Significant. Scale bar in E represents 20 µM for all images.
-
Figure 5—source data 1
Raw data values for Figure 5.
- https://cdn.elifesciences.org/articles/54932/elife-54932-fig5-data1-v1.xlsx
Figure 6
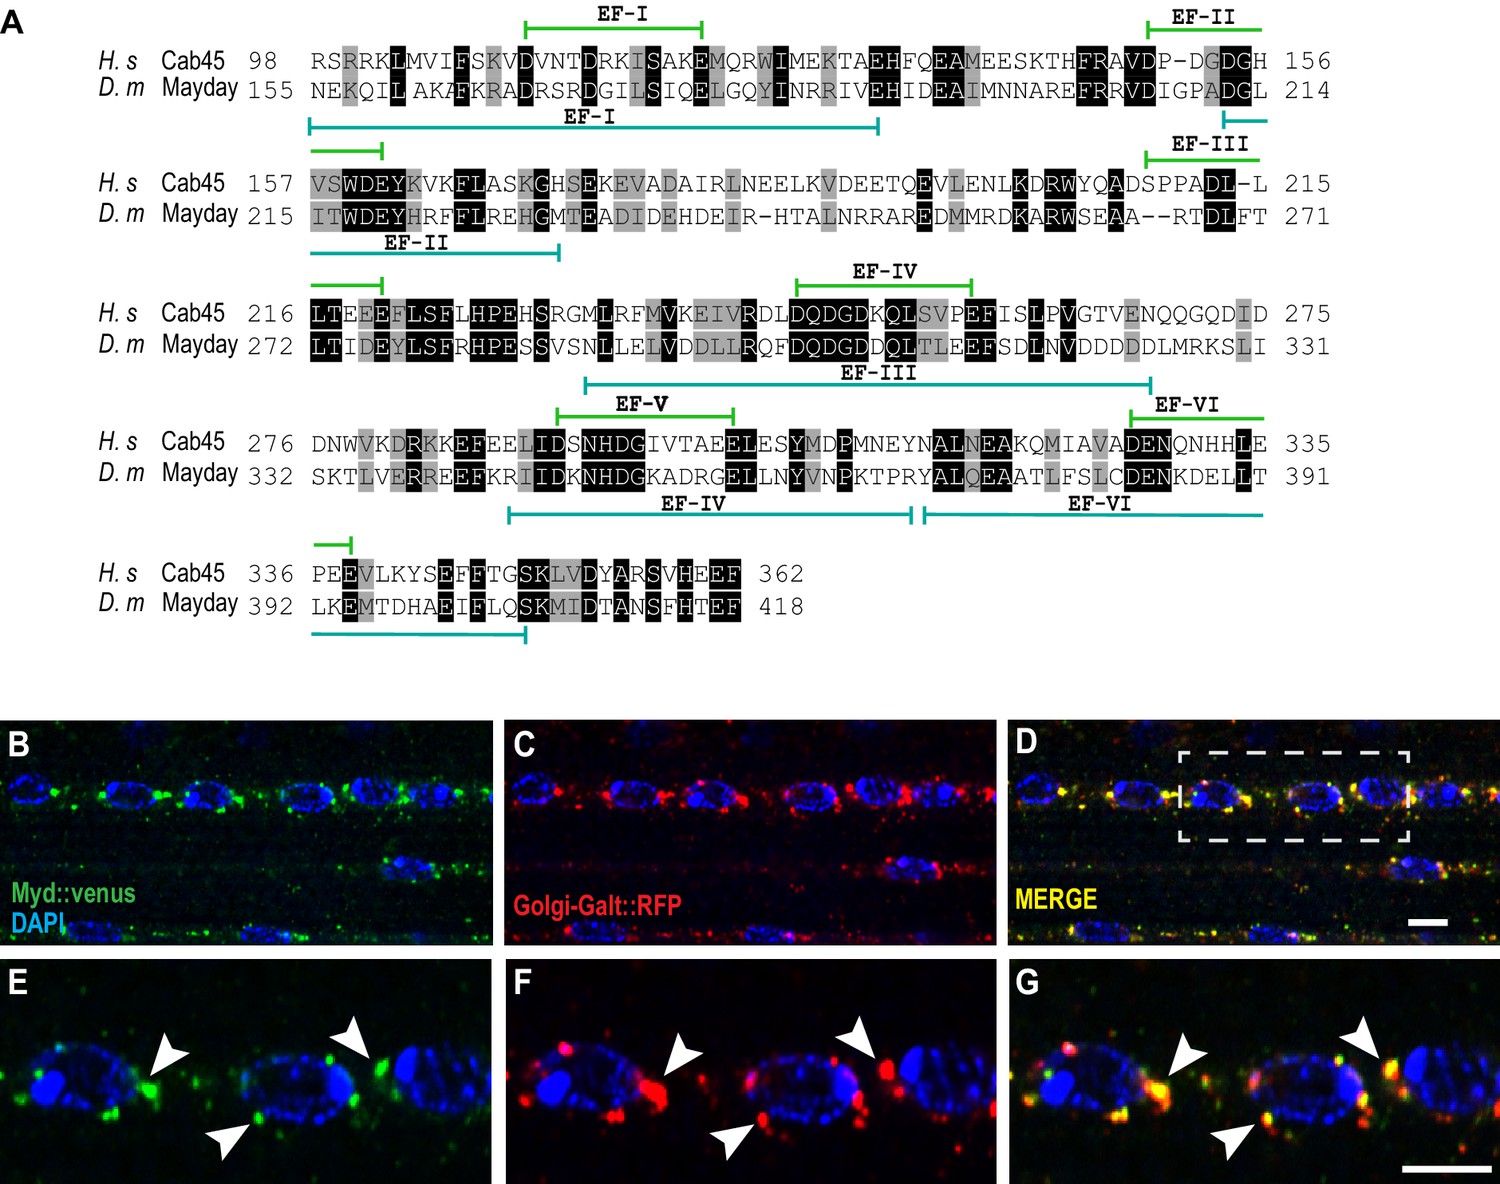
Mayday shares functional homology with human Cab45.
(A) Protein alignment between human Cab45 (NP_057260.2) and Drosophila Myd (NP_001262725). Identical amino acids are represented by gray boxes and similarities are shaded black. (B–G) Confocal images of UAS-venus::Myd (green) co-localizing with UAS-Golgi-GalT-RFP (red) and DAPI (blue) at ×63 magnification. The white box in D represents the zoomed in region for panels E-G. Areas of colocalization are marked with white arrowheads. Scale bar in D = 10 µM for panels B-D. Scale bar in G = 6 µM for panels E-G.
Figure 7
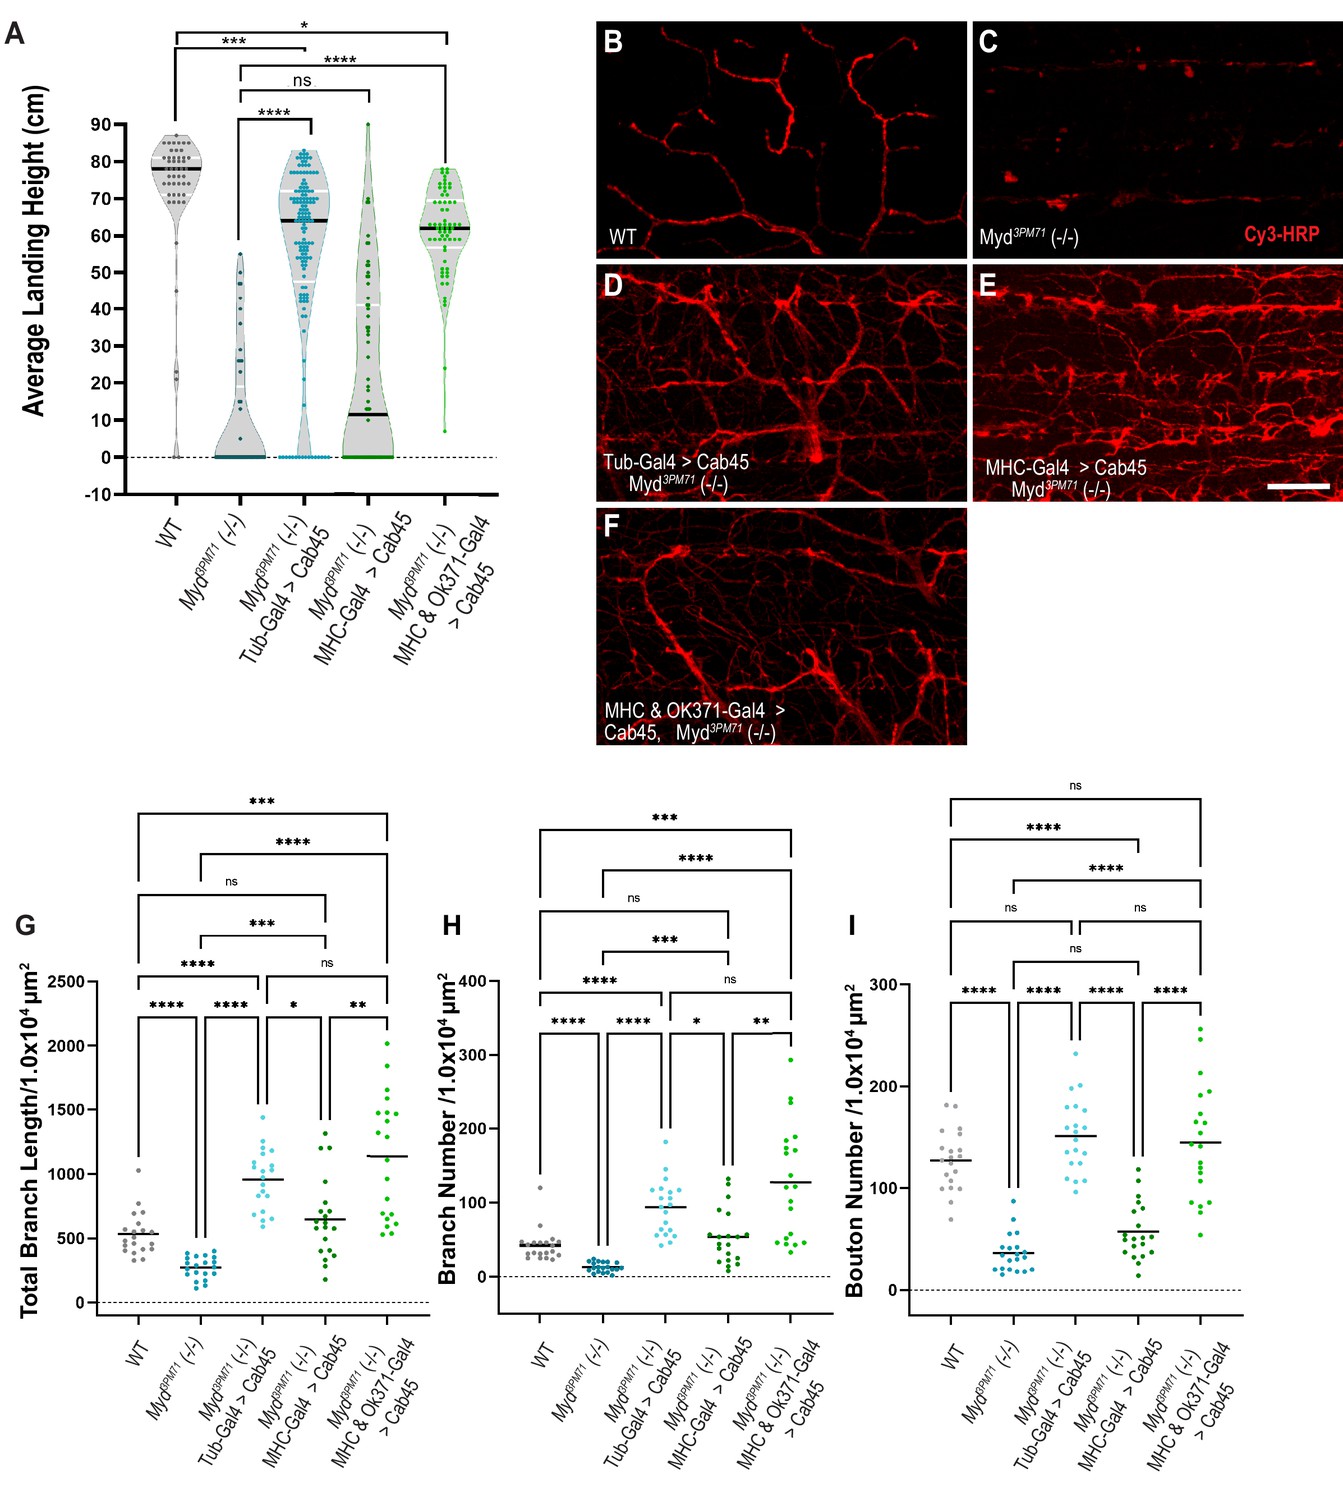
Human Cab45 expression rescues myd mutant phenotypes.
(A) Average landing height of Day 25 Cab45 rescue flies. The average landing height (cm) and sample size (n) for each group are as follows: WT 71.4 cm, n = 49, myd3PM71 10.1 cm, n = 49, Tub-Gal4>Cab45, myd3PM71 55.6 cm, n = 137, MHC-Gal4>Cab45, myd3PM71 21.0 cm, n = 64, and MHC-Gal4 and OK371-Gal-4>Cab45, myd3PM71 60.1 cm, n = 62, respectively. (B-F) Confocal images of Cab45 expressed ubiquitously, in muscles, or in both muscles and motor neurons together in a myd3PM71 mutant background. Neuronal membranes are labeled with Cy3-conjugated-HRP (red). (G-I) Measurements of Total branch length, branch number, and bouton number for each condition with a sample size of n = 20 for each genotype. For each group the mean Total branch length (µM), mean branch number (n), and mean bouton number (n), are listed as follows: WT 533.0 µM, n = 42, n = 128, myd3PM71271.3 µM, n = 13, n = 36, Tub-Gal4>Cab45, myd3PM71 957.9 µM, n = 94, n = 151, MHC-Gal4>Cab45, myd3PM71, 648.1 µM, n = 54, n = 57, and MHC-Gal4 and OK371-Gal-4>Cab45, myd3PM71 1138.0 µM, n = 128, n = 145. Black bars in A represent median values. Black bars in G-I represent mean values. ****, p-value<0.0001, ***, p-value<0.001, **, p-value<0.01, *, p-value<0.05 using Brown-Forsythe and Welch ANOVA tests with Post hoc Dunnett’s multiple comparisons N.S. = Not Significant. Scale bar in E = 20 µM for panels B-F.
-
Figure 7—source data 1
Raw data values for Figure 7.
- https://cdn.elifesciences.org/articles/54932/elife-54932-fig7-data1-v1.xlsx
Figure 8
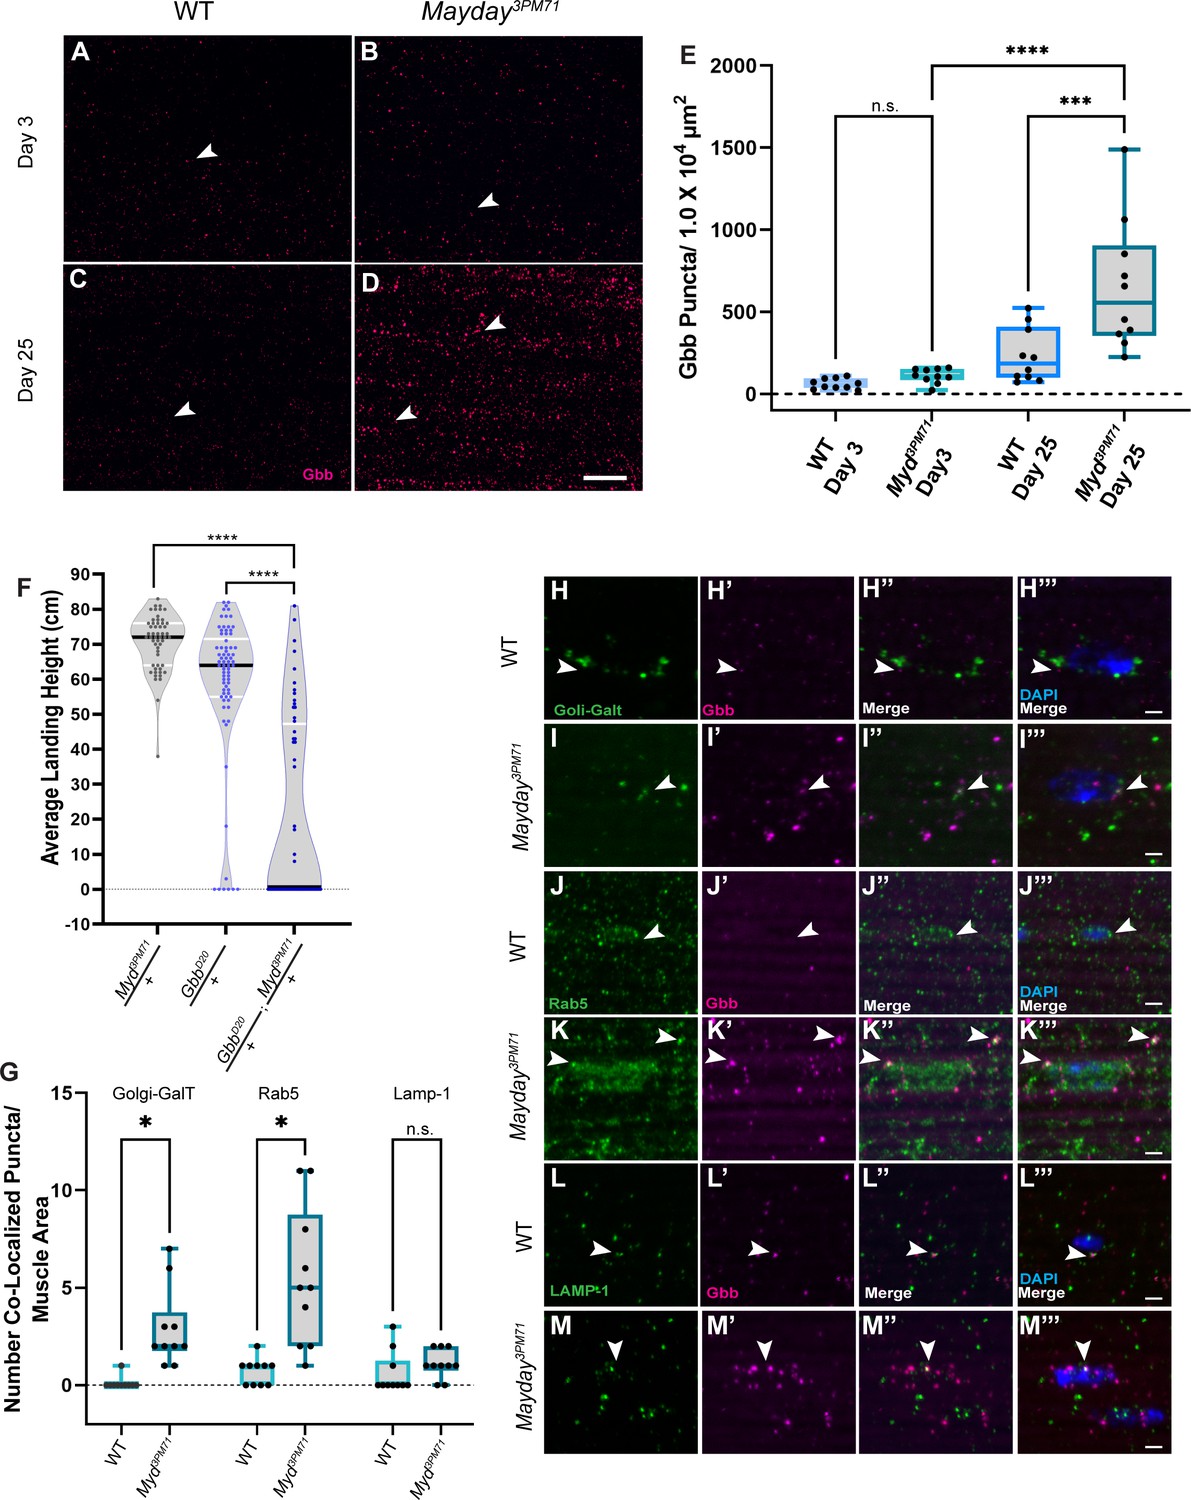
Myd genetically interacts with gbb.
(A–D) Confocal images of DLM NMJs stained with Gbb (Magenta) at early (A–B) and late (C–D) time points at 63X. Arrowheads designate Gbb puncta in each image. (E) Quantification of the number of Gbb puncta per muscle area for each genotype, sample size n = 10. Box plots show the distribution of data with bar from the min to the max with the mean Gbb puncta for each condition as follows: WT Day 3 n = 61, myd3PM71 Day 3 n = 110, WT day 25 n = 234, and myd3PM71 Day 3 n = 652. (F) Progressive loss of flight at day 25 in heterozygous and double heterozygous mutants for myd3PM71 and gbbD20. The average landing height (cm) and sample size (n) for each condition: myd3PM71 /+ 70.5 cm, n = 54, gbbD20/+ 58.3 cm, n = 74, and gbbD20/+; myd3PM71 /+ 21.1 cm, n = 56. (G–M) Quantification of Gbb puncta located within Golgi (H–I), early endosomes (J–K), or lysosomes (L–M) with n = 10 per condition at Day 25. Box plots show the distribution of data with a bar from the min to the max, with the mean colocalized Gbb puncta for each comparison, Golgi: WT 0.01, myd3PM71 2.9, early endosomes WT 0.7, myd3PM71 5.5, and lysosomes WT 0.6, and myd3PM71 1.1, respectively. Arrowheads designate Gbb puncta co-localization. In E ****, <0.0001 p-value, ***<0.001 p-value using a one-way ANOVA with Turkey Post hoc multiple comparisons. N.S. = Not Significant. In F black bars in graphs represent median values. In F and G ****, p-value<0.0001, *, p-value<0.05 using Brown-Forsythe and Welch ANOVA tests with Post hoc Dunnett’s multiple comparisons. N.S. = Not Significant Scale bar in D represents 20 µM for panels A-D. Scale bar in M represents 2 µM for H-M.
-
Figure 8—source data 1
Raw data values for Figure 8.
- https://cdn.elifesciences.org/articles/54932/elife-54932-fig8-data1-v1.xlsx
Figure 9

Myd is a positive regulator of trans-synaptic BMP signaling.
(A–L) Confocal images of motor neuron nuclei in myd3PM71 and controls stained with elav (green) and pMad (magenta) at ×40 magnification. Arrowheads designate areas of co-localization. (M) Quantification of pMad-positive motor neuron nuclei within each lobe of the thoracic ganglion with a sample size of n = 12 per condition. The mean number of pMad+ nuclei per condition: WT Day 3 n = 66, myd3PM71 Day 3 n = 63, WT Day 21 n = 62, and myd3PM71 Day 21 n = 31. (N–Q) Images of DLM NMJs stained with pMad (magenta) at ×63 magnification. Arrowheads designate pMad puncta. (R) Quantification of the amount of pMad signaling per muscle area (2916 µM²), n = 10 for each condition. The mean percent pMad/Muscle Area per condition: WT Day 3 = 0.3%, myd3PM71 Day 3 = 0.3%, WT Day 21 = 0.3% and myd3PM71 Day 21 = 2.3%. (S) Progressive loss of flight in wit and myd double heterozygous combinations at Day 28. (T) Progressive loss of flight in tkv and myd double heterozygous combinations at Day 28. (U) Progressive loss of flight in mad and myd double heterozygous combinations at Day 28. (V) Motor neuron expression of a constitutively active Tkv in myd3PM71 mutants. Average landing height (cm) and sample size (n) can be found in Supplementary file 2 for panels (S–T). Black bars in graphs represent median values. For panels M and R. ****, p-value<0.0001, ***, p-value<0.001,. using a one-way ANOVA with Turkey Post hoc multiple comparisons. N.S. = Not Significant. For S-T, ****, p-value<0.0001 using Brown-Forsythe and Welch ANOVA tests with Post hoc Dunnett’s multiple comparisons. N.S. = Not Significant Scale bar in L represents 20 µM for A-L. Scale bar in O represents 10 µM for panels N-Q.
-
Figure 9—source data 1
Raw data values for Figure 9.
- https://cdn.elifesciences.org/articles/54932/elife-54932-fig9-data1-v1.xlsx
Figure 10
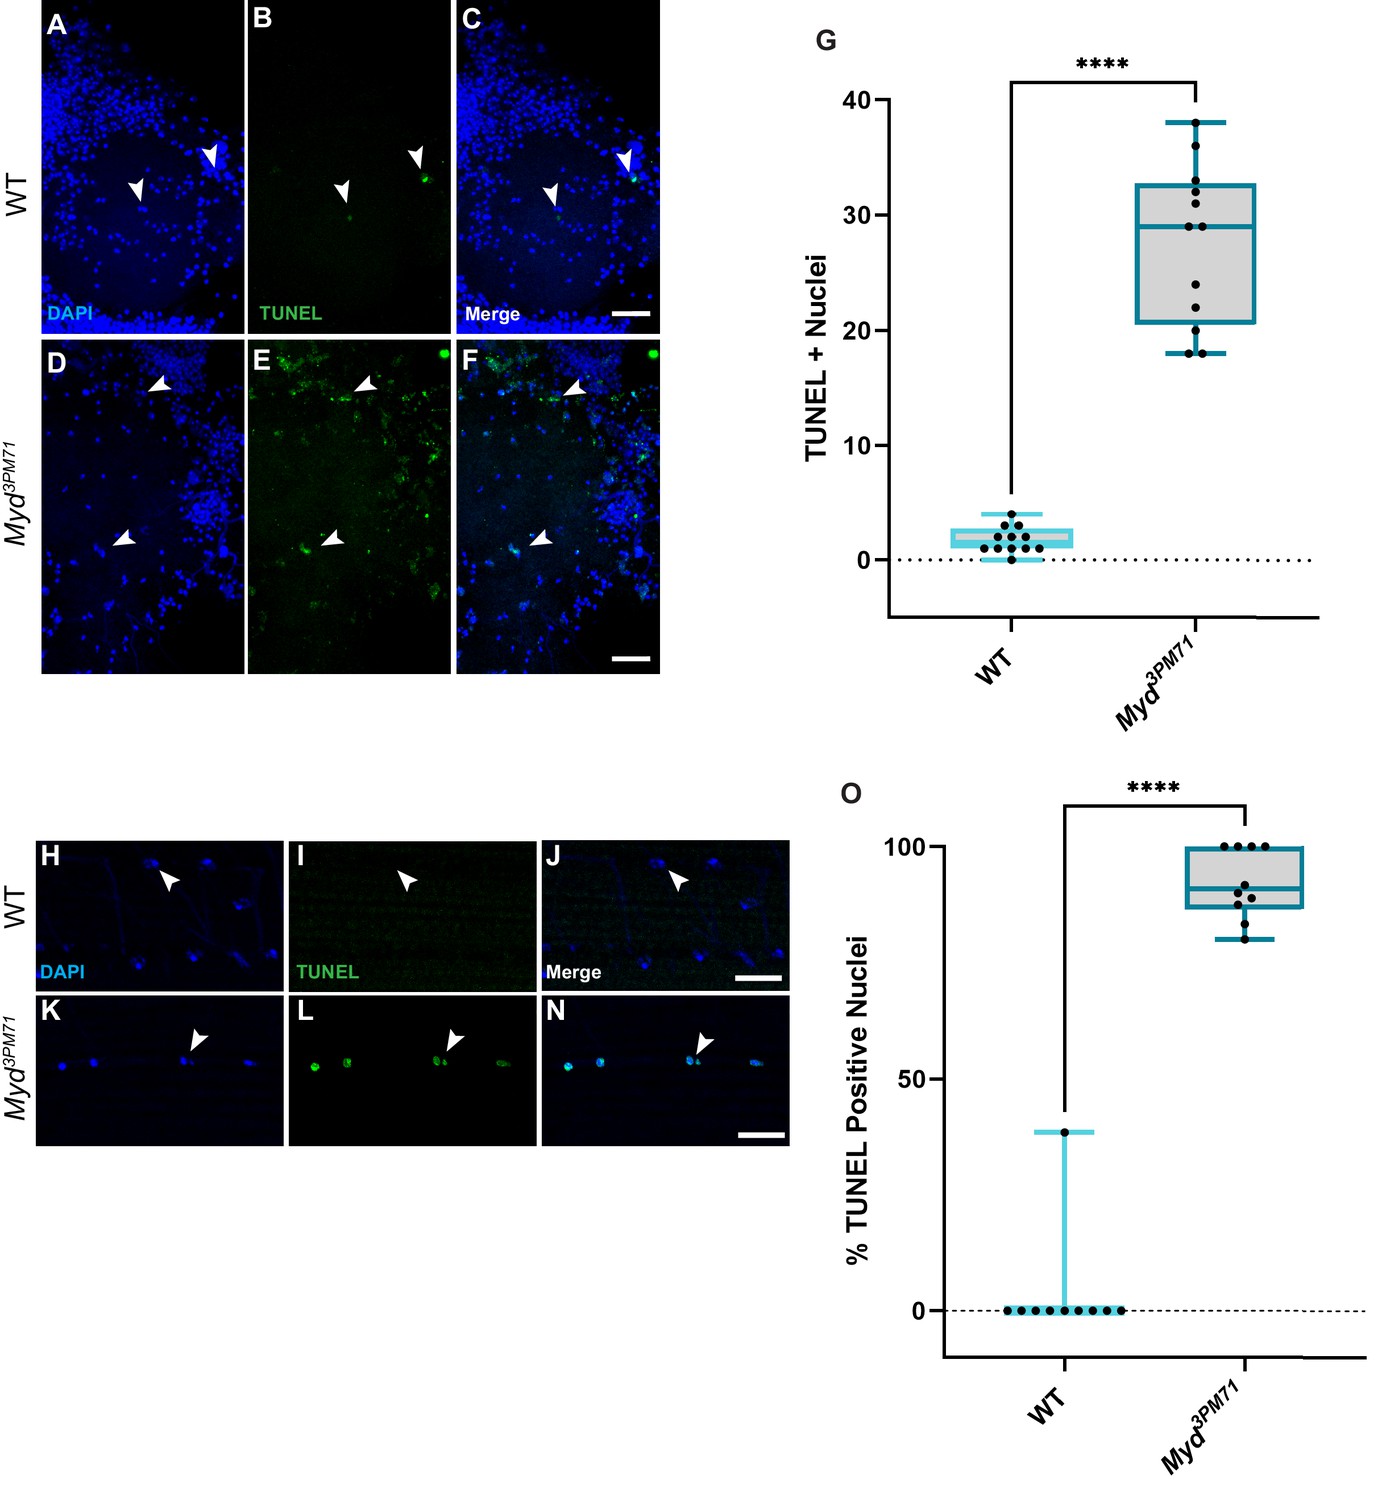
Myd sustains motor neuron and muscle viability.
(A–F) Confocal images of Day 25 adult thoracic ganglia stained with DAPI (blue) and TUNEL (green) at ×40. White arrows highlight areas of cell death. (G) Quantification of the number of TUNEL-positive nuclei located within a single lobe of the thoracic ganglion with a sample size n = 12, in each condition. The box plot shows the distribution of data with the min and max, with the mean number of TUNEL + nuclei for WT n = 2 and myd3PM71 n = 28. (H–N) Confocal images of Day 28 adult DLMs stained with DAPI (blue) and TUNEL (green) at ×63. White arrows highlight areas of cell death. (O) Quantification of the percentage of TUNEL-positive nuclei within each muscle cell. The box plot shows the distribution of data with the min and max, with the mean % of number of TUNEL+ nuclei for WT 3.8% and myd3PM71 92.0%, respectively. Scale bar in F represents 20 µM for panels A-F, and the scale bar in N represents 10 µM for panels H-N. ****p<0.0001 using a Student’s T-Test.
-
Figure 10—source data 1
Raw data values for Figure 10.
- https://cdn.elifesciences.org/articles/54932/elife-54932-fig10-data1-v1.xlsx
Figure 11

Summary of synaptic defects in myd3PM71 mutants.
(A) In WT flies, Myd is required for proper retrograde trafficking of Gbb. Successful trafficking of Gbb to presynaptic motor neurons and subsequent BMP signaling promotes synaptic maintenance. (B) In myd3PM71 flies, defects in Gbb trafficking result in decreased BMP signaling in motor neurons along with accumulated Gbb in muscles, leading to cell death in motor neurons and muscles, respectively.
Tables
Key resources table
| Reagent type (species) or resource | Designation | Source or reference | Identifiers | Additional information |
|---|---|---|---|---|
| Genetic reagent (D. melanogaster) | Oregon R | BDSC: 5 | ||
| Genetic reagent (D. melanogaster) | Df(3R)ED5938 | BDSC:24139 | w[1118]; Df(3R)ED5938, P{w[+mW.Scer\FRT.hs3]=3'.RS5+3.3'}ED5938/TM6C, cu[1] Sb[1] | |
| Genetic reagent (D. melanogaster) | CG31475MI08258 | BDSC:51072 | y[1] w[*]; Mi{y[+mDint2]=MIC}CG31475[MI08258] | |
| Genetic reagent (D. melanogaster) | CG31475MI08666 | BDSC:51100 | y[1] w[*]; Mi{y[+mDint2]=MIC}CG31475[MI08666] | |
| Genetic reagent (D. melanogaster) | CG31475MB03509 | BDSC:24073 | w[1118]; Mi{ET1}CG31475[MB03509] | |
| Genetic reagent (D. melanogaster) | Tubulin-Gal4 | BDSC:5138 | y[1] w[*]; P{w[+mC]=tubP-GAL4}LL7/TM3, Sb[1] Ser[1] | |
| Genetic reagent (D. melanogaster) | ElavC155-Gal4 | BDSC:458 | P{w[+mW.hs]=GawB}elav[C155] | |
| Genetic reagent (D. melanogaster) | MHC-Gal4 | BDSC:55132 | P{w[+mC]=Mhc-GAL4.K}1, w[*]/FM7c | |
| Genetic reagent (D. melanogaster) | MHC-Gal4 | BDSC:55133 | w[*]; P{w[+mC]=Mhc-GAL4.K}2/TM3, Sb[1] | |
| Genetic reagent (D. melanogaster) | OK371-Gal4 | BDSC:26160 | OK371-Gal4 w[1118]; P{w[+mW.hs]=GawB}VGlut[OK371] | |
| Genetic reagent (D. melanogaster) | Repo-Gal4 | BDSC:7415 | Repo-Gal4 w[1118]; P{w[+m*]=GAL4}repo/TM3, Sb[1] | |
| Genetic reagent (D. melanogaster) | UAS-Dicer2 | BDSC:24651 | w[1118]; P{w[+mC]=UAS-Dcr-2.D}10 | |
| Genetic reagent (D. melanogaster) | UAS-Golgi-Galt-RFP | BDSC:65251 | w[1118]; P{w[+mC]=UAS-GalT-TagRFP-T}2; TM2/TM6B, Tb[1] | |
| Genetic reagent (D. melanogaster) | GbbD20 | BDSC:63054 | GbbD20 y[1] w[*]; P{w[+mW.hs]=FRT(w[hs])}G13 sha[1] gbb[D20]/SM6a | |
| Genetic reagent (D. melanogaster) | UAS-TkvCA | BDSC:36537 | UAS-Tkv.CA w[*]; P{w[+mC]=UAS-tkv.CA}3 | |
| Genetic reagent (D. melanogaster) | Tkv7 | BDSC:3242 | Tkv7 tkv[7] cn[1] bw[1] sp[1]/CyO | |
| Genetic reagent (D. melanogaster) | Tkv8 | BDSC:34509 | Tkv8 tkv[8] cn[1] bw[1] sp[1]/CyO, P{ry[+t7.2]=sevRas1.V12}FK1 | |
| Genetic reagent (D. melanogaster) | WitB11 | BDSC:5174 | WitB11 bw[1]; wit[B11] st[1]/TM6B, Tb[1] | |
| Genetic reagent (D. melanogaster) | Mad1-2 | BDSC:7323 | Mad1-2 w[*]; Mad[1-2] P{ry[+t7.2]=neoFRT}40A/CyO | |
| Genetic reagent (D. melanogaster) | TsGal80 | BDSC:7108 | w[*]; P{w[+mC]=tubP-GAL80[ts]}10; TM2/TM6B, Tb[1] | |
| Genetic reagent (D. melanogaster) | TsGal80 | BDSC:7017 | w[*]; P{w[+mC]=tubP-GAL80[ts]}2/TM2 | |
| Genetic reagent (D. melanogaster) | UAS-luciferase | BDSC:35788 | y[1] v[1]; P{y[+t7.7] v[+t1.8]=UAS-LUC.VALIUM10}attP2 | |
| Genetic reagent (D. melanogaster) | UAS CG31475 RNAi | VDRC: 106664 | UAS-maydayRNAi | |
| Genetic reagent (D. melanogaster) | UAS-venus::myd | This Paper | ||
| Genetic reagent (D. melanogaster) | UAS-Cab45 | This Paper | ||
| Genetic reagent (D. melanogaster) | Myd3PM71 | This Paper | ||
| Cell line (H. sapiens) | HeLa | ATCC | Cat# CCL-2 | |
| Transfected construct (E. coli) | pBID-UASC-VG vector | PMID:22848718 | RRID:Addgene_35206 | |
| Transfected construct (E. coli) | pBID-UASC-G vector | PMID:22848718 | RRID:Addgene_35202 | |
| Antibody | Anti-DsRed (rabbit polyclonal) | Takara Bio USA Inc | Cat#: 632496 | (1:500), 24 hr, 48 hr with anti-Gbb |
| Antibody | Anti-GFP (chicken polyclonal) | ThermoFisher | Cat#: A10262 | (1:500) 24 hr |
| Antibody | Anti-Gbb (mouse monoclonal) | DSHB | Cat#: 3D6-24 | (1:500), 48 hr |
| Antibody | Anti-elav (rat monoclonal) | DSHB | Cat# Elav-9F8A9 | (1:20), 24 hr |
| Antibody | Anti-pMad (rabbit monoclonal) | Abcam | Cat#: ab529031 | (1:500), 24 hr |
| Antibody | Anti-lamp-1 (rabbit polyclonal) | Abcam | Cat#: ab30687 | (1:500), 48 hr |
| Antibody | Anti -rab5 (rabbit polyclonal) | Abcam | Cat#: ab31261 | (1:200), 48 hr |
| Antibody | Alexa Fluor 568 (goat anti rabbit IgG) | Invitrogen, Life Technologies | Cat#: A11036 | (1:200), 2 hr |
| Antibody | Alexa Fluor 488 (goat anti rabbit IgG) | Invitrogen, Life Technologies | Cat#: A11008 | (1:200), 2 hr |
| Antibody | Alexa Fluor 488 (goat anti chicken IgG) | Invitrogen, Life Technologies | Cat#: A11039 | (1:200), 2 hr |
| Antibody | Alexa Fluor 488 (goat anti mouse IgG) | Invitrogen, Life Technologies | Cat#: A11001 | (1:200), 2 hr |
| Antibody | Alexa Fluor 568 (goat anti mouse IgG) | Invitrogen, Life Technologies | Cat#: A11031 | (1:200), 2 hr |
| Antibody | Cy3-conjugated anti HRP | Jackson Laboratories | Cat#: 123-165-021 | (1:500), 2 hr |
| Antibody | FITC-conjugated anti HRP | Jackson Laboratories | Cat#: 123-545-021 | (1:200), 2 hr |
| Recombinant DNA | CG31475-Gold cDNA clone | Drosophila Genomics Resource Center | Cat#:16308 | |
| Sequence-based reagent | Cab45 Forward-5’-ATGGTCTGGCCCTGGGTG-3’ | This Paper | IDT | Cab45 Isolation |
| Sequence-based reagent | Cab45 Reverse- 5’-TCAAAACTCCTCGTGCACGCT-3’ | This Paper | IDT | Cab45 Isolation |
| Sequence-based reagent | Actin5C Forward 5’- CGAAGAAGTTGCTGCTCTGGTTGT-3’ | PMID:25823231 | IDT | qRT-PCR |
| Sequence-based reagent | Actin5C Reverse 5’- GGACGTCCCACAATCGATGGGAAG-3’ | PMID:25823231 | IDT | qRT-PCR |
| Sequence-based reagent | CG31475-Forward 5’- TCCAGGAATTGGGGCAGTACATAAATC-3’ | PMID:17625558 | IDT | qRT-PCR |
| Sequence-based reagent | CG31475-Reverse 5’ CTCGGGATGGCGGAAACTCA-3’ | PMID:17625558 | IDT | qRT-PCR |
| Commercial assay or kit | In Situ Cell Death Detection Kit, Fluorescein | Millipore Sigma | Cat#: 11684795910 | |
| Commercial assay or kit | pCR8 Gateway cloning kit | ThermoFisher | Cat#:250020 | |
| Commercial assay or kit | Monarch Total RNA Isolation kit | New England Biolabs | Cat#: T2010 | |
| Commercial assay or kit | Monarch RNA Clean Up Kit | New England Biolabs | Cat:# T2030 | |
| Chemical compound, drug | VECTASHIELD Antifade Mounting Medium | Vector Laboratories | Cat#:H-1000 | |
| Chemical compound, drug | qScript cDNA synthesis SuperMix | Quantabio | Cat#: 95048–025 | |
| Chemical compound, drug | PowerUP SYBR Green Master Mix | Applied Biosystems | Cat#: A-25741 | |
| Chemical compound, drug | SuperScript III Reverse Transcriptase | Invitrogen, Life Technologies | Cat#: 18080093 | |
| Chemical compound, drug | Rnase OUT | Invitrogen, Life Technologies | Cat#: 10777019 | |
| Chemical compound, drug | Rnase H | New England Biolabs | Cat#:M02975 | |
| Chemical compound, drug | Oilgo(dT)20 | Invitrogen, Life Technologies | Cat#: 18418020 | |
| Chemical compound, drug | Nuclease Free Water | Invitrogen, Life Technologies | Cat#: AM9937 | |
| Chemical compound, drug | Trizol | Invitrogen, Life Technologies | Cat#: 15596026 | |
| Chemical compound, drug | Chloroform | Fisher scientific | Cat#: AC423550250 | |
| Chemical compound, drug | RQ-1 Rnase Free -DNAse | RQ-1 Rnase Free -DNAse | Cat#:M6101 | |
| Software, algorithm | ImageJ | NIH | https://imagej.nih.gov/ij/ | |
| Software, algorithm | FIJI | NIH PMID:22743772 | ||
| Software, algorithm | Adobe Photoshop | Adobe Creative Cloud | N/A | |
| Software, algorithm | Adobe Illustrator | Adobe Creative Cloud | N/A | |
| Software, algorithm | T-COFFEE Alignment Tool | PMID:10964570 | ||
| Software, algorithm | Boxshade | n/a | Swiss Institute of Bioinformatics | Free Open Source Software |
| Software, algorithm | Graphpad PRISM 9 | Graphpad | N/A | |
| Other | ABI7300 | Applied Biosystems | N/A | |
| Other | Nanodrop OneC | ThermoFisher | N/A | |
| Other | LSM 880 Confocal Microscope | Zeiss | N/A | |
| Other | Tangle-Trap | TangleFoot | Cat#:300000588 | |
| Other | RNase-Free Pellet Pestle | VWR | Cat:# 47747–370 | |
| Other | Homogenizer | VWR | Cat:# 749521–1590 | |
| Other | DAPI | Molecular Probes | Cat#: D1306 | (1:1000), 2 hr |
| Other | Phalloidin 647 | Abcam | Cat#: Ab176759 | (1:1000), 2 hr |
Additional files
-
Supplementary file 1
Average landing heights and sample sizes for Figure 4.
- https://cdn.elifesciences.org/articles/54932/elife-54932-supp1-v1.xlsx
-
Supplementary file 2
Average landing heights and sample sizes for Figure 9.
- https://cdn.elifesciences.org/articles/54932/elife-54932-supp2-v1.xlsx
-
Transparent reporting form
- https://cdn.elifesciences.org/articles/54932/elife-54932-transrepform-v1.pdf
Download links
A two-part list of links to download the article, or parts of the article, in various formats.
Downloads (link to download the article as PDF)
Open citations (links to open the citations from this article in various online reference manager services)
Cite this article (links to download the citations from this article in formats compatible with various reference manager tools)
Mayday sustains trans-synaptic BMP signaling required for synaptic maintenance with age
eLife 10:e54932.
https://doi.org/10.7554/eLife.54932


