Sodium channels implement a molecular leaky integrator that detects action potentials and regulates neuronal firing
- University of Missouri, United States
- University of California, Berkeley, United States
- SUNY Downstate Health Sciences University, United States
- University of Maryland, United States
Figures
Figure 1

Spontaneous firing in serotonergic raphe neurons and the contribution of Nav channels.
(A and B) Raphe neurons are characterized by slow and regular spiking and broad action potentials, with the spike-generating sodium current (INa) mostly restricted to the depolarization phase. (C) Schematic of state transitions undertaken by Nav channels during the spiking cycle (C - closed, O - open, I - inactivated states). (D) Conceptual Nav state model proposed to explain the fundamental kinetic properties of INa in mammalian central neurons (Kuo and Bean, 1994). The representative current clamp recordings in (A) and (B) were obtained from RO neurons in neonatal rat brainstem slices. In (B) INa was calculated in real-time and injected in the cell using dynamic clamp, as in Milescu et al. (2010b).
Figure 2
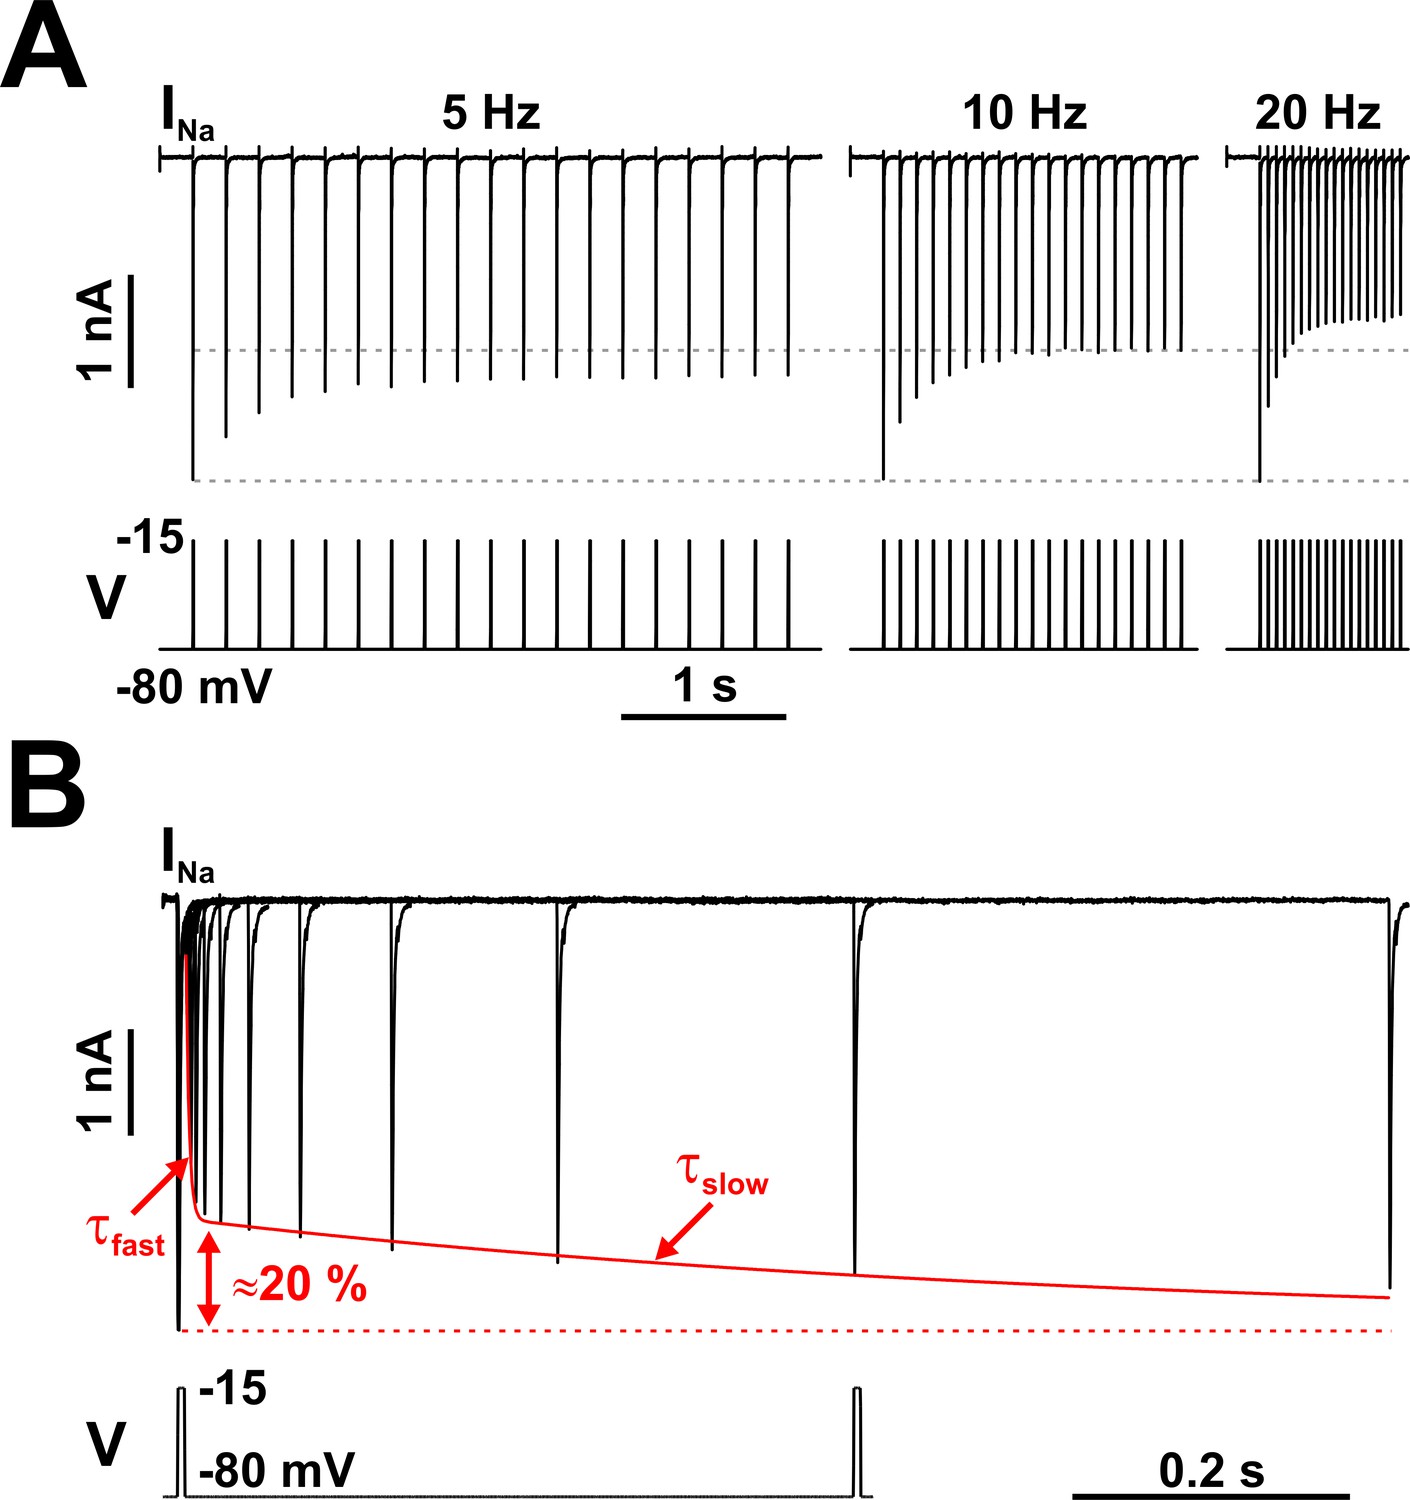
Nav channels in serotonergic raphe neurons exhibit a slow kinetic component.
(A) The fraction of Nav channels available to generate current decays exponentially, when tested with trains of brief depolarizing voltage pulses (5 ms at −15 mV, repeated at 5, 10, or 20 Hz). The decay is greater at higher repetition rates. Each pulse completely inactivates INa, which then partially recovers from inactivation in the subsequent hyperpolarizing interval, at −80 mV. (B) The timing of recovery from inactivation was tested with a two-pulse protocol, where the first pulse (5 ms at −15 mV) inactivates the channels and the second pulse tests availability versus time, at −80 mV. As indicated by the two time constants (τfast and τslow), recovery from inactivation is a bi-exponential process, with the slow component accounting for approximately 20% of the total current. The representative voltage clamp recordings in (A) and (B) were obtained from RO neurons in neonatal rat brainstem slices, and are TTX-subtracted. Statistical values are given in the main text.
-
Figure 2—source data 1
Recovery from inactivation of Na+ current in rat neonatal RO neurons in brain slices and in acutely isolated mature dorsal raphe neurons, as shown in panel B.
- https://cdn.elifesciences.org/articles/54940/elife-54940-fig2-data1-v1.xlsx
Figure 3
Nav long-term inactivation.
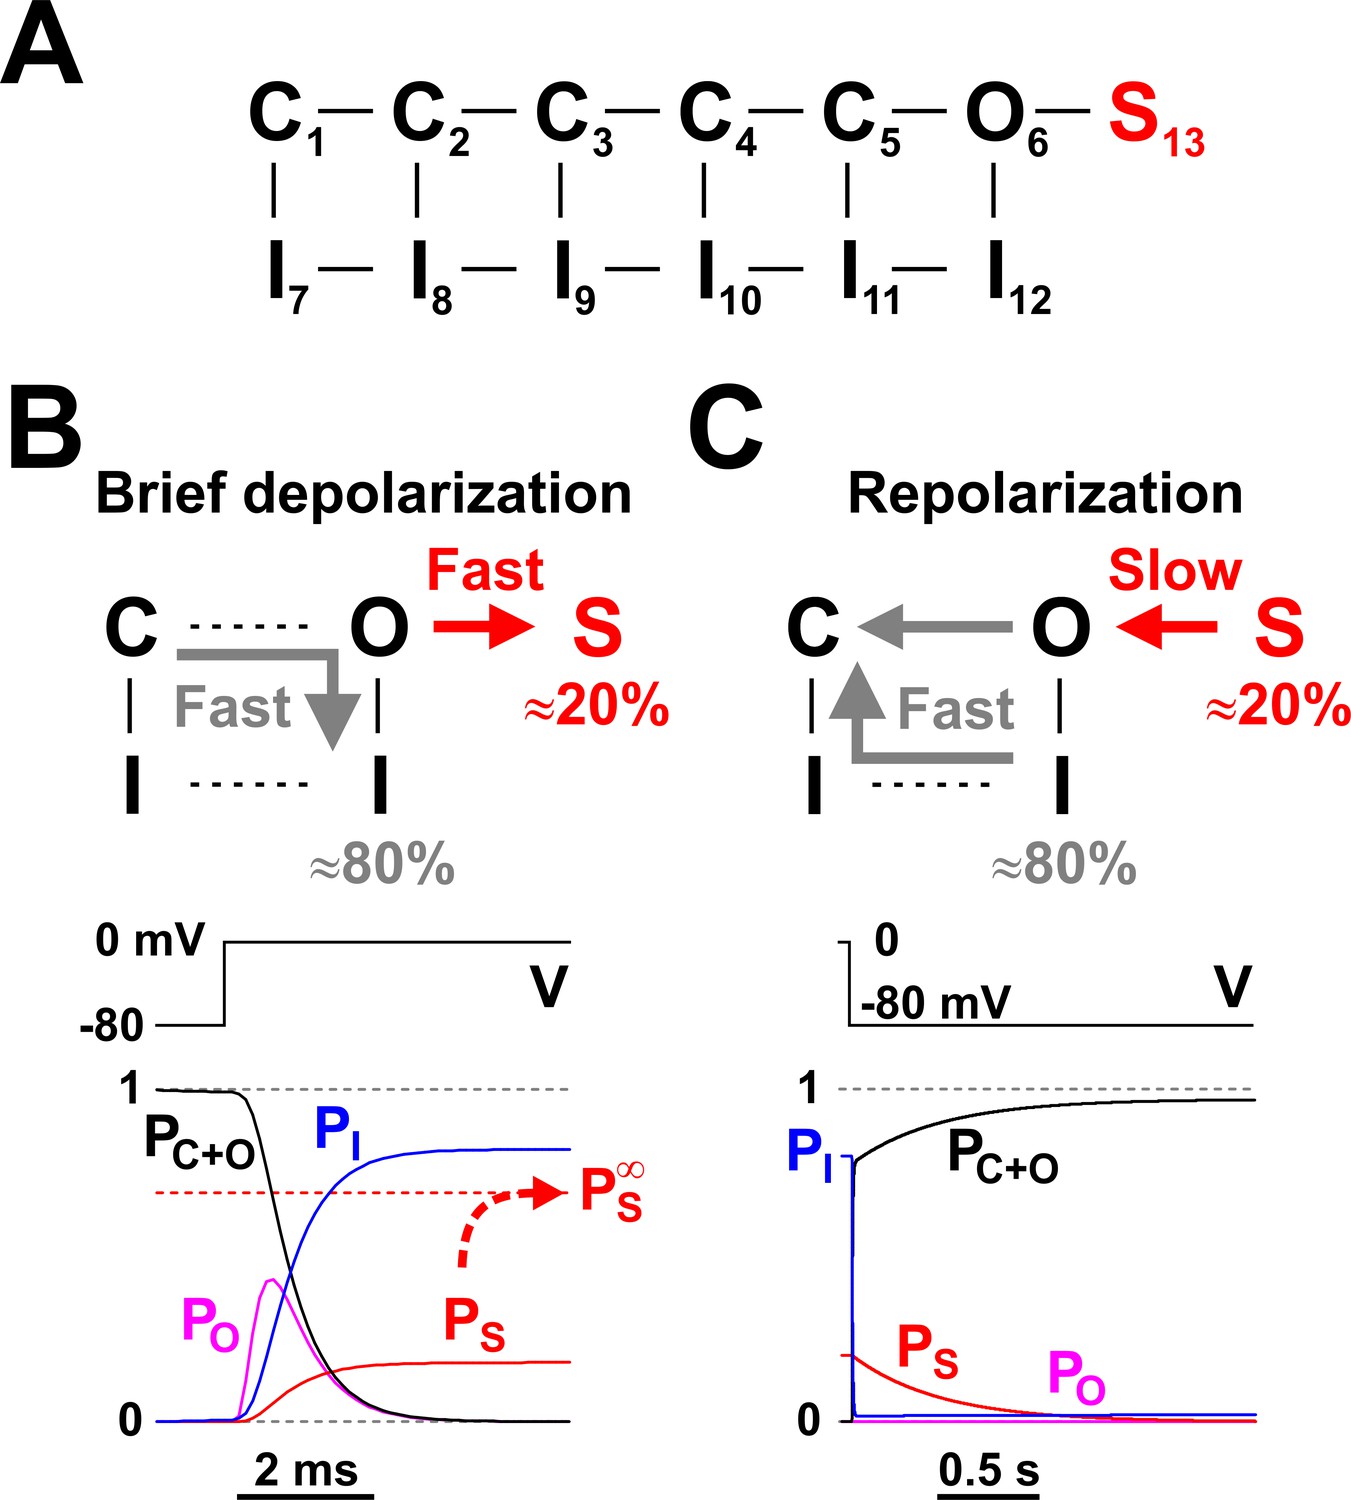
(A) Conceptual Nav state model that adds one non-conducting state (S13) to the model shown in Figure 1D, to explain the slow kinetic component illustrated in Figure 2. S13 is a state of long-term inactivation. (B and C) State transitions undertaken by the channel during a brief depolarization (B) and in the subsequent hyperpolarizing interval (C); note the difference in time scales. During depolarization, ≈ 80% of channels follow the standard C - O - I pathway, whereas the remaining ≈ 20% enter the S state. The O - I and O -S transitions are both fast, as illustrated in the bottom left panel, and compete with each other. When the membrane potential returns to more negative values, the fraction of channels in the I states recovers quickly, whereas the S state fraction recovers slowly, explaining the bi-exponential recovery from inactivation illustrated in Figure 2B. PC+O, PO, PI, and PS represent occupancies of closed plus open, open, inactivated, and long-term inactivated states, respectively.
-
Figure 3—source data 1
Rate constant values for the Nav kinetic model shown in panel A.
- https://cdn.elifesciences.org/articles/54940/elife-54940-fig3-data1-v1.xlsx
Figure 4
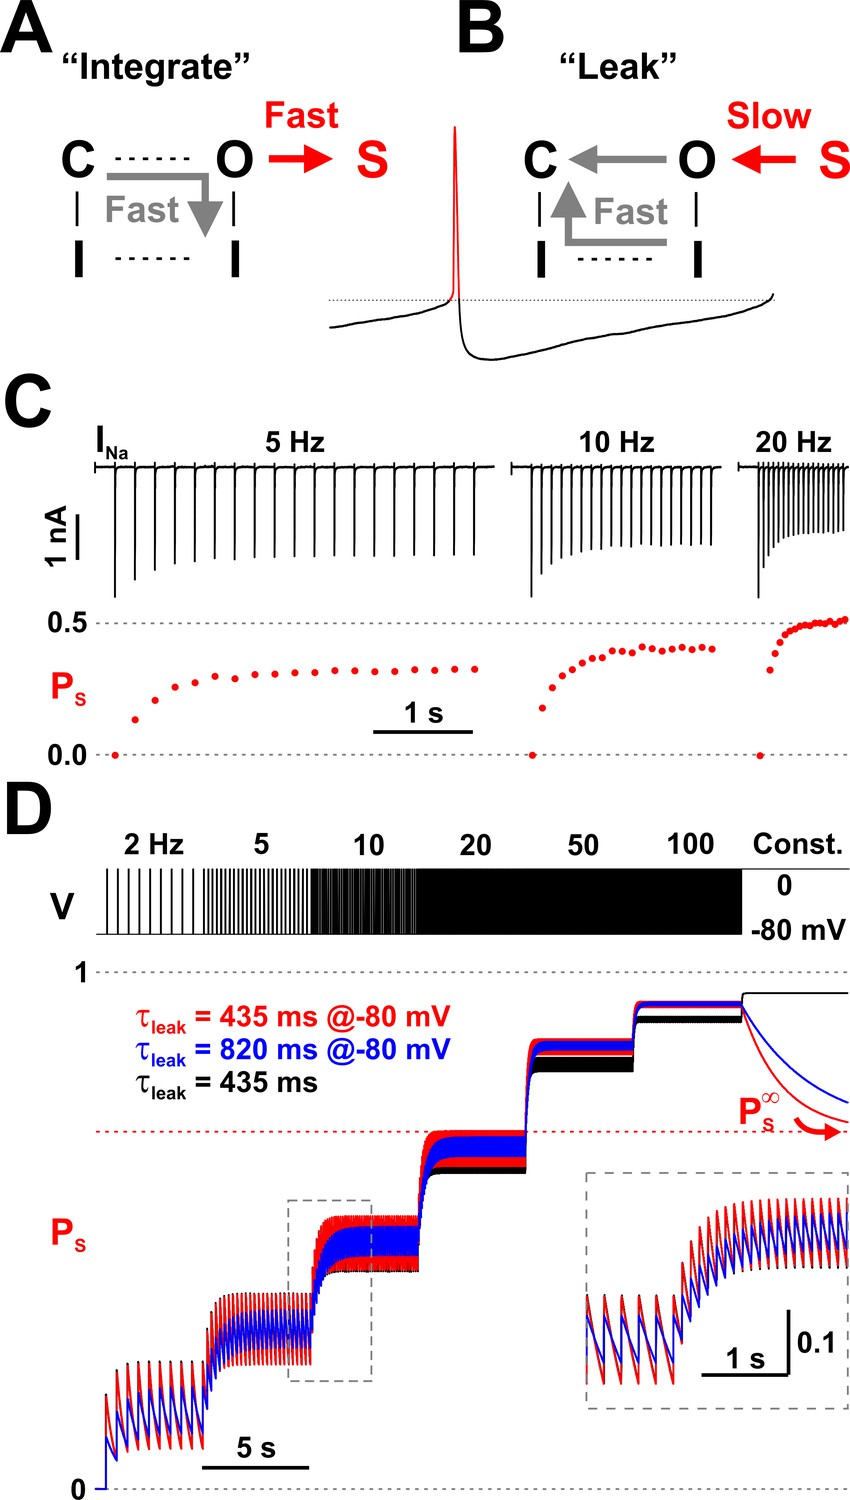
Nav channels implement a molecular leaky integrator that measures spiking frequency.
(A) The ‘integration’ is represented by the quick entry of channels into the LTI state S, during an action potential. (B) The ‘leak’ corresponds to the slow transition out of the S state, during the interspike interval. (C) The average occupancy of the LTI state (PS) increases with pulse repetition rate. The current (INa) trace is as in Figure 2A. (D) Testing the leaky integrator with trains of brief voltage pulses (5 ms at 0 mV, from −80 mV), with different repetition rates (2 to 100 Hz) or at constant depolarization. The average occupancy of the S state is a function of pulse frequency. The Nav model in Figure 3A was tested with two sets of kinetic parameters for the O6 - S13 transition, corresponding to τleak = 435 ms and 80%/20% normal inactivation vs. LTI ratio (red trace; k6,13 = 400.8×e-0.011×V and k13,6 = 0.207×e-0.031×V) or 820 ms and 90%/10% ratio (blue trace; k6,13 = 205.7×e-0.011×V and k13,6 = 0.106×e-0.031×V). Both sets have . For comparison, the response of a discrete-time mathematical leaky integrator with τleak = 435 ms (black trace; Equation 3).
Figure 5
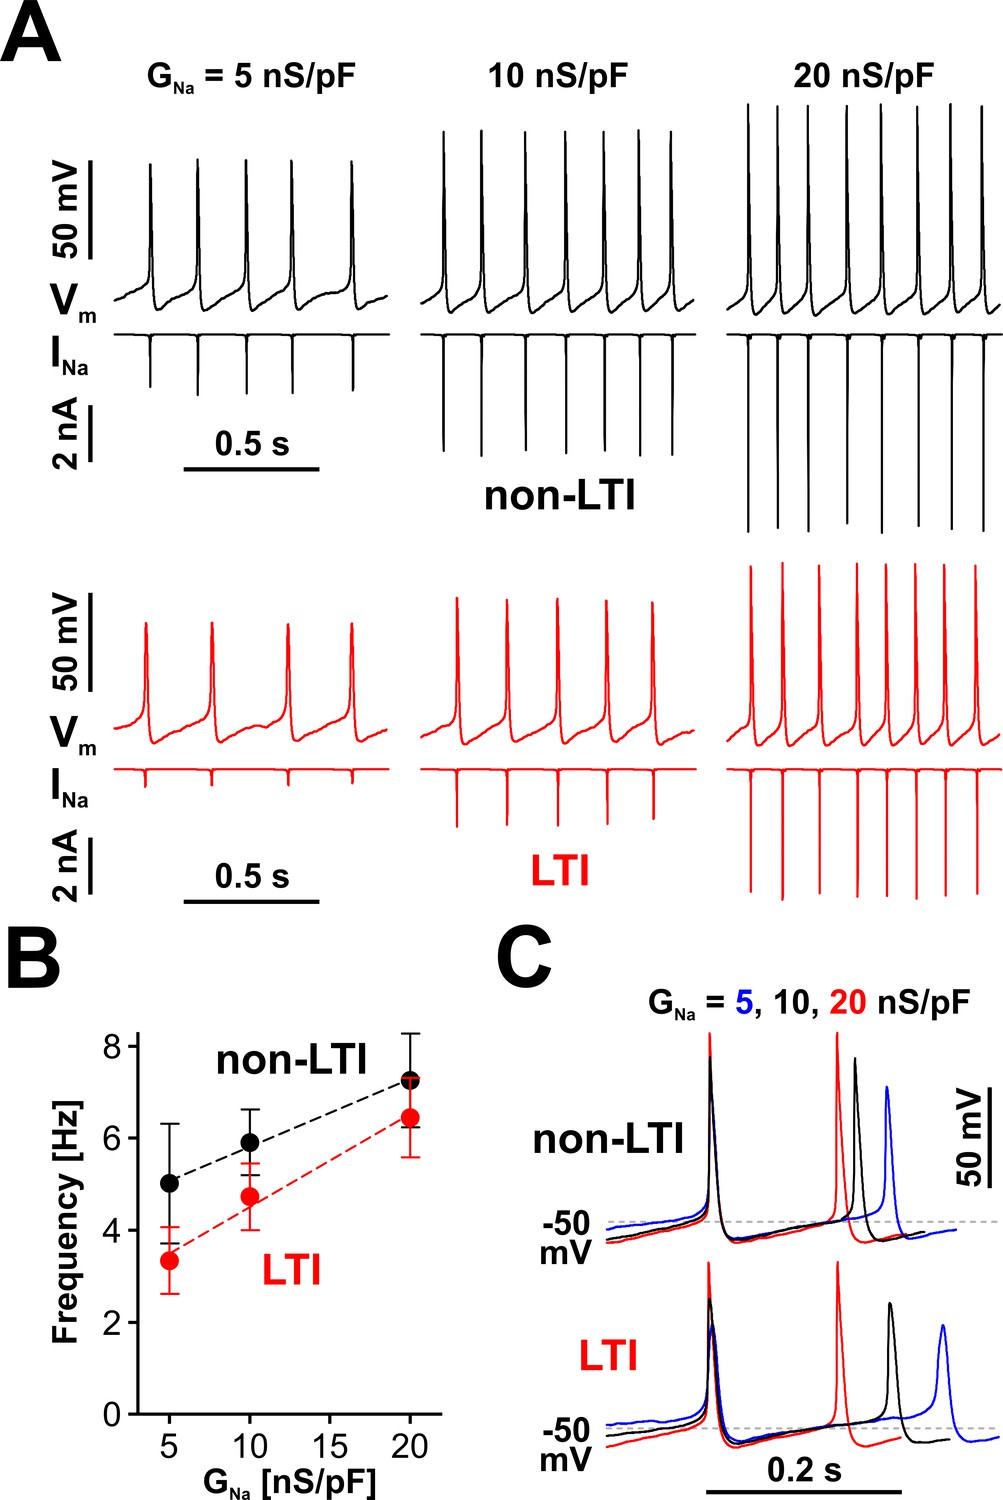
Nav channels drive spiking frequency in serotonergic raphe neurons.
(A) Representative dynamic clamp recordings, where INa generated by a non-LTI (black traces) or LTI (red traces) Nav model was injected in a neuron, under different levels of Nav conductance (GNa). The endogenous sodium current was blocked with bath-applied TTX. (B) Spiking frequency increases proportionally with GNa, over a range typical for neonatal RO neurons, with INa generated by either the non-LTI model (black symbols and fit line, mean ± SE; slope = 0.148 ± 0.011, intercept = 4.34 ± 0.14, n = 7, F-test, p=0.13) or the LTI model (red symbols and fit line; slope = 0.202 ± 0.026, intercept = 2.48 ± 0.346, n = 7, F-test, p=0.0093). The two datasets are statistically different (paired two-tailed t-test, p=0.0394). (C) Representative dynamic clamp traces obtained with INa generated by the non-LTI (top) or LTI (bottom) model, illustrating how the action potential and the interspike interval are shaped by GNa. The data were obtained without stimulation (IInj = 0) from RO neurons in neonatal rat brainstem slices.
-
Figure 5—source data 1
Frequency vs. GNa for LTI and non-LTI models, as shown in panel B.
- https://cdn.elifesciences.org/articles/54940/elife-54940-fig5-data1-v1.xlsx
Figure 6
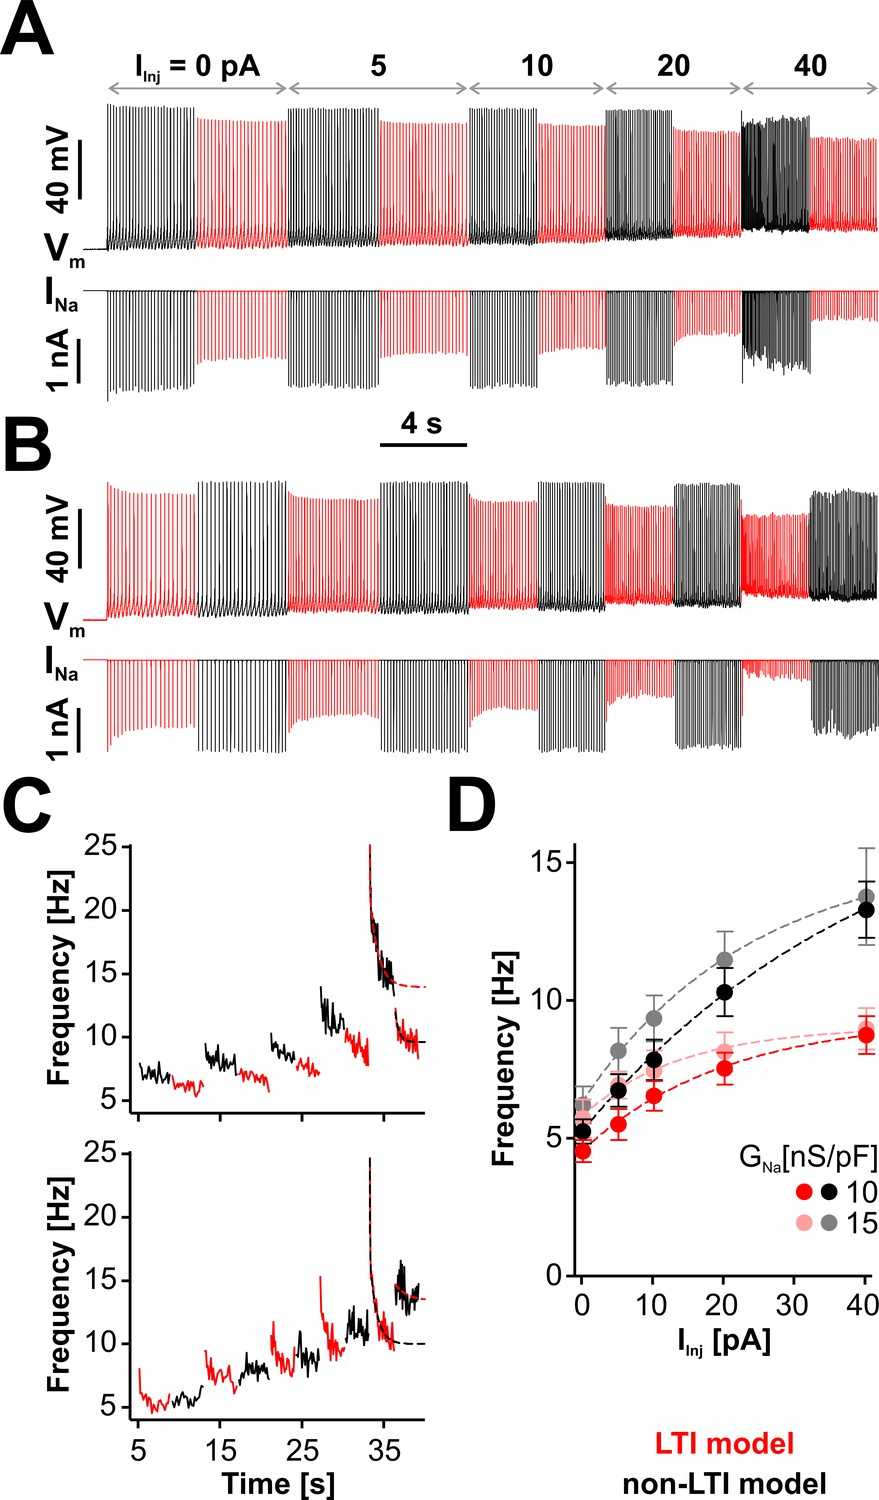
LTI helps the neuron to maintain a low spiking frequency against sustained depolarizations.
(A) Representative dynamic clamp recording, where INa (lower trace) generated by the LTI (red) or non-LTI (black) model was injected in a neuron, under increasing depolarizing current (IInj). Both models are integrated throughout the entire protocol, but only one model at a time injects current in the cell. In this example, GNa was 10 nS/pF. Before the protocol started, the neuron was clamped at −65 mV for 5 s. (B) Same as in (A), but the models were alternated in the opposite order. (C) Instantaneous spiking frequency extracted from the recording shown in (A) (upper panel) or (B) (lower panel). (D) Quasi steady-state spiking frequency vs. IInj (mean ± SE, n = 13). The values were obtained by averaging over the second half of each step, from traces obtained with the protocol shown in (A). The datasets are statistically different (paired two-tailed t-test) for LTI vs. non-LTI model (p=0.0387 or 0.0374, for GNa = 10 or 15 nS/pF, respectively) and for GNa = 10 vs. 15 nS/pF (p=0.0143 or 0.0038, for LTI or non-LTI model, respectively). The dashed lines in (C) and (D) are exponential fits meant as a visual aid. The data were obtained from RO neurons in neonatal rat brainstem slices.
-
Figure 6—source data 1
Frequency vs. IInj for LTI and non-LTI models, as shown in panel D.
- https://cdn.elifesciences.org/articles/54940/elife-54940-fig6-data1-v1.xlsx
Figure 7
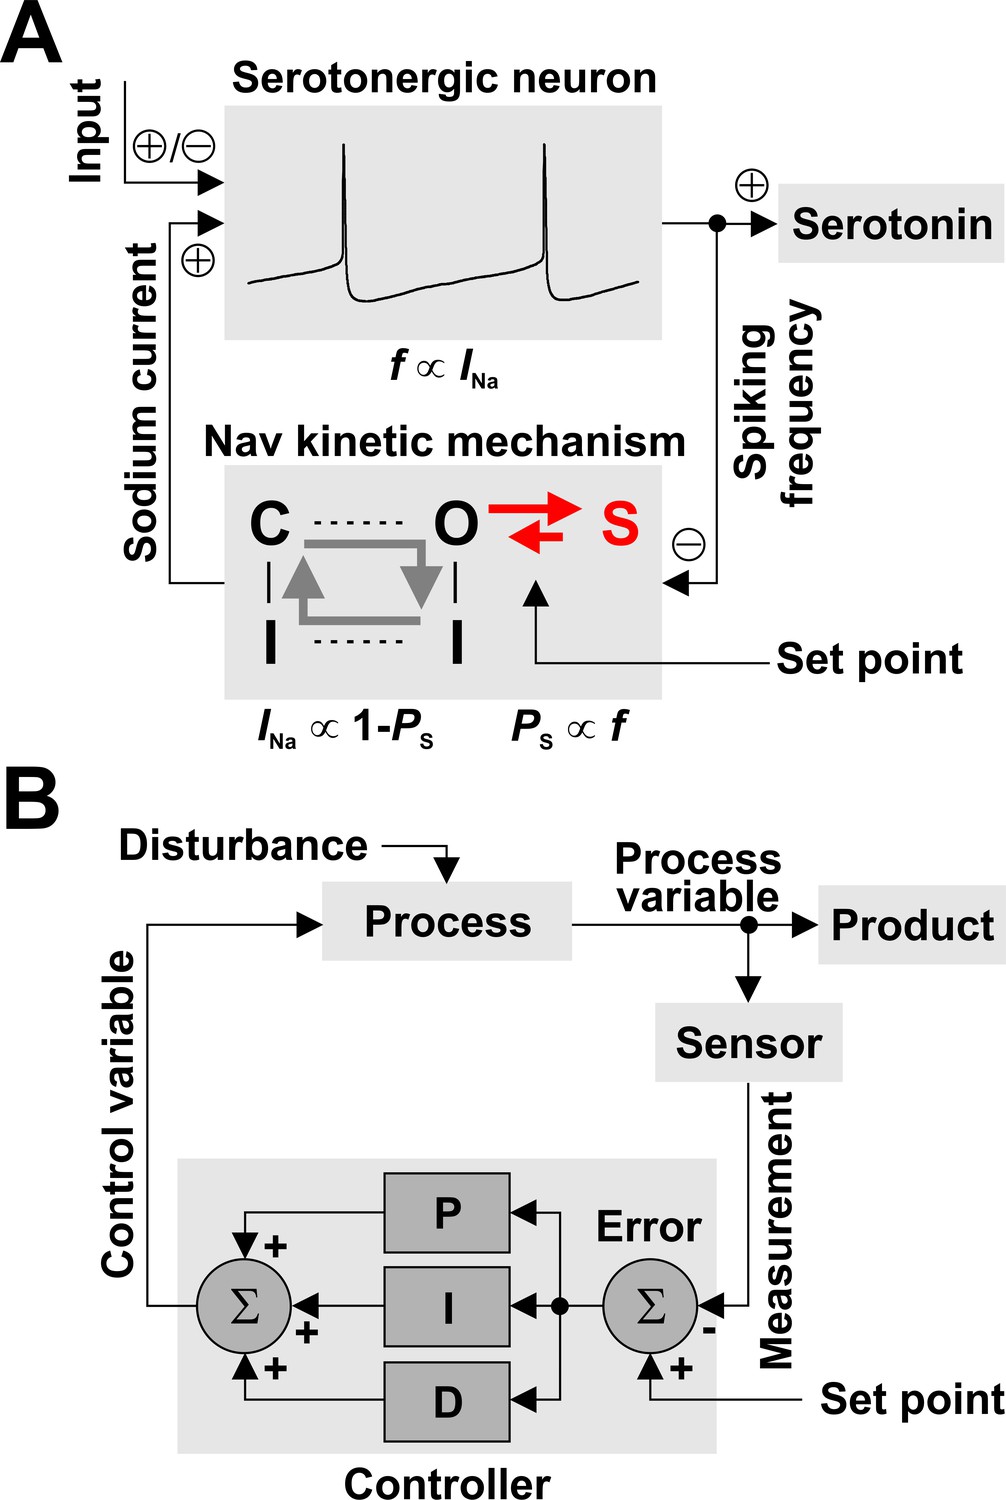
Nav channels can regulate spiking frequency in serotonergic raphe neurons in a negative feedback loop.
(A) Nav-based neuronal controller, where spiking frequency f is both ‘measured’ by the occupancy of the long-term inactivated state (PS) and ‘driven’ by the amount of available INa. For example, an increase in f via excitatory synaptic input causes an increase in PS, which determines a decrease in the fraction of Nav channels available to generate current, equal to 1 – PS. In turn, this decrease in INa reduces firing frequency, closing the loop. The kinetics of LTI establish the operating point of the control loop. (B) For comparison, a conceptual schematic of controllers used in engineering applications, which can combine multiple methods for error correction: proportional (P), integral (I), and derivative (D).
Additional files
Download links
A two-part list of links to download the article, or parts of the article, in various formats.
Downloads (link to download the article as PDF)
Open citations (links to open the citations from this article in various online reference manager services)
Cite this article (links to download the citations from this article in formats compatible with various reference manager tools)
Sodium channels implement a molecular leaky integrator that detects action potentials and regulates neuronal firing
eLife 9:e54940.
https://doi.org/10.7554/eLife.54940


