IP3 mediated global Ca2+ signals arise through two temporally and spatially distinct modes of Ca2+ release
- Department of Neurobiology & Behavior, UC Irvine, United States
- Department of Physiology & Biophysics, UC Irvine, United States
Figures
Figure 1 with 4 supplements
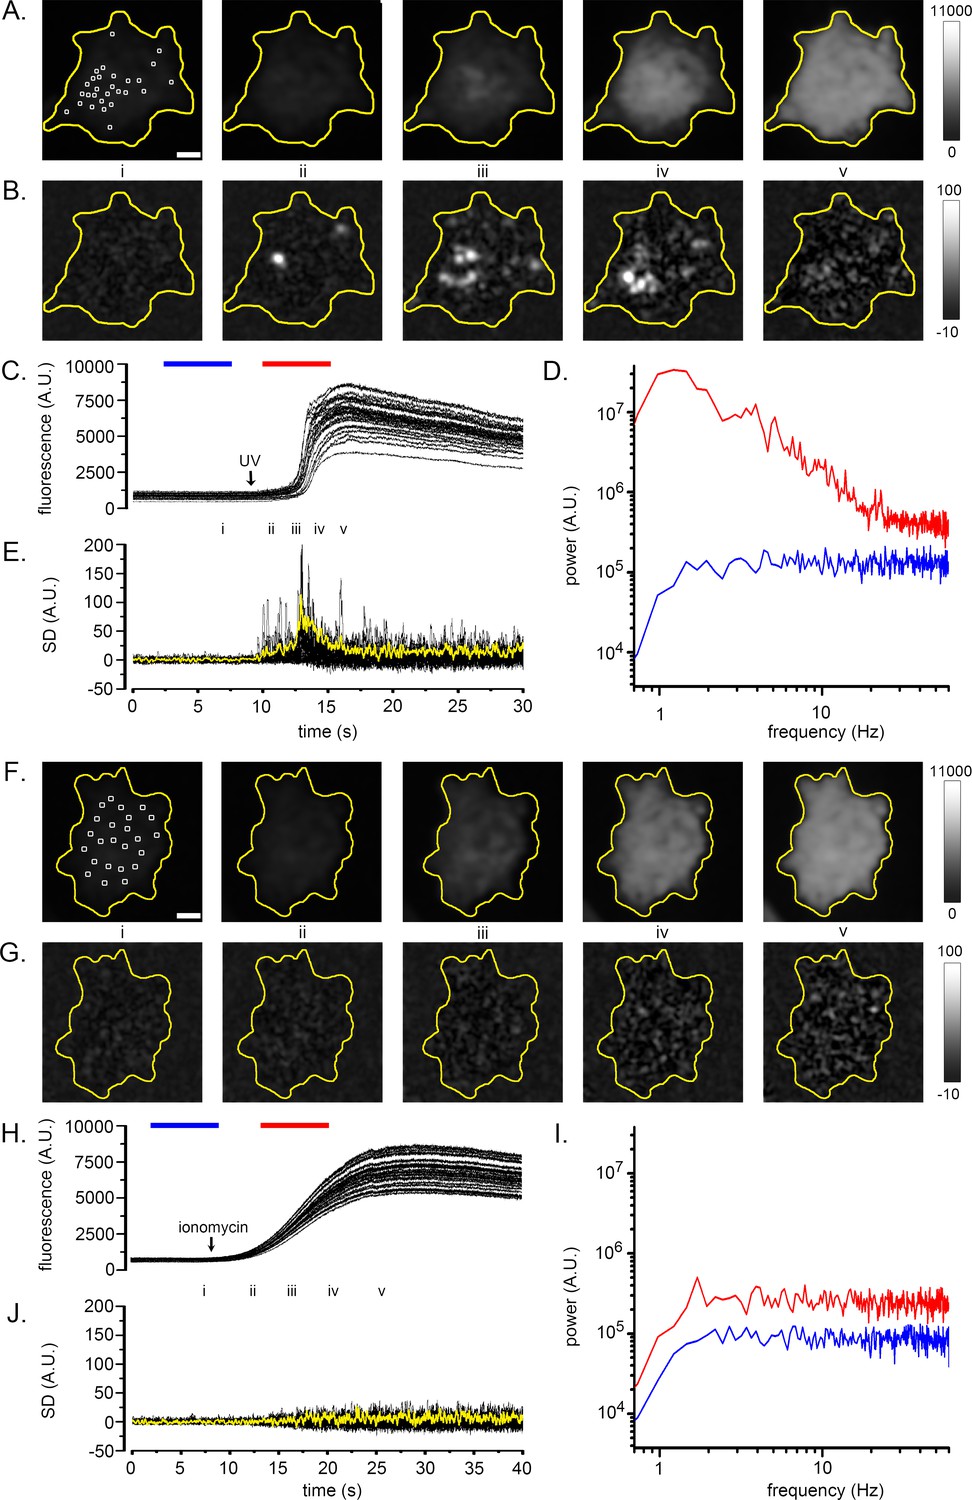
Fluctuation analysis of Ca2+ signals.
(A–D) Records from a single WT HEK cell loaded with Cal520 and stimulated by photorelease of i-IP3 to evoke a global Ca2+ elevation. (A) Panels show ‘raw’ TIRF fluorescence images of the cell before (i), during the rising phase (ii-iv) and at the peak (v) of the global Ca2+ signal. Images are Gaussian-blurred (sigma ~1 µm) single frames (8 ms exposure time) captured at times as marked in C. Grey scale intensities depict fluorescence in arbitrary camera units, as indicated by the bar at the right. The yellow outline marks the TIRF footprint of the cell. (B) Panels show corresponding standard deviation (SD) images at the same times as in A, highlighting hot spots of local, transient Ca2+ release. Grey scale intensities (arbitrary units; A.U.) represent the shot noise-corrected standard deviation of fluorescence fluctuations within a 160 ms running time window. (C) Overlaid black traces show fluorescence monitored from 24 regions of interest (ROIs; marked by squares in panel Ai) placed on areas of local Ca2+ activity. The arrow indicates the time of the photolysis flash. (D) Power spectra of Ca2+ fluorescence fluctuations averaged from the 24 ROIs at baseline (blue trace) and during the rising phase of the global Ca2+ signal (red trace). Spectra were calculated from recordings during the respective times indicated by the colored bars in C, after low-pass (1 Hz) filtering of the fluorescence image stack to strip out the slow rise of the global signal. (E) Overlaid traces show shot noise-corrected SD signals from the 24 ROIs centered on hot spots of Ca2+ activity. The thicker yellow trace shows the mean SD signal monitored from a ROI encompassing the entire cell and is depicted after scaling up by a factor of 10 relative to the traces from small ROIs. (F–I) Corresponding images and plots from an HEK cell devoid of IP3Rs (3KO) in which a global Ca2+ elevation was evoked by pipetting a 10 µl aliquot of ionomycin into the bathing solution at a distance from the cell when marked by the arrow in H. In this case no hot spots or increased low-frequency fluctuations accompanied the elevation in cytosolic [Ca2+], and the ROIs (marked by squares in panel Fi) used to derive the data in H-J were placed randomly. The yellow trace in J depicting the mean SD signal from the entire cell is scaled up by a factor of 10 relative to the traces from small ROIs. Fluorescence and SD magnitudes are expressed in arbitrary units consistent with those in A-D.
Figure 1—figure supplement 1
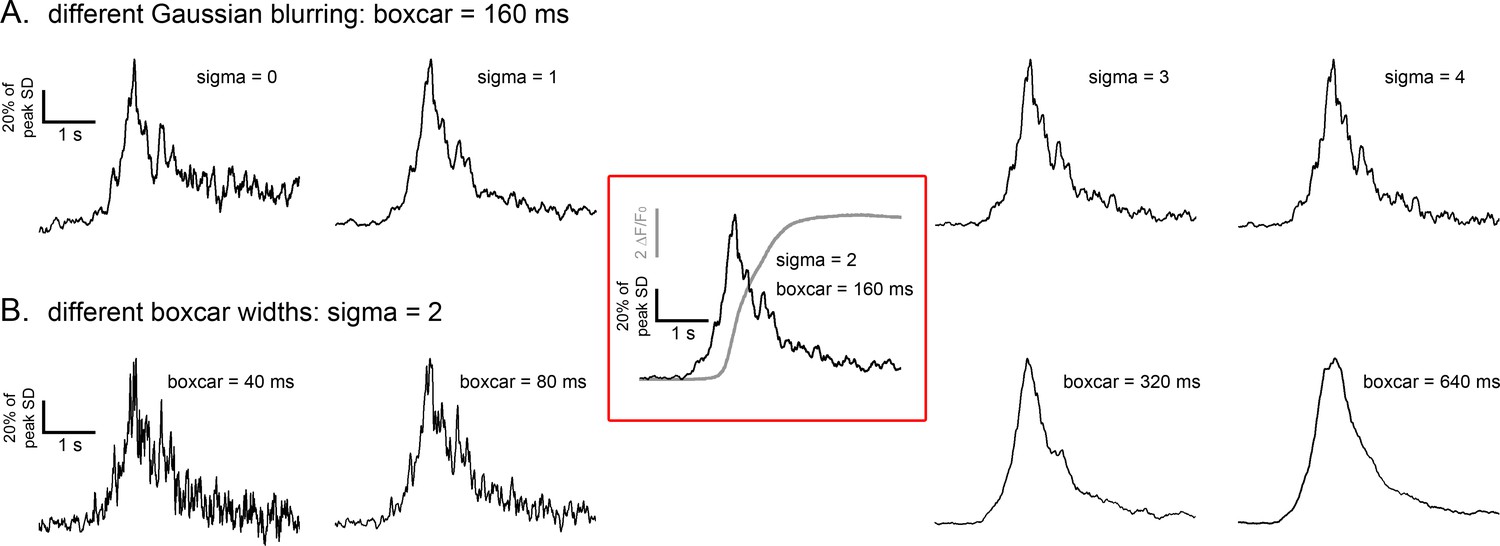
Optimization of space-time parameters used in SD fluctuation analysis algorithm.
Records show SD traces derived from the same Ca2+ imaging record of a fast-rising i-IP3-mediated global Ca2+ signal processed by our SD fluctuation algorithm using different space (A) and time (B) parameters. (A) SD traces derived with different levels of spatial blurring applied to the Ca2+ image stack, applying Gaussian blurs with standard deviations (sigma) ranging from 0 to 4 pixels (0–2 µm at the specimen) as indicated. (B) SD traces derived with varying widths of the boxcar function (40 ms to 640 ms as indicated) used to calculate a running measure of signal variance. All SD traces are shown normalized to the same peak amplitude. Traces within the red box show the SD signal obtained using the parameters we selected to use throughout the manuscript (Gaussian blur two pixels, 160 ms boxcar width) and the associated ΔF/F0 trace showing the rise in global Ca2+ signal. The traces are representative of analyses performed on three separate Ca2+ imaging records and show that our selected parameters yield a good compromise between kinetic resolution and noise level of the SD signal.
Figure 1—figure supplement 2

Correction of signal variance for photon shot noise.
(A) Wide-field images were captured at 8 ms exposure time from a solution of fluorescein as the excitation laser intensity was increased in a stepwise fashion. Image panels show single frames of raw fluorescence (upper) and processed variance (lower) at different laser powers. (B) Traces showing mean raw fluorescence intensity (upper) and mean variance per frame (lower), both averaged across the image field. The red, upward trending trace shows the total variance, and the blue trace the variance after subtracting a scaled factor of the mean fluorescence. Transitions between the steps of laser power have been deleted, so the traces show only the steady-state fluorescence and variance at each laser power. Roman numerals denote the laser powers corresponding to the image panels in A. (C) Scatter plot of variance vs. fluorescence intensity, derived from the data in B. As expected for stochastic photon shot noise the data follow a linear relation. The slope of a regression line was used to calculate the scaling factor to derive the corrected, blue trace.
Figure 1—figure supplement 3
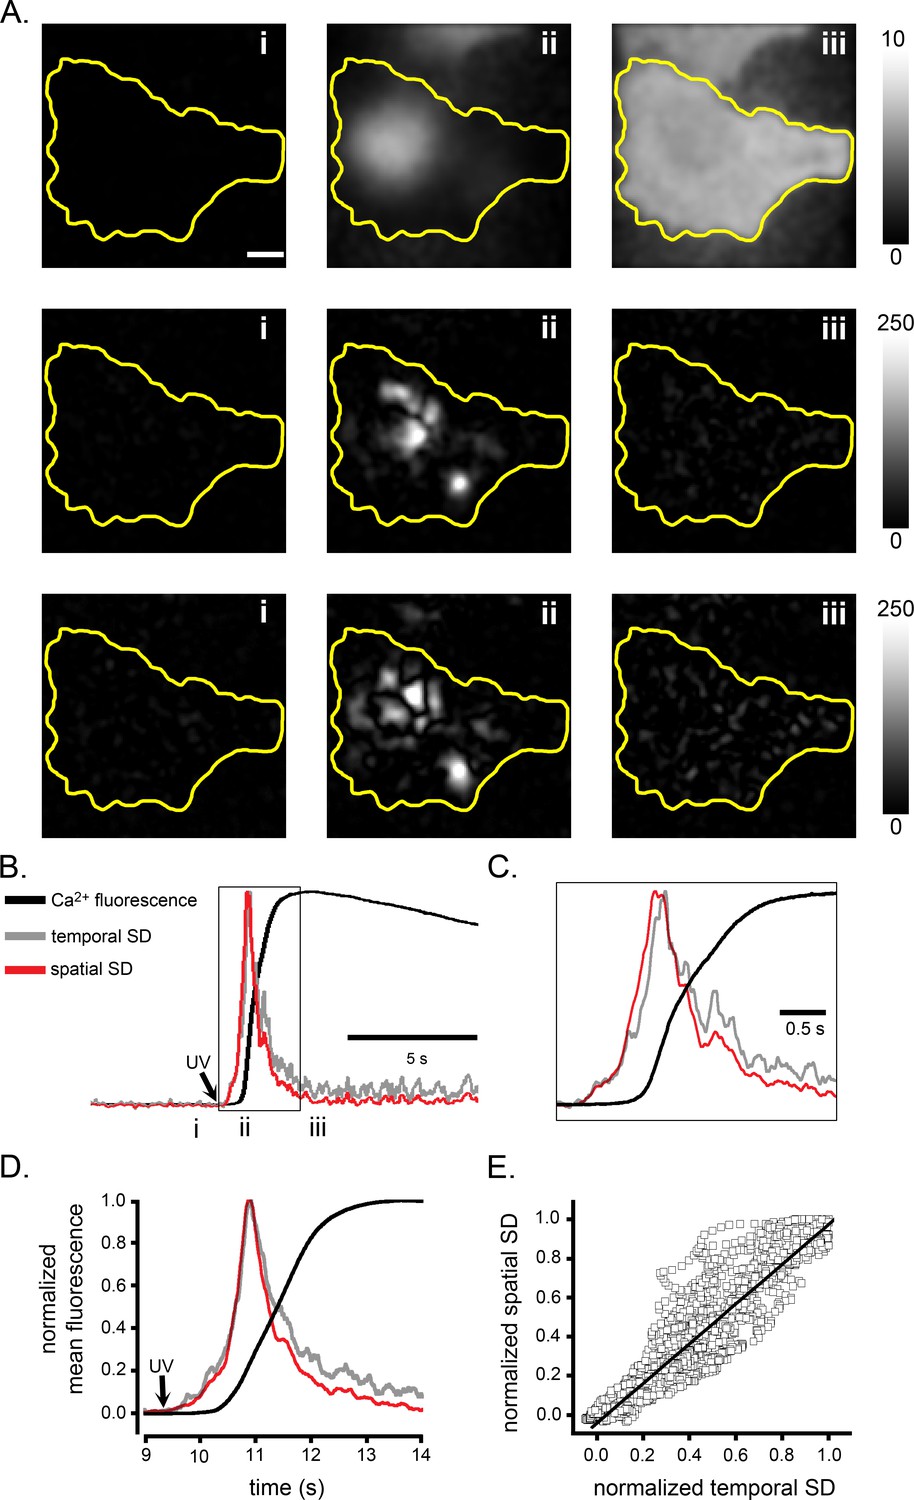
Spatial fluctuation analysis of IP3-mediated global Ca2+ signals mirrors temporal fluctuations.
(A–C) Records from a single WT HEK cell loaded with Cal520 and stimulated by photorelease of i-IP3 to evoke a global Ca2+ elevation. (A) The upper panels show fluorescence ratio (ΔF/F0) images of a WT HEK cell before (i), during the rising phase (ii) and at the peak (iii) of the global Ca2+ response evoked by photoreleased i-IP3. Images are Gaussian-blurred (sigma of 2 pixels) single frames (8 ms exposure time) captured at times as marked in B. Scale bar = 10 µm. Middle and bottom panels respectively show corresponding temporal standard deviation (SD) images and spatial SD images, at the same times as the upper panels. Grey scale intensities depict the fluorescence ratio (ΔF/F0: upper panels) or SD in arbitrary units (middle and lower panels). The yellow outlines mark the TIRF footprint of the cell. (B) Traces depict the fluorescence ratio (ΔF/F0; black), the temporal SD signal (grey) and the spatial SD signal (red) during the Ca2+ response. To facilitate comparison, all traces are shown normalized to the same peak height. (C) Expanded view of the traces demarcated by the box in B. (D) Overlaid mean fluorescence ratio, temporal SD and spatial SD traces averaged from eight cells stimulated by photorelease of i-IP3. (E) Scatter plot of measurements of spatial SD vs. temporal SD signal during the rising phase of the global Ca2+ response. For each cell, the temporal and spatial SD signals were first normalized to their respective peak values. Data points are individual measurements pooled from eight cells and the line is a regression fit (R = 0.95) with a slope of 1.02.
Figure 1—video 1
Fluctuation processing of Ca2+ image recordings.
Movies show Ca2+ images from the same cells as in Figure 1. Cells were bathed in zero Ca2+ solution and images were processed by the temporal fluctuation algorithm, as described in the main text, to generate SD image stacks. Upper movies show Gaussian-blurred (sigma of 2 pixels), black-level subtracted Cal520 fluorescence (left), and temporal SD fluctuations (right) of a WT HEK cell during a global Ca2+ signal evoked by photoreleased i-IP3. Lower movies show Cal520 fluorescence (left) and SD fluctuations (right) of a HEK 3K0 cell during a global rise in cytosolic Ca2+ evoked by adding a small aliquot of ionomycin to the Ca2+-free bathing solution. Colored outlines mark the TIRF footprints of the cells; the scale bar is 10 µm. Traces on the right plot Cal520 fluorescence (cyan) and SD fluctuations (yellow) over the time course of the responses, in synchrony with their respective movies. The movie playback speed is slowed during the rising phase of the i-IP3 evoked Ca2+ signal to facilitate visualization of the transient flurry of localized SD fluctuations.
Figure 2 with 3 supplements
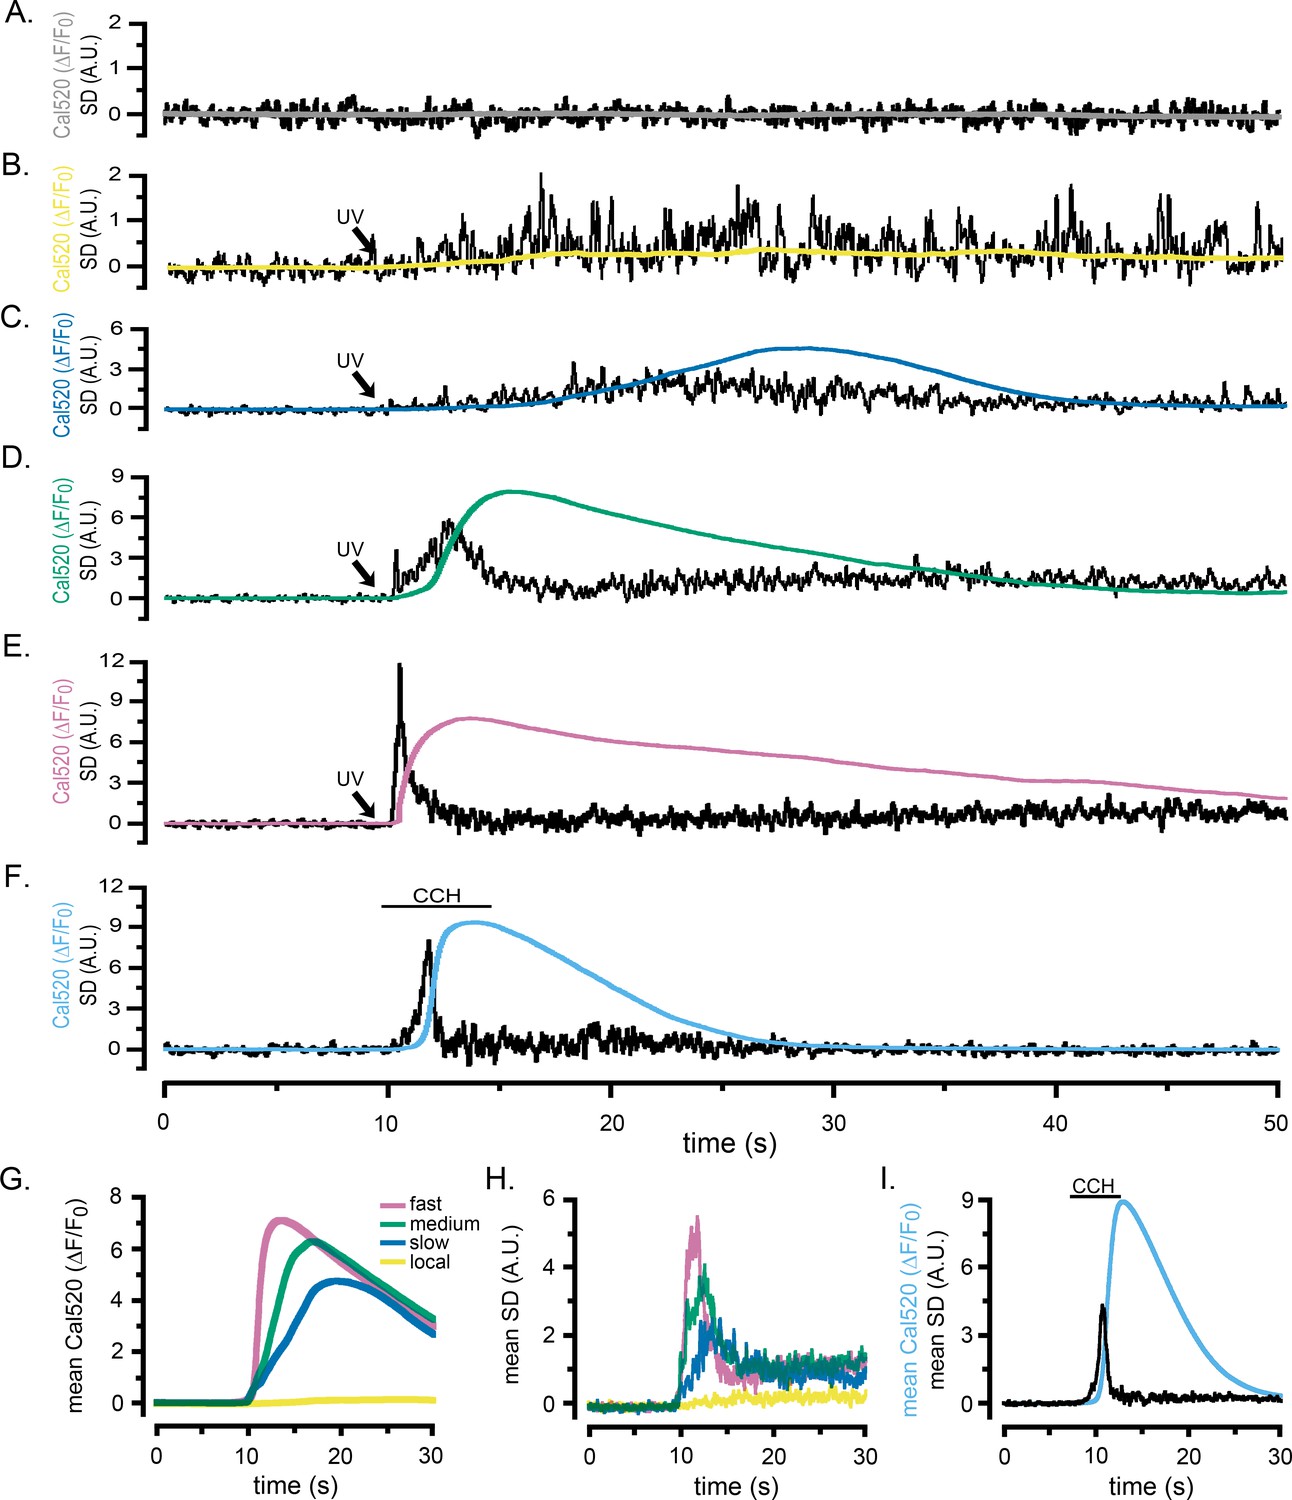
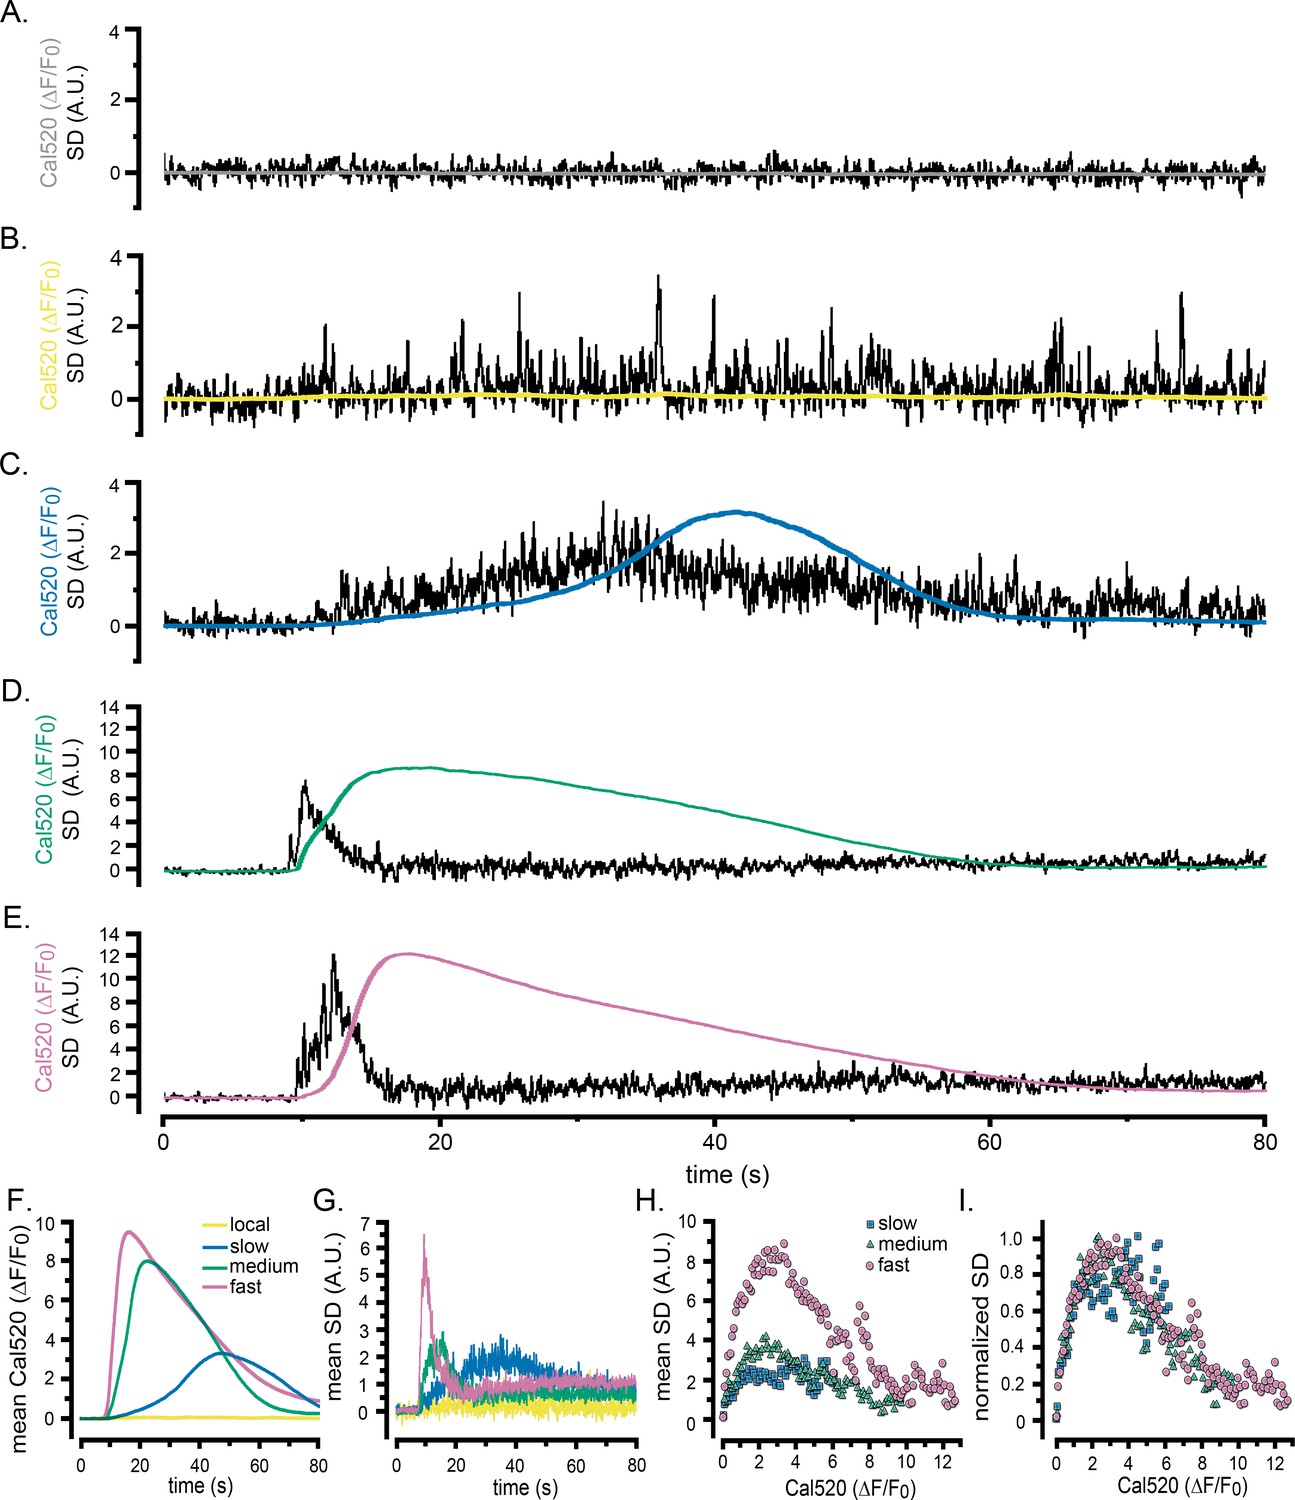
Localized fluctuations in cytosolic [Ca2+] occur predominantly during the rising phase of global Ca2+ elevations.
Representative records show the Cal520 fluorescence ratio (ΔF/F0; smooth traces) and the associated SD fluctuation measurements (noisy traces) from ROIs encompassing single WT HEK cells bathed in Ca2+-free medium. (A) Record obtained under basal conditions without stimulation. (B–E) Responses evoked by progressively longer photolysis flashes to release increasing amounts of i-IP3 in cells loaded with caged i-IP3. The SD signals are presented in arbitrary units (A.U.) but are consistent throughout all panels. To better display responses to weaker stimuli, the y-axes are scaled differently between panels. (F) Responses evoked by application of carbachol (CCH; 10 µM) when indicated by the bar. (G, H) Pooled data plotting, respectively, means of the global Ca2+ fluorescence signals and SD signals of cells stimulated with progressively increasing photorelease of i-IP3 to evoke predominantly local Ca2+ signals (yellow traces; n = 7), and global elevations with slow (blue; n = 9), medium (green; n = 13), and fast rising Ca2+ signals (pink; n = 11). (I) Mean Cal520 fluorescence ratio signal (cyan trace) and SD signal (black trace) averaged from 12 cells stimulated by local application of 10 µM CCH when marked by the bar.
Figure 2—video 1
Detection of local Ca2+ puffs by fluctuation analysis.
Movies show Ca2+ images from the same WT HEK cells as in Figure 2A,B, processed as described in the main text. Upper movies show Ca2+ fluorescence ratio (ΔF/F0; left) and SD fluctuations (A.U.; right) of an unstimulated HEK cell, and lower movies show corresponding Ca2+ and SD signals from a cell stimulated by weak photorelease of i-IP3 to generate local Ca2+ puffs without an appreciable rise in basal [Ca2+]. Colored outlines mark the TIRF footprint of the cells; the scale bar is 10 µm. Traces to the right plot the ΔF/F0 fluorescence ratio (cyan) and SD fluctuations (yellow) in synchrony with their corresponding movies.
Figure 2—video 2
Ca2+ fluctuations during global Ca2+ elevations evoked by increasing photorelease of i-IP3.
Movies show Ca2+ images from the same WT HEK cells as in Figure 2C–E, processed as described in the main text. Upper, middle, and lower panels show cells that respectively gave slow-, intermediate-, and fast-rising global Ca2+ signals in response to photorelease of increasing amounts of i-IP3. Panels on the left show whole-cell Cal520 fluorescence (ΔF/F0) and associated temporal SD fluctuations (A.U.) on the right. Colored outlines mark the TIRF footprint of the cells; the scale bar is 10 µm. Traces to the right plot Cal520 fluorescence ratio (cyan) and SD signals (yellow) in synchrony with their corresponding movies.
Figure 2—video 3
Ca2+ fluctuations during a carbachol evoked global Ca2+ signal.
Movies show Ca2+ fluorescence ratio (ΔF/F0; left) and associated SD fluctuations (A.U.; right) of the HEK cell presented in Figure 2F during stimulation with carbachol as described in the main text. Colored outlines mark the TIRF footprint of the cell; the scale bar is 10 µm. Traces plot Cal520 fluorescence ratio (cyan) and SD signals (yellow) in synchrony with their corresponding movies.
Figure 3 with 4 supplements
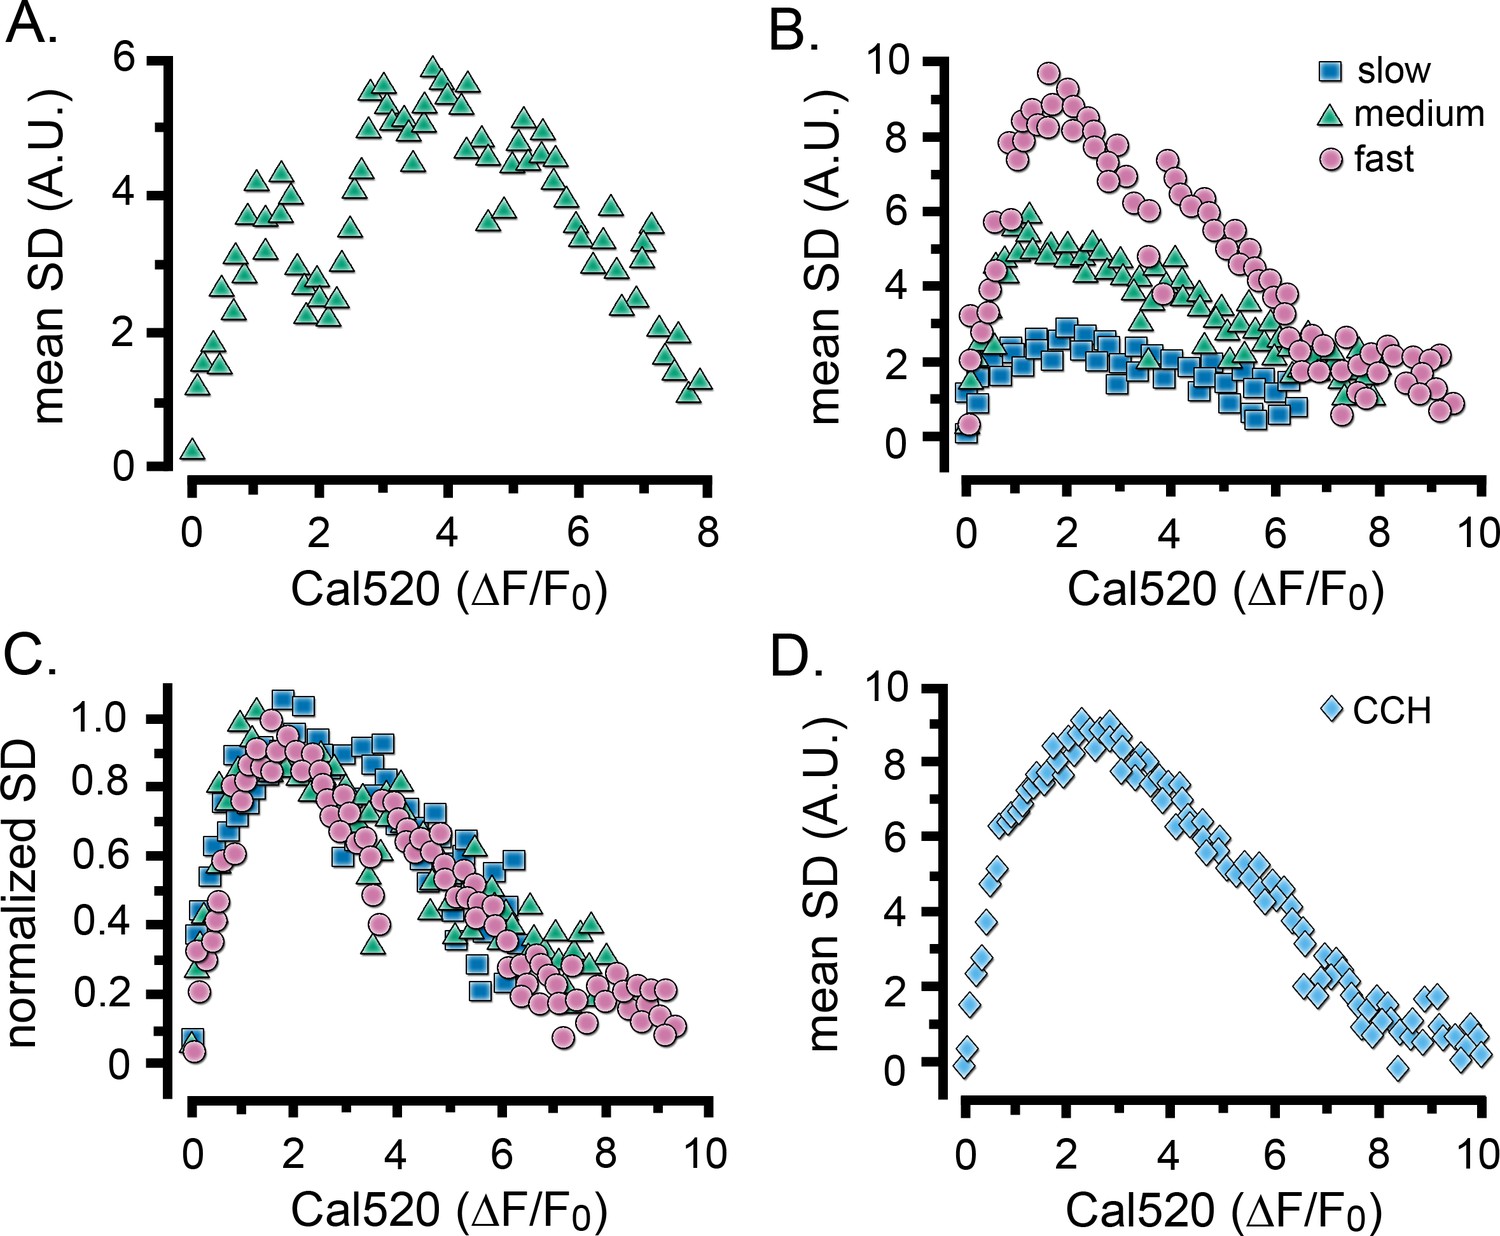
Relationship between Ca2+ fluctuations and Ca2+ level during the rise of global Ca2+ signals.
Scatter plots show measurements of the SD signal at intervals during the rising phase of global Ca2+ response against the magnitude of the global Ca2+ elevation (ΔF/F0) at that time. Data were binned at intervals of (0.1 ΔF/F0). (A) Measurements from the same cell as in Figure 2D. (B) Data from the same groups of cells as in Figure 2G,H, plotting mean SD signal amplitude as a function of mean Ca2+ level during global responses for cells exhibiting slow (blue squares), intermediate (green triangles) and fast rising responses (pink circles). (C) The same data as in B, after normalizing to the respective maximum SD signals for each group of cells. (D) Scatter plot of mean SD signal amplitude as a function of Ca2+ level during global responses for 12 cells stimulated by local application of CCH, as in Figure 2I.
Figure 3—figure supplement 1

Fluctuation image analysis resolves Ca2+ puffs at peak elevations in global Ca2+ signals.
(A) Upper panels show fluorescence ratio (ΔF/F0) images of a single WT HEK cell before (i), during the rising phase (ii) and at the peak (iii) of a global Ca2+ signal evoked by photolysis of caged i-IP3. Images are Gaussian-blurred (sigma of 2 pixels) individual frames (8 ms exposure time) captured at times as marked in B. Scale bar = 10 µm; the yellow outline marks the TIRF footprint of the cell. Grey scale intensities depict the fluorescence ratio (ΔF/F0), as indicated by the bar at the right. Lower panels show corresponding SD fluctuation images at the same times as in A, highlighting hot spots of local, transient Ca2+ release. Grey scale intensities depict the fluorescence in arbitrary camera units (A.U.). (B) Traces depict the whole-cell fluorescence ratio (black), the whole-cell SD fluctuations (grey), and SD fluctuations (red) from a small ROI (red square in the lower left panel of (A) centered on a site of localized Ca2+ activity. Note the appearance of a local Ca2+ puff at this site at the time marked as iii, even though the global fluorescence ratio was maximal (ΔF/F0 ~8) at this time. The arrow marks the time of the photolysis flash.
Figure 3—figure supplement 2
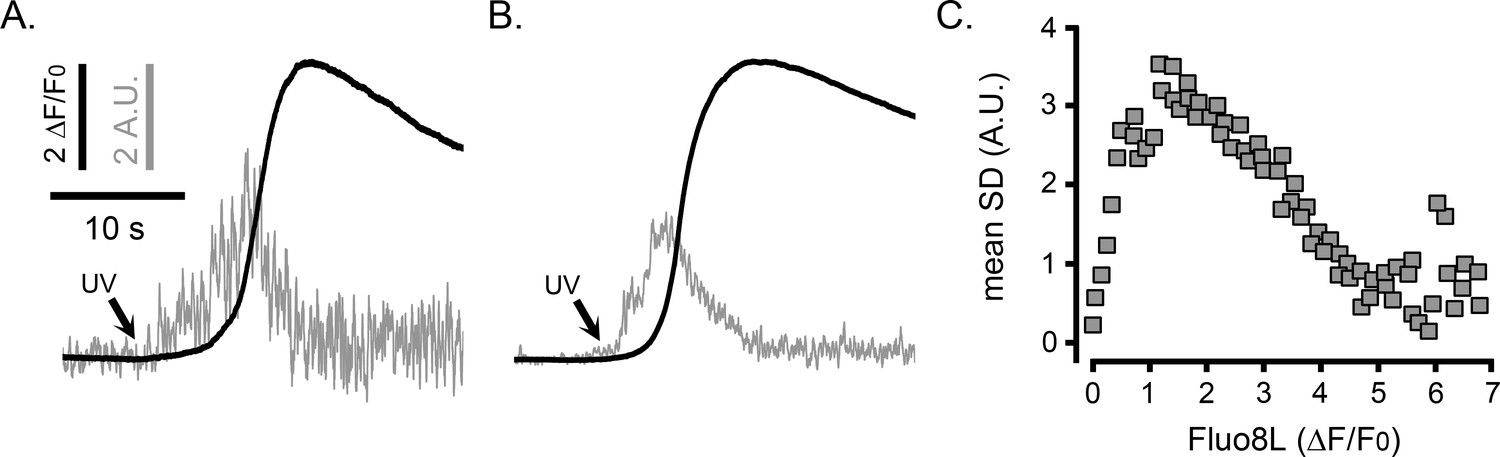
Temporal fluctuations in cytosolic [Ca2+] during global Ca2+ elevations in HEK cells monitored with the low affinity Ca2+ indicator fluo8L.
(A) Traces plot the whole-cell fluorescence ratio of fluo8L (ΔF/F0; black) and the associated SD fluctuations (arbitrary units, A.U.; gray) of a WT HEK cell stimulated by photoreleased i-IP3. (B) Mean whole-cell fluo8L (ΔF/F0; black) fluorescence ratio signal and the associated SD fluctuations (arbitrary units, A.U.; gray) averaged from 11 WT HEK cells. Scale bars apply to A and B. (C) Scatter plot of mean SD signals vs. fluo8L ΔF/F0, binned at intervals of 0.1 (ΔF/F0) during the rising phase of global Ca2+ signals evoked by photoreleased i-IP3. Data are mean values from 11 WT HEK cells.
Figure 3—figure supplement 3
Temporal fluctuations in cytosolic [Ca2+] during cell-wide Ca2+ signals evoked by photoreleased of i-IP3 in HEK cells bathed in medium including 2 mM Ca2+.
(A–E) Traces show representative examples of the Cal520 fluorescence ratio (smooth traces) and the associated SD signals (noisy traces) from ROIs encompassing single HEK cells in the absence of stimulation (A), and when stimulated with progressively longer (B–E) UV flashes. Note differences in y axis scales. (F,G) Superimposed fluorescence traces show the mean Cal520 fluorescence ratios (F) and mean SD signals (G) of cells showing only local signals (yellow; n = 3), and cells with slow (blue; n = 6), intermediate (green; n = 8), and fast (pink; n = 15) rising global Ca2+ signals. (H) Scatter plot of mean SD fluctuations at intervals during the rising phase of the response vs. global fluorescence signal (ΔF/F0) at that time. Data are from the same cells as in F,G. (I) The same data as in H, plotted after normalizing to the same peak SD magnitude.
Figure 3—figure supplement 4
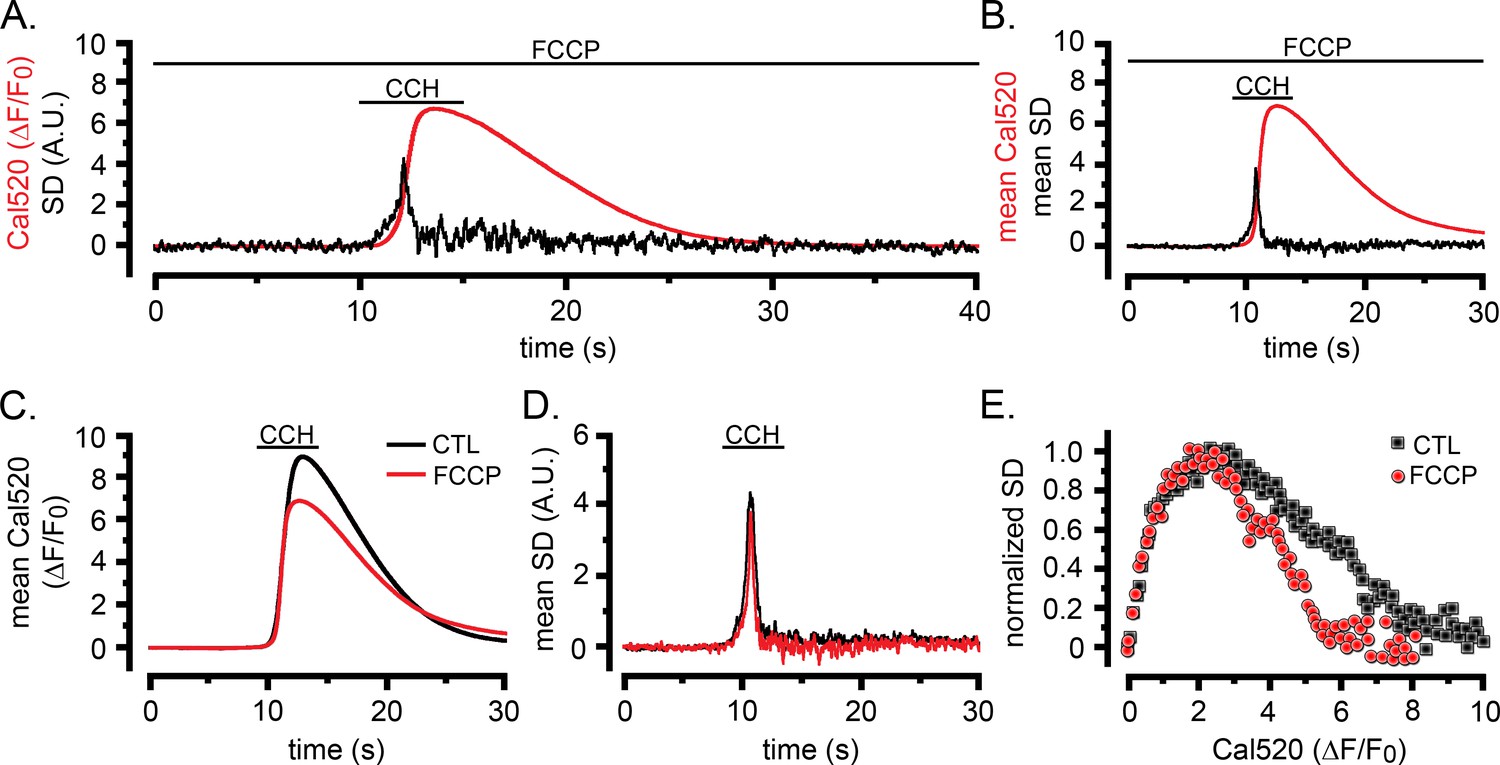
Patterns of Ca2+ liberation during global Ca2+ signals are substantially unaffected by depolarization of mitochondria and lysosomes with FCCP.
(A) Traces show global Ca2+ signal (red; ΔF/F0) and SD signal (black; arbitrary units) from a single HEK cell in response to local application of CCH from an extracellular pipette for the time indicated. The cell was continuously exposed to FCCP (10 µM) in zero Ca2+/EGTA medium beginning 10 min before applying CCH. (B) Mean ΔF/F0 and SD signals averaged from seven HEK cells in response to the same protocol as in A. (C) Overlay of mean fluorescence (ΔF/F0) responses to CCH in eight control cells in the absence of FCCP (black) and seven cells (red) in the presence of FCCP. (D) Corresponding overlay of SD signals from control and FCCP-treated cells. (E) Scatter plots of mean SD signal vs. magnitude of the global Ca2+ elevation (ΔF/F0) at intervals during the rising phase of response. Data are from eight control cells (black squares) and seven FCCP-treated cells (red circles), plotted after binning at intervals of 0.1 ΔF/F0 and normalizing to the same peak amplitude.
Figure 4
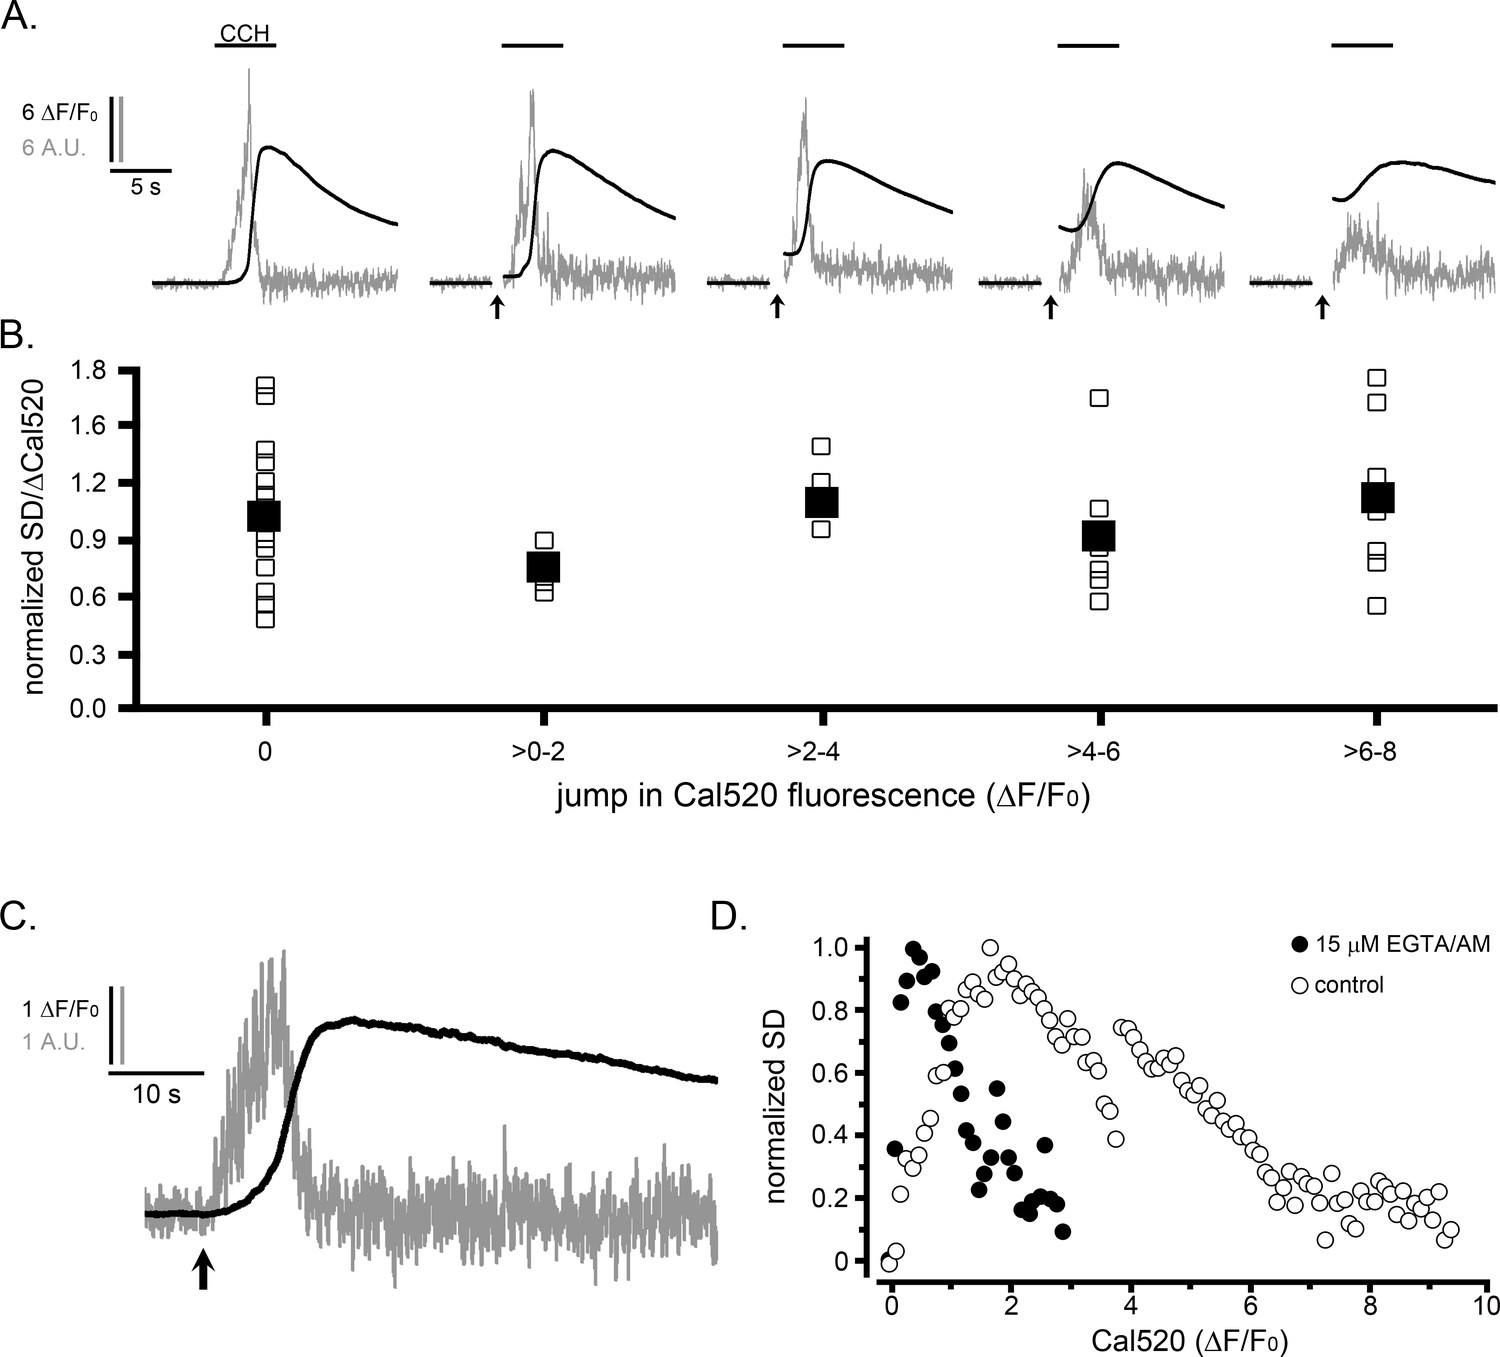
The suppression of Ca2+ puffs during global signals does not result because of elevated cytosolic [Ca2+].
(A,B) IP3-evoked Ca2+ puffs are not suppressed by prior photorelease of Ca2+. (A) Traces depict fluorescence ratios (black; ΔF/F0) from WT HEK cells and corresponding SD signals (grey; in arbitrary units, A.U.). Records, from left to right, show responses from individual cells loaded with NP-EGTA (caged Ca2+) that were unstimulated or exposed to increasing UV flash durations (marked by arrows) to photorelease progressively increasing amounts of free Ca2+ before challenging cells with CCH (100 µM) locally delivered by a puffer pipette when indicated by the bars. Traces are blanked out during the artifact caused by the photolysis flash. (B) Data points from traces like those in A show the integral under SD trace (a measure of puff activity) as a ratio of the change in global Ca2+ signal (ΔF/F0) evoked by CCH. The data are binned in terms of the jump in Cal520 fluorescence (ΔF/F0) evoked by photolysis of caged Ca2+. Open symbols are from individual cells, and filled symbols are means for each group (respective n numbers for different bins; 20, 4, 4, 6, 8). Data are normalized with respect to the mean ratio without prior photorelease of Ca2+. There was no significant difference between control CCH responses and CCH responses following Ca2+ jumps (evaluated by Student T-test; p values between 0.17 and 0.66 for the different binned groupings). (C,D) Termination of puff activity is unaffected when global cytosolic Ca2+ signals are attenuated by buffering with EGTA. (C) Traces showing the Cal520 fluorescence ratio (ΔF/F0; smooth trace) and SD signal (noisy trace) in response to photoreleased i-IP3 in a representative WT HEK cell that was incubated with 15 µM EGTA/AM to buffer cytosolic Ca2+ and attenuate the amplitude of the global Ca2+ signal. (D) Scatter plots show measurements of the SD signal at intervals during the rising phase of global Ca2+ responses against the magnitude of the global Ca2+ elevation (ΔF/F0) at that time. Measurements were binned at intervals of (0.1 ΔF/F0) and SD data are normalized to a peak value of 1. Solid circles show mean data from 14 EGTA-loaded cells. For comparison, open circles present data reproduced from Figure 3C showing measurements from 11 control cells that gave fast rising responses to photoreleased i-IP3.
Figure 5 with 1 supplement
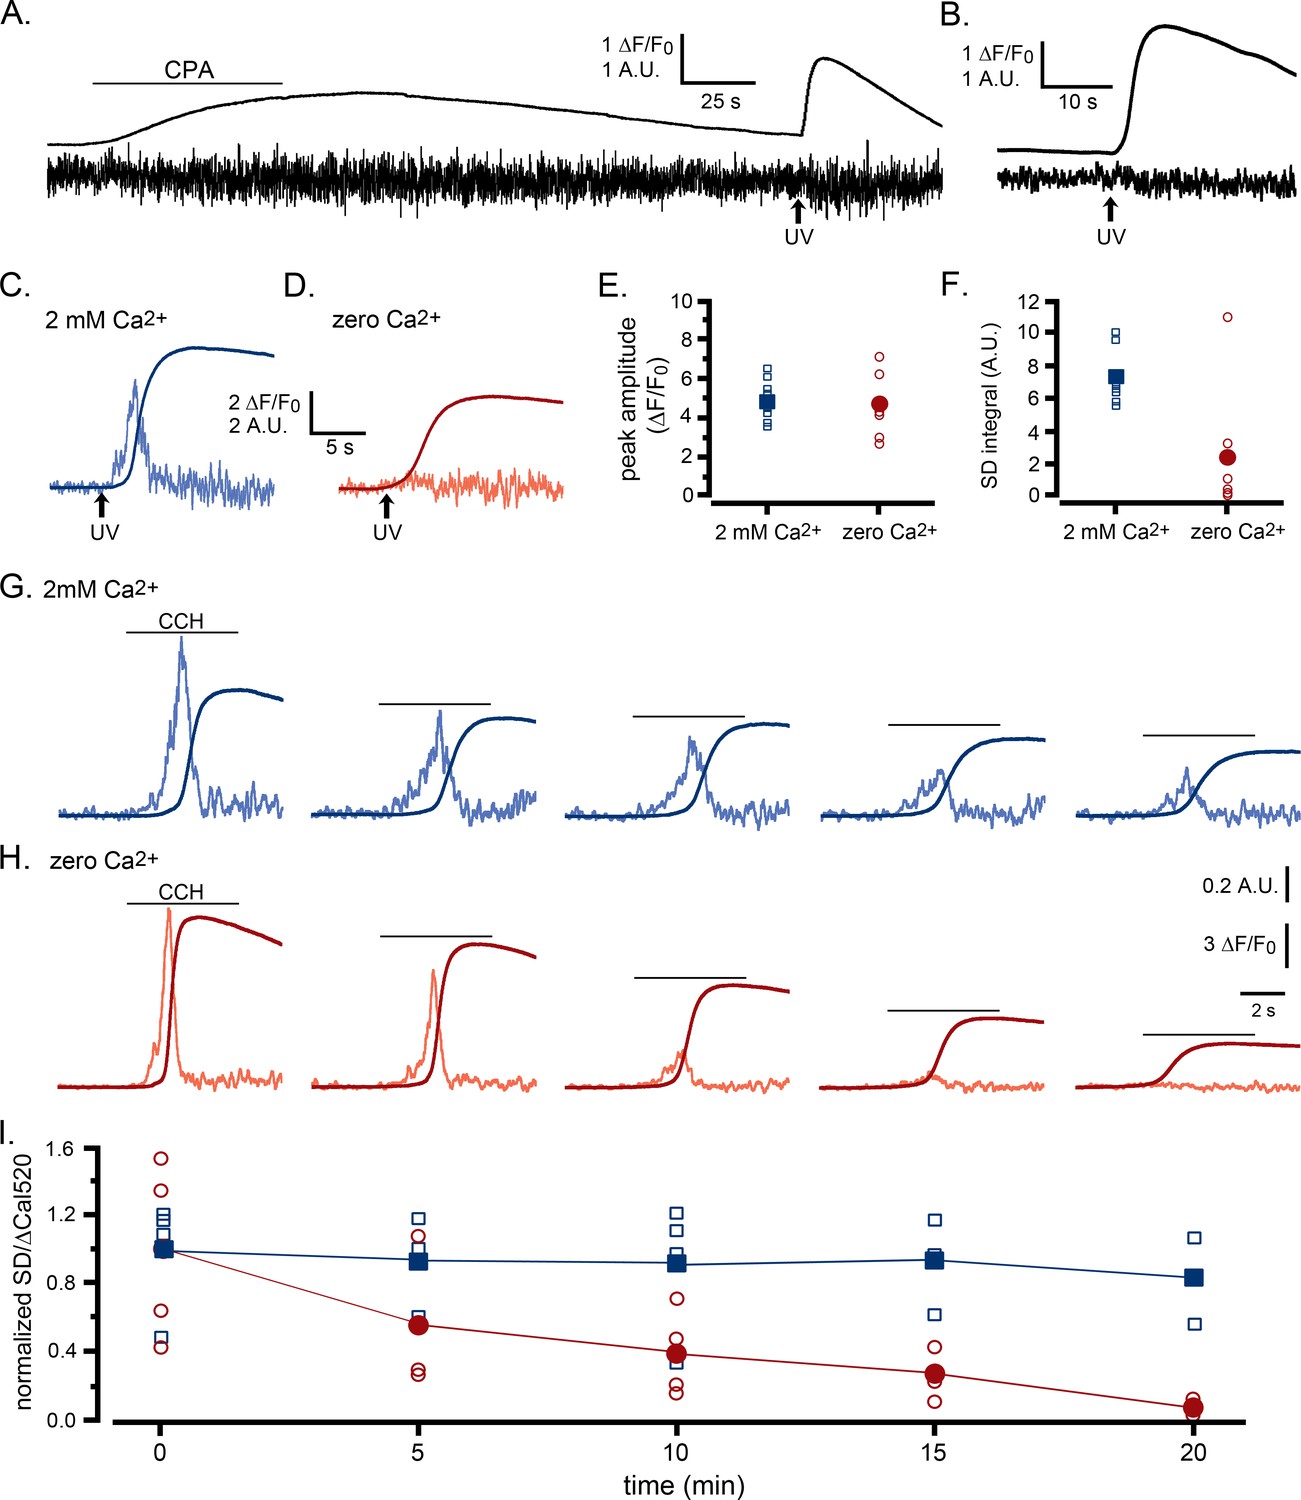
Ca2+ puffs are selectively depressed by reduced ER Ca2+ content.
(A–F) Selective depression of puffs during i-IP3-evoked global Ca2+ signals following depletion of ER Ca2+ content using transient application of cyclopiazonic acid (CPA; 50 µM) (A) The smooth trace shows fluorescence ratio (ΔF/F0) from a WT HEK cell, and the noisy trace the corresponding SD signal (in arbitrary units). The cell was bathed throughout in solution containing no added Ca2+ and 300 µM EGTA, and CPA was locally applied from a puffer pipette during the time indicated by the bar. A UV flash was delivered when marked by the arrow to photorelease caged i-IP3 loaded into the cell. (B) Mean ΔF/F0 and SD signals from seven WT HEK cells in response to photoreleased i-IP3 following CPA treatment and wash in Ca2+-free medium as in A. (C,D) Representative ΔF/F0 and SD responses to photoreleased i-IP3 in individual cells that were bathed, respectively, in Ca2+-containing or Ca2+-free medium for 30 min following treatment with CPA as in A. (E) Peak amplitudes of global fluorescence signals evoked by photoreleased i-IP3 in experiments like those in C,D, for cells bathed in Ca2+-containing (n = 8 cells; blue squares) or Ca2+-free medium (n = 6; red circles). Open symbols denote measurements from individual cells; filled symbols are means. No significant difference between peak amplitudes (ΔF/F0) of cells bathed in Ca2+-containing and Ca2+-free medium (Student T test; p=0.72). (F) Corresponding measurements of integral under SD traces (puff activity) during the time from the photolysis flash to the peak global fluorescence signal. SD integrals were significantly different between cells bathed in Ca2+-containing and Ca2+-free medium (Student T test; p=0.012). (G–I) Selective depression of puffs by depleting ER Ca2+ content by repeated applications of CCH in zero Ca2+ bathing solution. (G,H) Global Ca2+ signals (smooth traces; ΔF/F0) and SD signals (noisy traces) evoked by successive, identical applications of CCH at 5 min intervals in two representative cells bathed, respectively, in medium containing 2 mM Ca2+ or 300 µM EGTA with no added Ca2+. Amplitudes of the SD signals are depicted after normalizing to the peak amplitude of the first response for each cell. (I) Data points show the ratio of puff activity (integral under the SD trace) vs. peak magnitude of the global Ca2+ signal (ΔF/F0) for successive responses evoked by CCH application at 5 min intervals. Blue squares are data from cells bathed in medium containing 2 mM Ca2+ and red circles are from cells in Ca2+-free medium; open symbols are ratios from individual cells and filled symbols are means. Data are plotted after normalizing to the mean SD integral and peak ΔF/F0 evoked by the initial stimulus in each condition. Responses were significantly different between cells bathed in the presence and absence of external Ca2+ for times ≥ 10 min (Student T test; p=0.000008).
Figure 5—video 1
Partial depletion of ER Ca2+ selectively inhibits Ca2+ puff activity.
Movies show Ca2+ images from the same WT HEK cells as in Figure 5C,D, processed as described in the main text. Cells were transiently treated with CPA to inhibit SERCA and then bathed for 30 min in either a solution containing 2 mM Ca2+ (upper movies) or a Ca2+ free solution (lower movies). Movies show Ca2+ fluorescence ratio (ΔF/F0; left) and SD fluctuations (A.U., right) during i-IP3 evoked Ca2+ signals in cells with replete (upper) or partially depleted (lower) ER Ca2+ stores. Colored outlines mark the TIRF footprints of the cells; the scale bar is 10 µm. Traces to the right plot Cal520 fluorescence ratio (cyan) and SD signals (yellow) in synchrony with their corresponding movies.
Figure 6 with 1 supplement
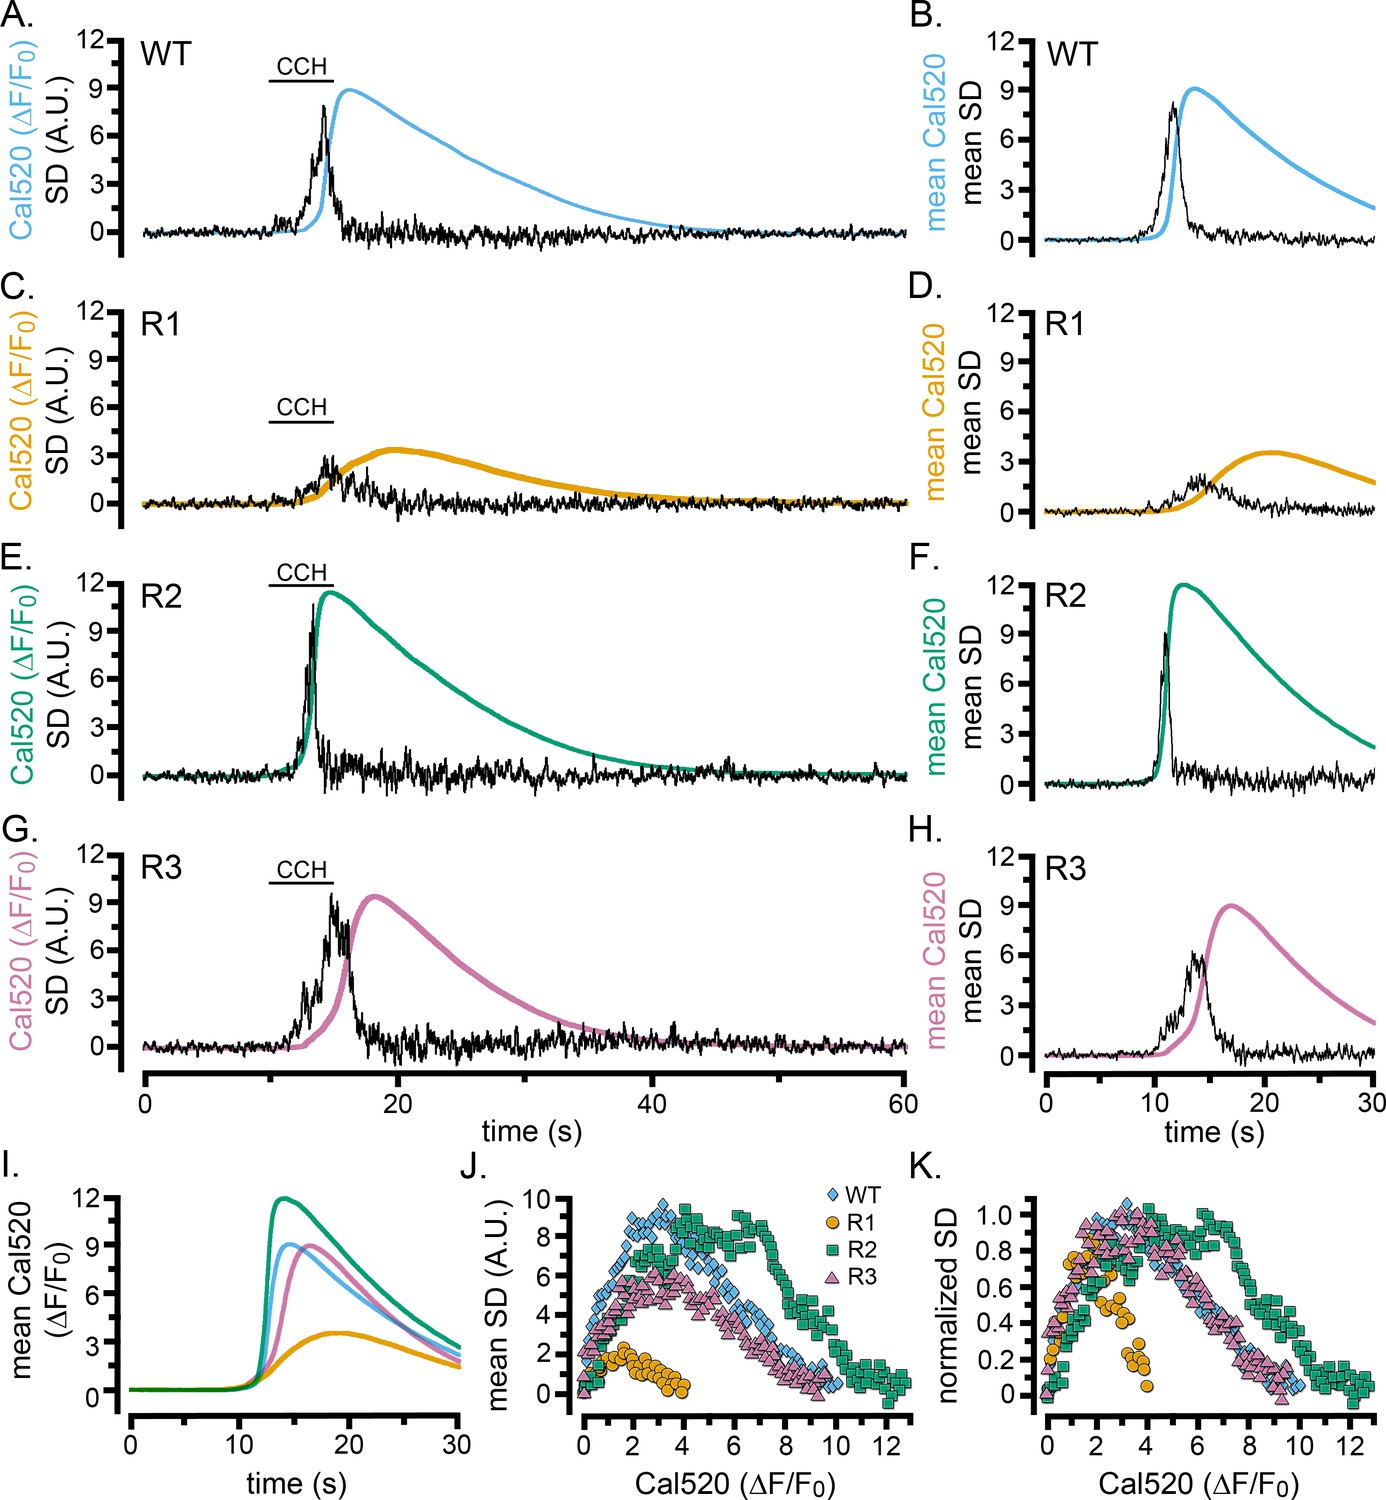
Cell-wide Ca2+ elevations and SD fluctuations in WT HEK cells and cells exclusively expressing single IP3R isoforms.
(A–H) Traces show whole-cell Cal520 fluorescence ratio (smooth colored traces; ΔF/F0) and SD fluctuations (noisy black traces) of HEK cells locally stimulated with CCH locally delivered in a Ca2+-containing bath solution when indicated by the bars. Panels on the left are representative records from individual cells, and panels on the right show mean traces from 7 (B) or 3 (D,F,H) cells. (A, B) Records from HEK WT cells. (C–H) Records from HEK cells solely expressing IP3R1 (C,D), IP3R2 (E,F), or IP3R3 (G,H). (I) Overlaid mean Cal520 fluorescence ratio traces, aligned to their rising phase, in WT HEK cells (cyan; n = 7), and HEK cells solely expressing IP3R1 (gold; n = 3), IP3R2 (green; n = 3), and IP3R3 (pink; n = 3). (J) Scatter plots of SD signal vs. fluorescence ratio during the rising phase of the Ca2+ responses in WT HEK cells (cyan diamonds) and HEK cells solely expressing IP3R1 (gold circles) IP3R2 (green squares) or IP3R3 (pink triangles). Data points are means from the same cells as in I. (K) The same data as in J, after normalizing to the same peak SD values.
Figure 6—figure supplement 1
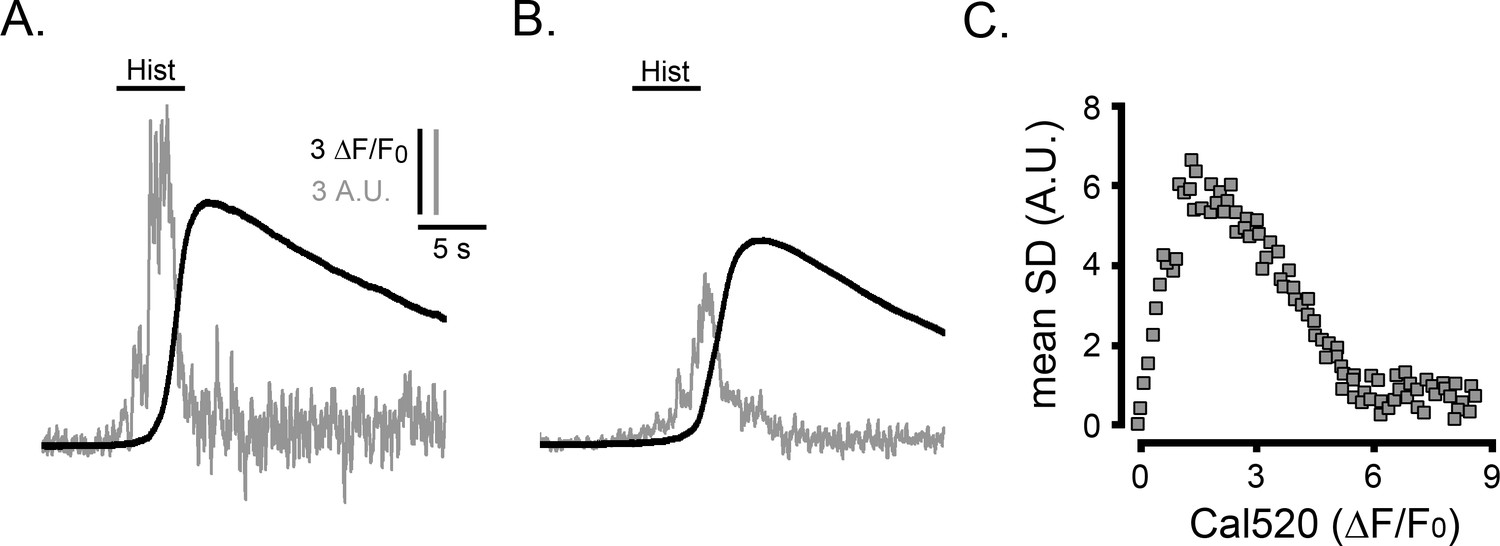
Ca2+ fluctuations during global Ca2+ signals in HeLa cells.
(A) Traces plot whole-cell Cal520 fluorescence (ΔF/F0; black) and SD fluctuations (gray; arbitrary units, A.U.) recorded in a HeLa cell bathed in medium containing 2 mM Ca2+ in response to local delivery of histamine (Hist; 100 µM) from a micropipette positioned above the cell. Scale bars apply to A and B. (B) Mean ΔF/F0 and SD signals averaged from five HeLa cells in response to the same protocol as in A. (C) Scatter plot of mean SD signal at intervals during the rising phase of the response vs. the global Ca2+ elevation (ΔF/F0) at that time. Data are binned at 0.1 (ΔF/F0) intervals (n = 5 cells).
Figure 7

Lightsheet imaging of global Ca2+ elevations evoked in HEK cells by photoreleased i-IP3.
(A) Upper panels show 45o diagonal image ‘slices’ through the center of a WT HEK cell imaged by lattice light-sheet microscopy. Grey scale intensities correspond to increases in fluorescence (ΔF) of Cal520 relative to the mean intensity (F0) averaged over 100 frames before stimulation (ΔF/F0). Each panel is a single 10 ms exposure, captured at times before and after stimulation, as indicated by the Roman numerals in C. The cell outline is marked in yellow. Lower panels show corresponding SD images, at times corresponding to the upper panels. Colored outlines mark ROIs used to derive ΔF/F0 and SD traces from peripheral (red) and center (blue) regions of the cell. (B) Corresponding ΔF/F0 and SD lightsheet images from a different HEK cell that showed more prominent puff activity in the center of the cell. (C) Measurements of ΔF/F0 (smooth traces) and SD (noisy traces) from the cell illustrated in A. Traces in red show average measurements from the peripheral region of interest marked in the bottom left panel of A, and traces in blue show measurements from the central region of interest. (D) Corresponding measurements of ΔF/F0 and SD from the cell illustrated in B. (E) Scatter plot of SD signal versus Ca2+ fluorescence (ΔF/F0) at intervals during the rising phase of global Ca2+ signals. Data are from eight cells, with measurements binned at intervals of 0.1 ΔF/F0.
Figure 8 with 1 supplement
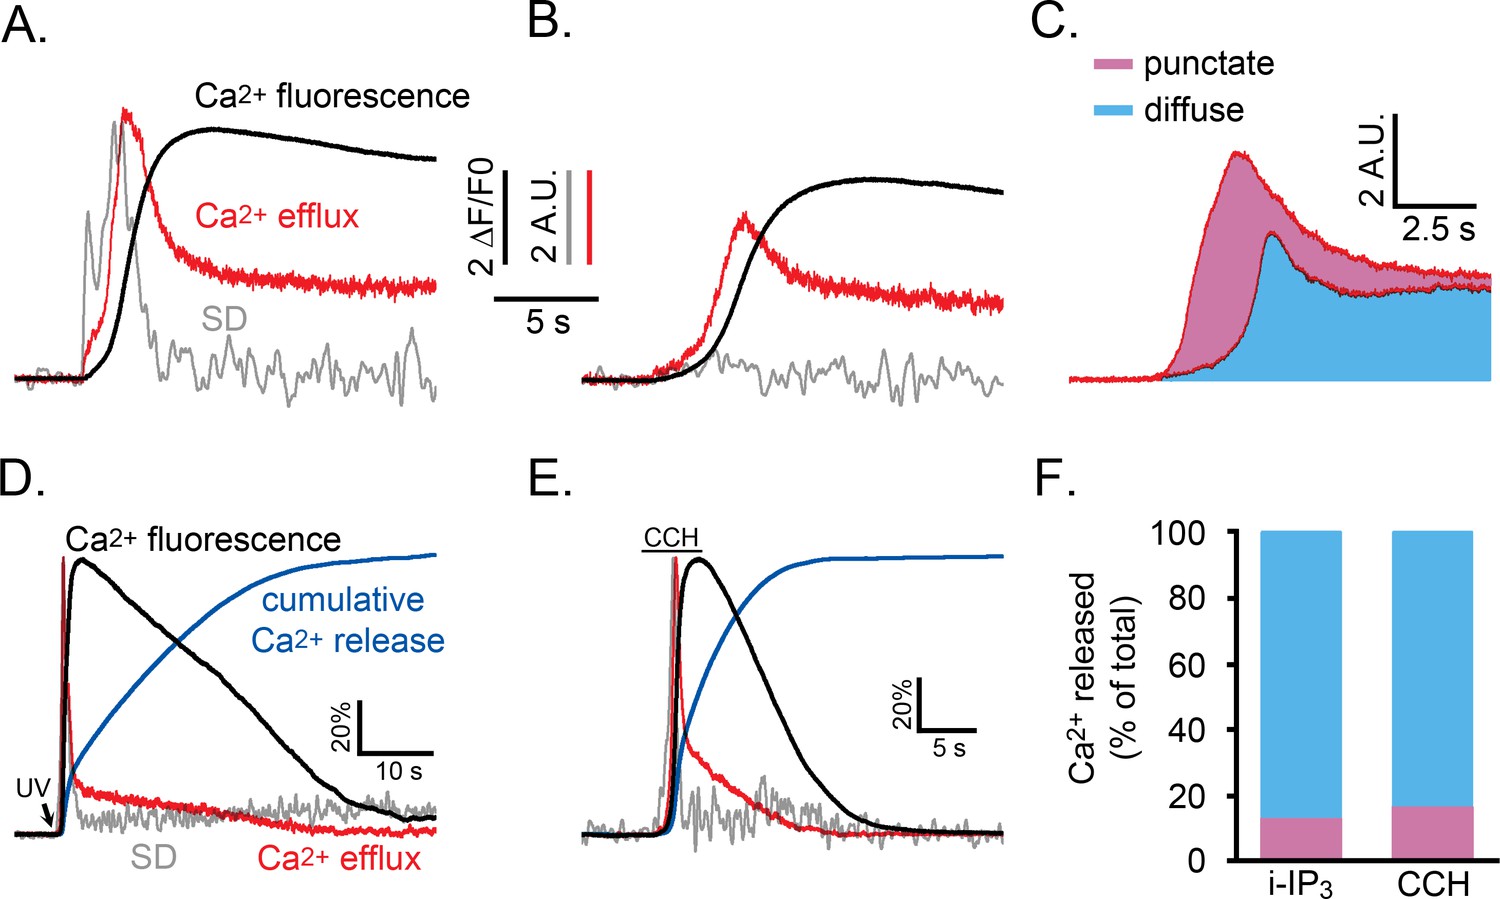
Relative proportions of Ca2+ released by punctate versus diffuse modes of Ca2+ liberation during an IP3-evoked global Ca2+ signal.
(A,B) Whole cell Ca2+ fluorescence responses (black traces) and associated SD signals (grey traces) during the initial phase of a Ca2+ response evoked by photoreleased i-IP3 in representative WT HEK cells. The red traces show the estimated rate of Ca2+ efflux, derived as described in the text. Both panels show responses from cells pretreated with CPA as in Figure 5A that were treated identically, except that the cell in A was incubated in Ca2+-containing medium to allow refilling of ER Ca2+, whereas the cell in B was incubated in Ca2+-free medium to maintain the ER Ca2+ in a partially depleted state and suppress puff activity. The SD and Ca2+ efflux traces in A are scaled to similar peak height for clarity; traces in B are scaled the same as in A. (C) Mean Ca2+ efflux traces from five cells in Ca2+-containing medium that showed robust puff activity (top) and six cells in Ca2+-free medium where puff activity was almost absent (lower). The area shaded blue reflects the relative amount of Ca2+ released when puff activity was absent, and the pink area reflects the additional amount of Ca2+ release attributable to Ca2+ puffs. (D,E) Traces show SD signal (grey), global Ca2+ fluorescence ratio (black) and calculated Ca2+ efflux rate (red) for the entire duration of responses evoked by photoreleased i-IP3 (D) and by CCH (E). Blue traces additionally show the cumulative percentage of Ca2+ released, derived by integrating under the red Ca2+ efflux traces. For clarity of presentation all traces are shown scaled to the same peak height. (F) Bars show mean percentages of total Ca2+ release during i-IP3-evoked (left; n = 8 cells) and CCH-evoked signals (right; n = 7 cells) under control conditions attributable to punctate (pink) and diffuse (blue) modes of Ca2+ liberation. Data were calculated from the cumulative Ca2+ release at the time puff activity had ceased in each cell, assuming 41% of that release was due to punctate release.
Figure 8—figure supplement 1
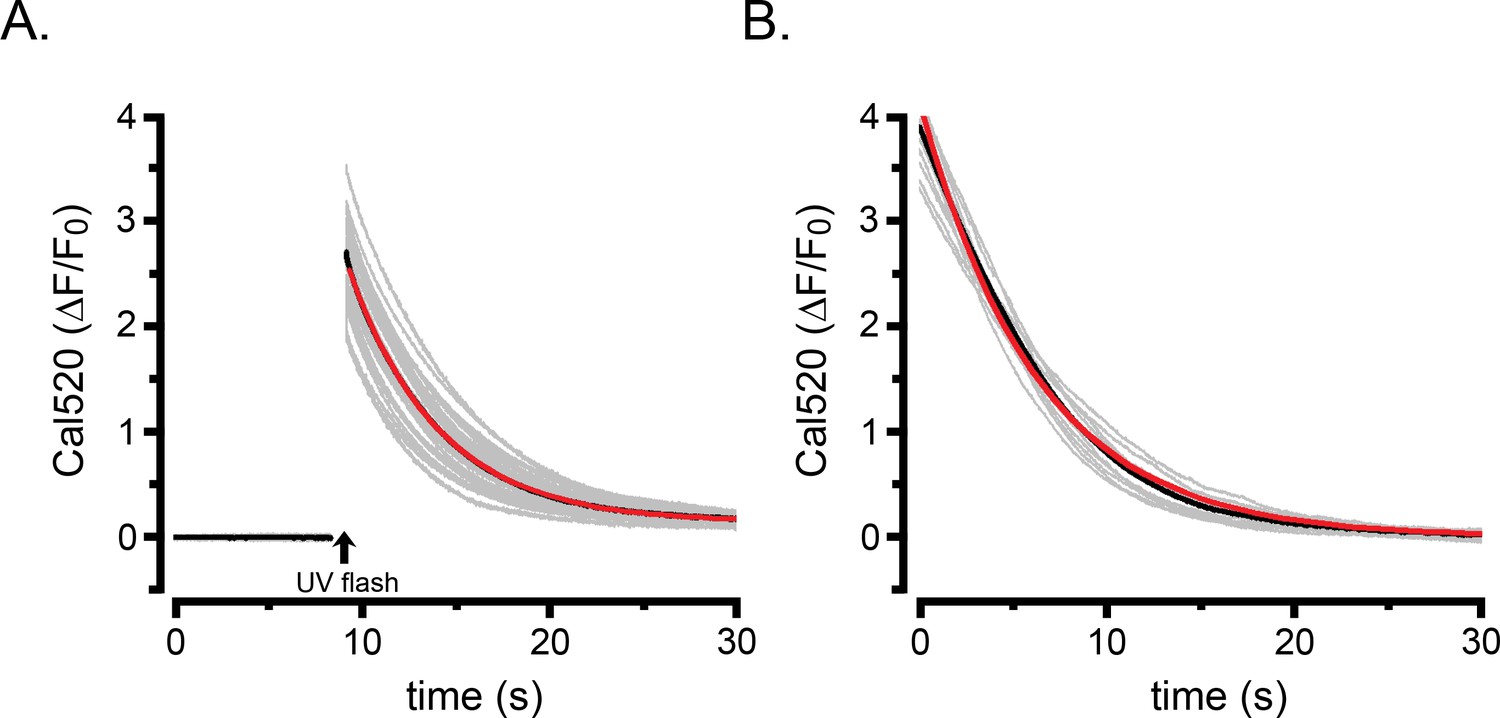
Protocols to estimate the rate of Ca2+ clearance from the cytosol.
(A) Superimposed gray traces show the decay phase of cytosolic Cal520 Ca2+ signals (ΔF/F0) evoked by cell-wide photolysis of caged Ca2+ loaded into WT HEK cells (n = 72). The flash artifact is blanked out. The black trace shows the mean and is largely obscured by the red trace showing a single exponential fit to the mean with a rate constant of 0.22 s−1. (B) Superimposed grey traces show the decline in cytosolic Cal520 Ca2+ signals in 11 WT HEK cells during the final ‘tail’ of responses evoked by transient application of CCH as in Figure 2F,I. The black trace shows the mean and is largely obscured by the red trace showing a single exponential fit to the mean with a rate constant of 0.32 s−1.
Author response image 1
Additional files
-
Supplementary file 1
Ca2+ Image Processing Routines.
- https://cdn.elifesciences.org/articles/55008/elife-55008-supp1-v2.docx
-
Transparent reporting form
- https://cdn.elifesciences.org/articles/55008/elife-55008-transrepform-v2.docx
Download links
A two-part list of links to download the article, or parts of the article, in various formats.
Downloads (link to download the article as PDF)
Open citations (links to open the citations from this article in various online reference manager services)
Cite this article (links to download the citations from this article in formats compatible with various reference manager tools)
IP3 mediated global Ca2+ signals arise through two temporally and spatially distinct modes of Ca2+ release
eLife 9:e55008.
https://doi.org/10.7554/eLife.55008


