Limited dishevelled/Axin oligomerization determines efficiency of Wnt/β-catenin signal transduction
- Department of Structural Biology and Stanford University School of Medicine, United States
- Department of Molecular and Cellular Physiology, Stanford University School of Medicine, United States
- Department of Chemical Engineering, Stanford University, United States
- Graduate Program in Biophysics, Stanford University, United States
- MRC Laboratory of Molecular Biology, Cambridge Biomedical Campus, United Kingdom
Figures
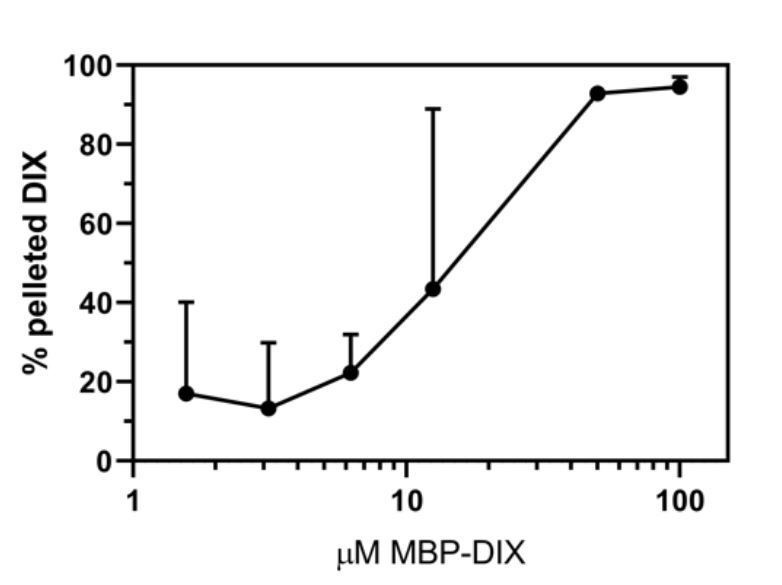
Figure 1
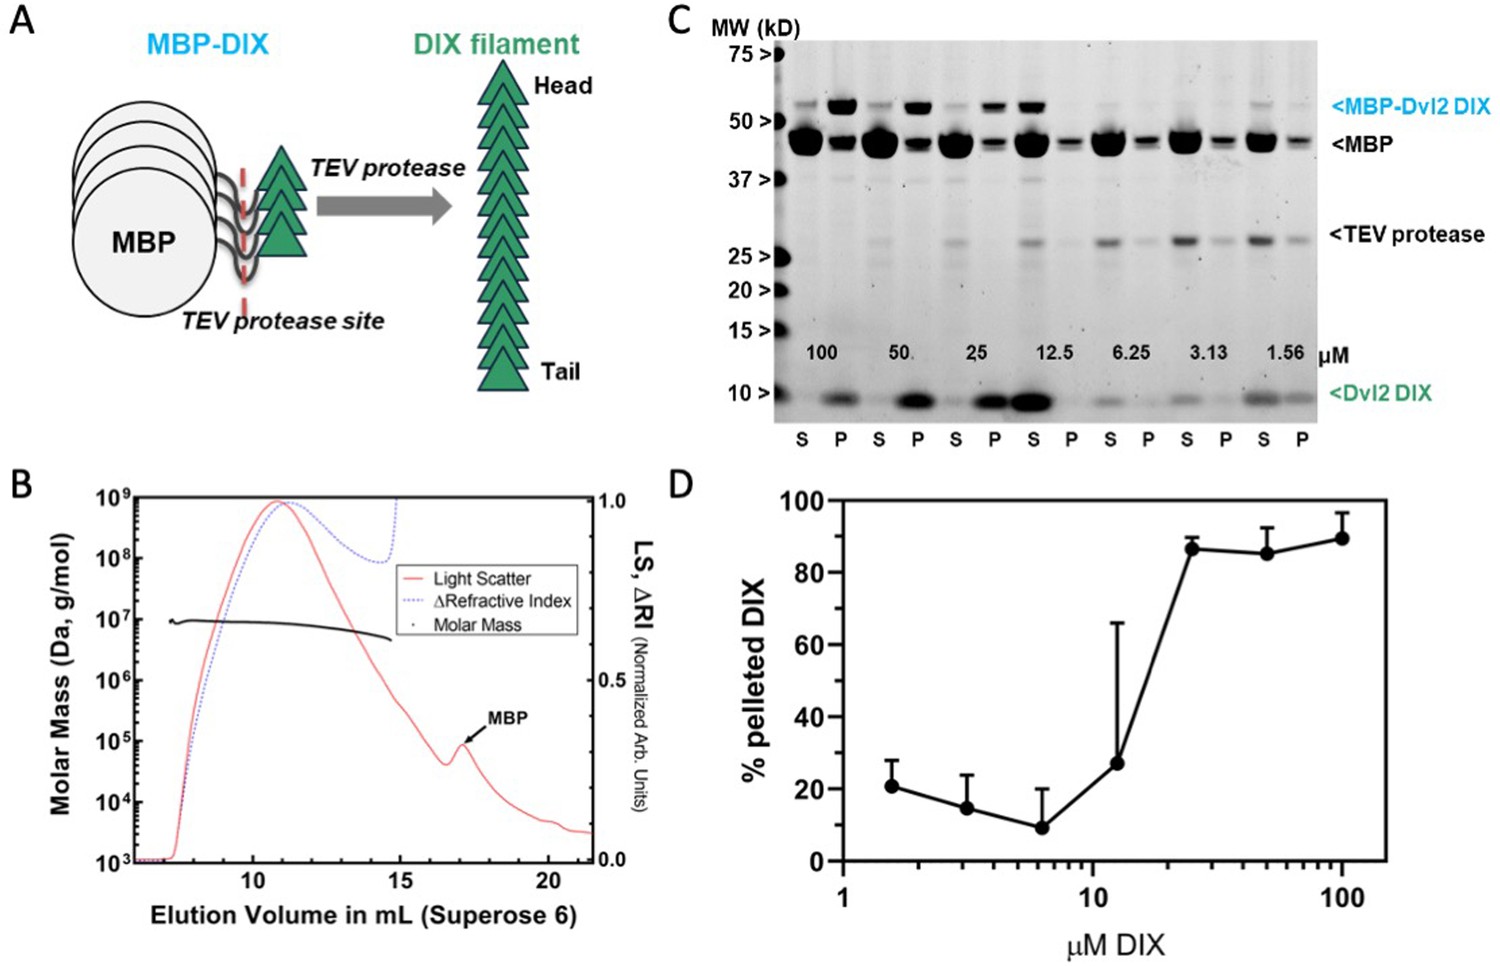
Preparation and characterization of Dvl2 DIX filaments.
(A) Dvl2 DIX filaments were produced by cleavage of the MBP tag with TEV protease. The fusion protein is 52 kDa (MBP is 42 kDa, and the Dvl2 DIX domain is 10 kDa). (B) Molecular mass of Dvl2 DIX filaments measured by Multi-Angle Light Scattering coupled to size-exclusion chromatography (SEC-MALS). Dvl2 DIX at ~200 μM produced as in (A) was run on a Superose 6 10/300 column in line with MALS and refractive index (RI) detectors. The molar mass (left Y-axis) of Dvl2 DIX filaments was calculated over a range of elution volumes (X-axis), with the average mass ranging from 9.5 MDa for the earliest-eluting species to 4.9 MDa for the latest-eluting species. Residual MBP elutes after DIX filaments. The LS:dRI ratio for DIX filaments is large relative to that of MBP, so the LS and dRI signals have been normalized to show the near congruity of LS and dRI traces for DIX filaments. (C) Concentration dependence of Dvl2 DIX filament formation measured by sedimentation. A representative experiment is shown. MBP-Dvl2 DIX at the indicated concentrations was digested with TEV protease, centrifuged, and the supernatant (S) and pellet (P) fractions run on SDS-PAGE. The five highest concentration samples were diluted prior to loading to prevent overloading; since the TEV concentration is constant in each sample, this dilution makes the TEV band intensity different in these lanes. (D) Data from six replicates of the experiment shown in (C) were quantified and plotted as shown.
Figure 2 with 1 supplement
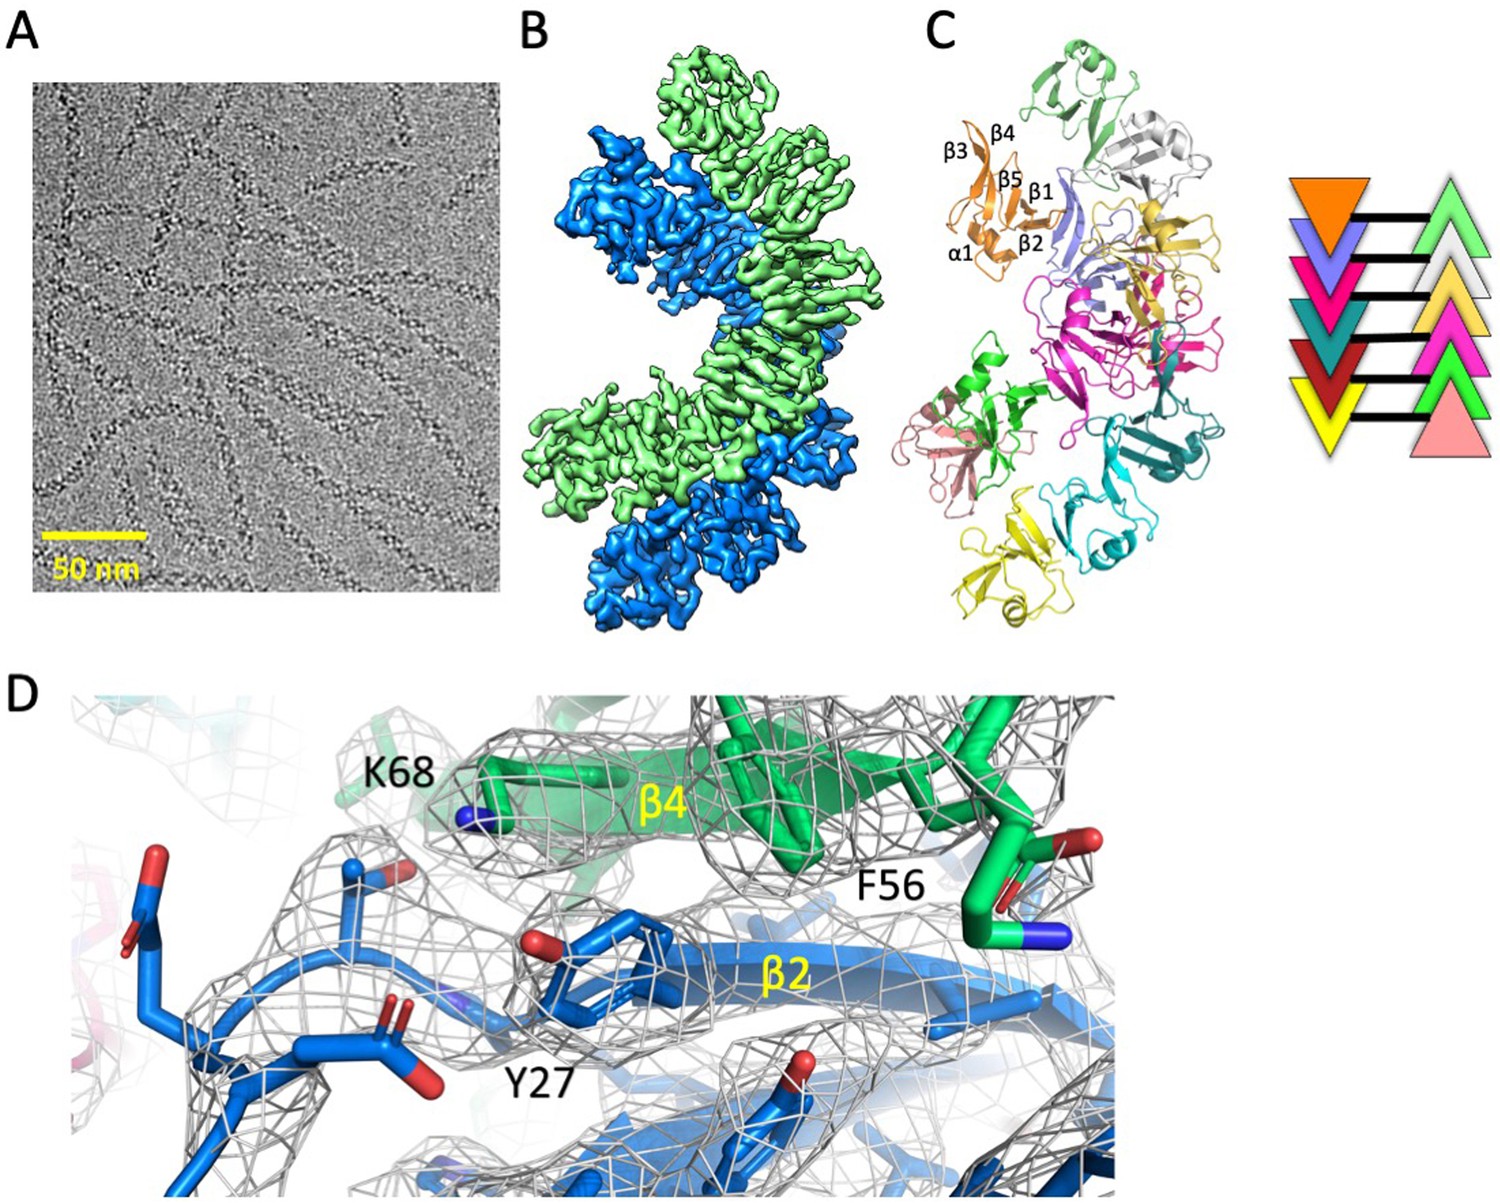
Cryo-EM structure of Dvl2 DIX filaments reveals anti-parallel double helices stabilized by intra- strand (head-tail) and inter-strand contacts.
(A) Cryo-EM image of purified Dvl2 DIX filaments. (B) Final sharpened cryo-EM map with helical symmetry imposed, with the two antiparallel strands shown in green and blue contours. (C) Final model of the Dvl2 DIX anti-parallel double helix, containing 12 subunits. The secondary structure elements are marked in the upper brown copy. The schematic diagram on the right shows the antiparallel structure, with each subunit represented as a triangle colored as in (B). (D) A portion of the final cryo-EM map (wire frame) and model showing a head-to-tail interface involving Y27 (head) packing against F56 and K68 (tail).
Figure 2—figure supplement 1
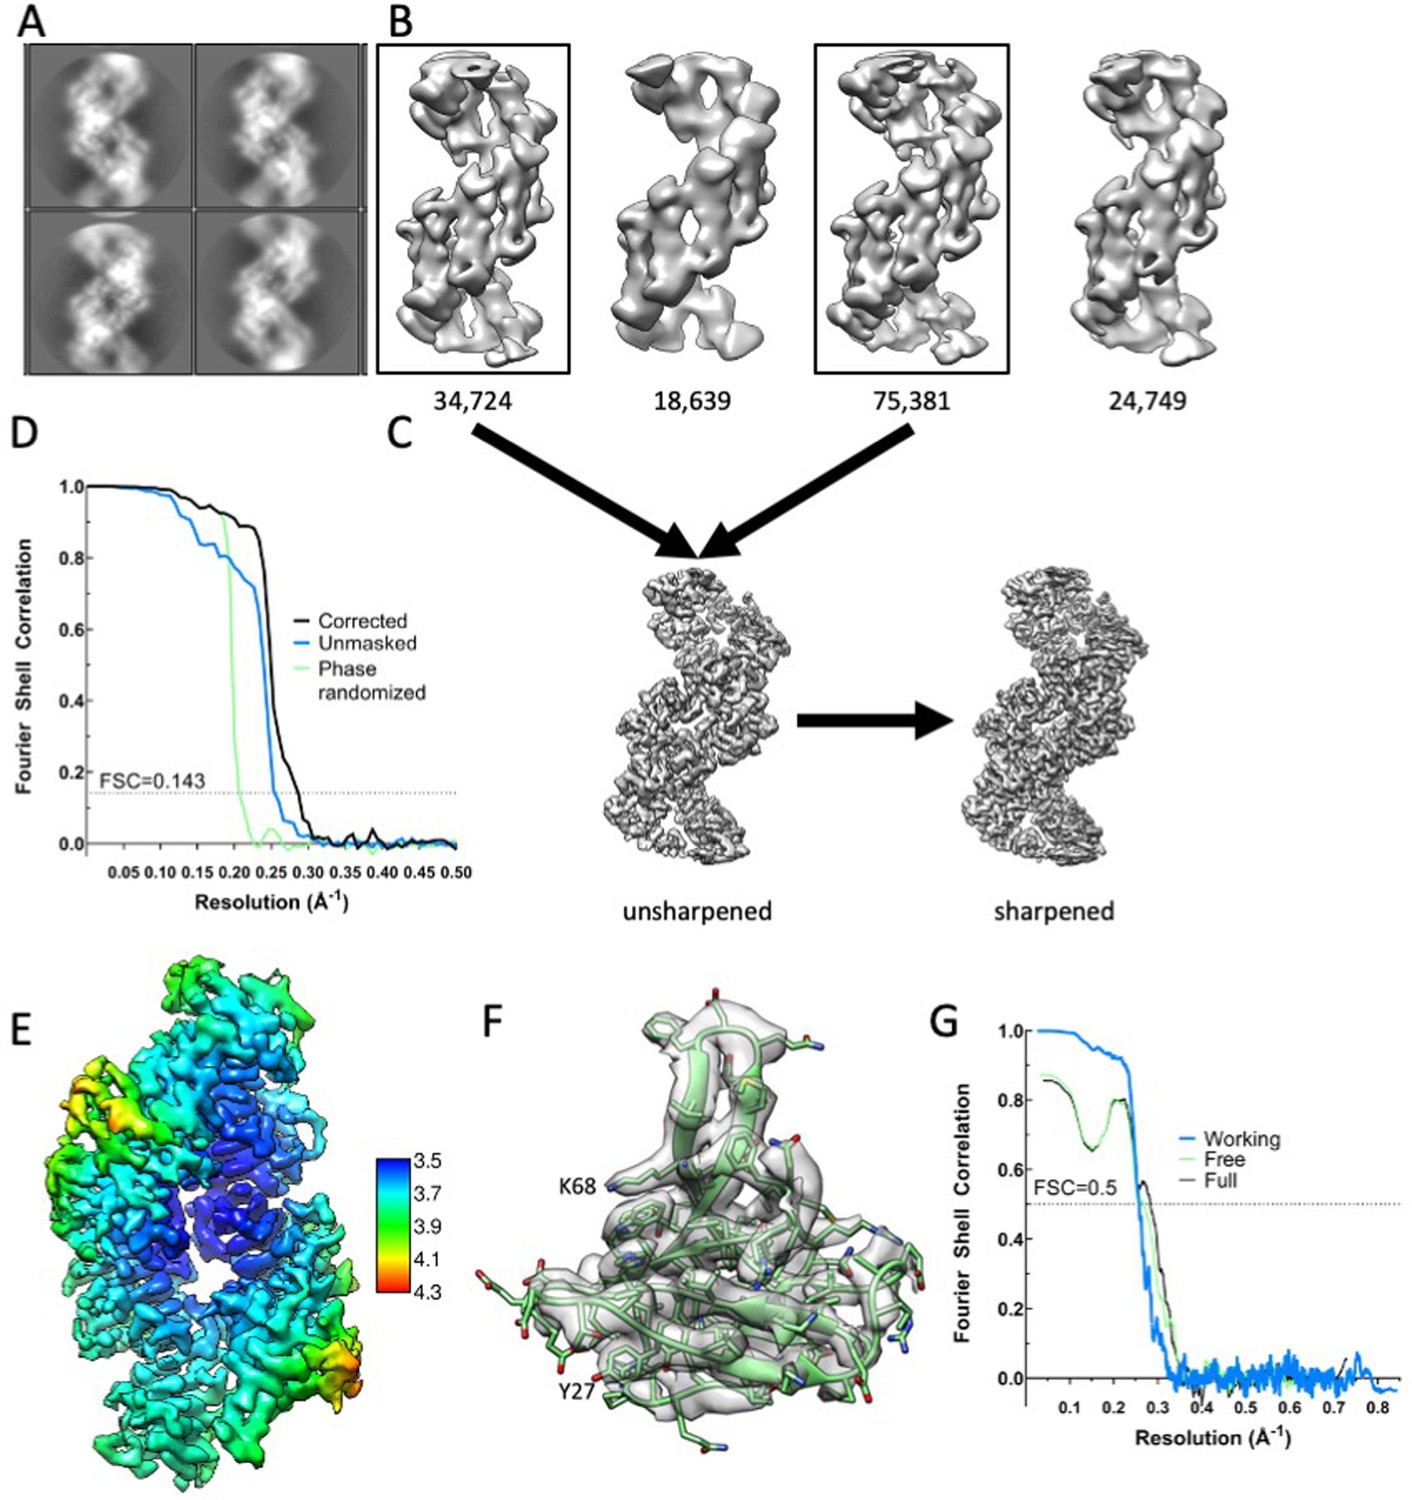
Cryo-EM analysis of Dvl2 DIX filaments.
(A) Representative 2D class averages of sections of filaments in a 150 Å by 150 Å box. (B) 3D classes. Particles belonging to the boxed 3D classes were used for the final reconstruction. (C) Unsharpened and sharpened maps. (D) Fourier Shell correlation coefficient as a function of resolution. The resolution is indicated at FSC = 0.143. (E) Local resolution estimation displayed on the sharpened map. (F) A representative subunit in map density, contoured at 2.7σ. (G) Map-to-model Fourier Shell correlation coefficients as a function of resolution. The resolution is indicated at FSC = 0.5.
Figure 3 with 2 supplements
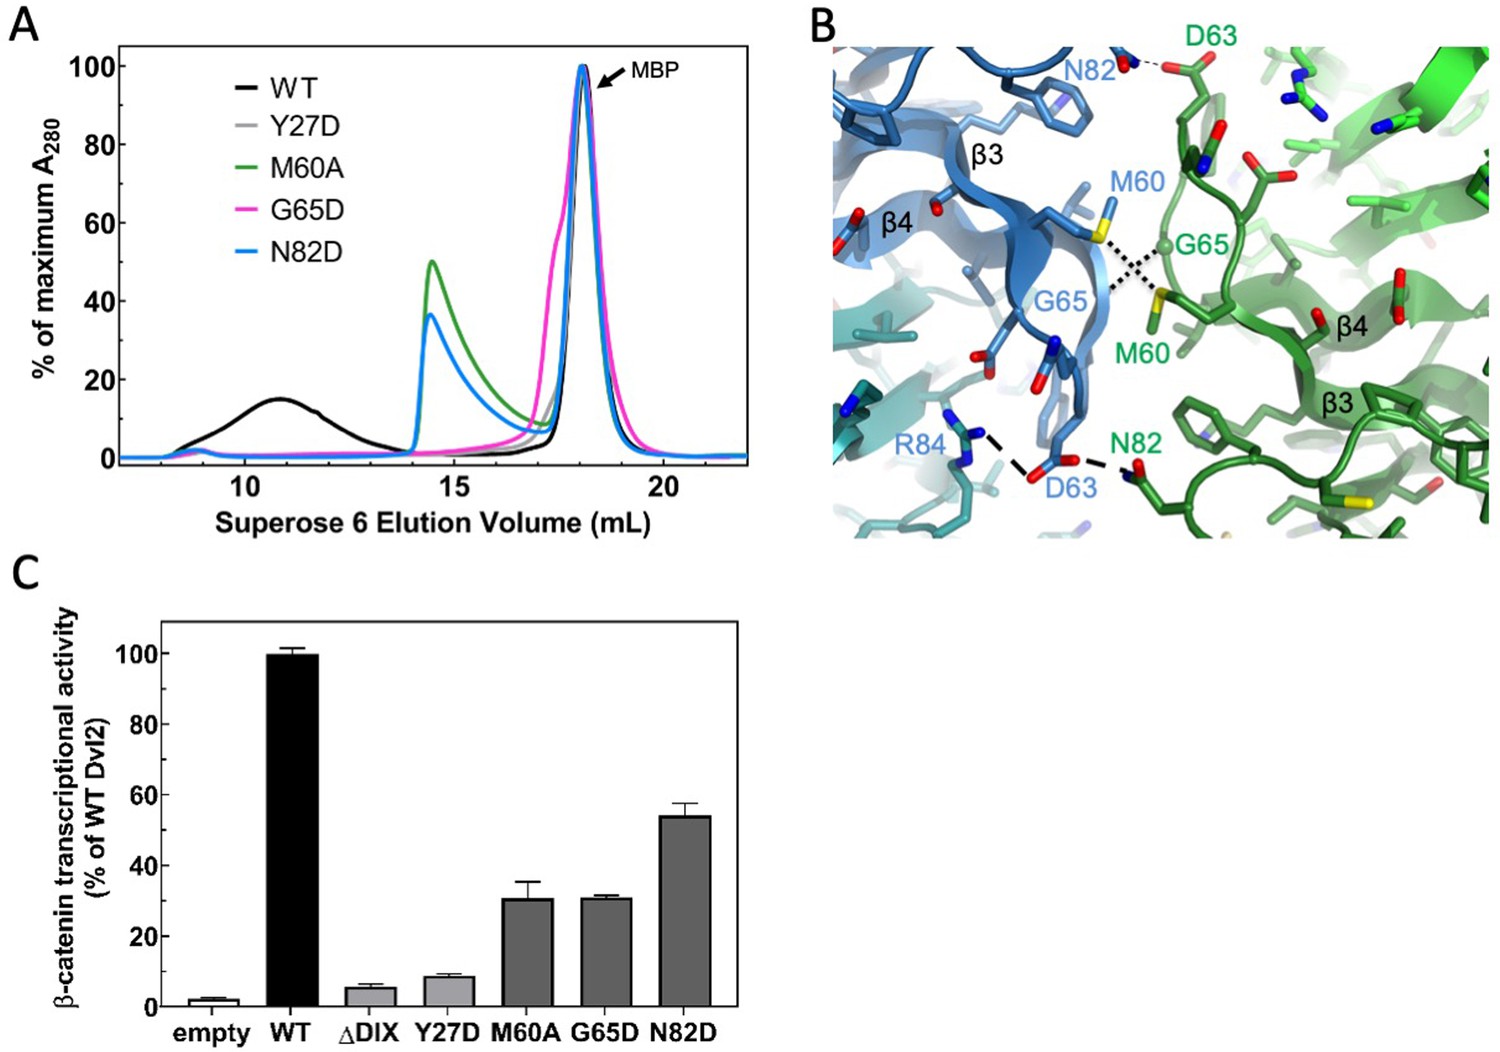
Point mutations disrupt double stranded filament formation and Dvl signaling.
(A) Comparison of TEV-cleaved Dvl2 DIX variants run on a Superose 6 size-exclusion column. Proteins were injected at 180 μM, and diluted to approximately 15 μM on the column. WT Dvl2 DIX elutes early in a broad peak, whereas point mutants that interfere with filament contacts exhibit varying degrees of oligomerization, manifesting as later elution volumes (smaller sizes). The MBP tag (42 kDa; elution volume = 18 mL) represents the largest peak by A280. The separation of the Y27D and G65D from the MBP can be seen on a Superdex 75 column, shown in Figure 3—figure supplement 1. (B) Inter-strand contacts within Dvl2 double helix. (C) Mutations of individual residues at intra- (Y27D) and inter- (M60A, G65D, N82D) strand interfaces cause defects in Wnt-dependent β-catenin signaling. Dvl2 constructs are expressed at near endogenous levels in Dvl Triple Knockout (TKO) cell line (see Figure 3—figure supplement 2 for more details). A construct with the Dvl2 DIX domain deleted (ΔDIX) is also shown.
Figure 3—figure supplement 1
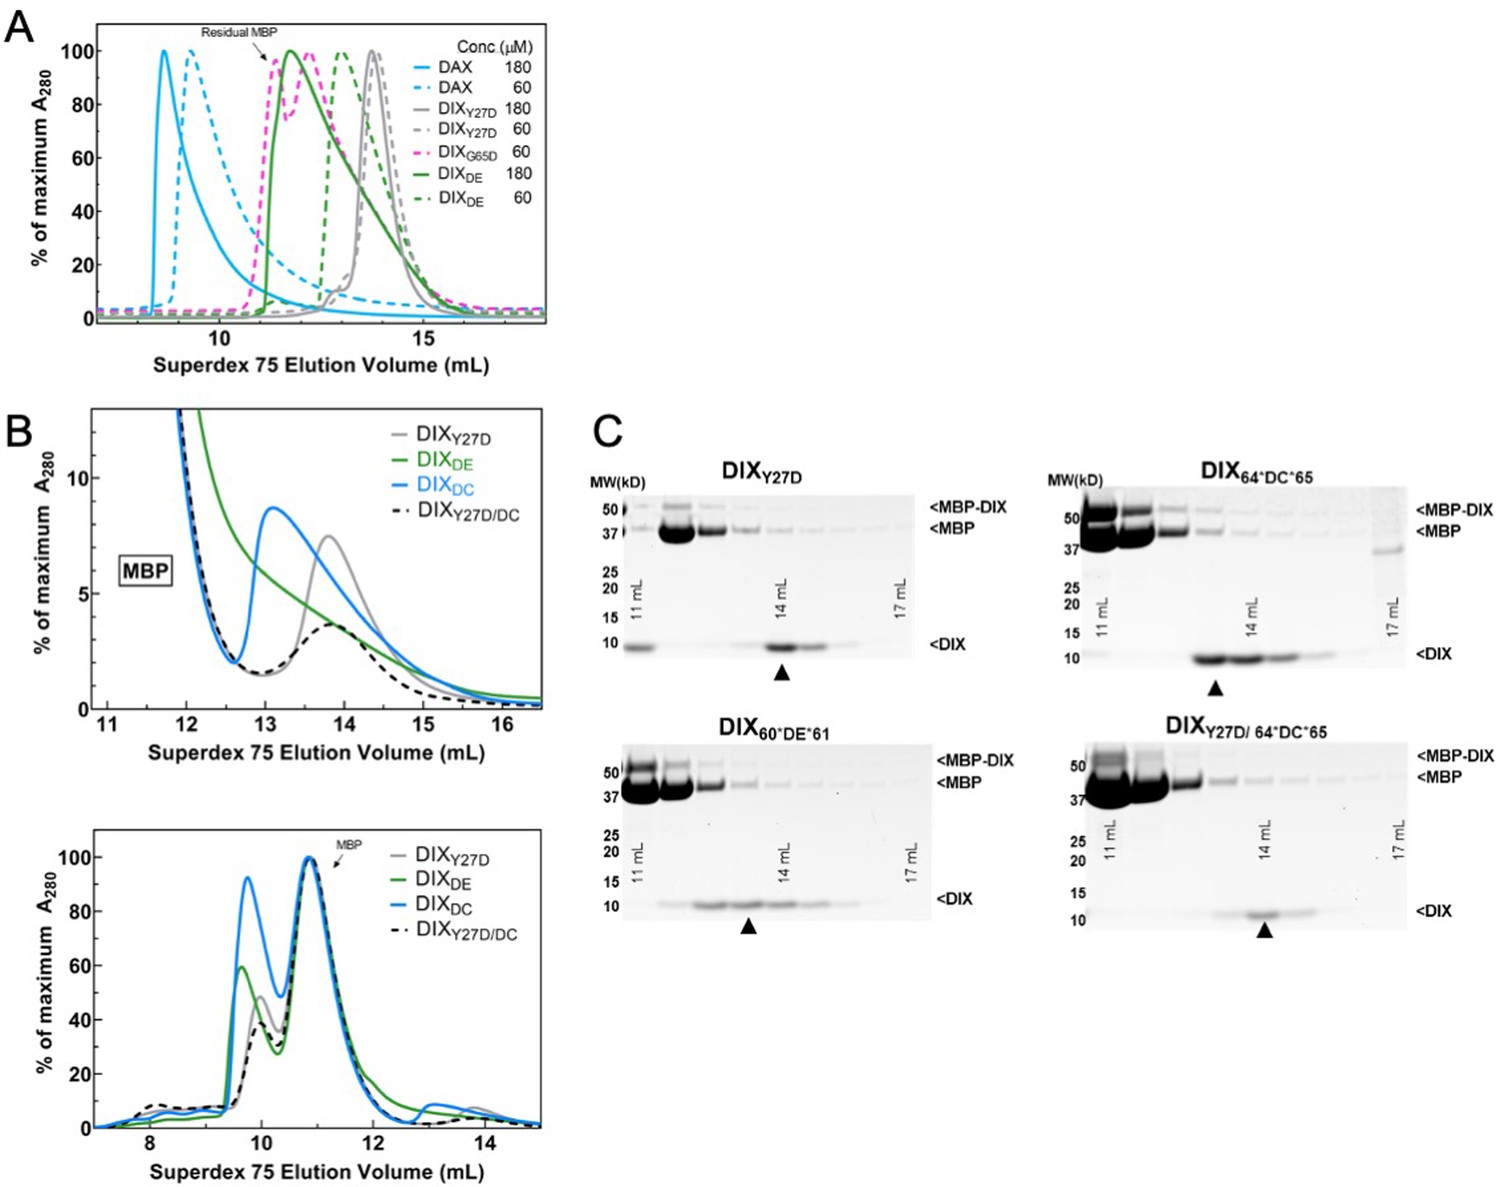
Purification of WT DAX and size-exclusion chromatography (SEC) of DIX oligomerization mutants.
(A) SEC profiles of purified Axin1 DAX and Dvl2 DIX mutants Y27D, G65D, and DIXDE on a Superdex 75 column 10/300. Proteins were injected at 60 μM (dashed lines) or 180 μM (solid lines) and were diluted to 5 or 15 μM on the column. G65D was run only at 60 μM and contained considerable MBP contamination from the previous purification step. Note that both Axin1 DAX and the inter-strand interface mutant DIXDE (60*DE*61) exhibit a concentration-dependent increase in size, in contrast to intra-strand interface mutant DIX Y27D, consistent with the ability to form head-to-tail contacts. (B) Comparison of SEC profiles of Dvl2 DIX mutants that were designed to disrupt intra-strand head-tail interactions (DIXY27D) and inter-strand interface interactions (DIXDE = 60*DE*61, DIXDC = 64*DC*65). Unlike in (A), protein constructs here were directly injected onto S75 column as crude TEV protease digests. Due to incomplete TEV digestion and the fact that MBP (peak elution volume at ~11 mL) has a much larger absorbance than DIX, the top panel was re-plotted at the bottom to focus on later elution volumes (which correspond to smaller oligomer sizes) where DIX proteins are found. (C) Gel fractions from each run covering the DIX peak (with ‘▲” marking the center of the peak). Both the DE and DC insertion mutants of Dvl2 DIX (DE, DC) elute earlier than Dvl2 DIXY27D.
Figure 3—figure supplement 2
Expression levels of Dvl2 mutants in HEK293T Dvl TKO cells.
To measure the relative expression of Dvl2 constructs, whole cell lysates of Dvl TKO cells transfected with the indicated Dvl2 construct were analyzed by SDS-PAGE and imaged as anti-Dvl2 immunoblots. Expression levels from each transient transfection were closely matched to endogenous levels (marked as End. Dvl2). The average relative expression level of each mutant relative to WT Dvl2, as quantified using a Li-COR Odyssey 3.0 scanner, is indicated below its label. For clarity, unrelated lanes from a single gel blot were excised from the image, denoted by a slight gap. Different blots are separated by large gaps in the figure. Dvl2 constructs are abbreviated as follows: DE = 60*DE*61, DC = 64*DC*65, EE >KK = E22K/E24K, EE >QQ = E22Q/E22Q, NG = E815N/E816G, NQ/NG = D793N/E794Q/E815N/E816G, T2SAM = Tankyrase2 SAM.
Figure 4 with 1 supplement
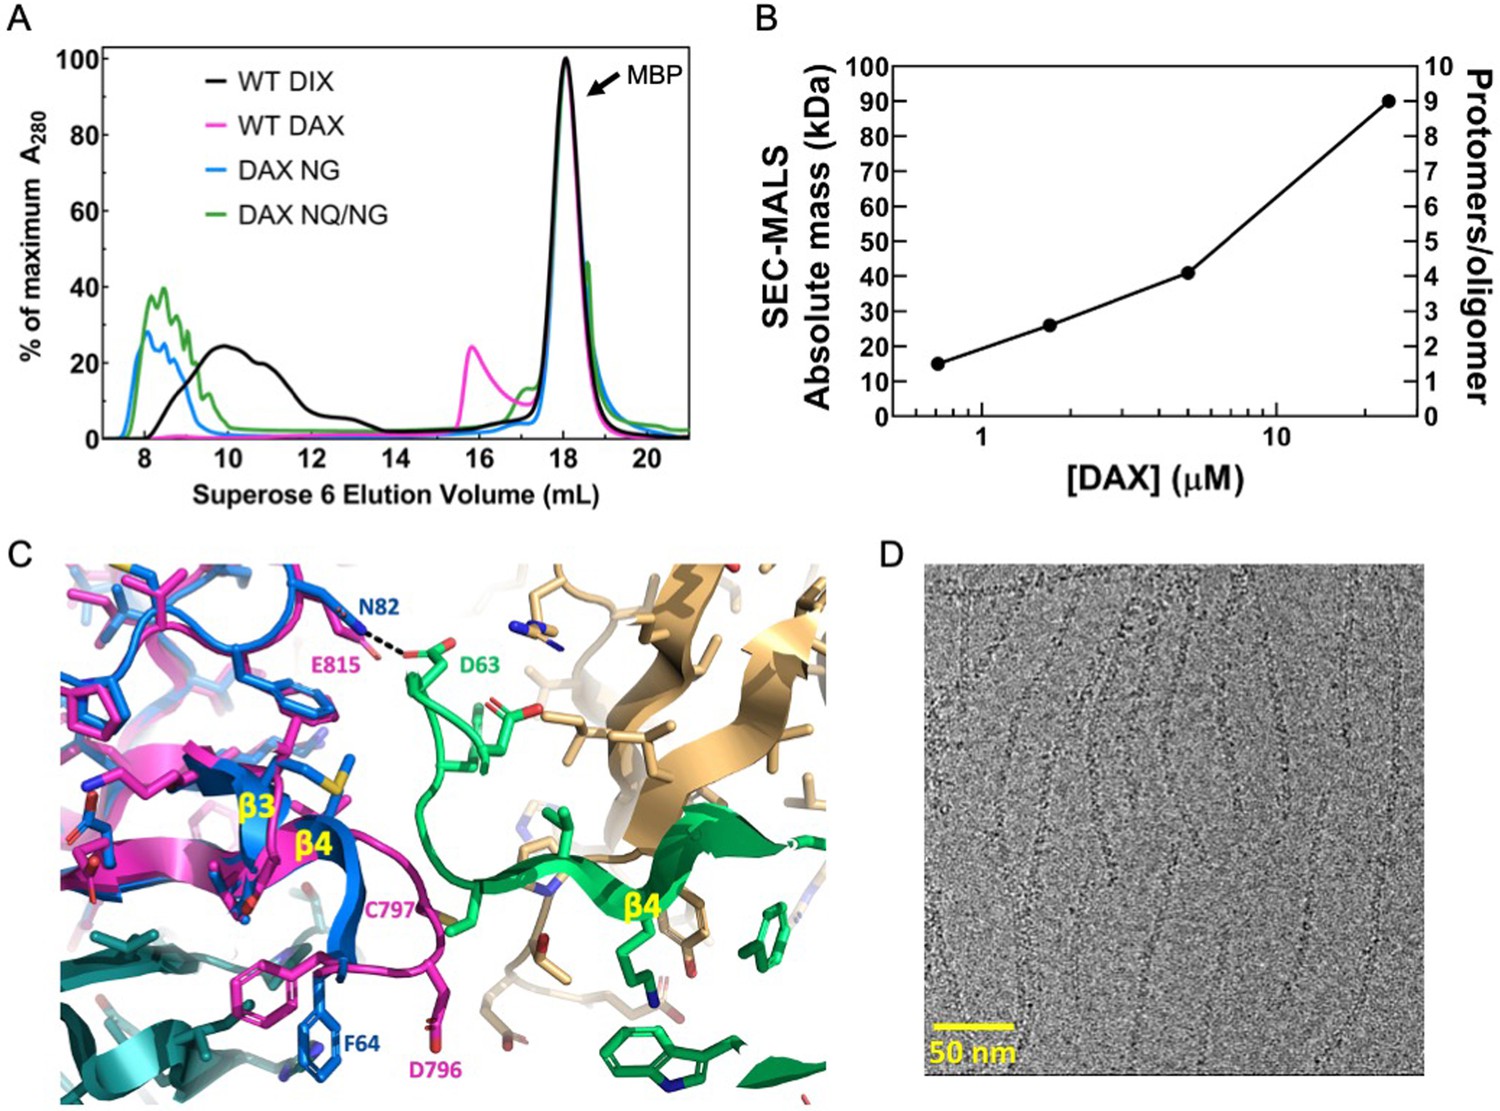
Oligomerization of Axin1 DAX and effects of oligomerization on signaling.
(A) Comparison of TEV-cleaved Axin1 DAX and Dvl2 DIX variants run on a Superose six size exclusion column (NG = E815N/E816G, NQ/NG = D793N/E794Q/E815N/E816G). Proteins were injected at 180 μM, and diluted to approximately 15 μM on the column. (B) SEC-MALS analysis of Axin1 DAX size as a function of concentration. (C) Superposition of the rat Axin1 crystal structure (PDB 1WSP; magenta) on one of the Dvl2 DIX domains (blue), showing potential clashes with another DIX protomer (green) across the inter-strand interface. Also shown is the substitution of N82 in DIX with E815 in DAX, which would eliminate the hydrogen bond with D63 of DIX and introduce electrostatic repulsion. Axin residue numbers are from the human Axin1 sequence. (D) Cryo-electron micrograph of DAX NQ/NG filaments.
Figure 4—figure supplement 1
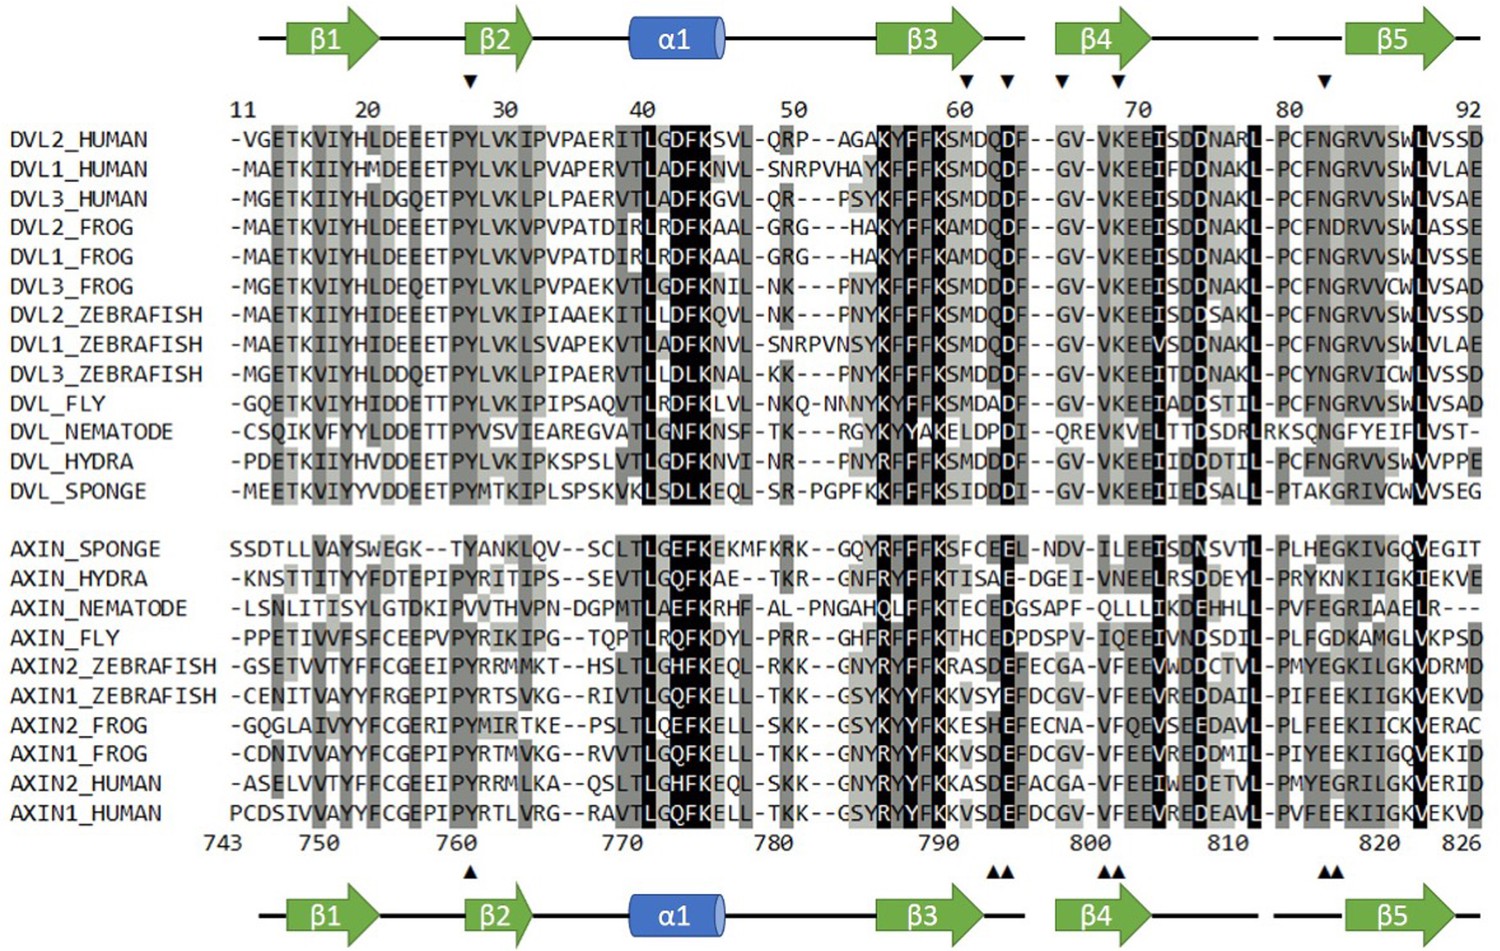
Sequence alignment of selected Dvl and Axin DIX domains.
Dvl DIX domains are shown in the top block; sequence numbers correspond to the mouse Dvl2 domain used in this paper, which is identical to the human sequence shown. Axin DAX domains are shown in the lower block; sequence numbers correspond to human Axin1 sequence used in this study. Secondary structure elements are indicated. Arrowheads indicate sites of mutations used in this study. Black shading indicates 100% similarity; dark grey, 80–99% similarity; light grey, 60–79% similarity; and no shading,<60% similarity. Alignment was carried out in Geneious version 10.2.6 (Kearse et al., 2012) using the ClustalOmega plugin (Madeira et al., 2019). Similarity was calculated using the PAM250 algorithm (Schwartz and Dayhoff, 1978) with a threshold of 1.
Figure 5 with 3 supplements
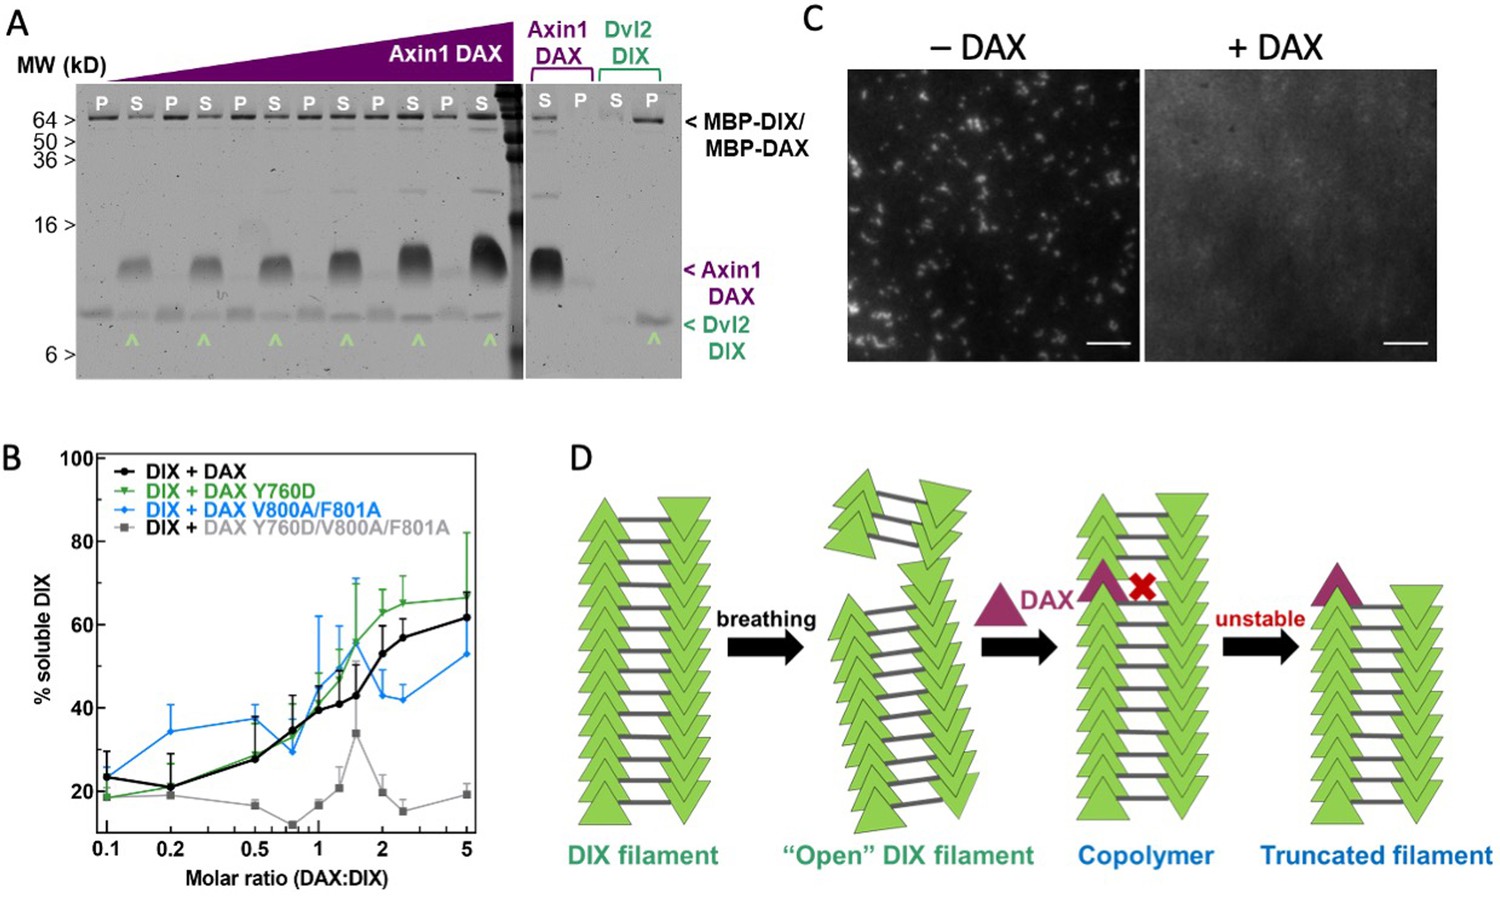
Axin1 DAX solubilizes Dvl2 DIX filaments.
(A) Sedimentation of preformed DIX filaments (10 μM) mixed with increasing amounts of purified wild-type DAX, showing shift of DIX from the pellet (P) into the supernatant (S) (denoted by ^ ). A representative SDS-PAGE gel (with a portion excised for clarity) is shown here. (B) Quantification of solubilization of DIX filaments by wild-type DAX (black curve) and DAX with mutations in the head interface (Y760D; green curve), tail interface (V800A/F801A; blue curve), or both (Y760D/V800A/F801A; gray curve) carried out as in (A). (C) Representative images of 10 μM fluorescently labeled DIX filaments in the absence and presence of 50 μM purified DAX, showing increase in background fluorescence associated with filament disruption. Scale bar = 5 μm. (D) Model for DAX incorporation into a filamentous DIX oligomer in vitro.
Figure 5—figure supplement 1
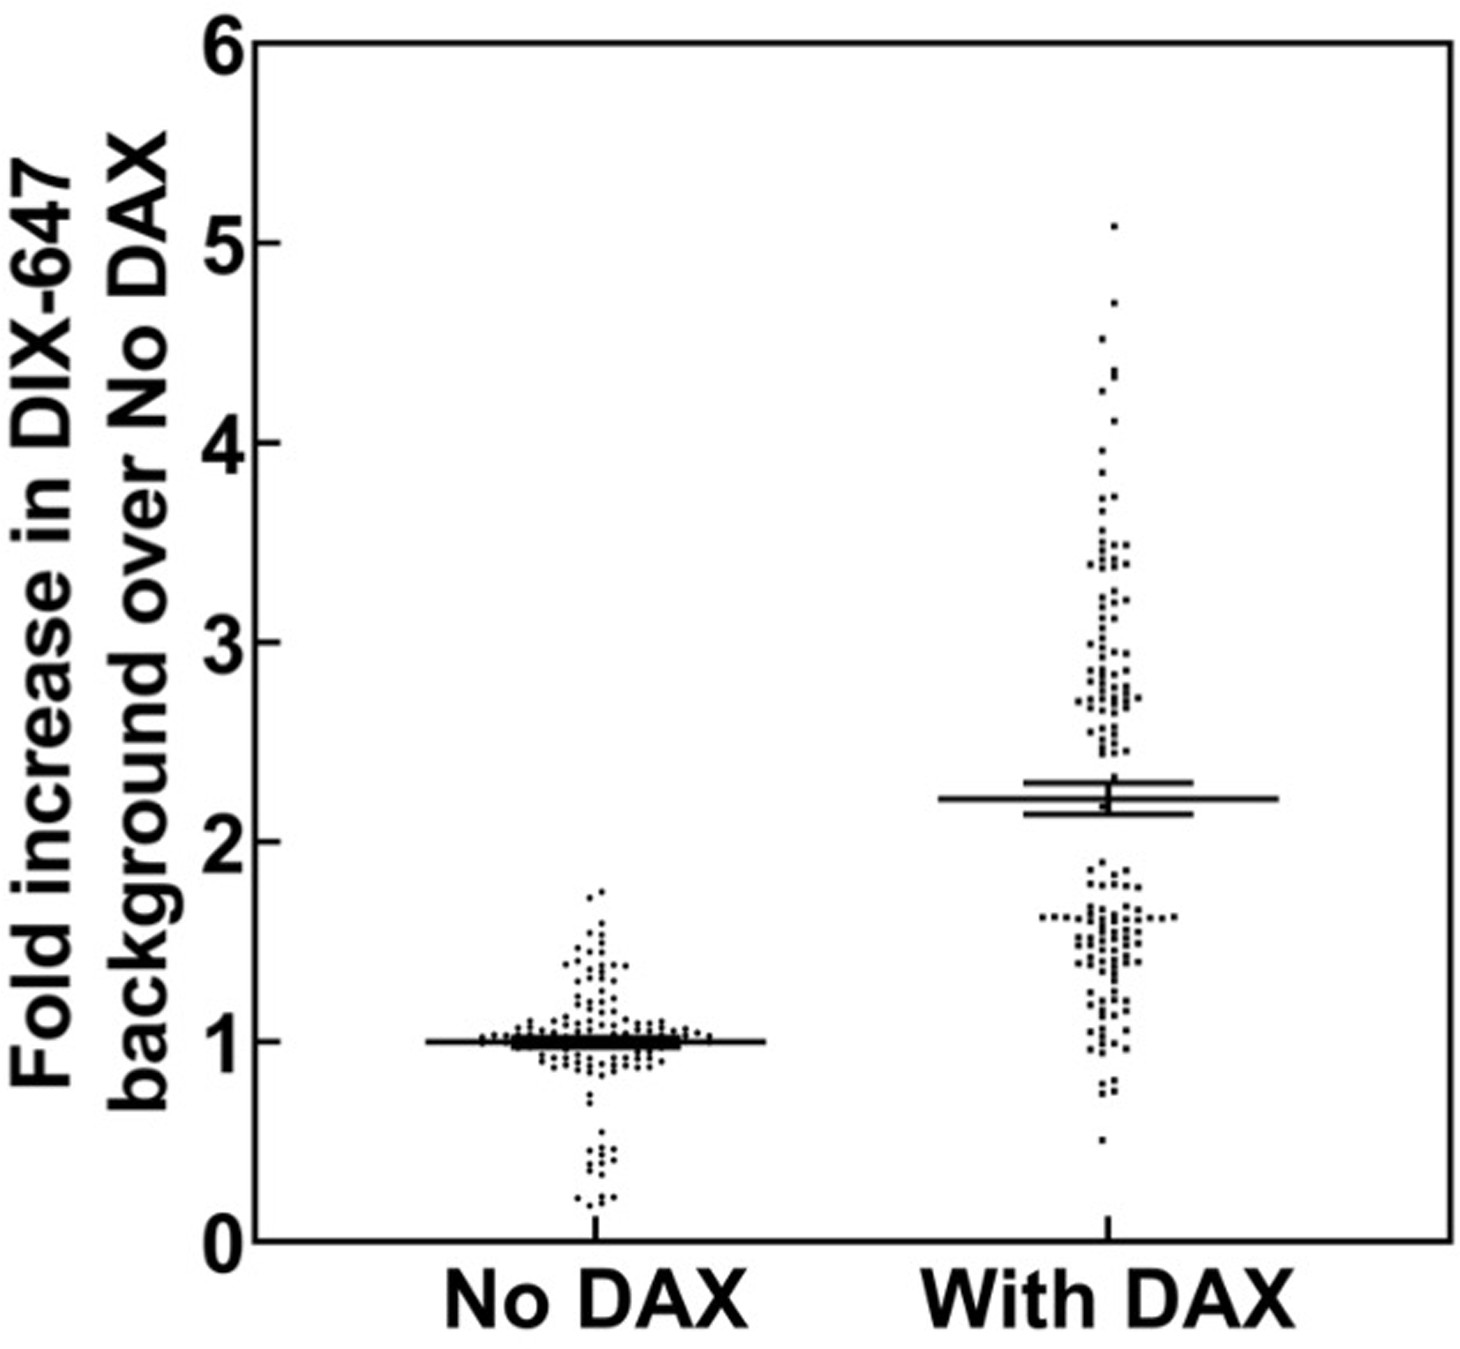
Change in mean fluorescence in TIRF DIX filament assay in the absence and presence of DAX.
Mean gray values (MGVs) in field of view were measured from multiple frames of AlexaFluor647-labeled DIX filaments in TIRF without DAX and with DAX addition. Each measurement was normalized against the mean MGV of DIX fluorescence without DAX within a technical replicate, that is the mean fold increase for “No DAX” measurements = 1.0. In total, data were collected from two technical replicates within each of two biological sample replicates. Addition of DAX to fluorescent DIX filaments significantly (p<0.05, Mann-Whitney U Test) increased the MGV in the field of view compared to ‘No DAX’ 2.32 fold, with a standard deviation of 0.45 estimated by bootstrapping (see Materials and methods).
Figure 5—figure supplement 2
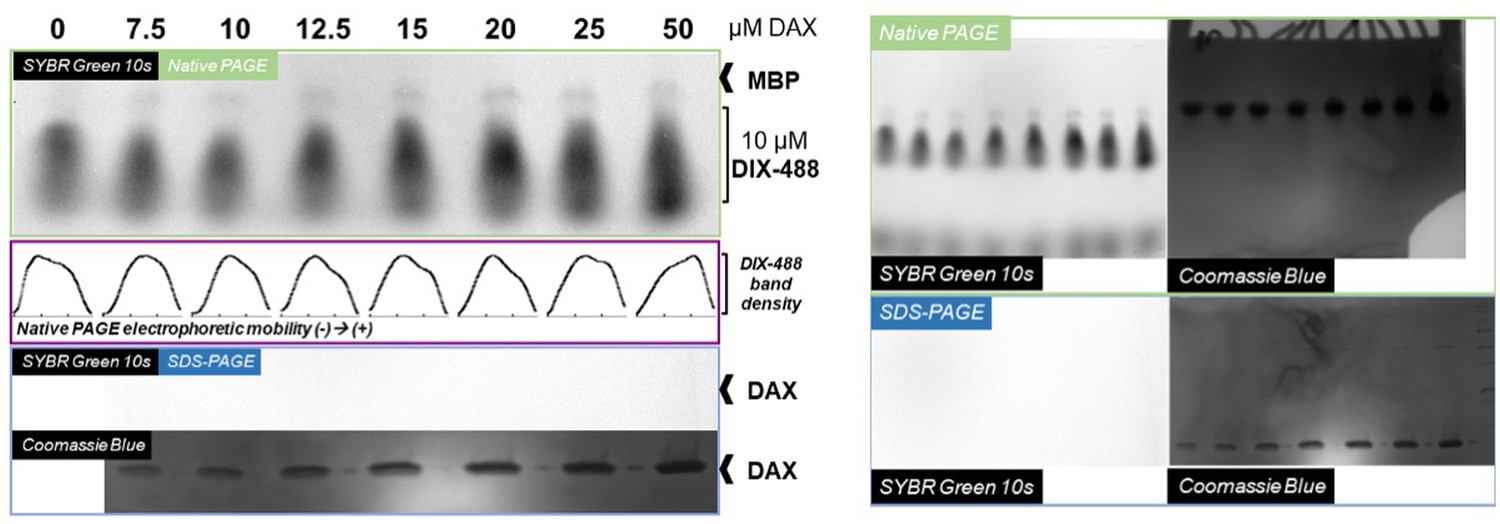
Native gel analysis of DIX filament mobility in the presence of DAX.
Left, Axin1 DAX improves mobility of native Dvl2 DIX proteins in a concentration-dependent manner. Dvl2 DIX samples, labeled with AlexaFluor 488 (protocol as described for filaments used in TIRF imaging), were mixed with Axin1 DAX at the indicated concentrations. Each 15 μL reaction mix was diluted with 5x native loading buffer and run on a native PAGE gel to separate complexes based on differences in electrophoretic mobility. As indicated in the native PAGE panel (green box) and in the plotted band intensity distributions for each lane (purple box), increasing DAX concentrations shifted the distribution of DIX-488 populations towards more mobile (i.e., smaller) species. DIX-488 fluorescence was visualized using the SYBR Green setting on a Biorad Gel Doc EZ. Although some MBP/MBP-DIX could be detected using this setting, unlabled DAX samples run on an SDS-PAGE gel (blue box) could not be detected using the same acquisition and image contrast settings. Right, full unannotated images of protein gels used in the left figure.
Figure 5—figure supplement 3
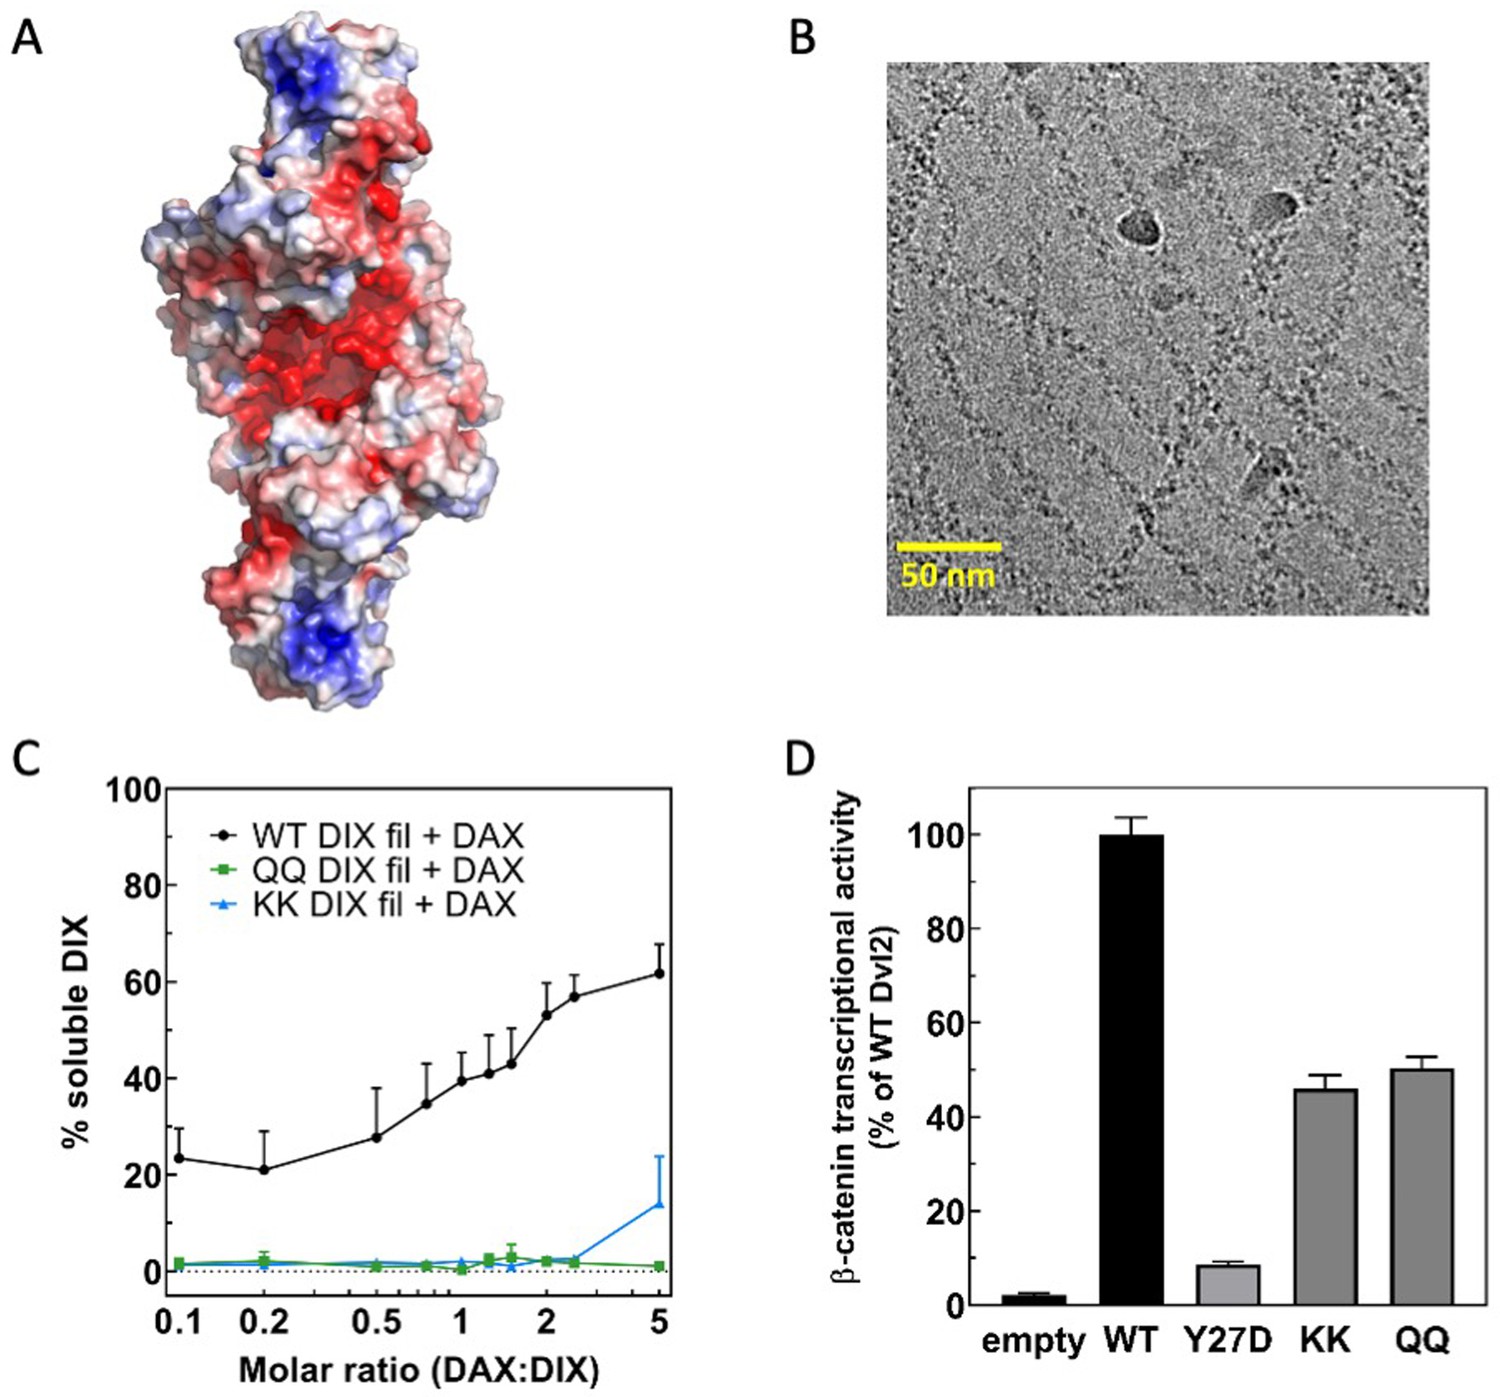
A conserved electronegative groove in the Dvl2 DIX double helix enables association with Axin1 DAX.
(A) Electrostatic surface rendering of the Dvl2 double helix. Negative potential shown in red, positive in blue. The electrostatic surface was calculated with ABPS (Baker et al., 2001) on a model prepared with PDB2PQR (Dolinsky et al., 2004). (B) Cryo-electron micrograph of Dvl2 DIX QQ mutant filaments. (C) Quantitation of solubilization of wild-type (in black), QQ (in green), or KK (in blue) Dvl2 DIX filaments by wild-type Axin1 DAX. (D) TOPFLASH assay for Wnt-dependent β-catenin signaling of Dvl2 electrostatic groove mutants expressed at near-endogenous levels in HEK293T Dvl triple knockout cells. Dvl2 Y27D is included for reference. Dvl2 constructs were abbreviated as follows: QQ = E22Q/E24Q; KK = E22K/E24K.
Figure 6
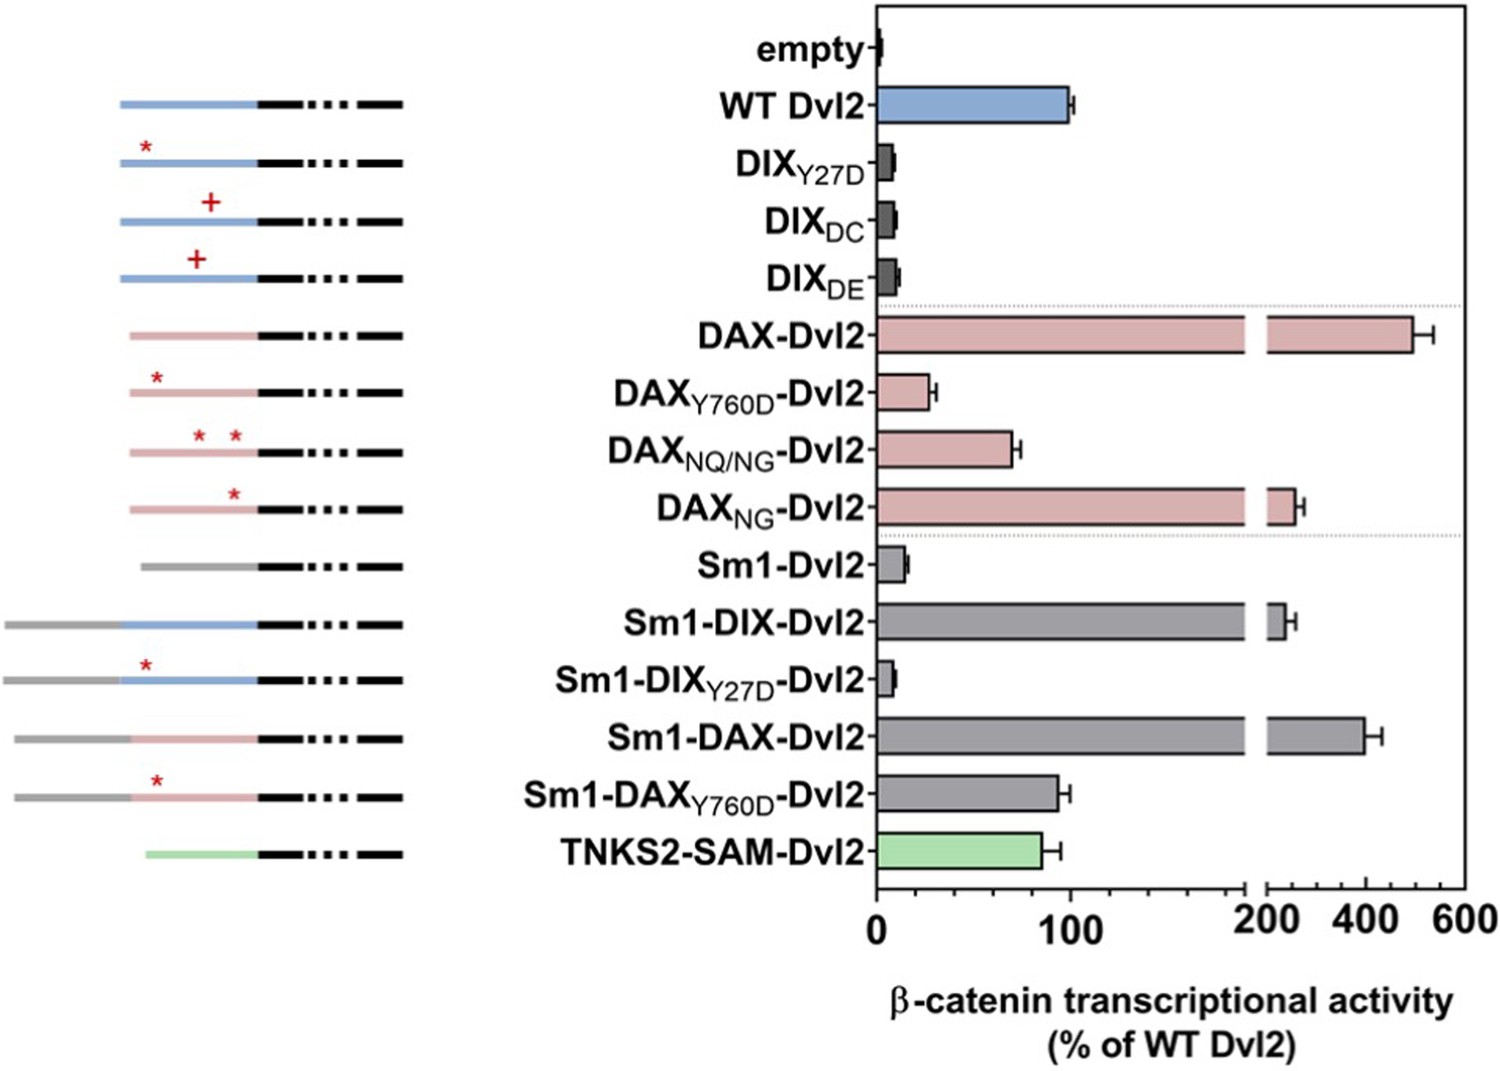
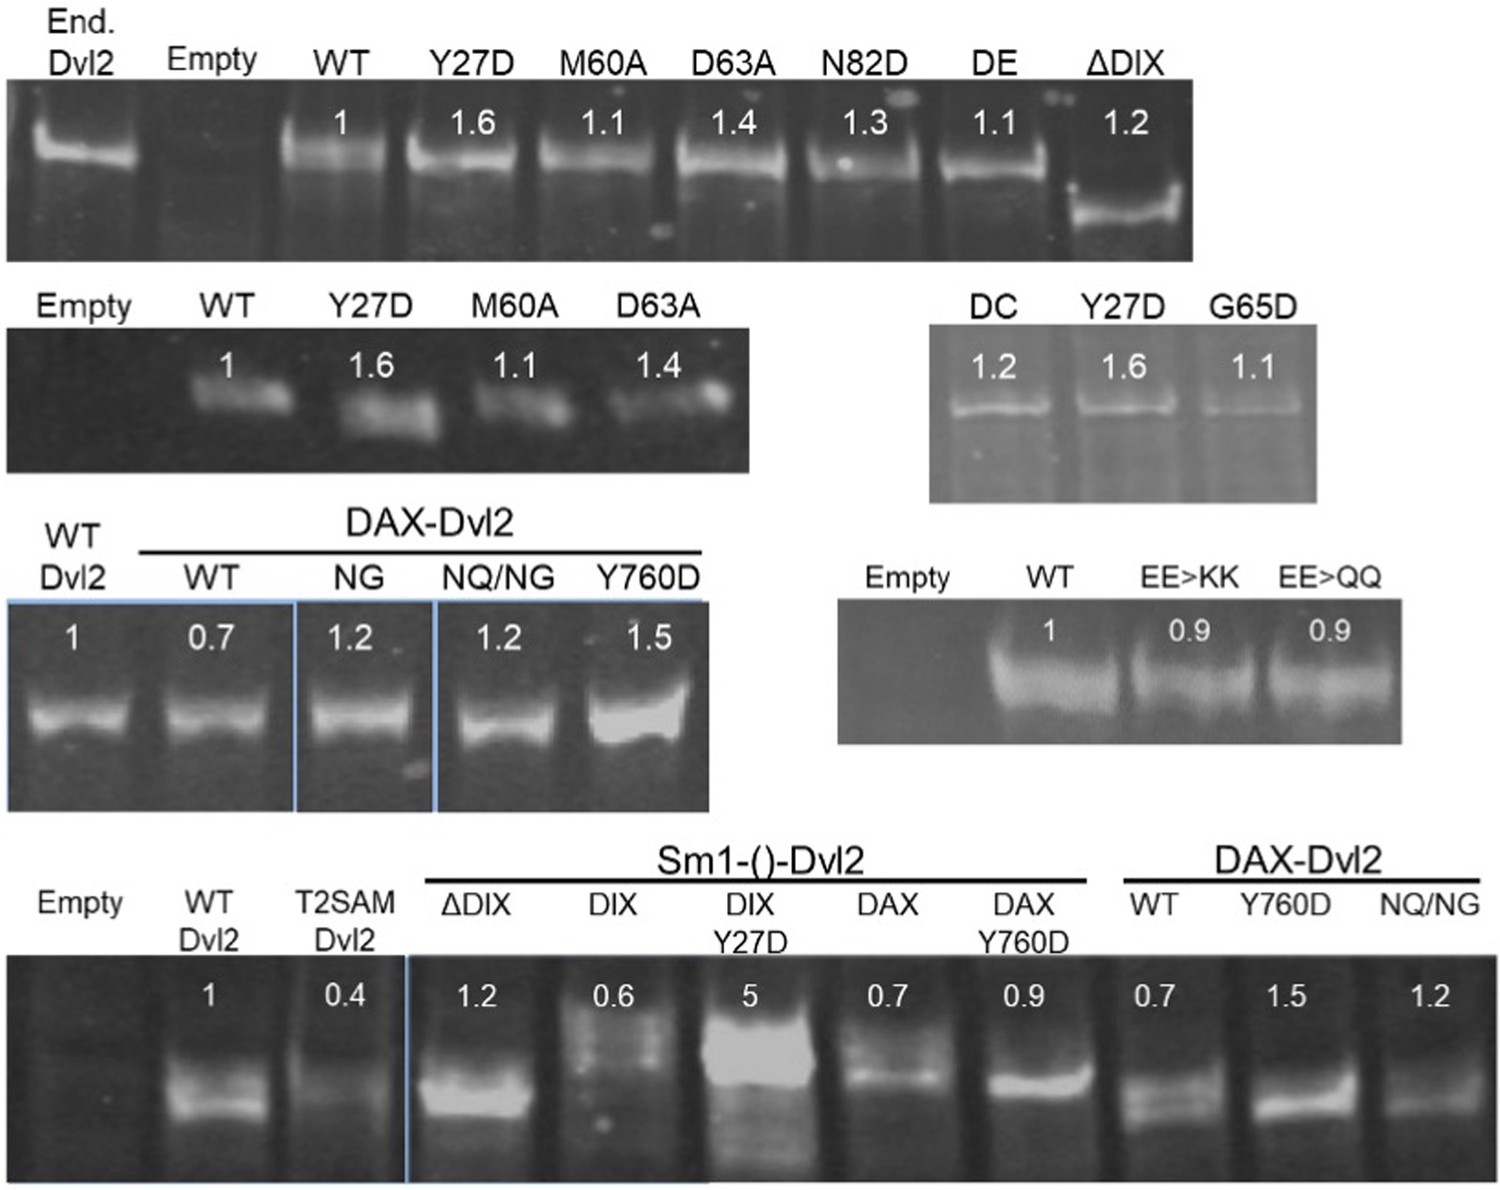
Wnt-dependent β-catenin signaling by Dvl2 constructs containing.
DIX mutants affecting either the intra- (Y27D) or inter- (DC, DE) strand interactions (dark gray); replacement of DIX with wild-type or mutant DAX domains (pink); or addition of heterologous oligomerization domains (Sm1, light gray; Tankrase2 SAM, green) expressed at near-endogenous levels in Dvl triple knockout (TKO) HEK293 cells, as measured by TOPFLASH. Schematic diagrams of the constructs are shown to the left: the portion of Dvl C-terminal to the DIX domain is shown in black, the Dvl DIX domain in blue, the Axin1 DAX domain in pink, the Sm1 heptamerization domain in light gray, and the Tankyrase2 SAM domain in green. The red asterisks indicate 1) the DIX Y27D or the equivalent DAX Y760D head mutant that blocks oligomerization, or 2) mutated sites within DAX that increase filament-forming propensity (DAXNQ/NG, DAXNG). Red pluses indicate residue insertions (DC, DE) that interfere with the DIX inter-strand interface.
Figure 7 with 1 supplement
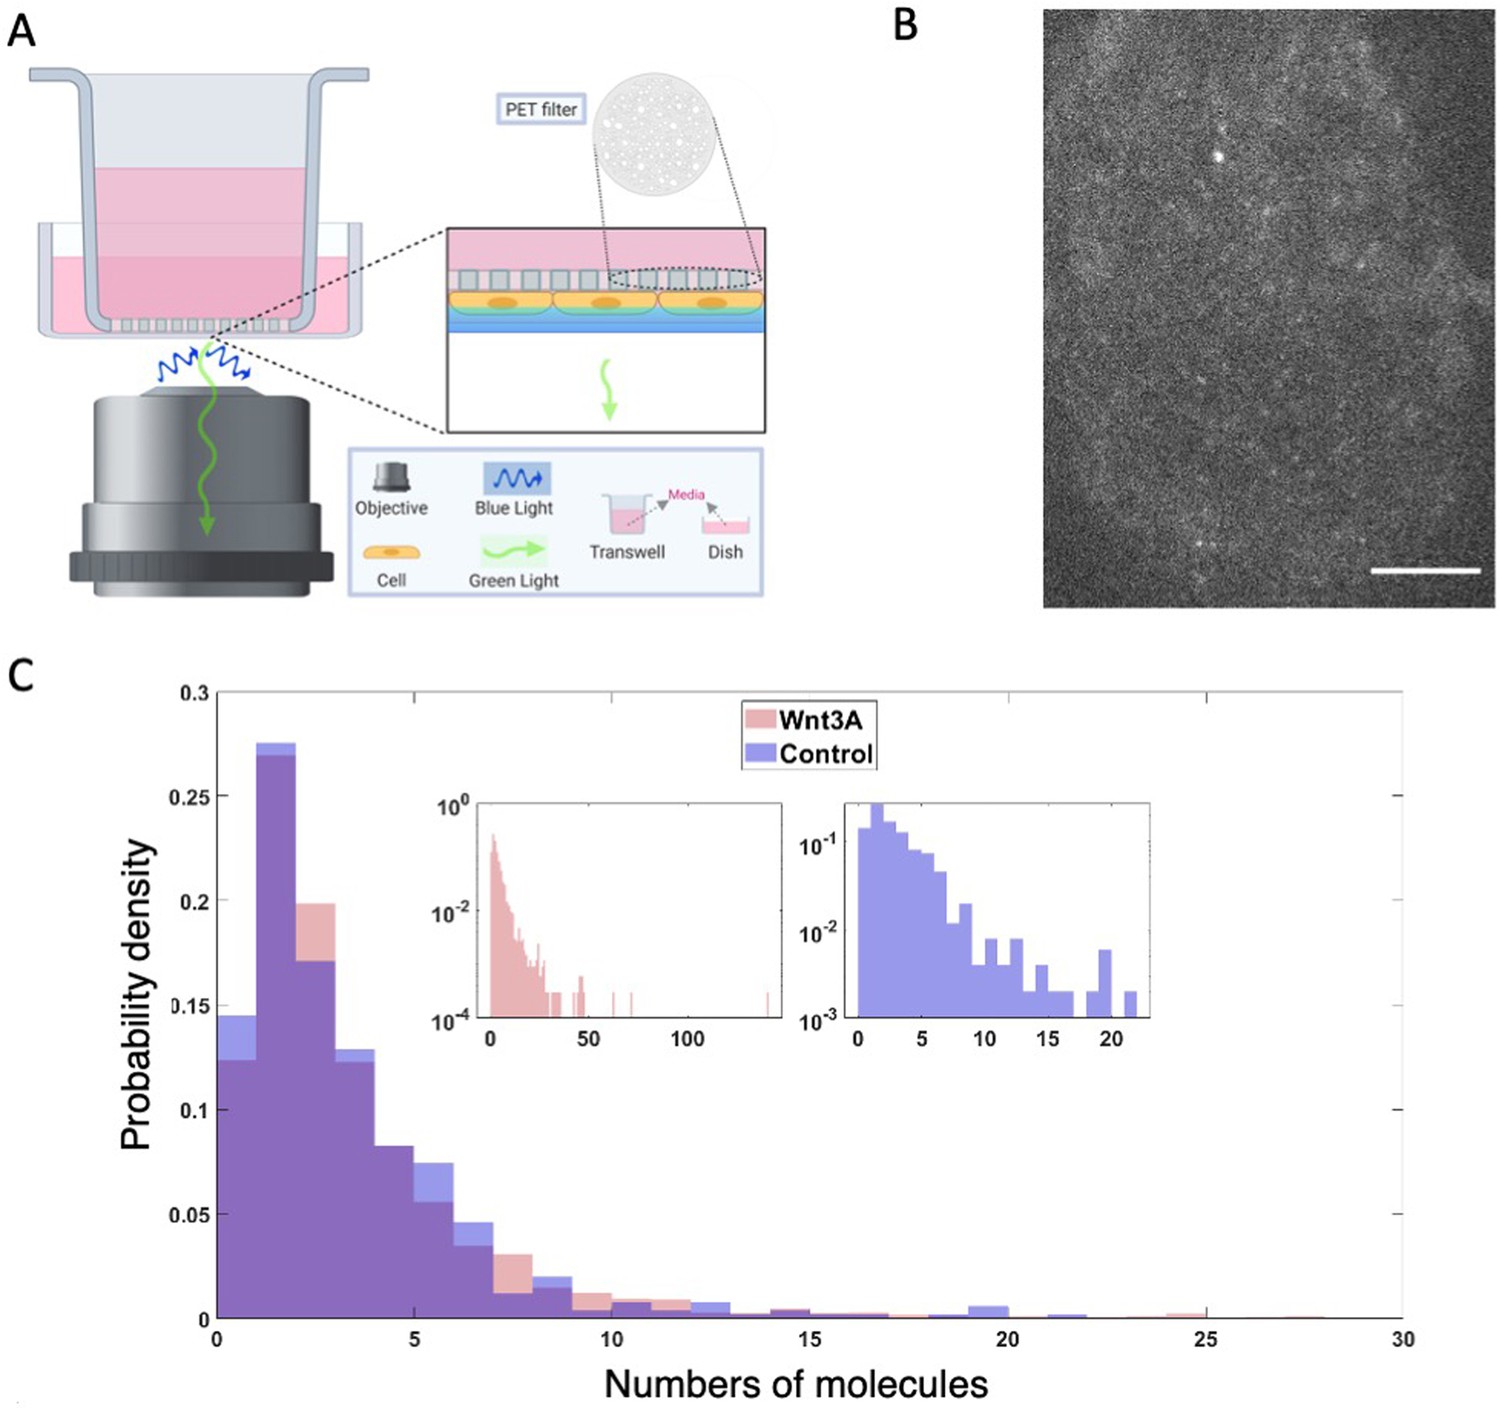
Dvl2 forms small oligomers in cells.
(A) Setup for live cell TIRF imaging of the apical membrane of HEK293T Dvl2-GFP/Axin1-dsRed knockin cells. (B) Representative TIRF image. Scale bar = 5 μm. (C) Distribution of measured spot intensities shown as the average number of GFPs equivalent to measured value.
Figure 7—figure supplement 1
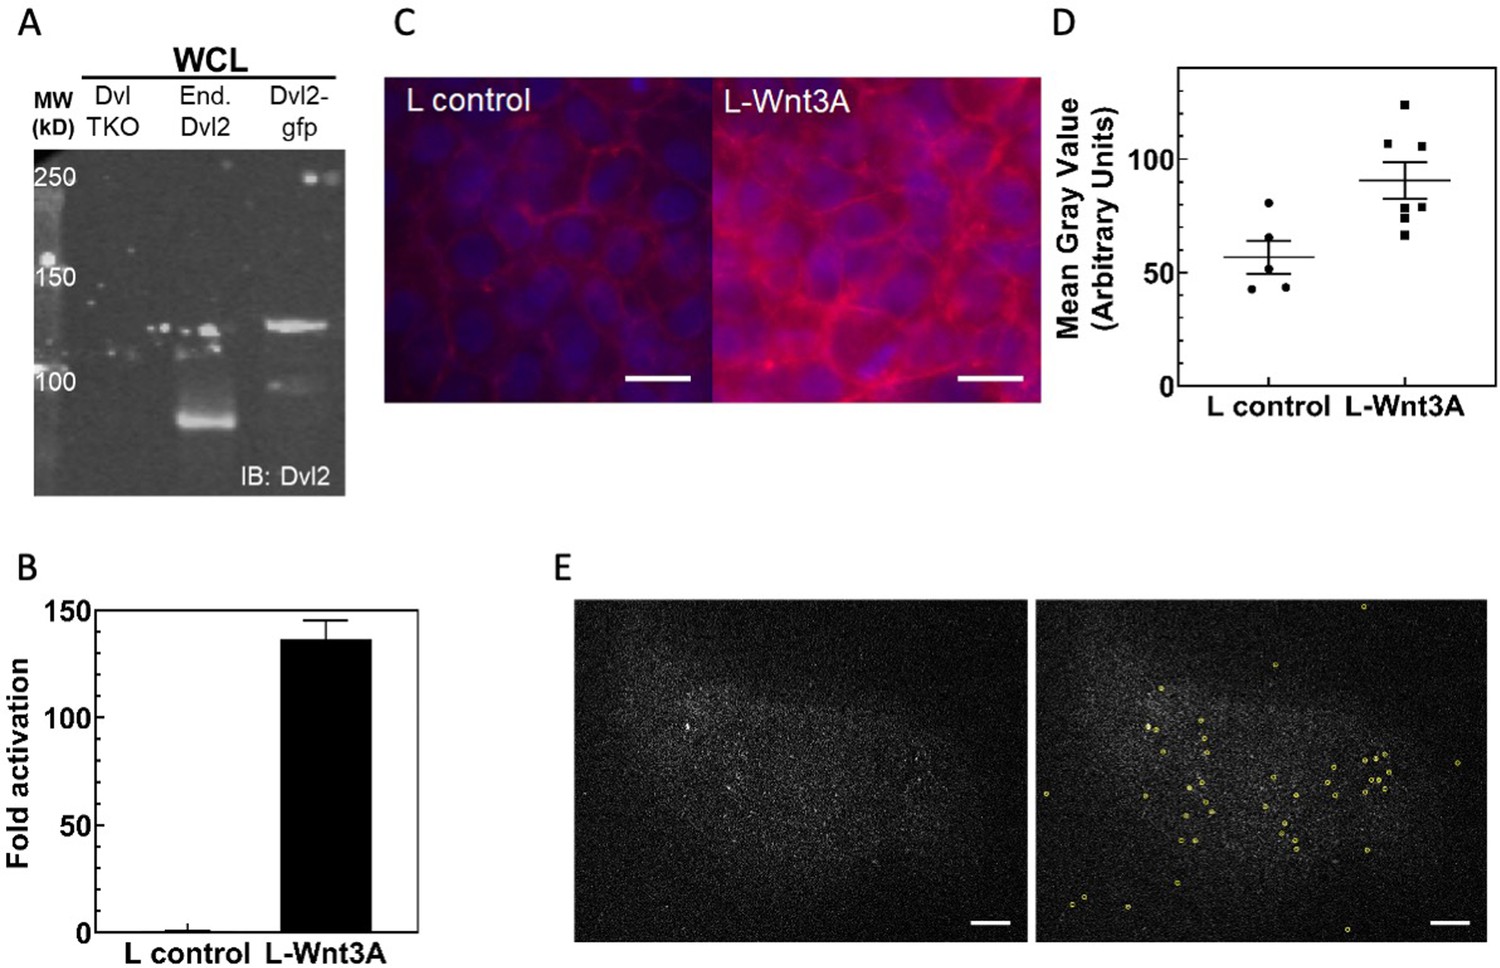
Characterization of Dvl2-GFP/Axin1-dsRed knockin HEK293T cells.
(A) Anti-Dvl2 western blot of whole cell lysates from Dvl TKO cells, wild-type HEK 293 T cells, and the Dvl2-GFP/Axin1-dsRed knockin HEK293T cells. (B) TOPFLASH assay of Dvl2-GFP/Axin-dsRed knockin HEK293T cells. (C) Increase in cellular β-catenin in HEK293T Dvl2-GFP/Axin1-dsRed cells upon Wnt3A stimulation, detected as an increase in β-catenin staining (red). Representative fields of view for anti-β-catenin immunofluorescence are shown here. Scale bar = 10 μm. (D) Mean β-catenin staining intensity. Each point represents the mean value from a single image of a field of cells similar to what is shown in (C). (E) Spot detection with u-track (Jaqaman et al., 2008). Background subtracted Dvl2-GFP TIRF images without (left) and with (right) detection circles. Scale bar = 5 μm.
Figure 8

Dvl DIX oligomerization in Axin recruitment upon Wnt signaling.
(Upper left) Schematic diagram of Dvl primary structure and association of Dvl DIX into an oligomer. A Dvl DIX oligomer provides up to four binding sites for Axin, one at each end of each paired strand. (Lower left) In the absence of Wnt signaling, self-association of the Axin DAX domain and multivalent interactions of Axin with APC create a crosslinked, possibly phase separated, destruction complex with multiple copies of the constituent proteins. (Right) The Dvl DEP domain (green oval) binds to Fzd and the Dvl oligomer associates with up to 4 Axin DAX domains. GSK-3 bound to Axin generates its own inhibitor by phosphorylating the LRP5/6 cytoplasmic tail. Axin DAX binding to the ends of the DIX oligomer provides an optimal relative stoichiometry of GSK-3–bound Axin and LRP5/6 to enable efficient inhibition of GSK-3. Some bound Axin molecules as well as DEP domains from the Dvl oligomer may interact with other receptor complexes, thereby producing a crosslinked signalosome.
Author response image 1
Summary of filament formation data in the presence of 0.05% Tween.
Videos
Video 1
Dvl2-GFP long-term epifluorescent live cell imaging.
HEK293T Dvl2-GFP/Axin1-RFP cells were imaged in HEPES buffered media for ~15 hr.
Tables
Table 1
Cryo-EM data collection, refinement and validation statistics.
| Data collection and processing | |
|---|---|
| Magnification | 29,000 |
| Voltage (kV) | 300 |
| Electron exposure (e-/Å2) | 98 |
| Defocus range (μm) | 0.5–2.0 |
| Pixel size (Å) | 1.00 |
| Symmetry imposed | C1 |
| No. Initial particle images | 437,872 |
| No. Final particle images | 110,105 |
| Map resolution (Å) | 3.6 |
| FSC threshold | 0.143 |
| Map resolution range (Å) | 3.5–4.3 |
| Map sharpening B factor (Å2) | −126 |
| Refinement | |
| Initial model used (PDB code) | 6IW3 |
| Model resolution (Å) | 3.5 |
| FSC threshold | 0.5 |
| Model composition | |
| Chains | 12 |
| Non-hydrogen atoms | 7572 |
| Protein residues | 936 |
| B factors (Å2) | 59.4 |
| R.m.s. deviations | |
| Bond lengths (Å) | 0.004 |
| Bond angles (°) | 0.65 |
| Validation | |
| MolProbity score | 1.47 |
| Clashscore | 4.58 |
| Poor rotamers (%) | 0.00 |
| Ramachandran plot | |
| Favored (%) | 96.4 |
| Allowed (%) | 3.6 |
| Disallowed (%) | 0 |
Table 2
Summary of SEC-MALS runs on Axin constructs.
| Construct | Concentration injected (μM) | Concentration at detector* (μM) | Absolute mass (kDa) | Protomers/oligomer† |
|---|---|---|---|---|
| DAX | 911 | 24. | 90 | 8–10 |
| DAX | 66.3 | 5.0 | 41 | 4 |
| DAX | 22.1 | 1.7 | 26 | 2–3 |
| DAX | 6.6 | 0.71 | 15 | 1–2 |
| DIDAX Y760D | 57.1 | 20. | 22 | 1 |
| DIDAX | 68.7 | 0.54 | 90–100 | 4 |
-
*Directly measured from maximal dRI of peak.
†DAX and DAX Y760D are 9.9 kDa; DIDAX and DIDAX Y760D are 26 kDa.
Table 3
Effect of including higher-order oligomers on estimation of DAX:DAX KD from SEC-MALS.
| Highest-order term included | KD |
|---|---|
| Dimer | 237 |
| Trimer | 672 |
| Tetramer | 844 |
| Pentamer | 907 |
| Hexamer | 932 |
| Heptamer | 941 |
| Octamer | 944 |
| Nonamer | 946 |
| Decamer | 946 |
| Undecamer | 946 |
-
The concentrations of each oligomeric species were determined by numerically solving the system of equations that resulted from setting the total concentration of all protomers to 710 nM, the average mass to 15 kDa, and the dissociation constants for a monomer dissociating from the end of an oligomer all equal to each other, regardless of filament length. The KD was then determined from . An example of the system of equations for the trimer case is shown below, where m is the concentration of monomer in nM, d of dimer, and t of trimer.
The total DAX protomer concentration across all species must sum to 710 nM:
-
The average mass must equal the measured 15 kD:
-
We assume the dissociation constants for a monomer dissociating from the end of an oligomer is independent of the length of the oligomer:
-
Key resources table
| Reagent type (species) or resource | Designation | Source or reference | Identifiers | Additional information |
|---|---|---|---|---|
| Strain, strain background (Escherichia coli) | BL21 (DE3) Codon-Plus RIL | Agilent | 230245 | Strain for expressing recombinant proteins |
| Strain, strain background (Escherichia coli) | XL10-Gold ultracompetent cells | Agilent | 200314 | Strain used for molecular biology and creating recombinant DNA |
| Cell line (Homo-sapiens) | Dvl TKO HEK293T | Stephane Angers, University of Toronto See Gammons et al., 2016b https://doi.org/10.1242/jcs.195685 | CRISPR/Cas9 deletion of hDvl1, hDvl2, and hDvl3 Authentication methods: deletions were confirmed by genomic DNA sequencing; immunoblotting with anti-Dvl2 (Figure 7—figure supplement 1) Mycoplasma contamination testing status: Tested | |
| Cell line (Homo-sapiens) | Dvl2-GFP/dsRed-Axin1 HEK293T | This paper; cells were derived from cells purchased from the European Collection of Cell Cultures | C-terminal tagging by CRISPR/Cas9 gene editing Authentication methods: STR DNA profiling; flow cytometry and fluorescence microscopy using GFP/RFP; local genomic DNA sequencing; and anti-Dvl2 (Figure 7—figure supplement 1) and anti-Axin1 immunoblots Mycoplasma contamination testing status: Tested Contact Bienz laboratory for distribution | |
| Cell line (mouse) | L and L3A | ATCC | L CRL-2648 L3A CRL-2647 | Used for generating control and Wnt-conditioned media; See https://web.stanford.edu/group/nusselab/cgi-bin/wnt/ |
| Recombinant DNA reagent | pCS2+ | This paper | Ampicillin resistance; expression in mammalian cell culture; includes a N-terminal M2 Flag tag Contact Weis lab for distribution | |
| Recombinant DNA reagent | pCDF-Duet-His6-MBP-TEV | Novagen; modified in Weis lab to include MBP-TEV | 71340 | Streptomycin resistance; expression in bacterial cultures Contact Weis lab for distribution |
| RecombinantDNA reagent | pGEX-TEV | Choi et al., 2006 https://doi.org/10.1074/jbc.M511338200 | Ampiicillin resistance; expression in bacterial cultures; pGEX-KG plasmid (ATCC) with a new TEV protease site Contact Weis lab for distribution | |
| Chemical compound, drug | Fetal Bovine Serum | Gemini GemCell, U.S. Origin | Used to generating control and Wnt-conditioned media; provides low basal activity | |
| Chemical compound, drug | LB Broth, Miller, granules | Fisher BioReagents | ||
| Chemical compound, drug | Amylose agarose | New England BioLabs | For purification by MBP affinity | |
| Chemical compound, drug | Glutathione agarose | Pierce | For purification by GST affinity | |
| Chemical compound, drug | Negative stain grids (carbon-coated copper) | EMS | CF200-Cu | |
| Chemical compound, drug | Cryo-EM lacey grids | EMS | LC200-Cu | Freezing done with Leica EM GP |
| Antibody | Dvl2 polyclonal antibody | Cell Signaling Technology | 3216 | IB (1:1000) RRID:AB_2093338 |
| Antibody | Axin1 antibody | Cell Signaling Technology | C76H11 | IB (1:1000) RRID:AB_2054638 |
| Antibody | Beta-catenin monoclonal antibody L54E2, AlexaFluor647-conjugated | Cell Signaling Technology | 4627 | IF (1:300) RRID:AB_10691326 |
| Recombinant DNA reagent | Dvl2 (mouse) | This paper | GenBank U24160.2 | residues 2–736; DIX = 12–92; Plasmid in pCS2+-M2-Flag; contact Weis lab for distribution |
| Recombinant DNA reagent | Axin1 (human) | This paper | NCBI NM_181050.3 | corresponds to residues1–826 of NP_851393.1 DAX = 743–826 DI-DAX = 599–826 Plasmid in pCAN-M2S-myc; contact Weis lab fordistribution |
| Recombinant DNA reagent | Tankyrase2 SAM domain (human) | Nai-Wen Chi (Addgene plasmid # 34691) | NCBI NP_079511.1 | residues 867–940 |
| Recombinant DNA reagent | Sm1 residues 1–77 heptamerization domain (archaea) | Integrated DNATechnologies/This paper | NCBI WP_010878376.1 | Contact Weis lab for distribution PDB: 1LJO; Törö et al., 2002 |
| Commercial assay or kit | MALS | Wyatt | See main text for more details | |
| Commercial assay or kit | S75, S200, Superose 6 10/300 | Pharmacia/GE | 24 mL ‘increase’ columns are tolerant of high flow rates and have slight differences in elution profile | |
| Commercial assay or kit | TopFlash Dual-Light Reporter Gene Assay System | ThermoFisher/Applied Biosystems | T1005 | |
| Commercial assay or kit | AlexaFluor-488/647 C2 maleimide | ThermoFisher/Molecular Probes | See Materials and methods for more details | |
| Commercial assay or kit | Phusion HiFi DNA polymerase | Fermentas/Thermo Fisher | ||
| Commercial assay or kit | FastDigest Restriction endonucleases | Fermentas/Thermo Fisher | ||
| Commercial assay or kit | Gibson Assembly HiFi 1-Step Kit | SGI DNA | GA1100-10 | |
| Commercial assay or kit | Stain-free TGX | Biorad | Specifically visualizes Trp-containing proteins, using Gel Doc EZ | |
| Commercial assay or kit | Any Kd TGX | Biorad | 4569036 | Used for native gel runs |
| Commercial assay or kit | LiCOR IR-dye secondary antibody and Odyssey 3.0 imaging system | LiCOR, Inc | Used for visualizing immunoblots and quantifying sedimentation assays | |
| Software, algorithm | RELION 3.0.8 | He and Scheres, 2017 https://doi.org/10.1016/j.jsb.2017.02.003 Scheres, 2012 https://doi.org/10.1016/j.jmb.2011.11.010 Zivanov et al., 2018 https://doi.org/10.7554/eLife.42166 | RRID:SCR_016274 | |
| Software, algorithm | CTFFIND-4.1 | Rohou and Grigorieff, 2015 https://doi.org/10.1016/j.jsb.2015.08.008 | RRID:SCR_016732 | |
| Software, algorithm | Phenix | Afonine et al., 2018 https://doi.org/10.1107/S2059798318006551 | RRID:SCR_014224 | |
| Software, algorithm | Coot | Emsley et al., 2010 https://doi.org/10.1107/S0907444910007493 | RRID:SCR_014222 | |
| Software, algorithm | FIJI | Schindelin et al., 2012 https://doi.org/10.1038/nmeth.2019 | RRID:SCR_002285 | |
| Software, algorithm | Astra 6 | Wyatt Technologies | RRID:SCR_016255 | |
| Software, algorithm | SBGrid | Morin et al., 2013 https://doi.org/10.7554/eLife.01456 | RRID:SCR_003511 | |
| Software, algorithm | UCSF Chimera | Pettersen et al., 2004 https://doi.org/10.1002/jcc.20084 | RRID:SCR_004097 | v1.14 |
| Software, algorithm | PyMOL | Schrödinger, LLC | RRID:SCR_000305 | v2.3.3 |
| Software, algorithm | GraphPad Prism 8.0.2 | GraphPad Software, Inc | Version 263 RRID:SCR_002798 | |
| Software, algorithm | u-track | Jaqaman et al., 2008 https://doi.org/10.1038/nmeth.1237 | ||
| Software, algorithm | Matlab | The MathWorks, Inc | Version 9.6.0.1072779 (R2019a) | |
| Software, algorithm | BioRender | BioRender - biorender.com | Used for Figure 7a |
Additional files
-
Source code 1
Single molecule analysis code to analyze pools individually in the apical TIRF live cell Dvl2-GFP imaging/intensity experiments.
- https://cdn.elifesciences.org/articles/55015/elife-55015-code1-v2.m
-
Source code 2
Single molecule analysis code to combine different pools and plot data for the apical TIRF live cell Dvl2-GFP imaging/intensity experiments.
- https://cdn.elifesciences.org/articles/55015/elife-55015-code2-v2.m
-
Supplementary file 1
Plasmid sequences.
Nucleotide sequences for constructs discussed in this paper. There are two classes of plasmids: those used to make recombinant protein in bacteria in the pCDF MBP-TEV or pGEX-TEV vector backbone, and those used to express full-length Dvl proteins in cells for signaling assays, which are in the pCS2+ vector backbone under the control of the SP6 promoter. The full sequence of each vector backbone is provided, including appropriate sequencing primers for each vector backbone. For analogous constructs between mammalian and bacterial expression, please refer to the bacterial expression constructs for the exact nucleotide sequence. Yellow highlights indicate either the mutated residue or extra sequences inserted inside the native open reading frame.
- https://cdn.elifesciences.org/articles/55015/elife-55015-supp1-v2.docx
-
Transparent reporting form
- https://cdn.elifesciences.org/articles/55015/elife-55015-transrepform-v2.docx
Download links
A two-part list of links to download the article, or parts of the article, in various formats.
Downloads (link to download the article as PDF)
Open citations (links to open the citations from this article in various online reference manager services)
Cite this article (links to download the citations from this article in formats compatible with various reference manager tools)
Limited dishevelled/Axin oligomerization determines efficiency of Wnt/β-catenin signal transduction
eLife 9:e55015.
https://doi.org/10.7554/eLife.55015


