Ultra-high-field imaging reveals increased whole brain connectivity underpins cognitive strategies that attenuate pain
- Wellcome Centre for Integrative Neuroimaging, FMRIB, Nuffield Department of Clinical Neurosciences, University of Oxford, United Kingdom
- Department of Neurology, Ludwig-Maximilians-Universität München, Germany
- Emotion and Development Branch, National Institute of Mental Health, National Institutes of Health, United States
- Department of Theoretical Methods, Institute of Measurement Science, Slovak Academy of Sciences, Slovakia
Figures
Figure 1
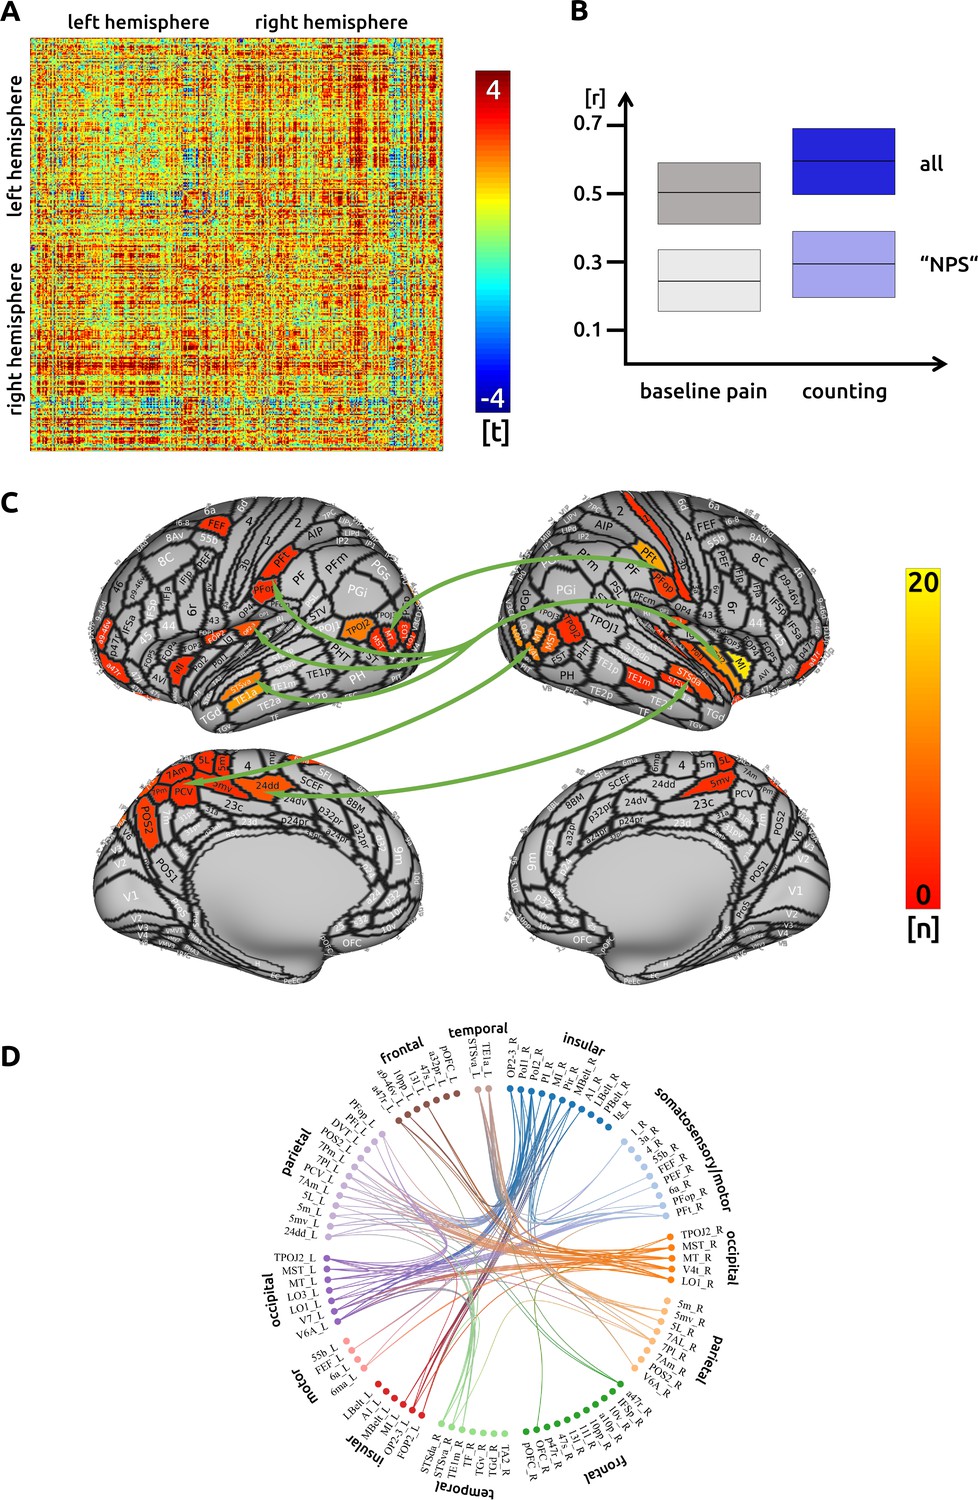
Counting: (A) the confusion matrix shows the statistical results.
Each line represents one of the 371 ROIs. The values are mirrored along the principal diagonal of the matrix. A single red dot represents the varying connectivity between two specific brain regions and indicates that a stronger cortical connectivity in a single trial is related to a decrease in pain perception (performance encoding). These findings are the result of the higher connectivity in the trials of the counting task compared to unmodulated pain trials. (B) Data from the confusion matrix averaged across all subjects, connections and trials (mean ± standard deviation; for illustration purposes only). The darker boxes show the average across all connections, the lighter boxes represent the averaged connections within the "NPS". (C) Depiction of the cortical regions as defined by the Glasser parcellation; the arrows show the best-connected regions; the right middle insular cortex has the most connections where connectivity changes are shown to significantly modulate pain intensity. Only regions with at least three significant connections (n > 2) are included in the cortical map. (D) For the circular plot, created with Brain Data Viewer (link) we selected 89 regions that showed at least three significant connections in any of the three conditions. For more detailed information on the exact connections see the source data files.
Figure 2
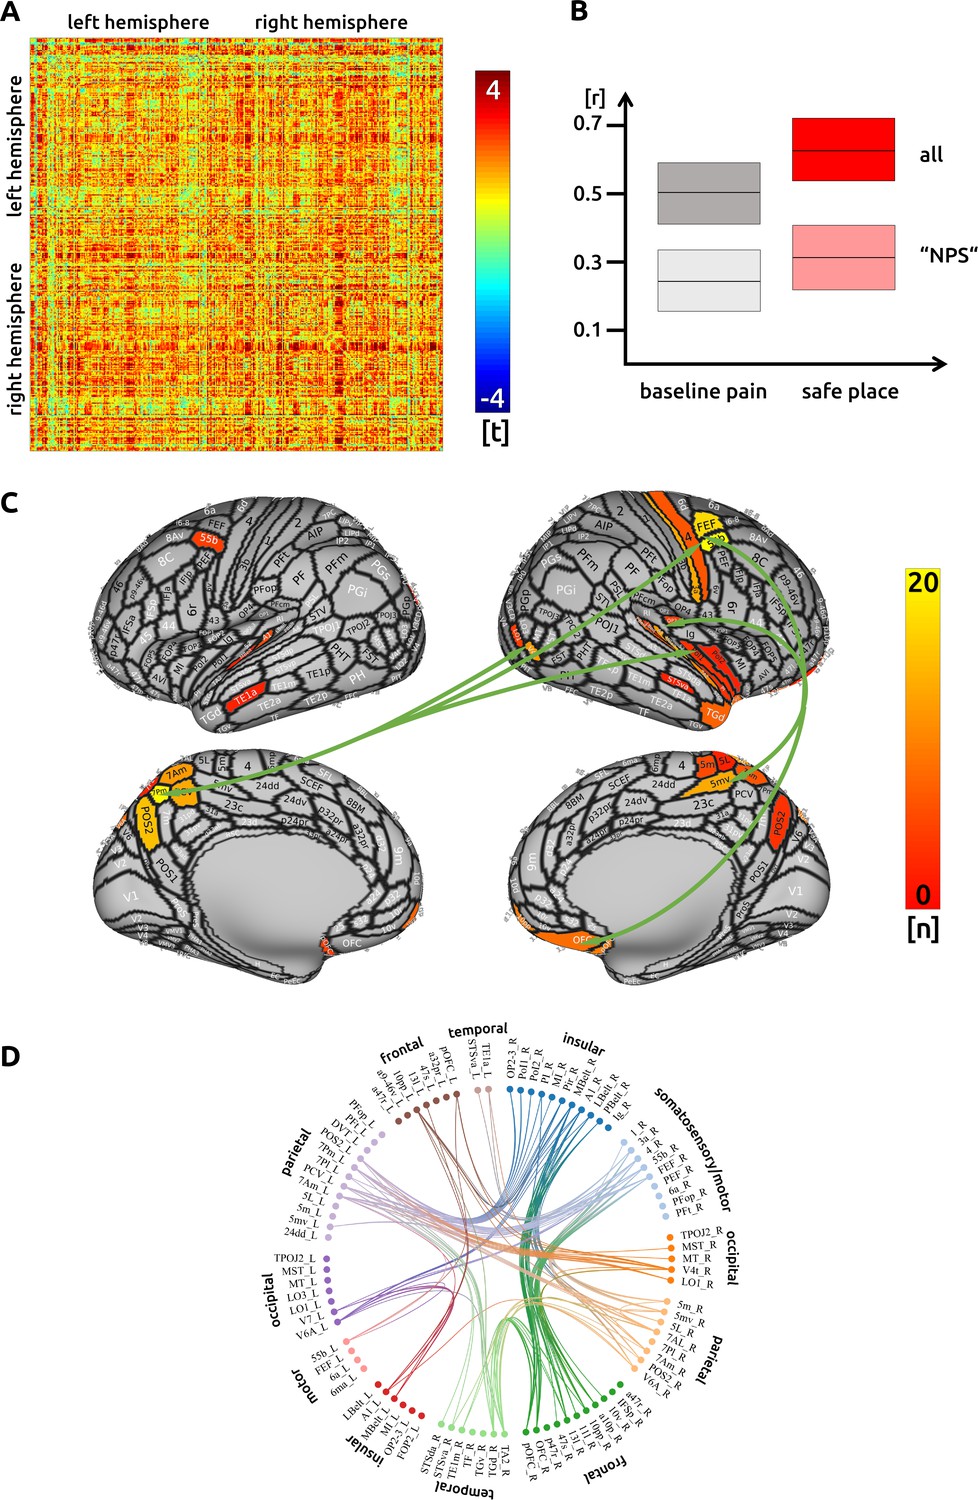
Safe place: (A) the confusion matrix shows the statistical results.
Each line represents one of the 371 ROIs. The values are mirrored along the principal diagonal of the matrix. A single red dot represents the varying connectivity between two specific brain regions and indicates that a stronger cortical connectivity in a single trial is related to a decrease in pain perception (performance encoding). These findings are the result of the higher connectivity in the trials of the imagination task compared to unmodulated pain trials. (B) Data from the confusion matrix averaged across all subjects, connections and trials (mean ± standard deviation; for illustration purposes only). The darker boxes show the average across all connections, the lighter boxes represent the averaged connections within the "NPS". (C) Depiction of the cortical regions as defined by the Glasser parcellation; the arrows show the best connected regions; the left parietal cortex and right premotor areas have the most connections where connectivity changes are shown to significantly modulate pain intensity. Only regions with at least three significant connections (n > 2) are included in the cortical map. (D) For the circular plot, created with Brain Data Viewer (link) we selected 89 regions that showed at least three significant connections in any of the three conditions. For more detailed information on the exact connections see the source data files.
Figure 3
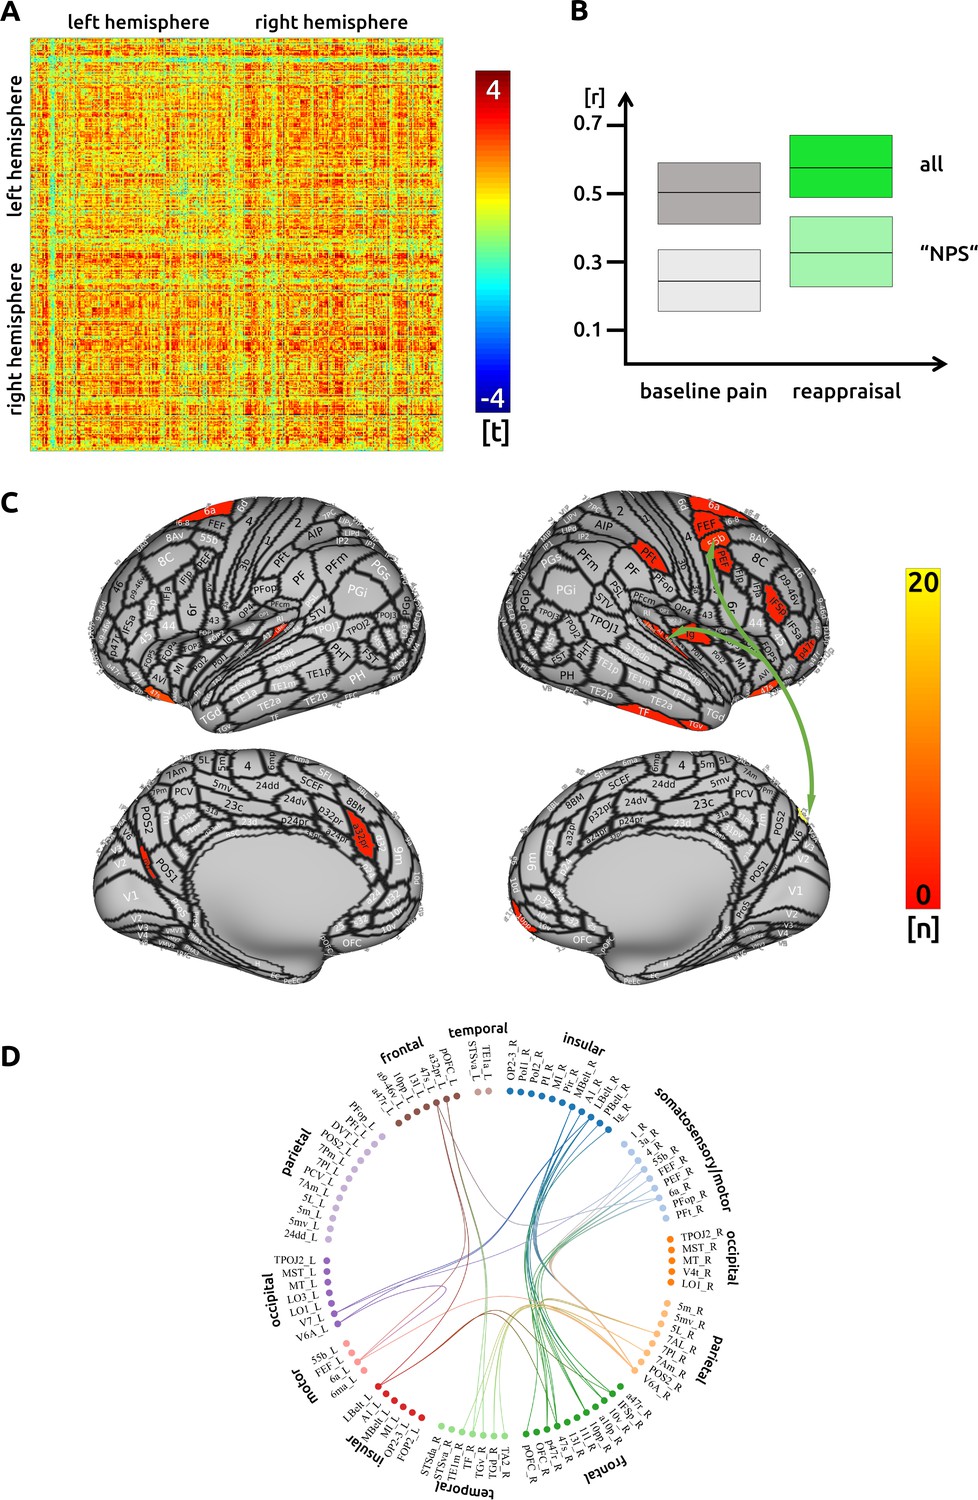
Reappraisal: (A) the confusion matrix shows the statistical results.
Each line represents one of the 371 ROIs. The values are mirrored along the principal diagonal of the matrix. A single red dot represents the varying connectivity between two specific brain regions and indicates that a stronger cortical connectivity in a single trial is related to a decrease in pain perception (performance encoding). These findings are the result of the higher connectivity in the trials of the reappraisal task compared to unmodulated pain trials. (B) Data from the confusion matrix averaged across all subjects, connections and trials (mean ± standard deviation; for illustration purposes only). The darker boxes show the average across all connections, the lighter boxes represent the averaged connections within the "NPS". (C) Depiction of the cortical regions as defined by the Glasser parcellation; the arrows show the best connected regions; the region V6A in the parieto-occipital cortex has the most connections where connectivity changes are shown to significantly modulate pain intensity. Only regions with at least three significant connections (n > 2) are included in the cortical map. (D) For the circular plot, created with Brain Data Viewer (link) we selected 89 regions that showed at least three significant connections in any of the three conditions. For more detailed information on the exact connections see the source data files.
Tables
Table 1
Conditions and Instructions.
| (0) Pain, non-modulated | Concentrate only on the pain. |
| (A) Attentional shift | Count backwards from 1000 by sevens. |
| (B) Imaginal strategy | Imagine that you are in a safe and happy place that you know very well. That place has the colours you like and you hear the music you like. There are only people around that you want to have around you. You feel well and comfortable. |
| (C) Cognitive reappraisal | Concentrate on the cool and tingling sensations in your arm and reinterpret these sensations as not painful. |
Additional files
-
Source data 1
The file contains the results that generated Figure 1.
- https://cdn.elifesciences.org/articles/55028/elife-55028-data1-v2.xlsx
-
Source data 2
The file contains the results that generated Figure 2.
- https://cdn.elifesciences.org/articles/55028/elife-55028-data2-v2.xlsx
-
Source data 3
The file contains the results that generated Figure 3.
- https://cdn.elifesciences.org/articles/55028/elife-55028-data3-v2.xlsx
-
Source data 4
The file contains the results for the analysis on the facilitation of functional connectivity through structural connectivity.
- https://cdn.elifesciences.org/articles/55028/elife-55028-data4-v2.xlsx
-
Source data 5
The file contains the results for the contrast between pain attenuation during counting and pain attenuating during ‘safe place’.
- https://cdn.elifesciences.org/articles/55028/elife-55028-data5-v2.xlsx
-
Source data 6
The file contains the results for the contrast between pain attenuation during counting and pain attenuating during reappraisal.
- https://cdn.elifesciences.org/articles/55028/elife-55028-data6-v2.xlsx
-
Source data 7
The file contains the results for the contrast between pain attenuation during ‘safe place’ and pain attenuating during reappraisal.
- https://cdn.elifesciences.org/articles/55028/elife-55028-data7-v2.xlsx
-
Transparent reporting form
- https://cdn.elifesciences.org/articles/55028/elife-55028-transrepform-v2.docx
Download links
A two-part list of links to download the article, or parts of the article, in various formats.
Downloads (link to download the article as PDF)
Open citations (links to open the citations from this article in various online reference manager services)
Cite this article (links to download the citations from this article in formats compatible with various reference manager tools)
Ultra-high-field imaging reveals increased whole brain connectivity underpins cognitive strategies that attenuate pain
eLife 9:e55028.
https://doi.org/10.7554/eLife.55028


