Identification of novel, clinically correlated autoantigens in the monogenic autoimmune syndrome APS1 by proteome-wide PhIP-Seq
- Medical Scientist Training Program, University of California, San Francisco, United States
- Tetrad Graduate Program, University of California, San Francisco, United States
- Diabetes Center, University of California, San Francisco, United States
- Department of Biochemistry and Biophysics, University of California, San Francisco, United States
- Fungal Pathogenesis Section, Laboratory of Clinical Immunology and Microbiology, National Institute of Allergy & Infectious Diseases, National Institutes of Health, United States
- Biomedical Sciences Graduate Program, University of California, San Francisco, United States
- Department of Medicine, University of California, San Francisco, United States
- Department of Pediatrics, University of California, San Francisco, United States
- Eli and Edythe Broad Center of Regeneration Medicine and Stem Cell Research, University of California, San Francisco, United States
- Chan Zuckerberg Biohub, United States
Figures
Figure 1 with 2 supplements
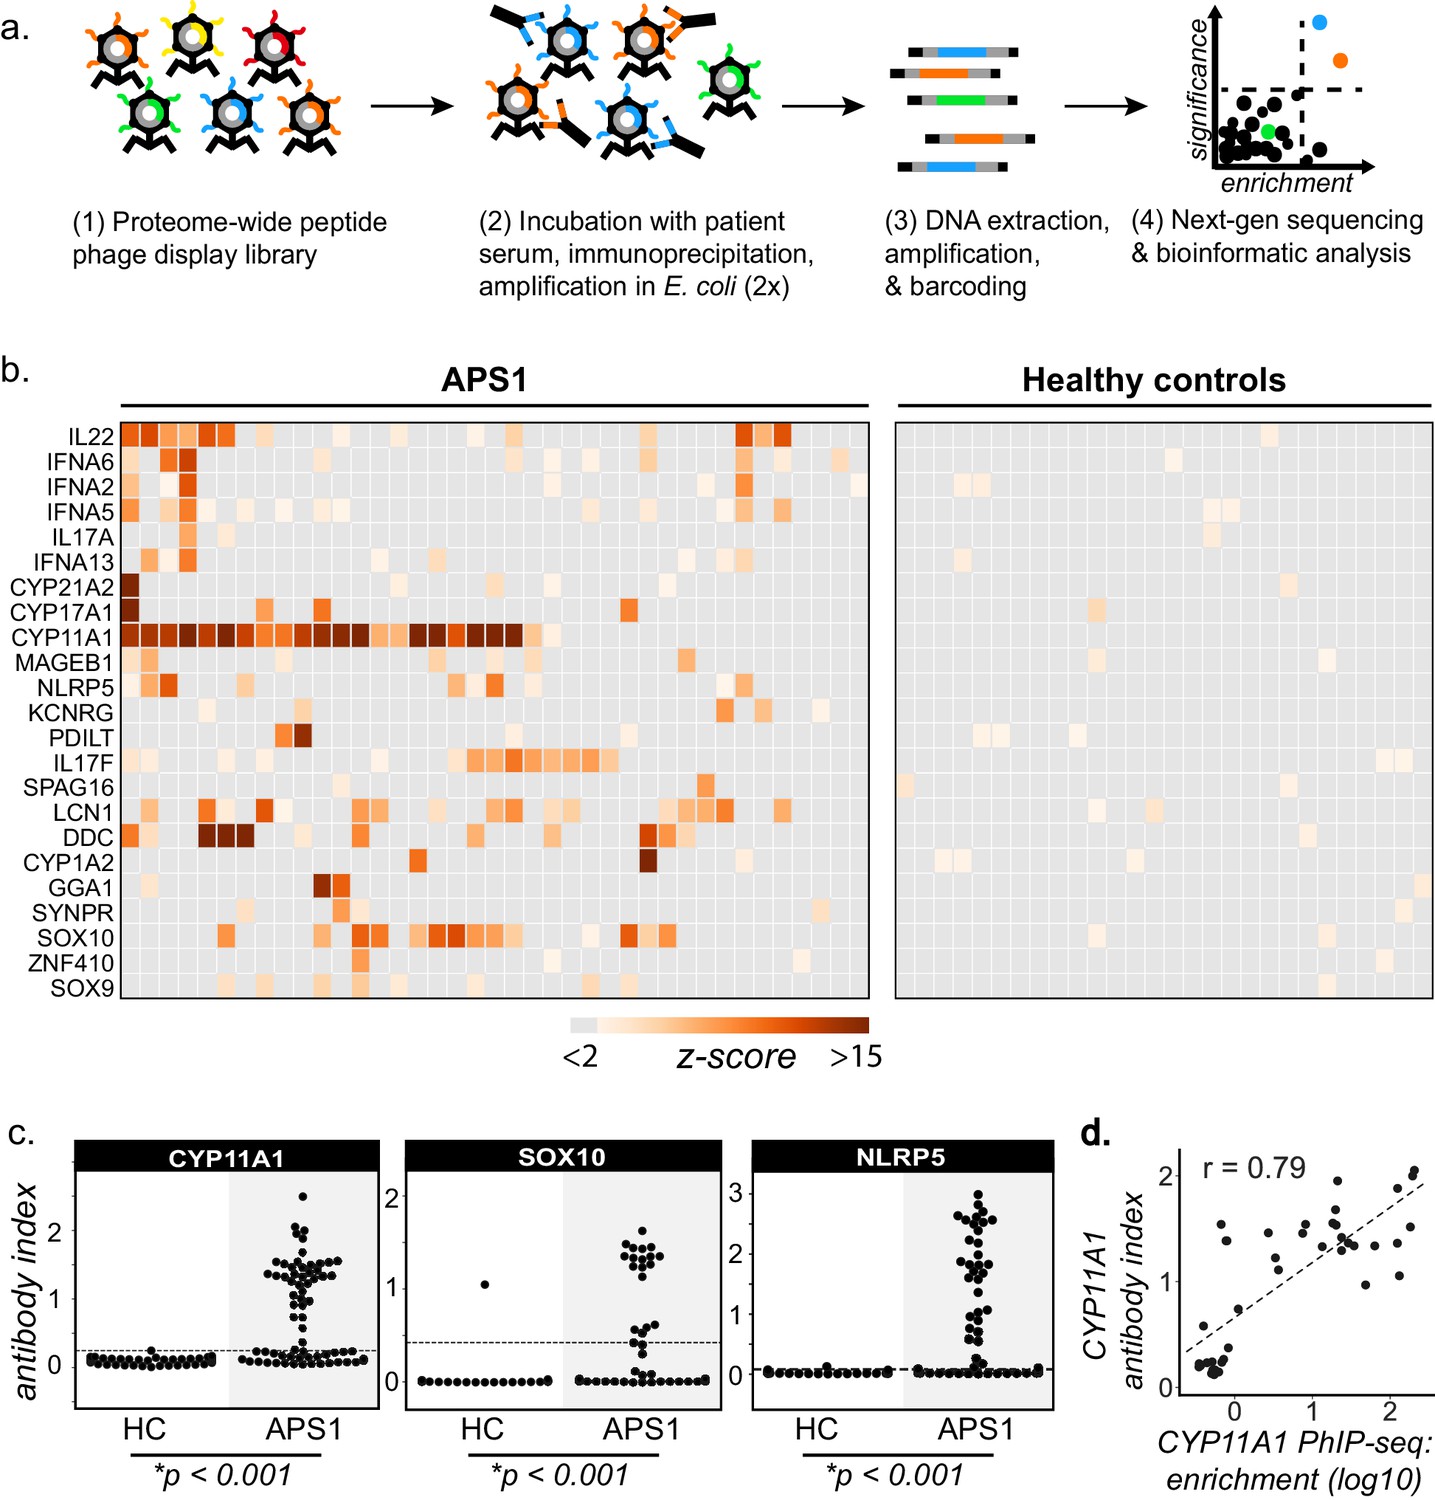
PhIP-Seq identifies literature-reported autoantigens in APS1.
(A) Overview of PhIP-Seq experimental workflow. (B) PhIP-Seq identifies known autoantibody targets in APS1. Hierarchically clustered (Pearson) z-scored heatmap of literature reported autoantigens with 10-fold or greater signal over mock-IP in at least 2/39 APS1 sera and in 0/28 non-APS1 control sera. (C) Radioligand binding assay (RLBA) orthogonal validation of literature-reported antigens CYP11A1, SOX10, and NLRP5 within the expanded cohort of APS1 (n = 67) and non-APS1 controls (n = 61); p-value was calculated across all samples using a Mann-Whitney U test. Dashed line indicates mean of healthy control signal + 3 standard deviations. (D) CYP11A1 RLBA antibody index and CYP11A1 PhIP-Seq enrichment are well correlated (Pearson, r = 0.79).
Figure 1—figure supplement 1
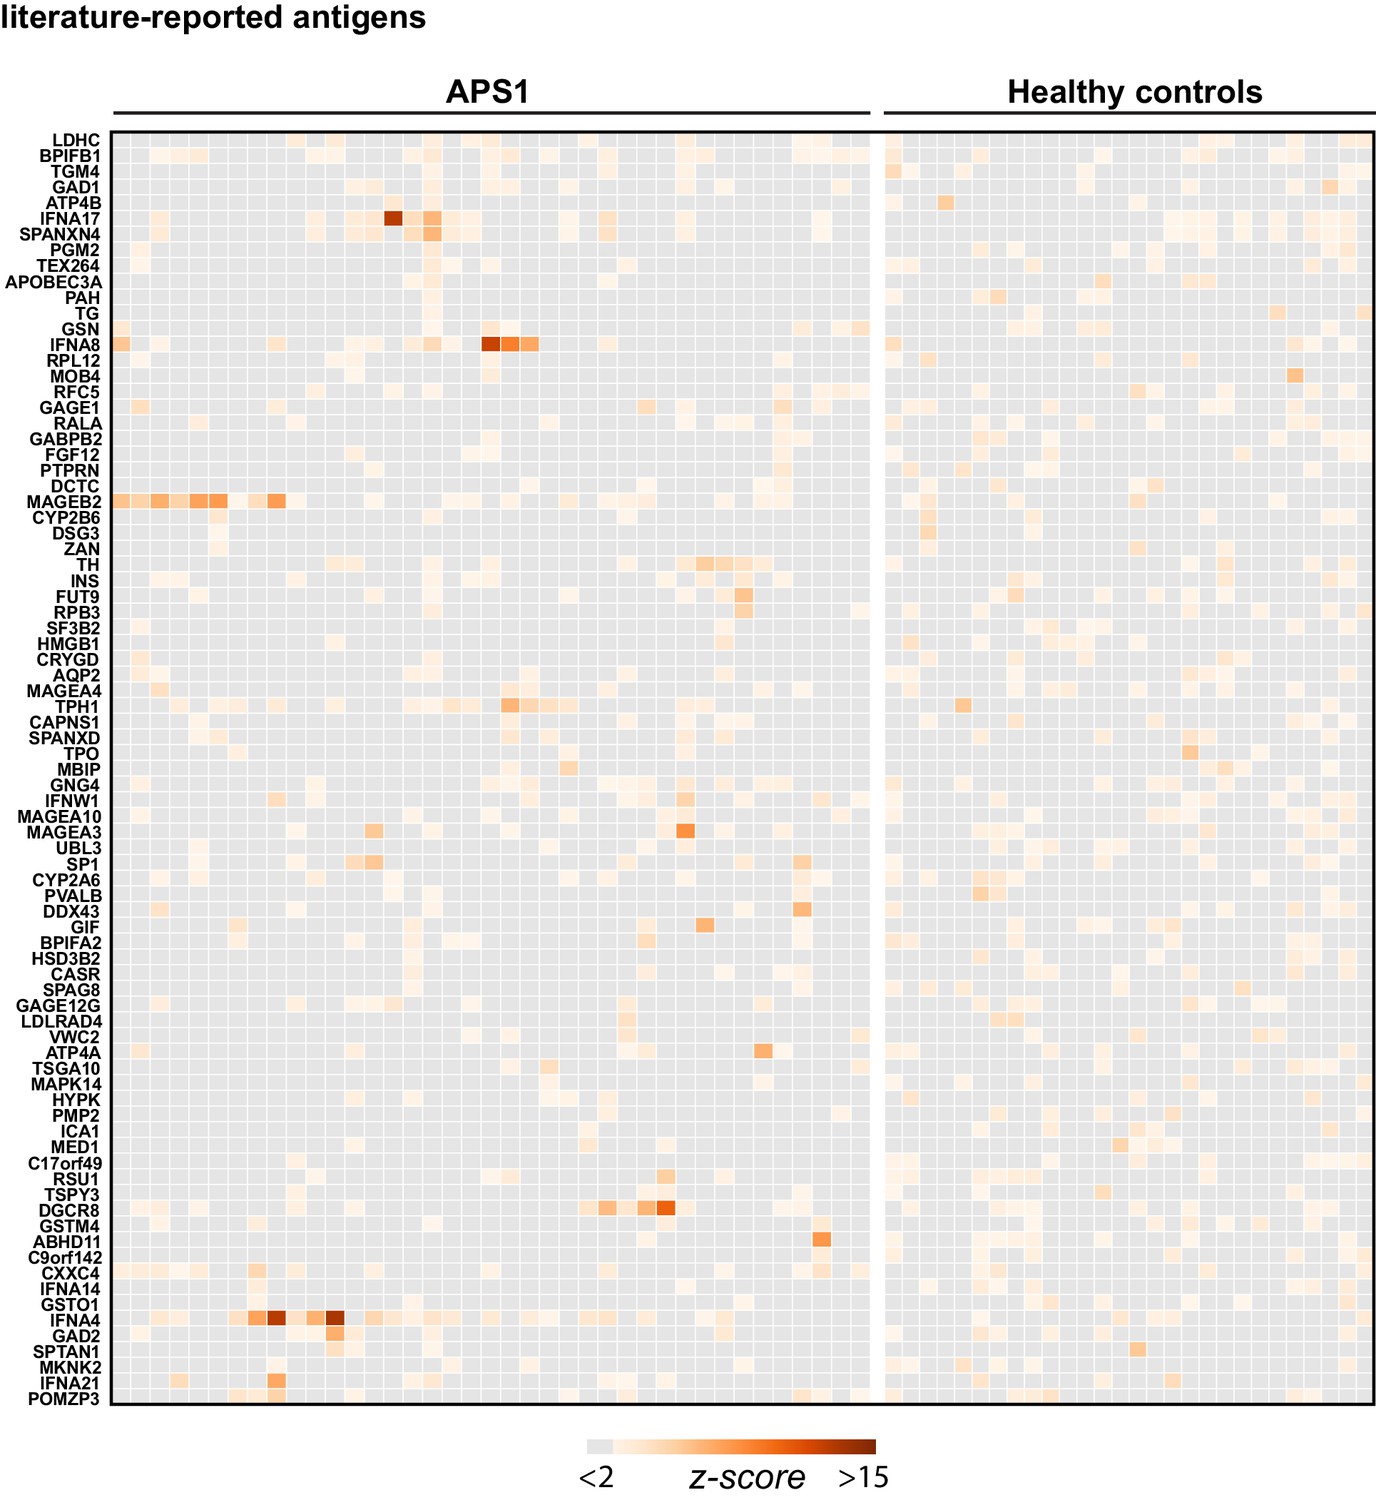
Hierarchically clustered (Pearson) z-scored heatmap of literature reported autoantigens that did not meet the cutoff of 10-fold or greater signal over mock-IP in at least 2/39 APS1 sera and in 0/28 non-APS1 control sera.
Figure 1—figure supplement 2
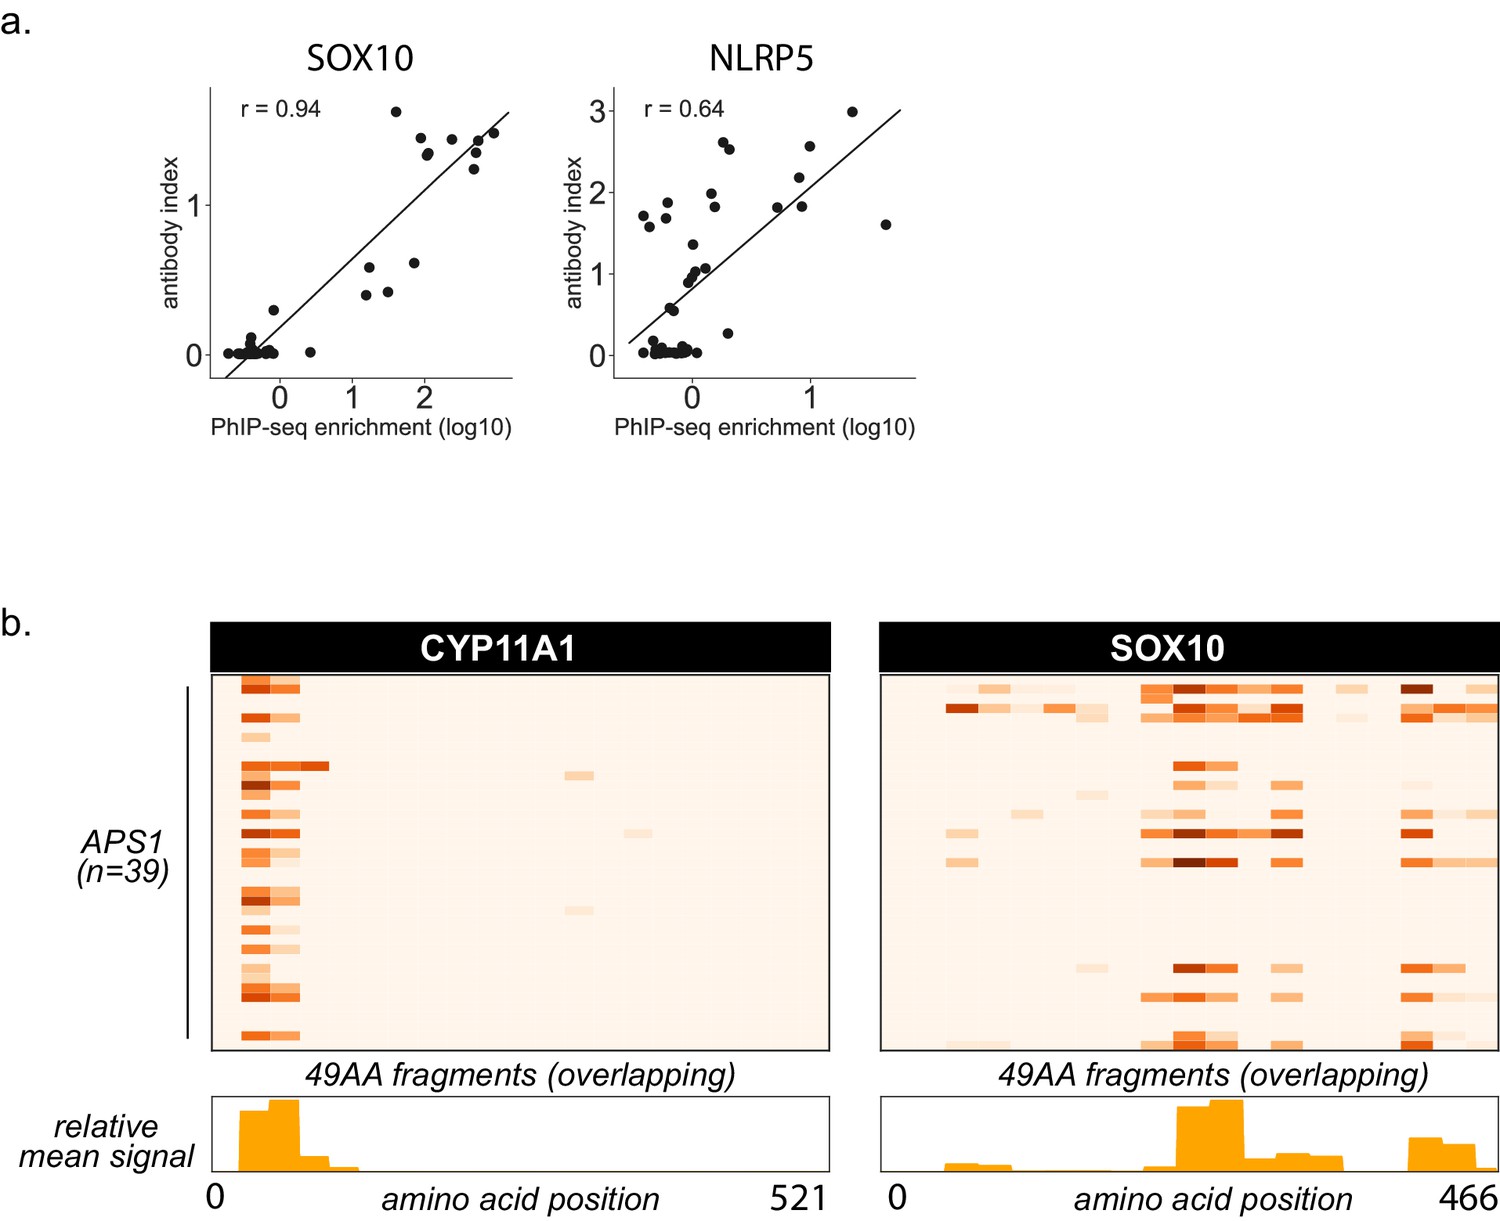
Additional PhIP-Seq data for known autoantigens SOX10 and NLRP5.
(A) Scatterplot of individual PhIP-Seq enrichment values (log10) over mock-IP as compared to radioligand binding assay antibody index values (1 = commercial antibody signal) for known antigens SOX10 and NLRP5, with Pearson correlation coefficient r. (B) PhIP-Seq enables 49 amino acid resolution of antibody signal from APS1 sera to literature-reported antigens CYP11A1 and SOX10. Top panels: PhIP-Seq signal (fold-change of each peptide as compared to signal from mock-IP, log10-scaled) for fragments 1–21 for CYP11A1 and fragments 1–19 for SOX10. Bottom panels: Trace of normalized signal for CYP11A1 and SOX10 fragments across the mean of all 39 APS1 sera.
Figure 2 with 1 supplement
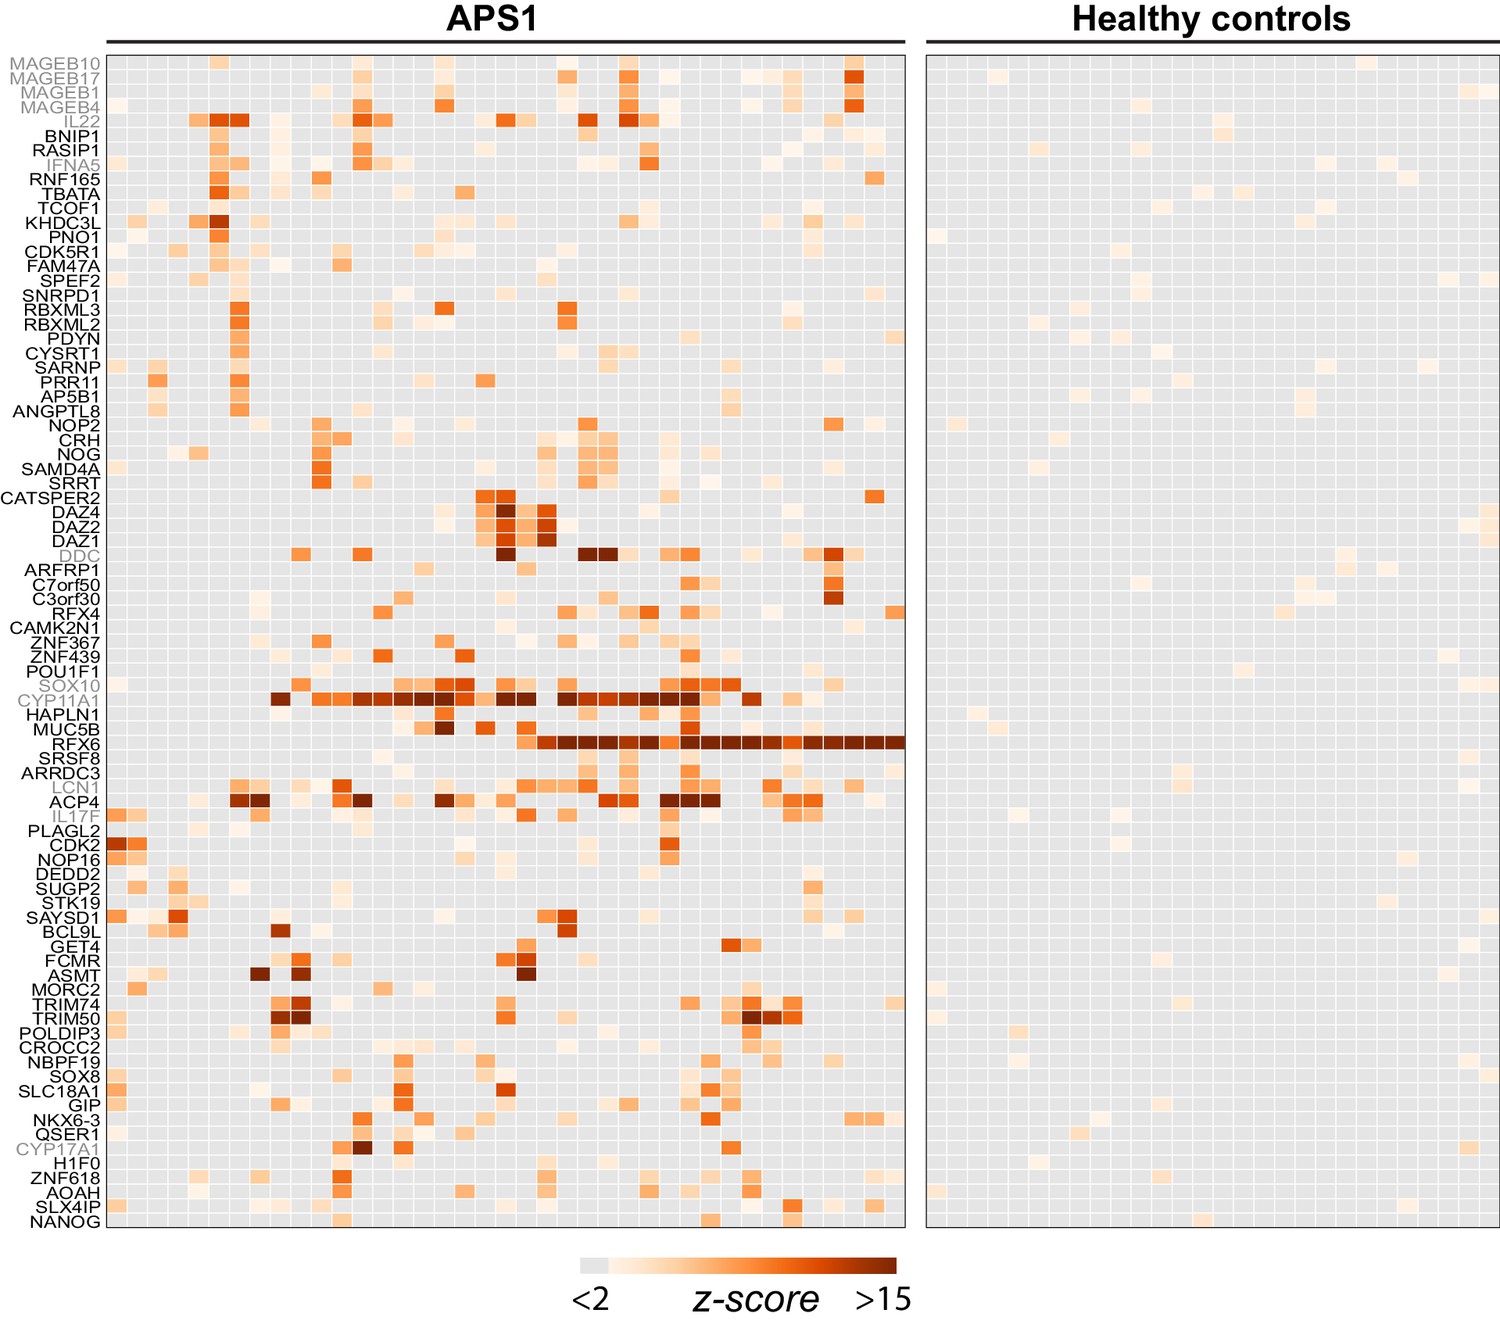
PhIP-Seq identifies novel (and known) antigens across multiple APS1 sera.
(A) Hierarchically clustered (Pearson) z-scored heatmap of all genes with 10-fold or greater signal over mock-IP in at least 3/39 APS1 sera and in 0/28 non-APS1 sera. Black labeled antigens (n = 69) are potentially novel and grey labeled antigens (n = 12) are previously literature-reported antigens.
Figure 2—figure supplement 1
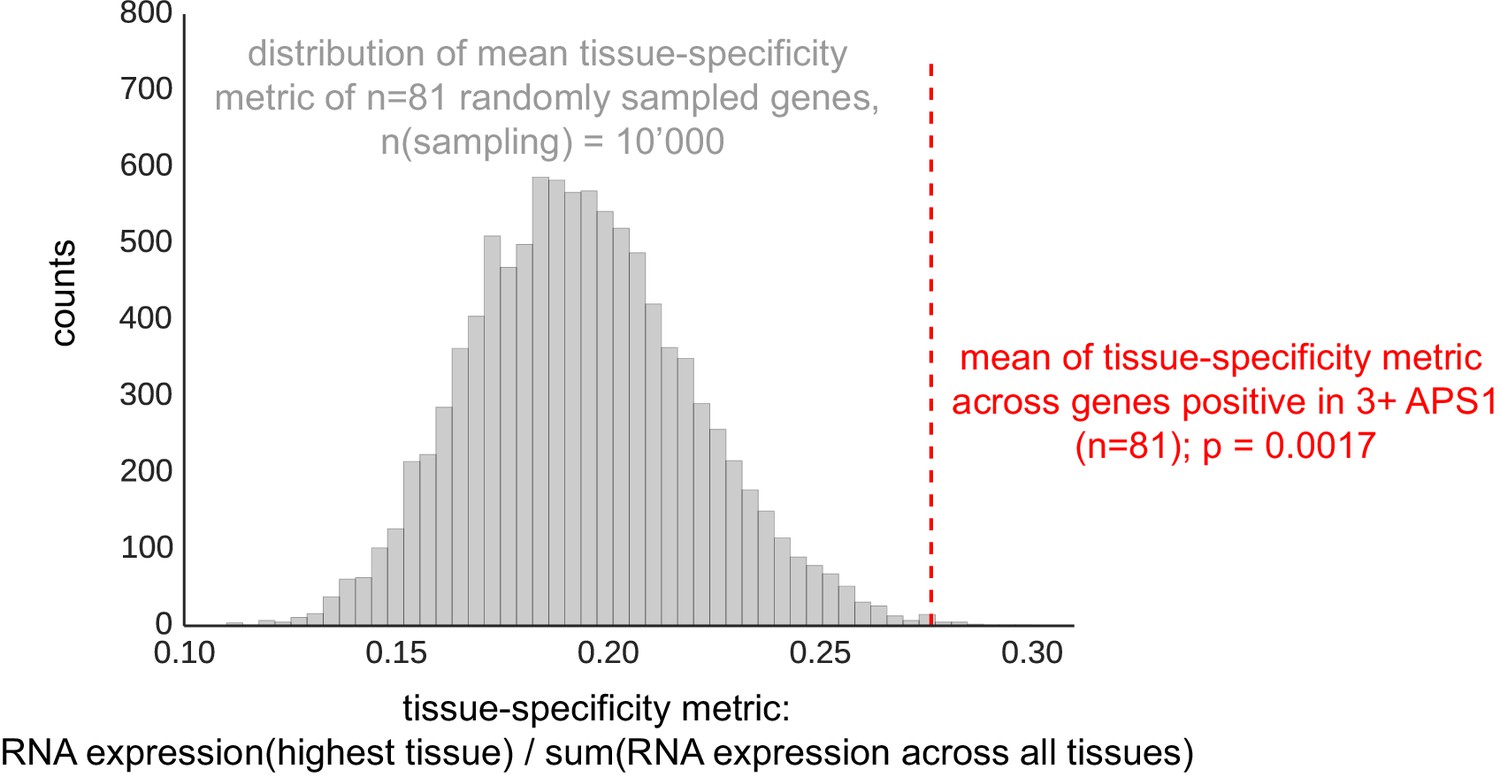
The mean of tissue-specificity ratio of 81 PhIP-Seq antigens (Figure 2) is increased as compared to the tissue-specificity ratio of n = 81 randomly sampled genes (n-sampling = 10’000).
Data from Protein Atlas, HPA/Gtex/Fantom5 RNA consensus dataset (https://www.proteinatlas.org/about/download; Uhlén et al., 2015).
Figure 3 with 1 supplement
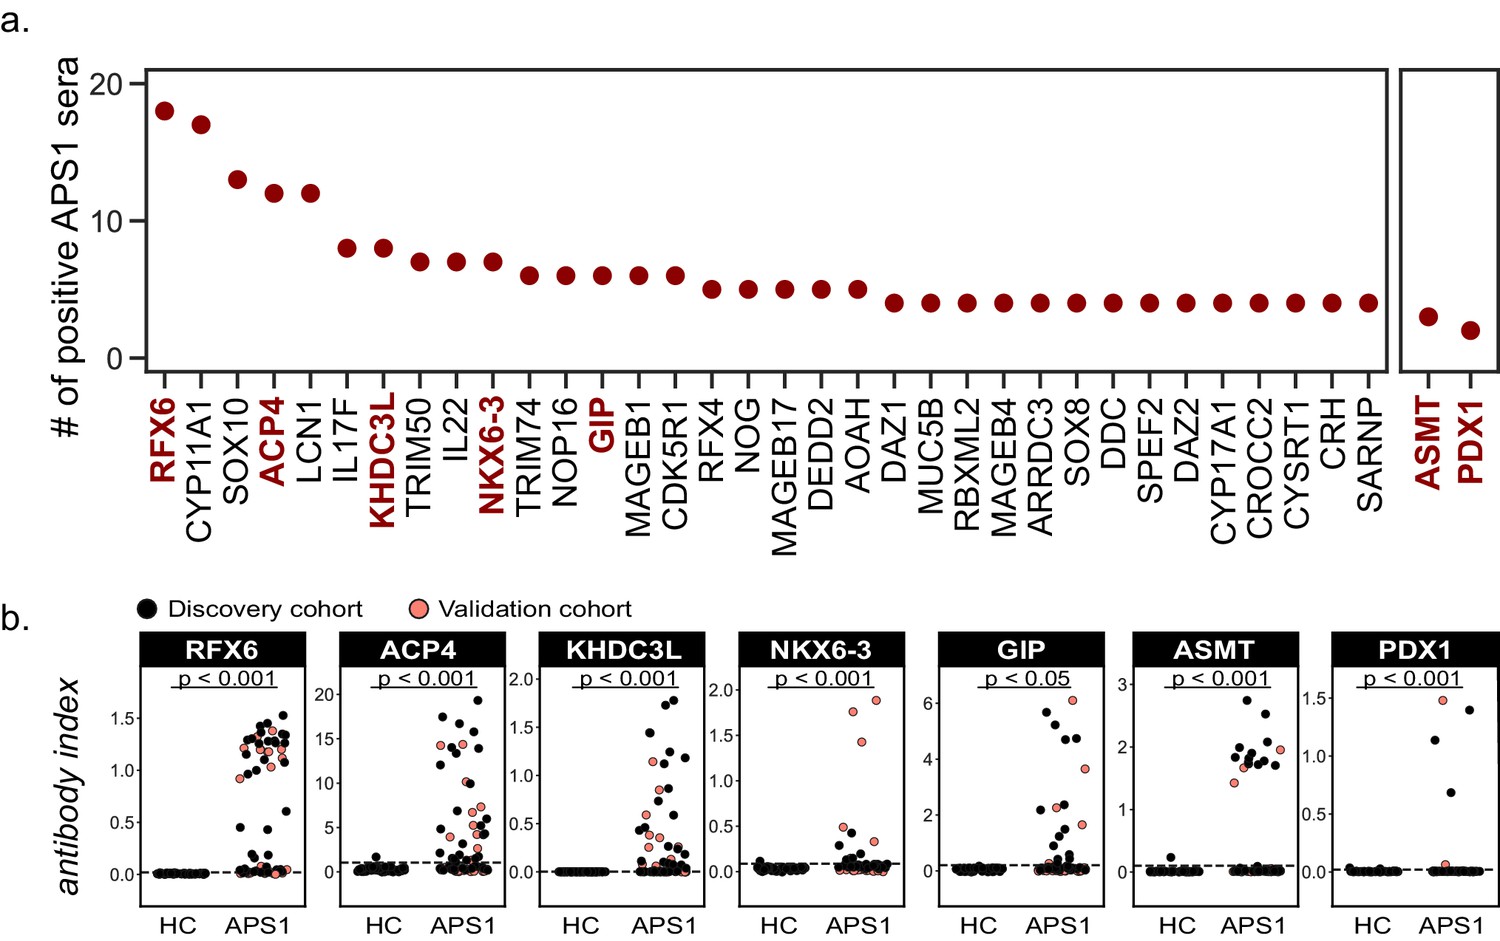
Novel PhIP-Seq autoantigens are shared across multiple APS1 samples and validate in whole protein binding assays.
(A) Graph of the PhIP-seq autoantigens from Figure 2 that were shared across the highest number of individual APS1 sera (left panel). ASMT and PDX1 were positive hits in 3 and 2 sera, respectively, but are known to be highly tissue specific (right panel). Genes in red were chosen for validation in whole protein binding assay. (B) Validation of novel PhIP-Seq antigens by radiolabeled binding assay, with discovery cohort (black, nAPS1 = 39), validation cohort (light red, nAPS1 = 28) and non-APS1 control cohort (nHC = 61). P-value was calculated across all samples using a Mann-Whitney U test. Dashed line indicates mean of healthy control signal + 3 standard deviations.
Figure 3—figure supplement 1

Comparison of PhIP-Seq data to orthonongal whole-protein binding assays.
(A) Scatterplot of individual PhIP-Seq enrichment values (log10) over mock-IP as compared to radioligand binding assay antibody index values (1 = commercial antibody signal) for novel antigens ACP4, ASMT, GIP, RFX6, KHDC3L, NKX6.3, and PDX1, with Pearson correlation coefficient r (Note that for PDX1, there are insufficient positive data points for the correlation to be meaningful). (B) ACP4 RLBA autoantibody index, broken down by enamel hypoplasia (EH) status.
Figure 4 with 2 supplements
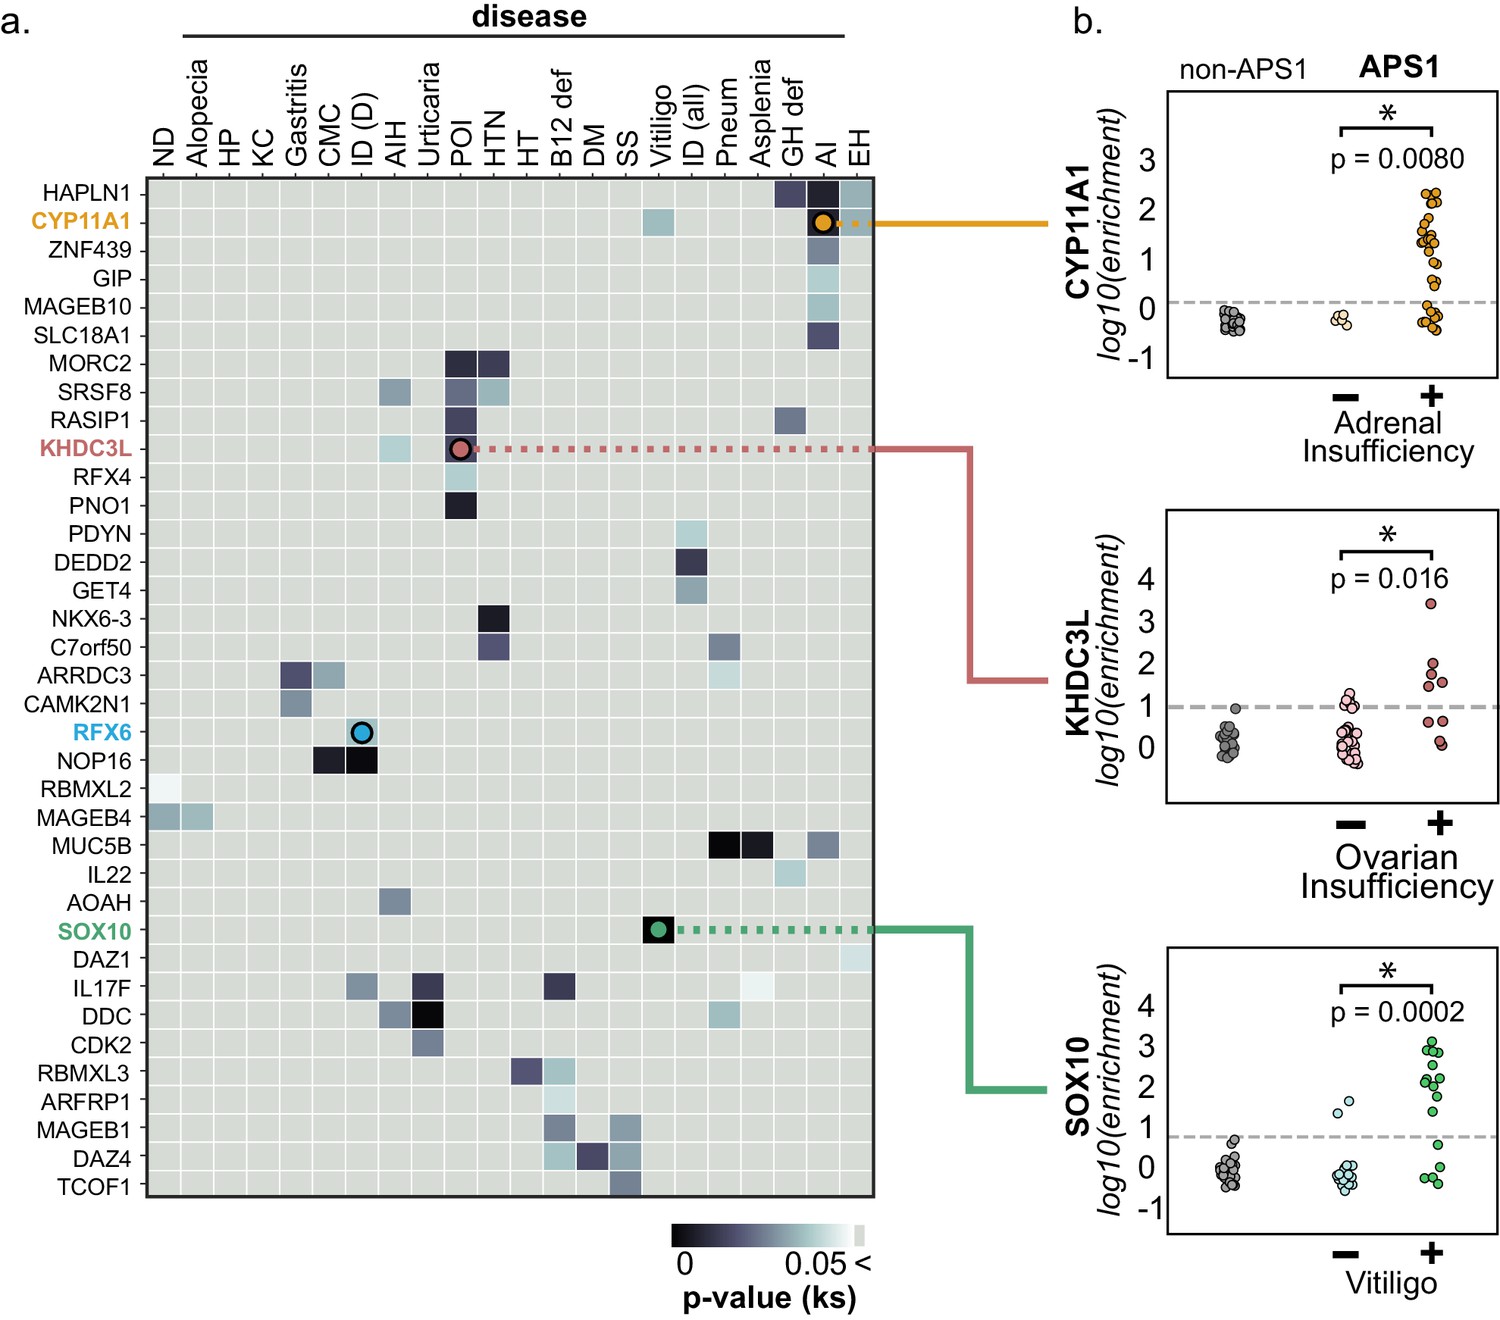
PhIP-Seq reproduces known clinical associations with anti-CYP11A1 and anti-SOX10 antibodies.
(A) Heatmap of p-values (Kolmogorov-Smirnov testing) for differences in gene enrichments for individuals with versus without each clinical phenotype. Significant p-values in the negative direction (where mean PhIP-Seq enrichment is higher in individuals without disease) are masked (colored as p>0.05). (B) Anti-CYP11A1 PhIP-Seq enrichments are significantly different between APS1 patients with and without adrenal insufficiency (top panel; Kolmogorov-Smirnov test). Anti-SOX10 PhIP-Seq enrichments are significantly different between APS1 patients with and without Vitiligo (bottom panel). Anti-KHDC3L PhIP-Seq enrichments are significantly different between APS1 patients with and without ovarian insufficiency (middle panel). ND, nail dystrophy. HP, hypoparathyroidism. KC, keratoconjunctivitis. CMC, chronic mucocutaneous candidiasis. ID (D), Intestinal dysfunction (diarrheal-type). AIH, autoimmune hepatitis. POI, primary ovarian insufficiency. HTN, hypertension. HT, hypothyroidism. B12 def, B12 (vitamin) deficiency. DM, diabetes mellitus. SS, Sjogren’s-like syndrome. Pneum, Pneumonitis. GH def, Growth hormone deficiency. AI, Adrenal Insufficiency. EH, (dental) enamel hypoplasia.
Figure 4—figure supplement 1
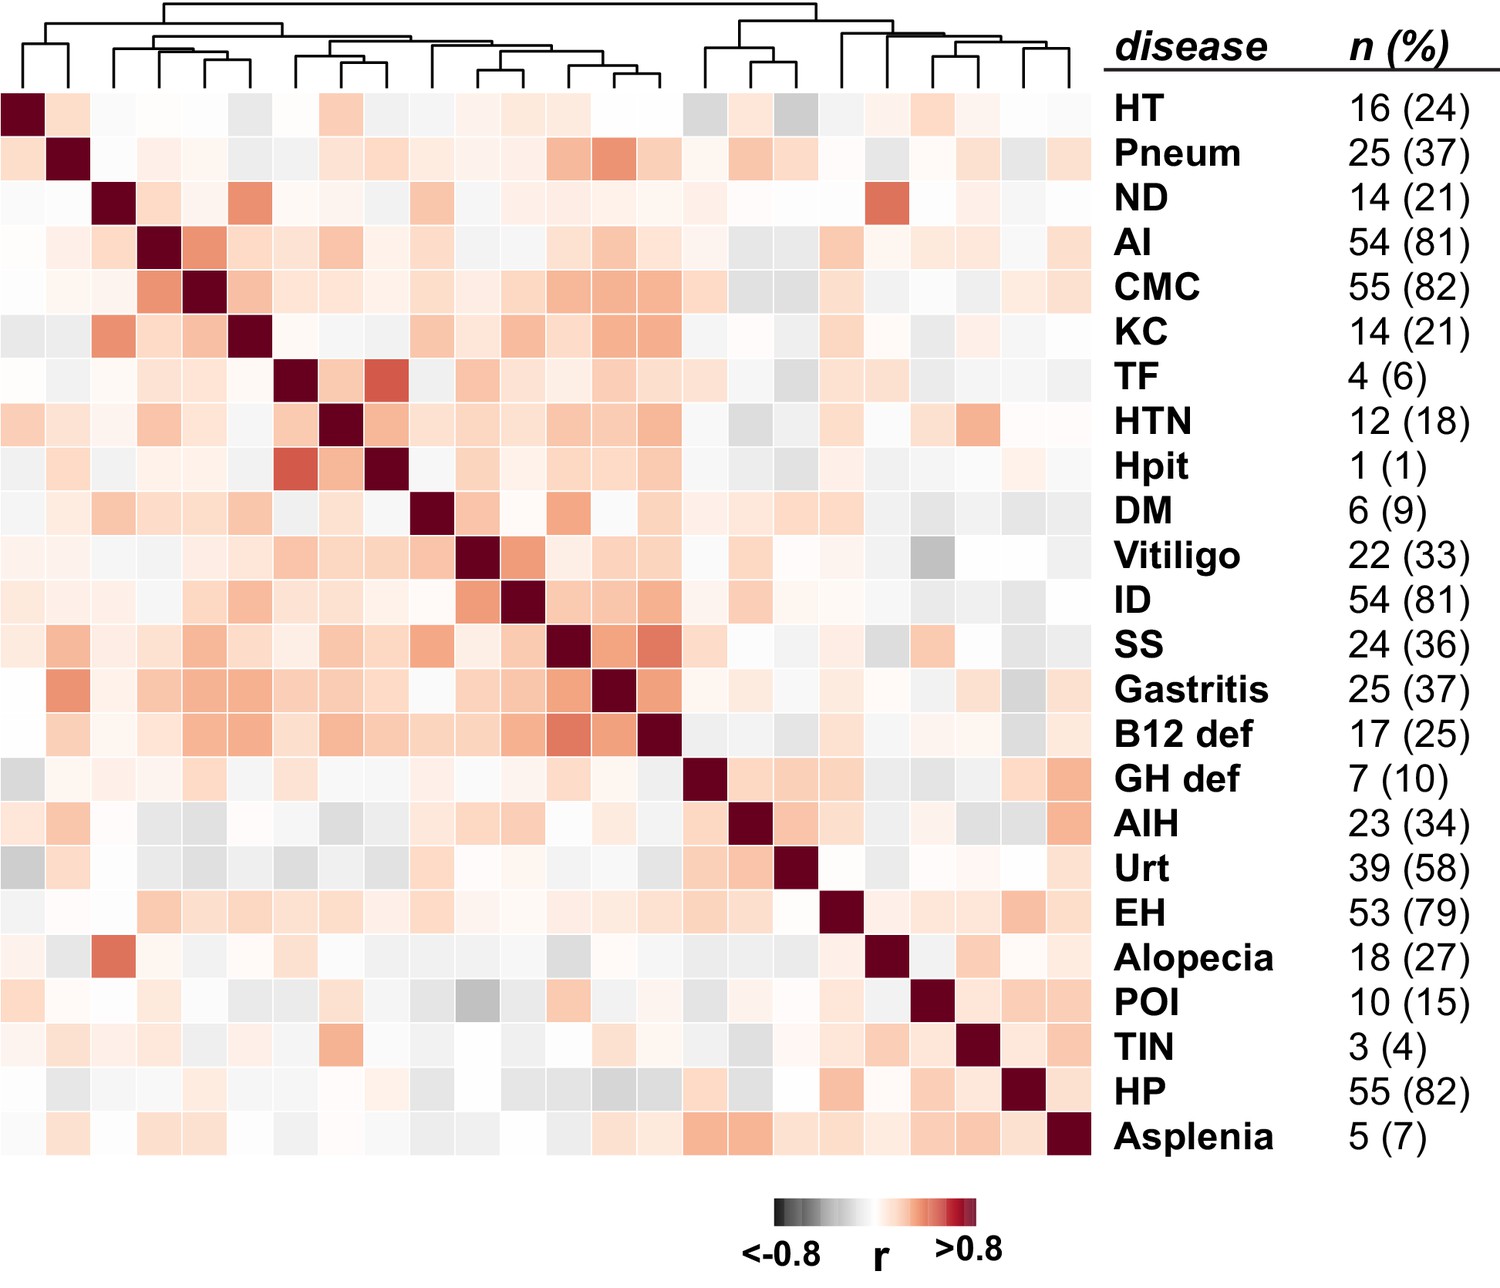
Clustered disease correlations in the APS1 cohort (Spearman’s rank correlation; n = 67).
Figure 4—figure supplement 2
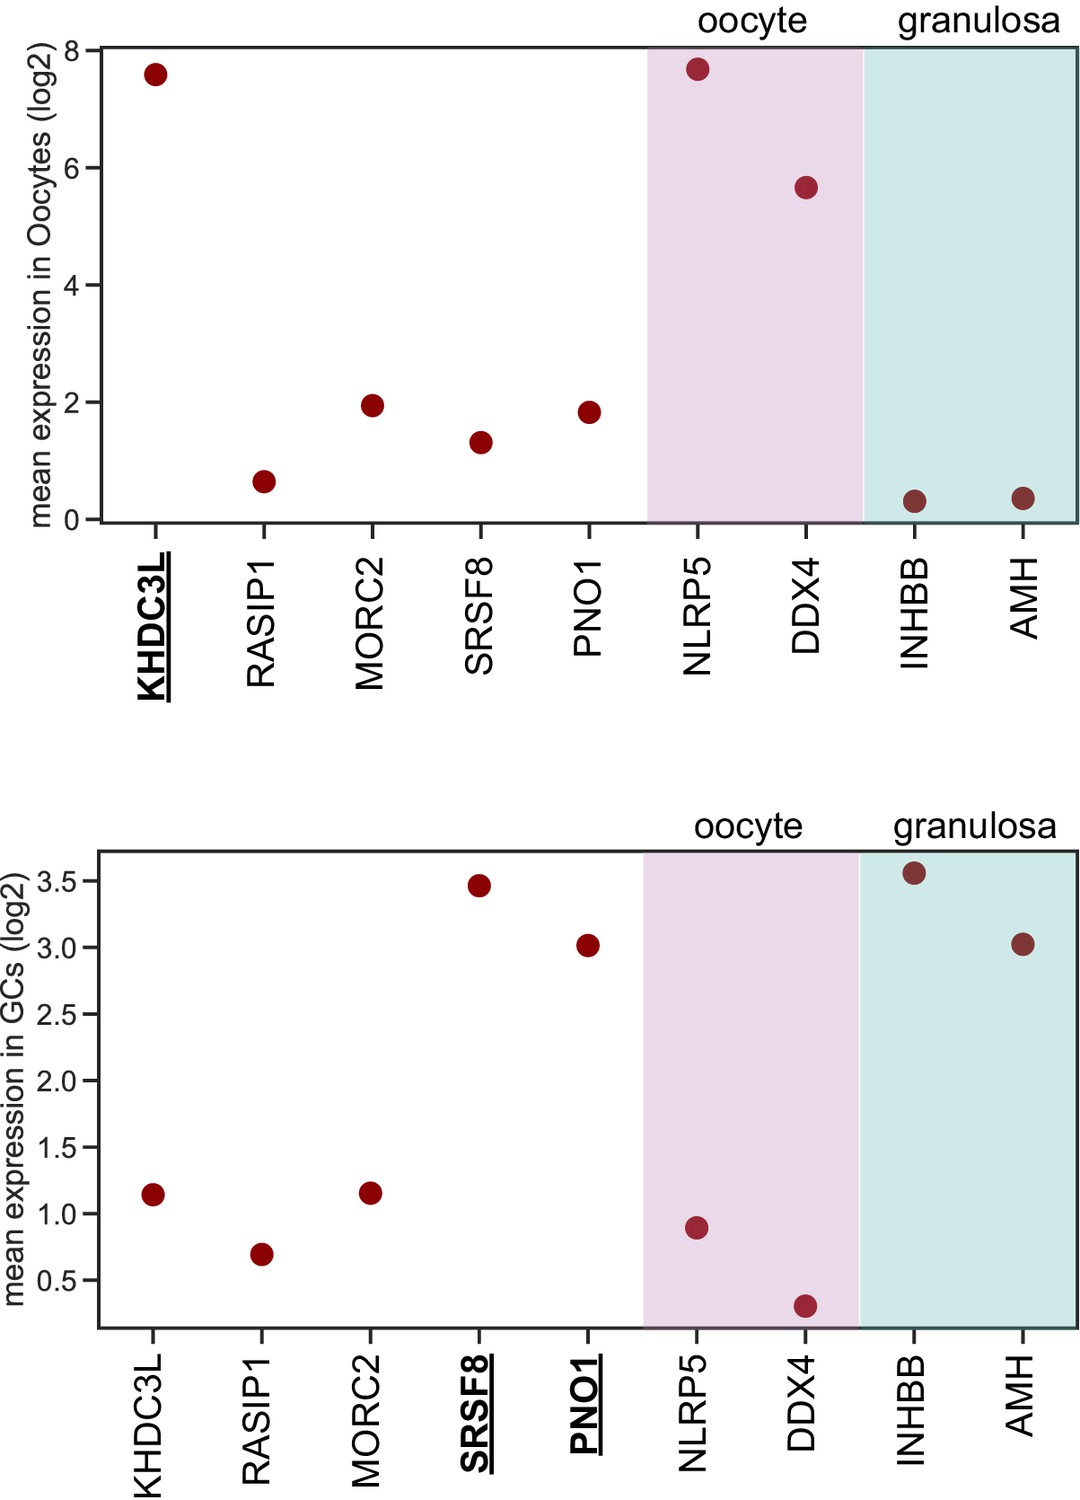
KHDC3L is highly expressed in oocytes (top), but not in granulosa cells (bottom).
In contrast, SRSF8 and PNO1 are highly expressed in granulosa cells (GCs), but not in oocytes. Data from Zhang et al. (2018).
Figure 5
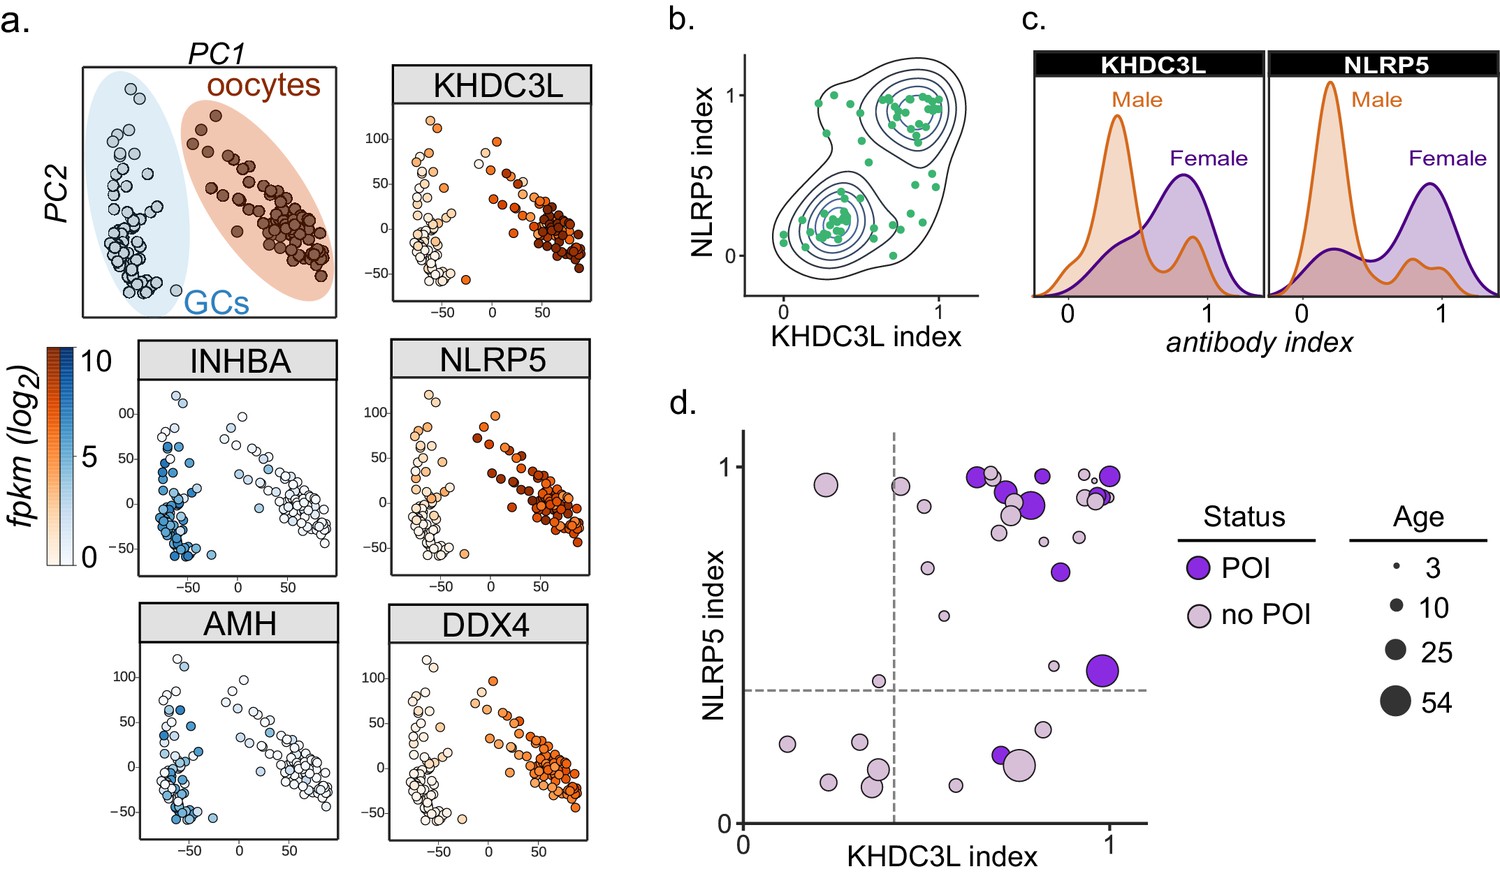
Autoantibodies to oocyte-expressed protein KHDC3L are associated with ovarian insufficiency.
(A) Principle component analysis of transcriptome of single human oocytes (red) and granulosa cells (GCs, blue); data re-analyzed from Zhang et al. (2018). KHDC3L is highly expressed in oocytes, along with binding partner NLRP5 and known oocyte marker DDX4. For comparison, known GC markers INHBA and AMH are primarily expressed in the GC population. (B) APS1 sera that are positive for one of anti-KHDC3L and anti-NLRP5 autoantibodies tend to also be positive for the other. (C) Antibody indices for both KHDC3L and NLRP5 are increased in females with APS1. (D) Antibody indices for females with APS1 by age; All 10 patients with primary ovarian insufficiency (POI) are positive for anti-KHDC3L antibodies. Of note, many of the individuals with anti-KHDC3L antibodies but without POI are younger and therefore cannot be fully evaluated for ovarian insufficiency.
Figure 6 with 3 supplements

APS1 patients with intestinal dysfunction mount an antibody response to intestinal enteroendocrine cells and to enteroendocrine-expressed protein RFX6.
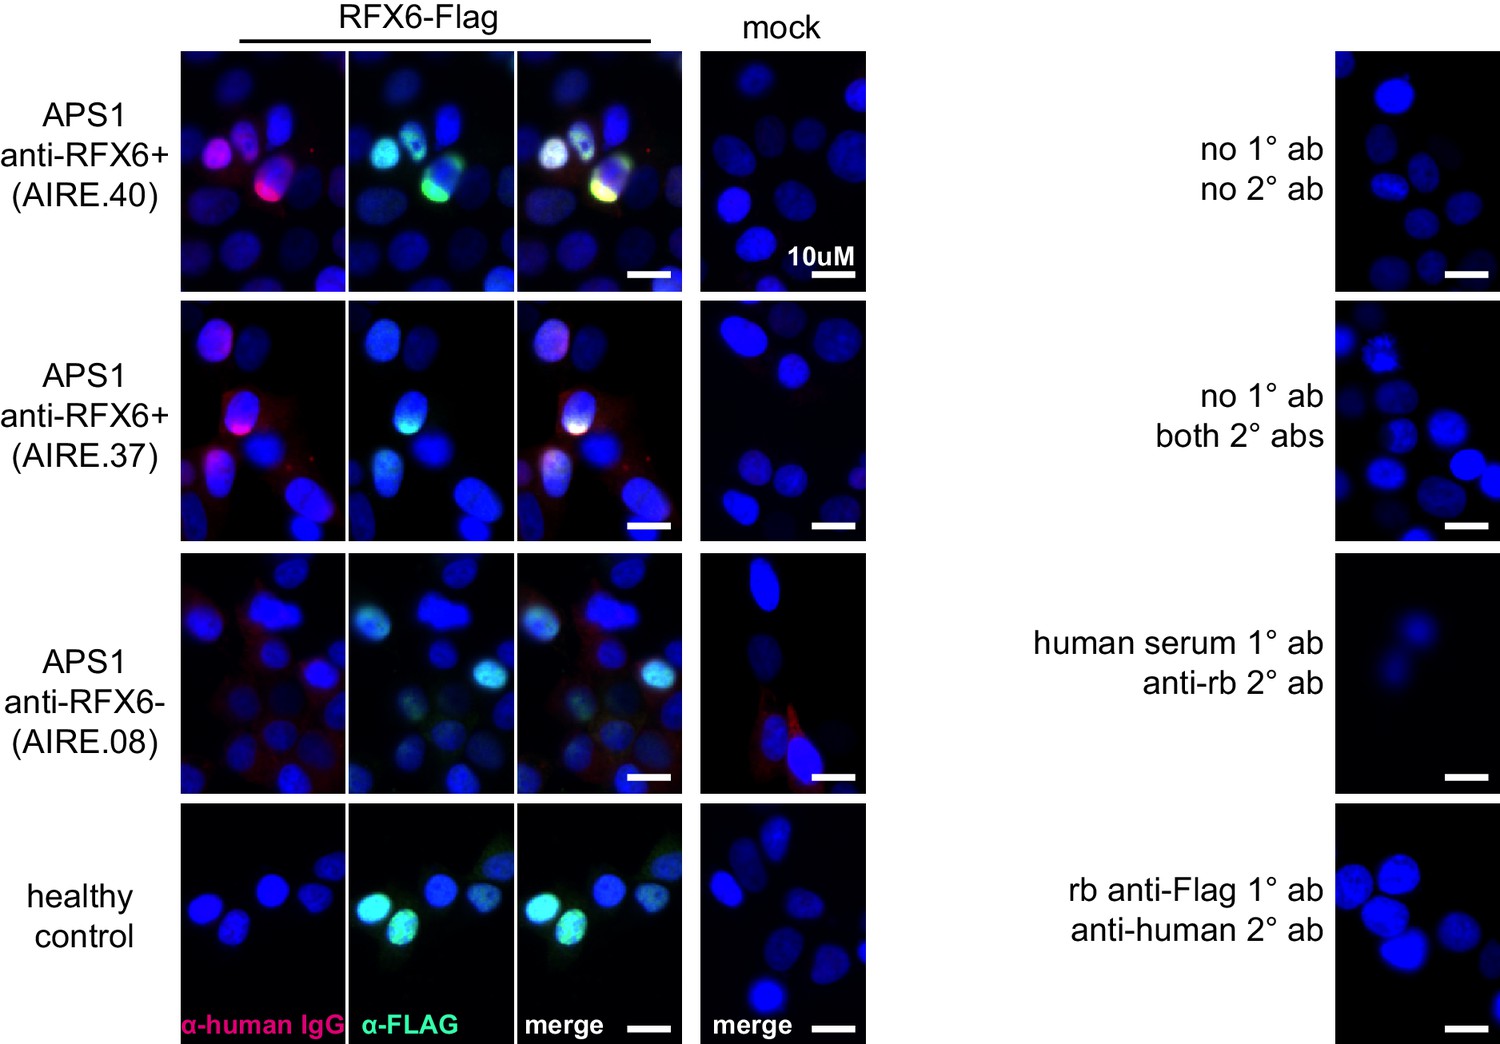
(A) Anti-RFX6 positive APS1 serum with intestinal dysfunction co-stains Chromogranin-A (ChgA) positive enteroendocrine cells in a nuclear pattern (right panel and inset). In contrast, non-APS1 control sera as well as anti-RFX6 negative APS1 serum do not co-stain ChgA+ enteroendocrine cells (left and center panels). (B) Anti-RFX6+ serum, but not anti-RFX6- serum, co-stains HEK293T cells transfected with an RFX6-expressing plasmid (see also: Figure 6—figure supplement 2). (C) Radioligand binding assay (RLBA) anti-RFX6 antibody index is significantly higher across individuals with intestinal dysfunction (ID; Mann-Whitney U, p=0.006). Purple color indicates samples that fall above 6 standard deviations of the mean non-APS1 control RLBA antibody index. (D) Individuals with the diarrheal subtype of ID have a higher frequency of anti-RFX6 antibody positivity as compared to those with constipation-type ID (Mann-Whitney U, p=0.0028) or no ID (p=0.0015).
Figure 6—figure supplement 1
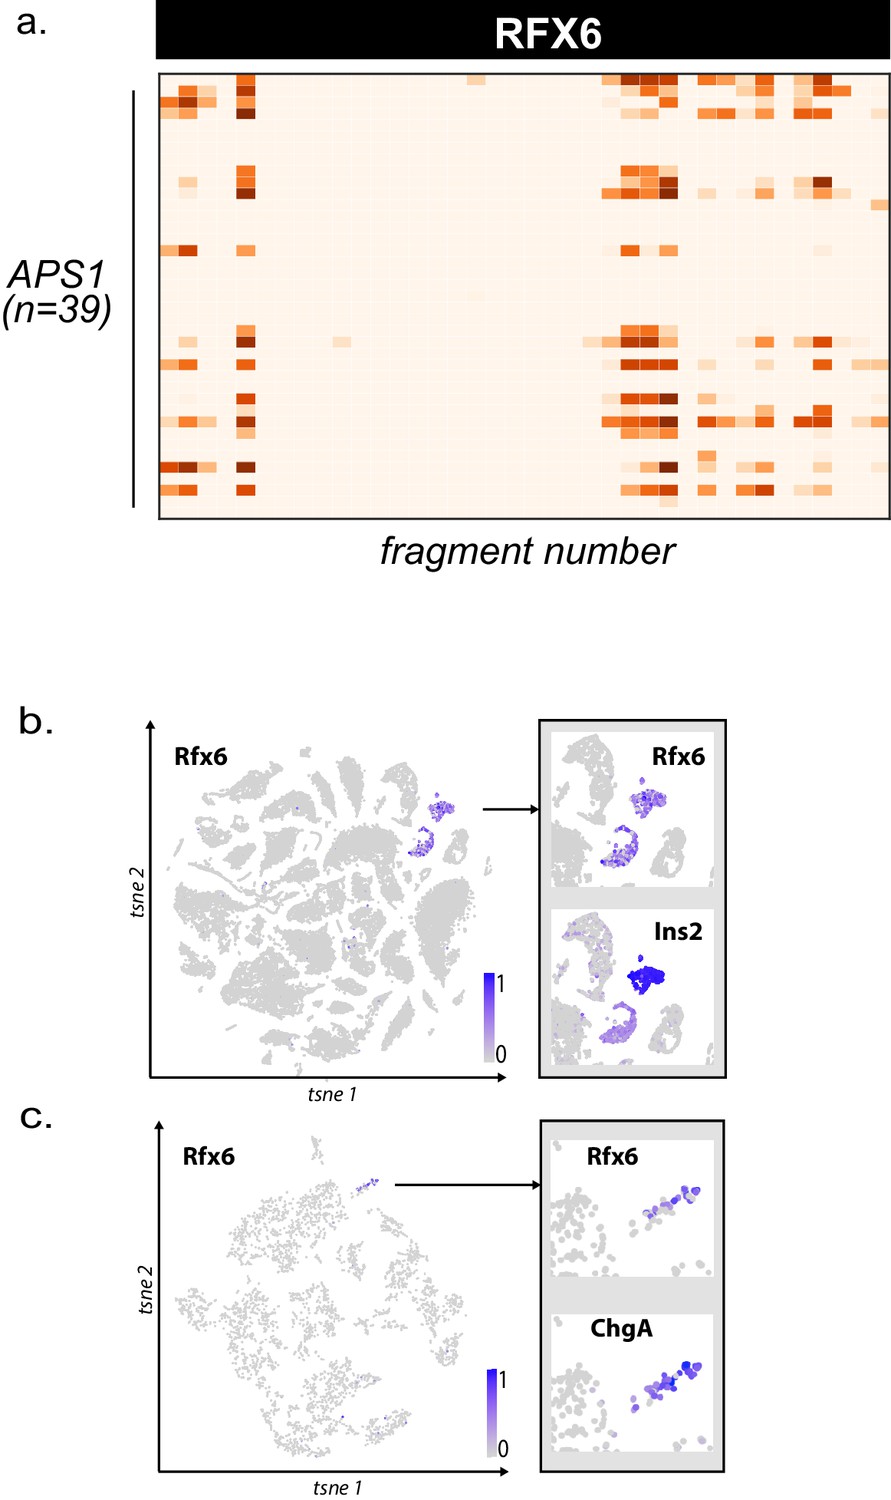
Higher resolution PhIP-seq and transcriptional data for novel autoantigen RFX6.
(A) PhIP-Seq enables 49 amino acid resolution of antibody signal from novel autoantigen RFX6. PhIP-Seq signal (fold-change of each peptide as compared to signal from mock-IP, log10-scaled) for fragments 1–38 for RFX6 from APS1 sera (n = 39). (B) Single cell RNA expression of Rfx6. Left: normalized RNA expression of Rfx6 in single cells from 20 different organs. Right inset: Rfx6 shares an expression pattern with pancreatic beta-cell marker Ins2 (Schaum et al., 2018). (C) Single cell RNA expression of Rfx6. Left: normalized RNA expression of Rfx6 in single cells from the intestine. Right inset: Rfx6 shares an expression pattern with intestinal enteroendocrine cell marker ChgA (Schaum et al., 2018).
Figure 6—figure supplement 2
Anti-RFX6+ sera (top two panels), but not anti-RFX6- serum or non-APS1 control serum (bottom two panels), co-stain HEK293T cells transfected with an RFX6-expressing plasmid.
None of the sera tested stain 293T cells transfected with empty vector (‘mock’). No cross-reactivity of secondary antibodies was observed (right panel).
Figure 6—figure supplement 3
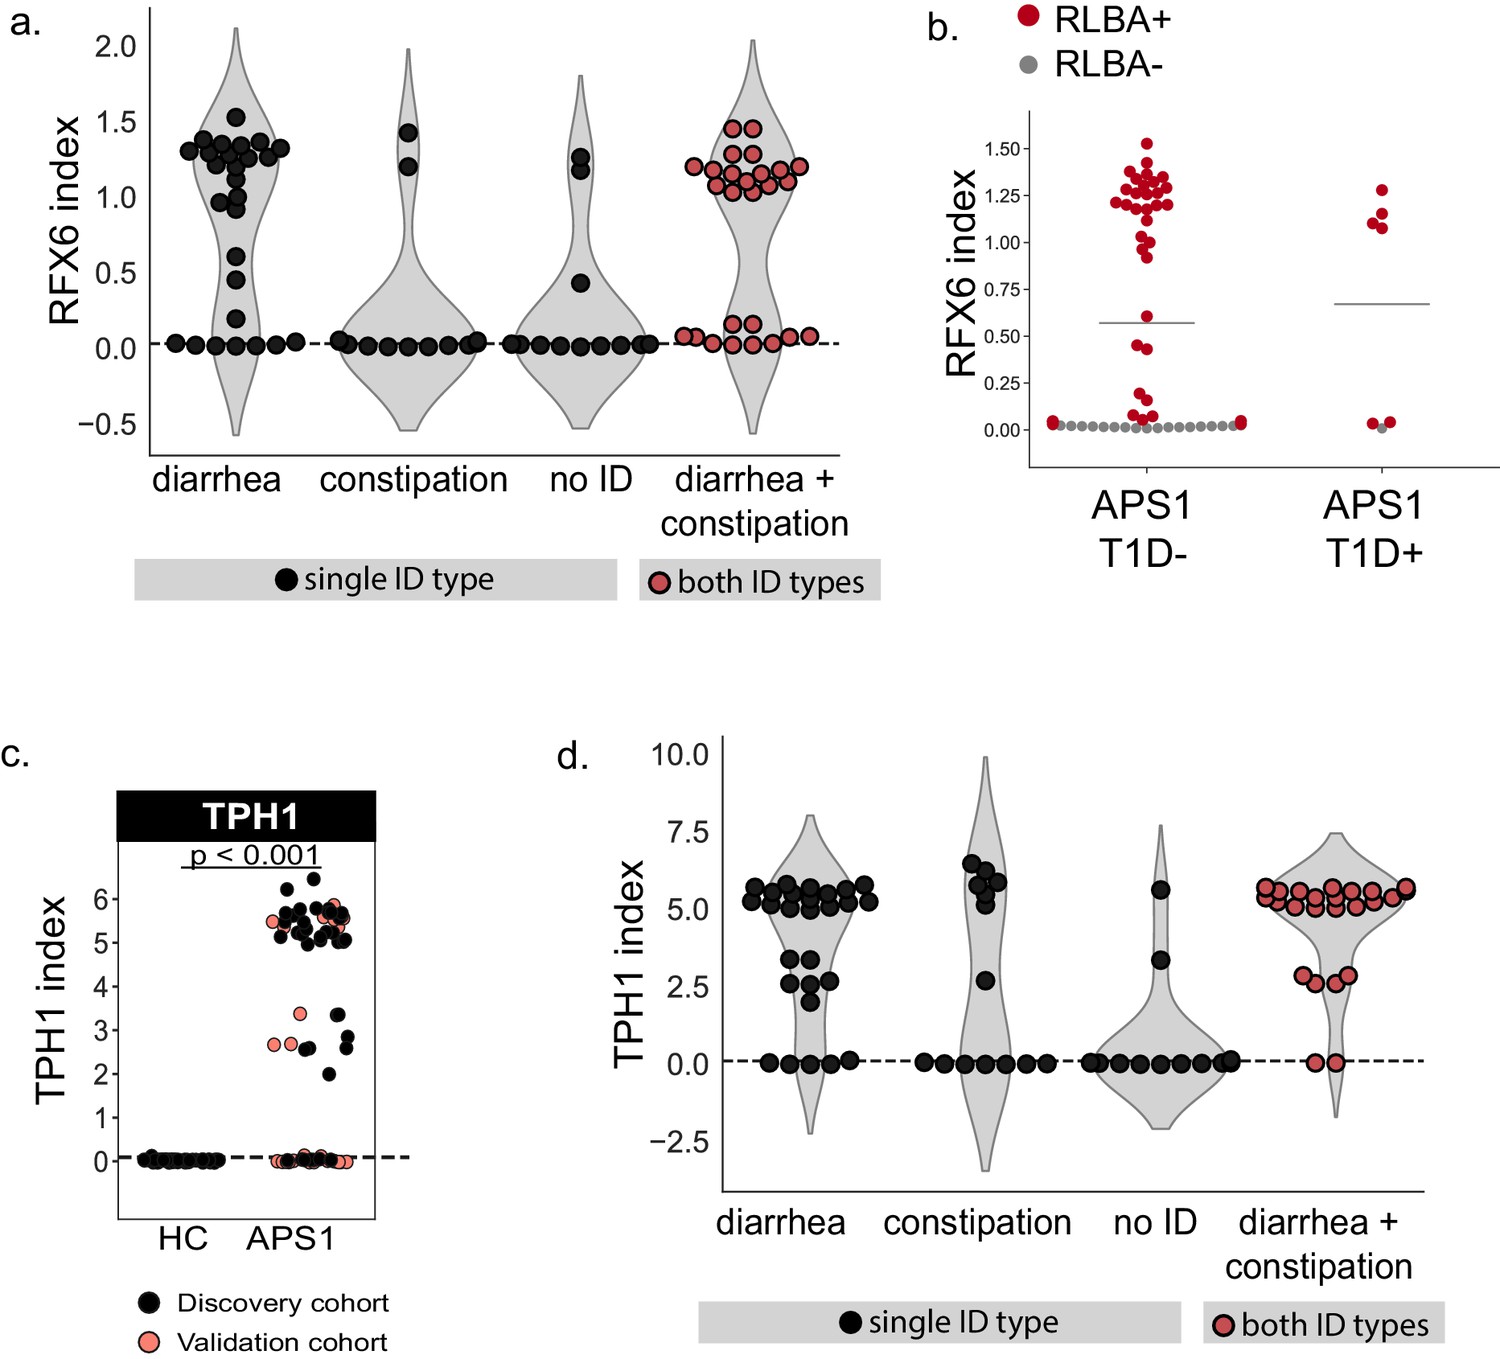
Extended validation and clinical correlations for intestinal antigens RFX6 and TPH1.
(A) APS1 patients with the diarrheal subtype, as well as those with both subtypes of ID (red), have increased anti-RFX6 antibody signal by RLBA as compared to those with constipation-type ID or no ID. (B) 6/7 (6 diagnosed prior to serum draw, 1 diagnosed post serum draw) APS1 patients with type 1 diabetes have positive anti-RFX6 signal by RLBA. (C) Validation of known ID-associated antigen TPH1 by radiolabeled binding assay, with discovery cohort (black, nAPS1 = 39), validation cohort (light red, nAPS1 = 28) and non-APS1 control cohort (nHC = 61). P-value was calculated across all samples using a Mann-Whitney U test. (D) APS1 patients with ID have increased anti-TPH1 antibody signal by RLBA as compared to those with no ID. However, anti-TPH1 antibodies are distributed across both types (diarrheal- and constipation-type) of ID, in comparison to anti-RFX6 antibodies which are enriched primarily in the diarrheal ID subtype.
Tables
Key resources table
| Reagent type (species) or resource | Designation | Source or reference | Identifiers | Additional information |
|---|---|---|---|---|
| Transfected construct (human) | 293T mock transfection construct | Origene | PS100001 | |
| Transfected construct (human) | 293T RFX6 transfection construct | Origene | RC206174 | |
| Antibody | Goat Anti-NLRP5, polyclonal | Santa Cruz | sc-50630 | RLBA 1:50 |
| Antibody | Mouse Anti-SOX10, monoclonal | Abcam | ab181466 | RLBA 1:25 |
| Antibody | Sheep Anti-RFX6, polyclonal | R and D Systems | AF7780 | RLBA 1:50 |
| Antibody | Rabbit Anti-KHDC3L, polyclonal | Abcam | ab170298 | RLBA 1:25 |
| Antibody | Rabbit Anti-CYP11A1, polyclonal | Abcam | ab175408 | RLBA 1:50 |
| Antibody | Rabbit Anti-NKX6-3, polyclonal | Biorbyt | orb127108 | RLBA 1:50 |
| Antibody | Mouse Anti-GIP, monoclonal | Abcam | ab30679 | RLBA 1:50 |
| Antibody | Rabbit Anti-PDX1, polyclonal | Invitrogen | PA5-78024 | RLBA 1:50 |
| Antibody | Rabbit Anti-ASMT, polyclonal | Invitrogen | PA5-24721 | RLBA 1:25 |
| Antibody | Rabbit Anti-CHGA, polyclonal | Abcam | ab30679 | IF 1:5000 |
| Antibody | Rabbit Anti-DYKDDDDK (D6W5B), monoclonal | Cell Signaling Technologies | #14793 | RLBA 1:125, IF 1:2000 |
Additional files
-
Supplementary file 1
APS1 cohort: Clinical Data.
ND, nail dystrophy. HP, hypoparathyroidism. KC, keratoconjunctivitis. CMC, chronic mucocutaneous candidiasis. ID (D, C, B), Intestinal dysfunction (diarrheal-type, constipation-type, both). AIH, autoimmune hepatitis. POI, primary ovarian insufficiency. HTN, hypertension. HT, hypothyroidism. B12 def, B12 (vitamin) deficiency. DM, diabetes mellitus. SS, Sjogren’s-like syndrome. GH def, Growth hormone deficiency. AI, Adrenal Insufficiency. EH, (dental) enamel hypoplasia. TF, testicular failure. TIN, Tubulointerstitial Nephritis. Hpit, Hypopituitarism. UE, Urticarial eruption. D, Discovery cohort; V, Validation cohort. *Age at most recent evaluation
- https://cdn.elifesciences.org/articles/55053/elife-55053-supp1-v1.docx
-
Supplementary file 2
Non-APS1 control cohort: Clinical Data.
D, Discovery cohort; V, Validation cohort.
- https://cdn.elifesciences.org/articles/55053/elife-55053-supp2-v1.docx
-
Supplementary file 3
Tissue-restricted expression patterns of validated and putative novel APS1 antigens.
- https://cdn.elifesciences.org/articles/55053/elife-55053-supp3-v1.docx
-
Supplementary file 4
Antibody information by application.
- https://cdn.elifesciences.org/articles/55053/elife-55053-supp4-v1.docx
-
Transparent reporting form
- https://cdn.elifesciences.org/articles/55053/elife-55053-transrepform-v1.docx
Download links
A two-part list of links to download the article, or parts of the article, in various formats.
Downloads (link to download the article as PDF)
Open citations (links to open the citations from this article in various online reference manager services)
Cite this article (links to download the citations from this article in formats compatible with various reference manager tools)
Identification of novel, clinically correlated autoantigens in the monogenic autoimmune syndrome APS1 by proteome-wide PhIP-Seq
eLife 9:e55053.
https://doi.org/10.7554/eLife.55053


