Visualization of stem cell activity in pancreatic cancer expansion by direct lineage tracing with live imaging
- Department of Gastroenterology and Hepatology, Kyoto University Graduate School of Medicine, Japan
- Division of Hepatobiliary-Pancreatic Surgery and Transplantation, Department of Surgery, Kyoto University Graduate School of Medicine, Japan
- Department of Internal Medicine II, Klinikum rechts der Isar Technische Universität München, Germany
- Division of Translational Cancer Research, German Cancer Research Center (DKFZ) and German Cancer Consortium (DKTK), Germany
- Kansai Electric Power Hospital, Fukushima-ku Osaka-shi, Japan
Figures
Figure 1

Dclk1+ cells presented in PanINs and pancreatic ductal adenocarcinomas (PDACs) also expressed cancer stem cell (CSC) markers.
(A–D) Histological analysis of PanINs developed in 3-month-old Pdx1-Flp; KrasFSF-G12D/+ (KF) mice. (A) Hematoxylin and Eosin (H and E) staining. (B) Alcian Blue staining. (C) Immunostaining for Krt19. (D) Immunostaining for Dclk1 (mean ± SEM, n = 7, n: number of mice). Scale bar, 50 µm. (E–G) Histological analysis of PDACs developed in 8-week-old Pdx1-Flp; KrasFSF-G12D/+; Trp53frt/frt (KPF) mice. (E) Hematoxylin and Eosin staining. (F) Immunostaining for Krt19. (G) Immunostaining for Dclk1 (mean ± SEM, n = 8, n: number of mice). Scale bar, 50 µm. (H) Immunofluorescence staining for DCLK1 (magenta), Krt19 (green) and Hoechst (blue) in resected human PDACs (mean ± SEM, n = 7, n: number of case). Scale bar, 50 µm. (I) Quantification of the marker+ cells in PanINs formed in KF mice (mean ± SEM; Epcam; n = 5, Cd44; n = 5, Cd24; n = 5, Aldh1a1; n = 5, n: number of mice). (J) Quantification of the marker+ cells in PDACs formed in KPF mice (mean ± SEM; Epcam; n = 5, Cd44; n = 5, Cd24; n = 5, Aldh1a1; n = 5, n: number of mice). (K) Immunofluorescence staining for Dclk1 (magenta), Hoechst (blue), as well as for Epcam, Cd44, Cd24, and Aldh1a1 (green) of PanINs in KF mice (left panels) and PDAC in KPF mice (right panels). Scale bar, 50 µm.
-
Figure 1—source data 1
This spreadsheet contains the source data for Figure 1D.
- https://cdn.elifesciences.org/articles/55117/elife-55117-fig1-data1-v2.docx
-
Figure 1—source data 2
This spreadsheet contains the source data for Figure 1G.
- https://cdn.elifesciences.org/articles/55117/elife-55117-fig1-data2-v2.docx
-
Figure 1—source data 3
This spreadsheet contains the source data for Figure 1H.
- https://cdn.elifesciences.org/articles/55117/elife-55117-fig1-data3-v2.docx
-
Figure 1—source data 4
This spreadsheet contains the source data for Figure 1I.
- https://cdn.elifesciences.org/articles/55117/elife-55117-fig1-data4-v2.docx
-
Figure 1—source data 5
This spreadsheet contains the source data for Figure 1J.
- https://cdn.elifesciences.org/articles/55117/elife-55117-fig1-data5-v2.docx
Figure 2
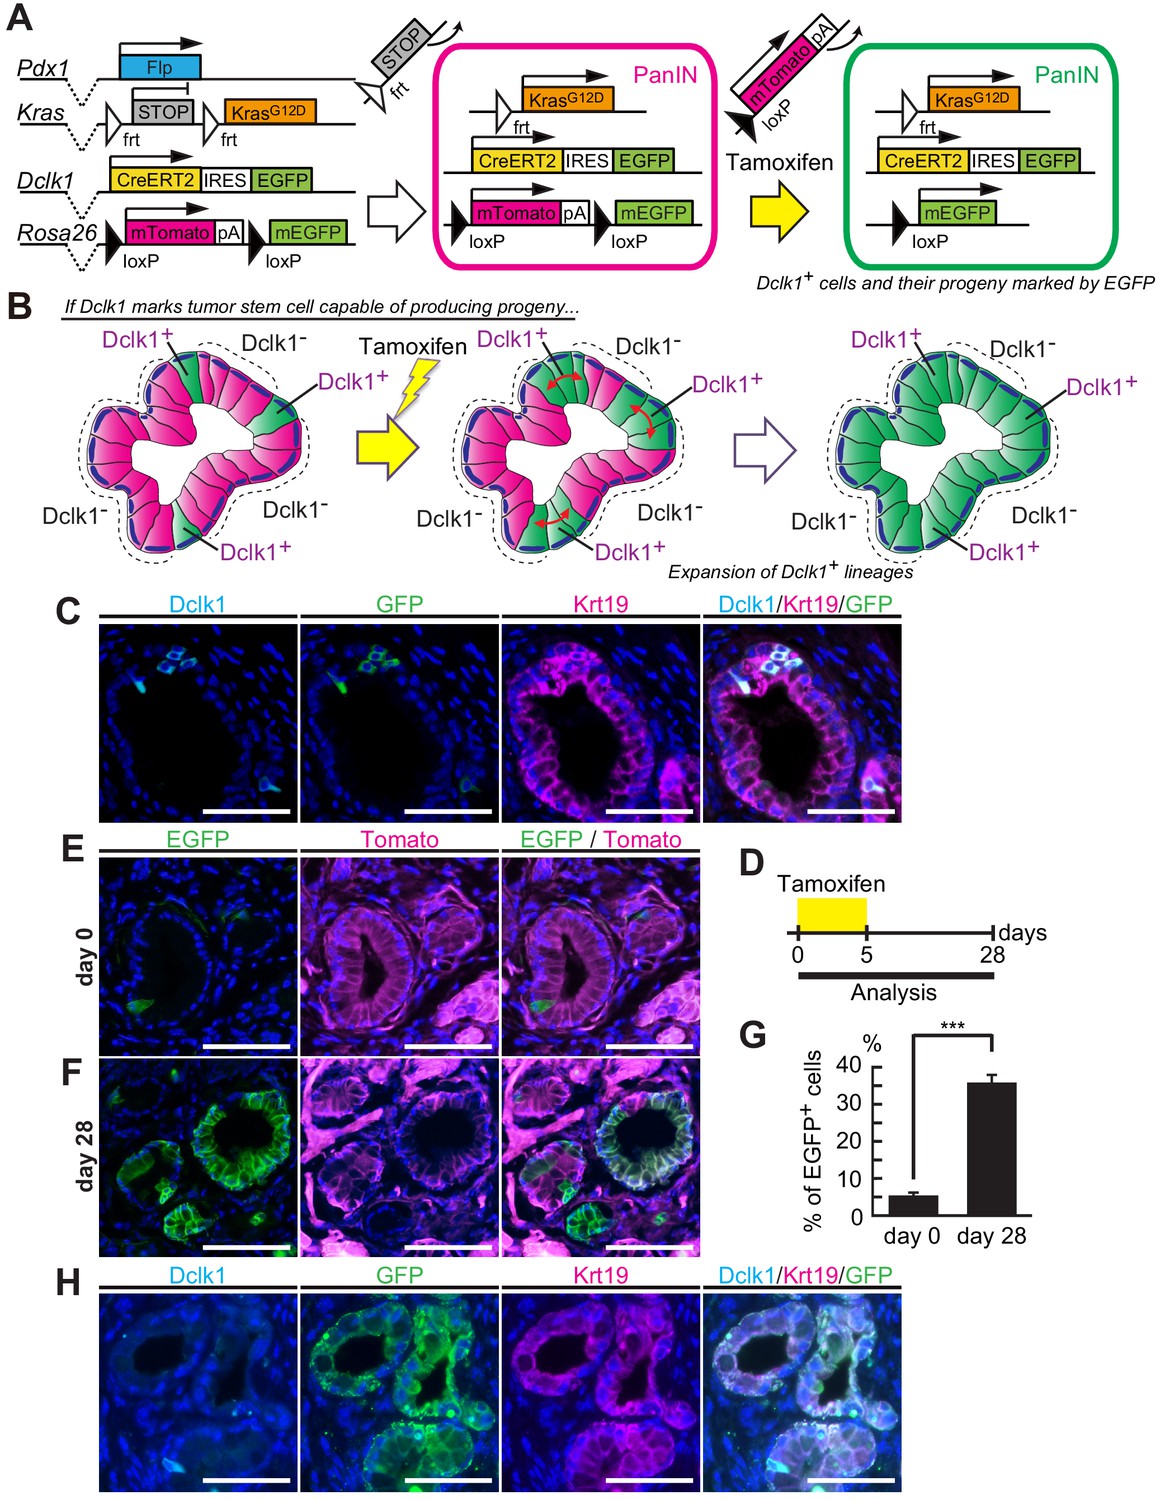
Dclk1+ PanIN cells supply descendant PanIN cells.
(A) The scheme of Dclk1CreERT2-IRES-EGFP/+; Rosa26mTmG/+; Pdx1-Flp; KrasFSF-G12D/+ (DRKF) mouse constructs, flippase-mediated Kras activation, and CreERT2-driven reporter recombination. (B) The scheme of lineage tracing of Dclk1+ cells in established PanINs. Before tamoxifen administration, there were a small subset of Dclk1+/EGFP+ cells (left panel). After tamoxifen administration, if Dclk1+ cells are stem cells, EGFP+ progeny cells expand in the PanINs (middle and right panels). (C) Immunofluorescence staining for Dclk1 (cyan), GFP (green), Krt19 (magenta), and Hoechst (blue) of PanINs developed in DRKF mice before tamoxifen administration. Scale bars, 50 µm. (D) Experimental strategy of Cre-mediated lineage tracing in PanINs developed in 3-month-old DRKF mice. (E and F) Representative fluorescence microscopy images for EGFP encoded in Dclk1CreERT2-IRES-EGFP knock-in allele (green), Tomato (magenta), and Hoechst (blue) in sections of PanINs developed in DRKF mice. (E) Before tamoxifen injection (day 0), EGFP (green) was expressed in Dclk1+ cells among Tomato-expressed PanIN cells (magenta). (F) After tamoxifen injection (day 28), the progeny of Dclk1+ cells expressed EGFP (green) and non-progeny cells still expressed Tomato (magenta). Scale bar, 50 µm. (G) Quantification of EGFP+ PanIN cells formed in DRKF mice before (day 0) and 28 days after tamoxifen injection (day 28). The number of PanIN lesions was 85 and 141 per mouse in day 0 and day 28 respectively (mean ± SEM; day 0, n = 6, left bar; day 28, n = 7, right bar; n: number of mice). Statistical significance of the difference is indicated as ***p<0.001, Student’s t-test. (H) Immunofluorescence staining for Dclk1 (cyan), GFP (green), Krt19 (magenta), and Hoechst (blue) of PanINs developed in DRKF mice 28 days after tamoxifen administration. Scale bars, 50 µm.
-
Figure 2—source data 1
This spreadsheet contains the source data for Figure 2G.
- https://cdn.elifesciences.org/articles/55117/elife-55117-fig2-data1-v2.docx
Figure 3 with 2 supplements

Dclk1+ pancreatic ductal adenocarcinoma (PDAC) cells supply descendant PDAC cells in vivo.
(A) The scheme of Dclk1CreERT2-IRES-EGFP/+; Rosa26mTmG/+; Pdx1-Flp; KrasFSF-G12D/+; Trp53frt/frt (DRKPF) mouse constructs, flippase-mediated Kras activation and Trp53 deletion, and CreERT2-driven reporter recombination. (B) The scheme of lineage tracing of Dclk1+ cells in established PDAC. The flippase-FRT system produced Tomato+ PDACs including a small number of Dclk1+/EGFP+ cells (left panel). After tamoxifen administration, if Dclk1+ cells are PDAC stem cells, they supply EGFP+ descendant PDAC cells in established PDACs (middle and right panels). (C) Immunofluorescence staining for Dclk1 (cyan), GFP (green), Krt19 (magenta), and Hoechst (blue) of PDACs developed in DRKPF mice before tamoxifen administration. Scale bars, 50 µm. (D) Experimental strategy of Cre-mediated lineage tracing in PDACs developed in 8-week-old DRKPF mice. (E and F) Representative fluorescent microscopy images for EGFP encoded in Dclk1CreERT2-IRES-EGFP knock-in allele (green), Tomato (magenta), and Hoechst (blue) of sections of PDACs developed in DRKPF mice. (E) Before tamoxifen injection (day 0), EGFP encoded in Dclk1CreERT2-IRES-EGFP knock-in allele was expressed in Dclk1+ cells (green) among Tomato expressed PDAC cells (magenta). (F) After tamoxifen injection (day 14), the progeny of Dclk1+ cells expressed EGFP (green) and non-progeny cells still expressed Tomato (magenta). Scale bar, 50 µm. (G and H) Overlay image of Krt19 staining and direct fluorescence observation of endogenous EGFP in same sections illustrated in E (G) and F (H). (I) Quantification of EGFP+ area in PDACs developed in DRKPF mice before (day 0) and 14 days after tamoxifen injection (day 14). In DRKPF mice, a large tumor that replaced the entire pancreas was developed. One tumor was observed per mouse (mean ± SEM; day 0, n = 6, left bar; day 14, n = 6, right bar; n: number of mice). Statistical significance of the difference is indicated as ***p<0.001, Student’s t-test. (J) Immunofluorescence staining for Dclk1 (cyan), GFP (green), Krt19 (magenta), and Hoechst (blue) of PDAC developed in DRKPF mice 14 days after tamoxifen administration. Scale bars, 50 µm.
-
Figure 3—source data 1
This spreadsheet contains the source data for Figure 3I.
- https://cdn.elifesciences.org/articles/55117/elife-55117-fig3-data1-v2.docx
Figure 3—figure supplement 1
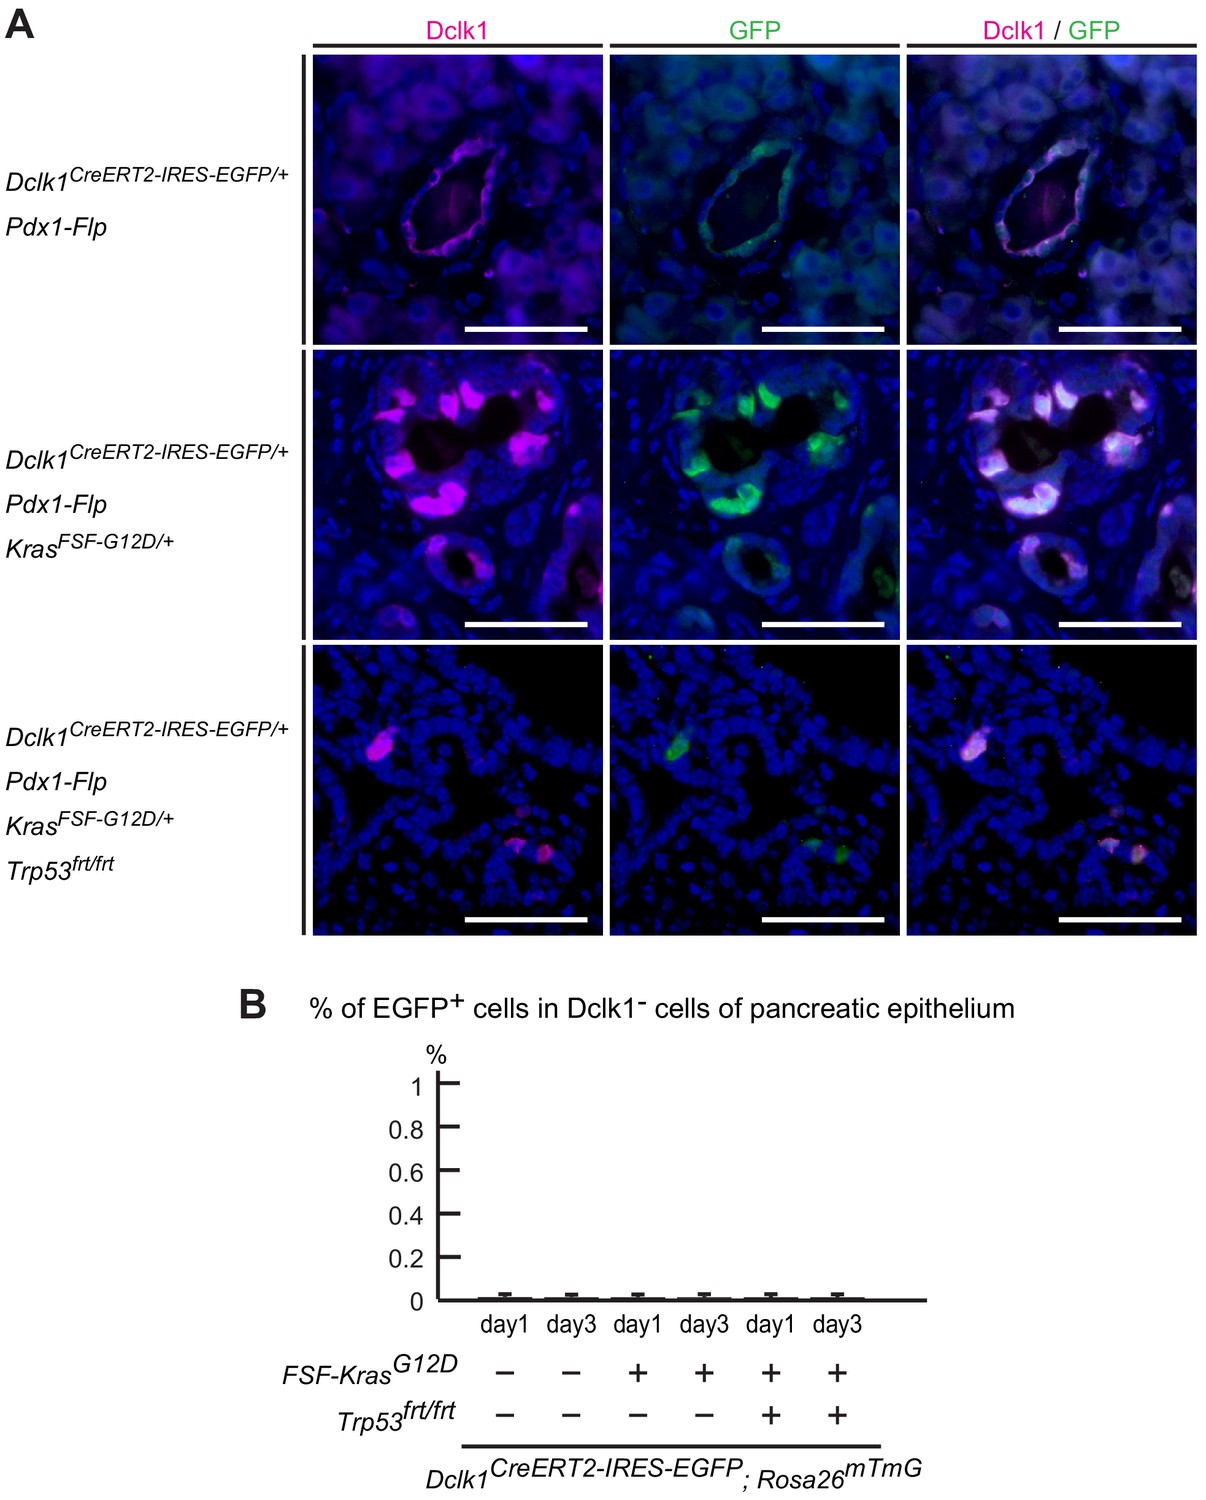
Dclk1creERT2-IRES-EGFP mice had no leakiness of Cre expression.
(A) Immunofluorescence staining for Dclk1 (magenta), GFP (green), and Hoechst (blue) of Dclk1CreERT2-IRES-EGFP/+; Pdx1-Flp (DF) mice, Dclk1CreERT2-IRES-EGFP/+; Pdx1-Flp; KrasFSF-G12D/+ (DKF) mice and Dclk1CreERT2-IRES-EGFP/+; Pdx1-Flp; KrasFSF-G12D/+; Trp53frt/frt (DKPF) mice without tamoxifen administration (DF mice, 536 cells, n = 5; DKF mice, 604 cells, n = 7; DKPF mice, 685 cells, n = 7). Scale bars, 50 µm. (B) The percentage of EGFP+ cells in Dclk1− cells of pancreatic epithelium with immunofluorescent staining. The GFP+/Dclk1− rates were 0.0070 ± 0.0043% for day 1, 0.0061 ± 0.0038% for day 3 in DRF mice, 0.0069 ± 0.0042% for day 1, 0.0057 ± 0.0051% for day 3 in DRKF mice, and 0.0061 ± 0.0067% for day 1, 0.0061 ± 0.0061% for day 3 in DRKPF mice (mean ± SEM; DRF, day 1: n = 5; day 3: n = 6, DRKF, day1: n = 5, day 3: n = 6, DRKPF; day 1: n = 6; day 3: n = 6, n: number of mice). No significant differences, Student’s t-test.
-
Figure 3—figure supplement 1—source data 1
Analysis of the leak of Dclk1CreERT2.
The number of EGFP+ cells in Dclk1− cells of pancreatic epithelium in DRF, DRKF, and DRKPF mice with immunofluorescent staining.
- https://cdn.elifesciences.org/articles/55117/elife-55117-fig3-figsupp1-data1-v2.docx
Figure 3—figure supplement 2
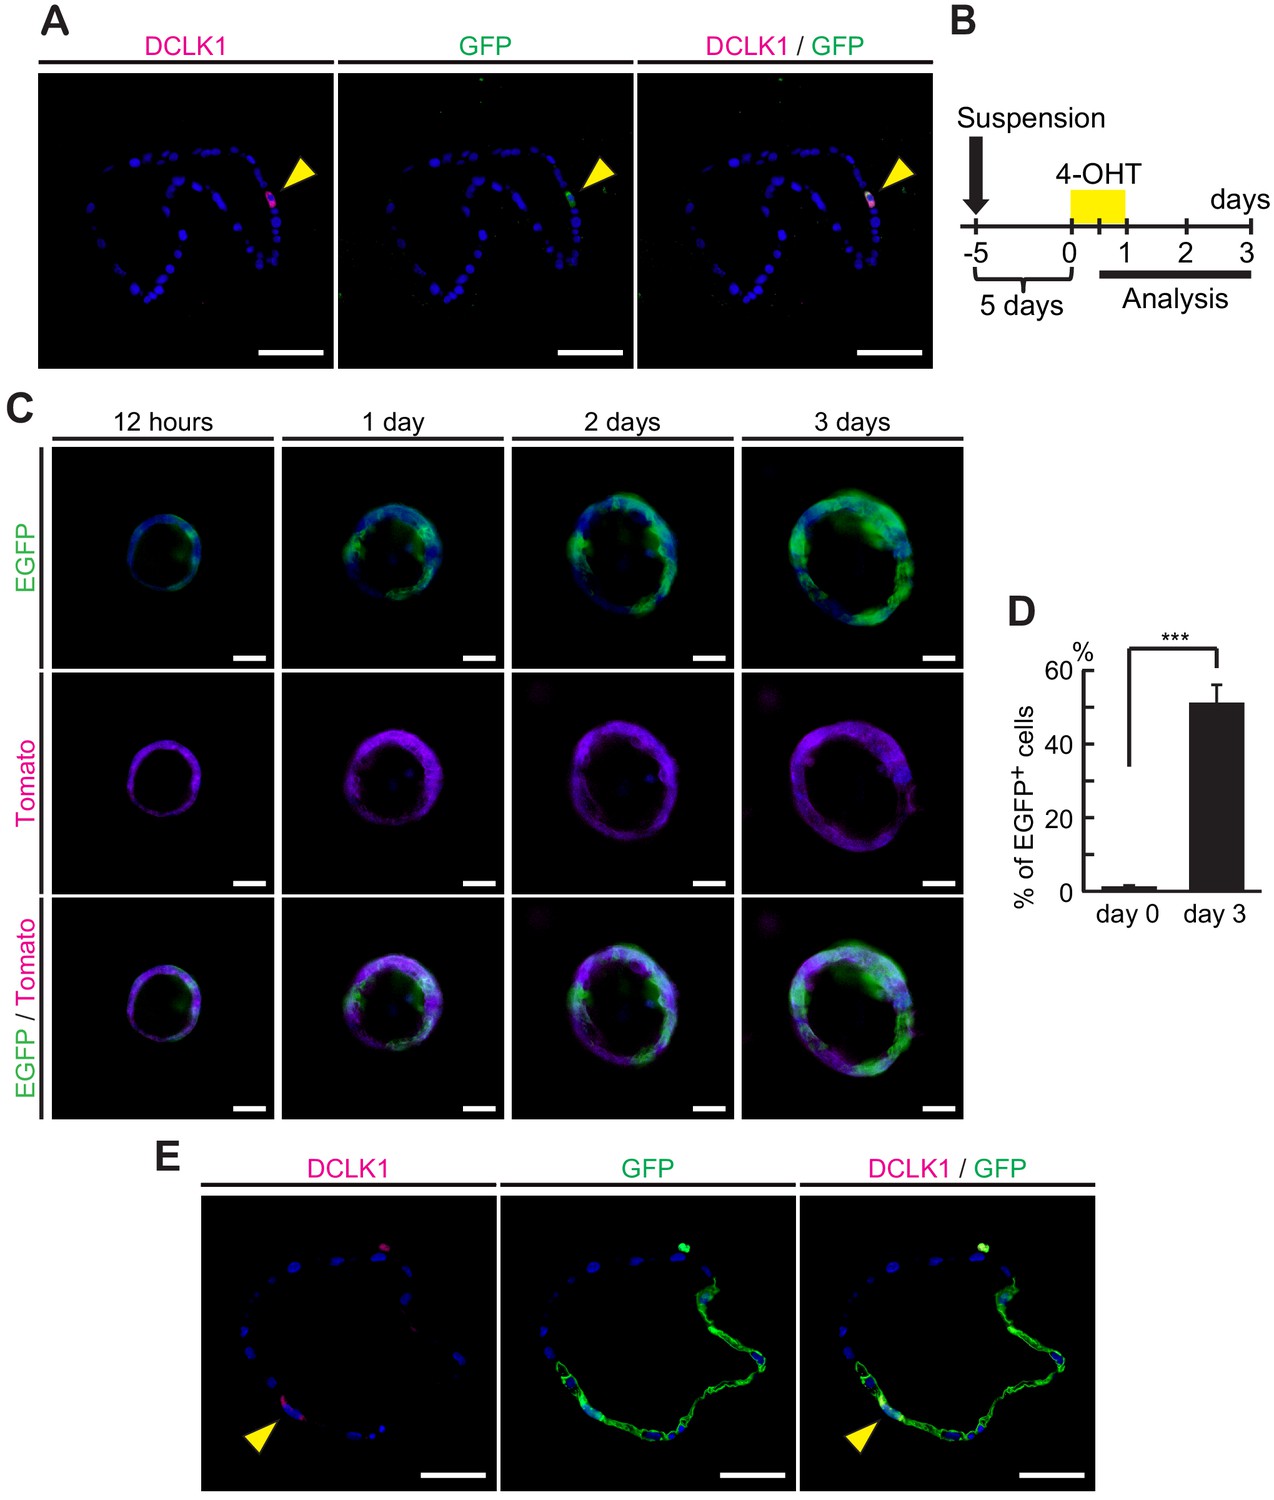
Dclk1+ cells supplied progeny in pancreatic ductal adenocarcinoma (PDAC) spheroids.
(A) Immunofluorescence staining for Dclk1 (magenta), GFP (green), and Hoechst (blue) of spheroids derived from PDAC of DRKPF mice. (B) Experimental strategy of Cre-mediated lineage tracing in established PDAC spheroids. Organoids were observed over time with Hoechst added to the culture medium. (C) Fluorescent microscopy images for EGFP encoded in Dclk1CreERT2-IRES-EGFP knock-in allele (green), Tomato (magenta), and Hoechst (blue) in spheroids derived from PDAC of DRKPF (Rosa26mTmG/ mTmG) mice at 1, 2, and 3 days after 4-OHT administration. Scale bars, 50 µm. (D) Quantification of EGFP+ cells in spheroids before (day 0) and 3 days after 4-OHT administration (day 3, mean ± SEM; day 0, n = 5, left bar; day 3, n = 5, right bar; n: number of mice). Statistical significance of the difference is indicated as ***p<0.001, Student’s t-test. (E) Immunofluorescence staining for Dclk1 (magenta), GFP (green), and Hoechst (blue) of spheroids derived from PDAC of DRKPF mice after 4-OHT treatment. Scale bars, 50 µm.
-
Figure 3—figure supplement 2—source data 1
Lineage tracing of Dclk1+ cells in established spheroids from pancreatic ductal adenocarcinomas (PDACs) of DRKPF mice.
The number of EGFP+ cells before (day 0) and 3 days after 4-OHT administration (day 3).
- https://cdn.elifesciences.org/articles/55117/elife-55117-fig3-figsupp2-data1-v2.docx
Figure 4
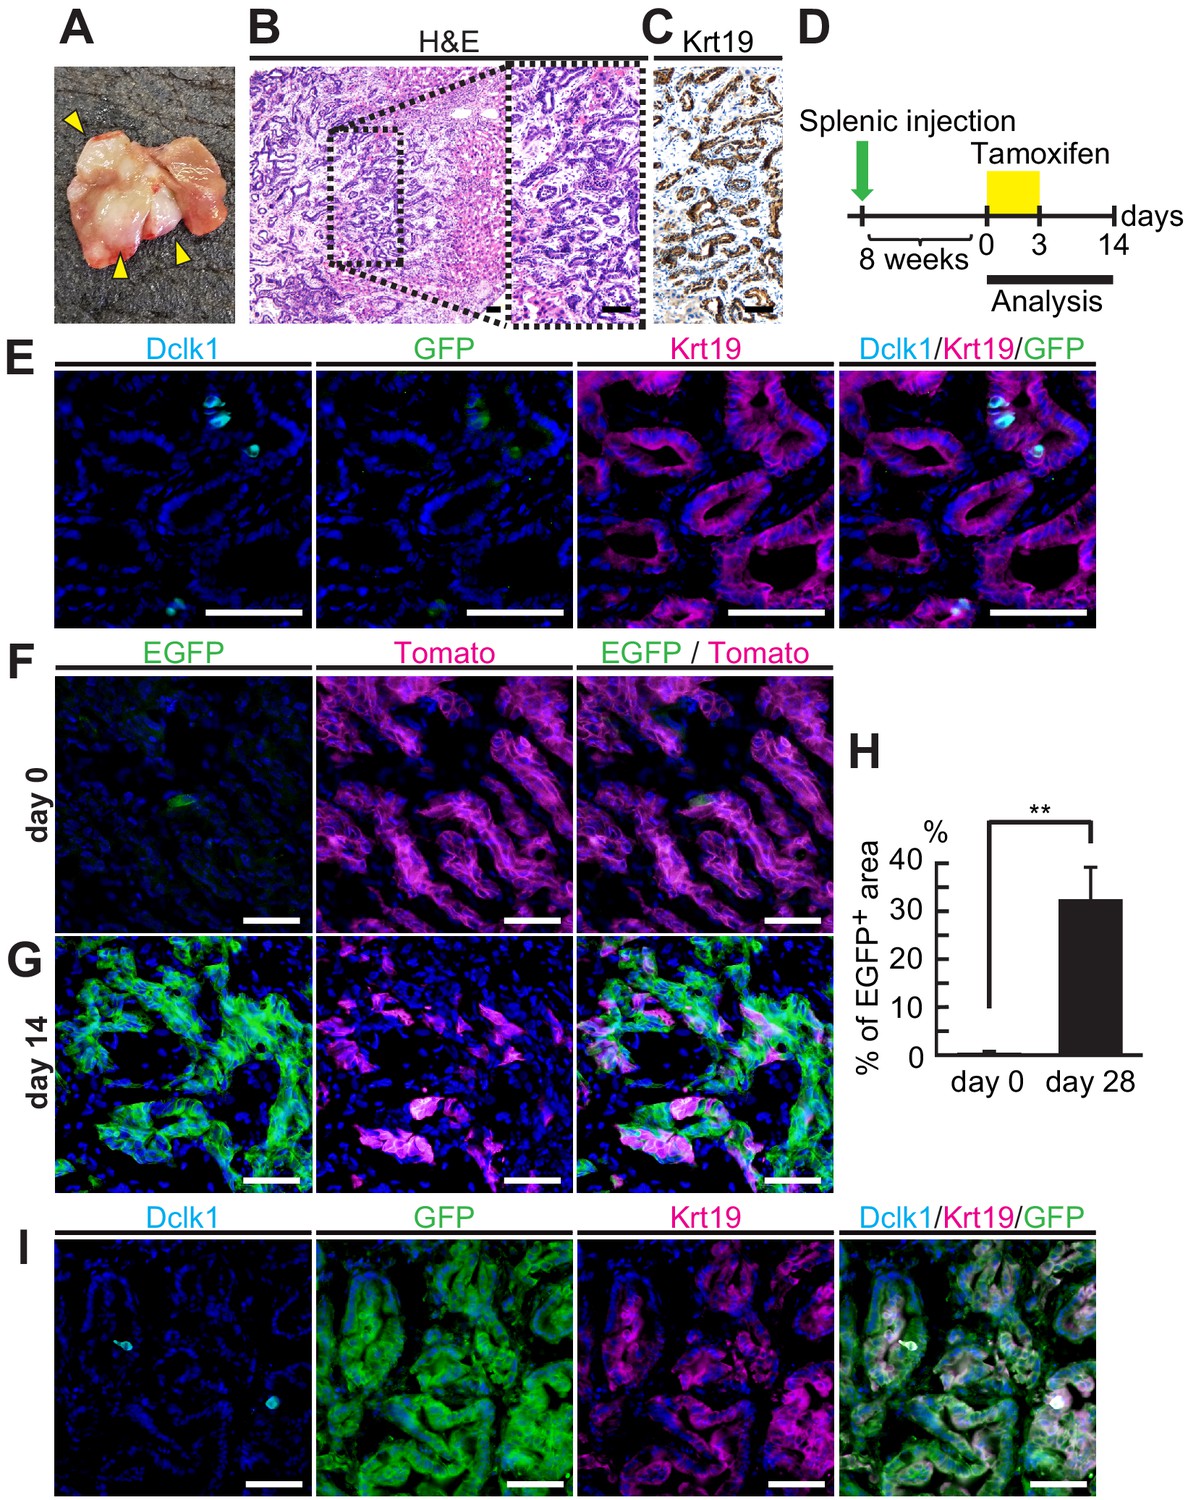
Dclk1+ cells supplied progeny in liver tumors from splenic transplantation.
(A) Macroscopic image of liver tumors 2 months after splenic injection of pancreatic ductal adenocarcinoma (PDAC) spheroids derived from DRKPF mice. (B and C) Histological analysis of the metastatic liver tumors. (B) Hematoxylin and Eosin staining. (C) Immunostaining for Krt19. Scale bars, 50 µm. (D) Experimental strategy of Dclk1-Cre-mediated lineage tracing in established metastatic liver tumors. (E) Immunofluorescence staining for Dclk1 (cyan), GFP (green), Krt19 (magenta), and Hoechst (blue) of metastatic liver tumors developed by splenic injection of PDAC spheroids derived from DRKPF mice before tamoxifen administration. Scale bars, 50 µm. (F and G) Representative fluorescence microscopy images for EGFP encoded in Dclk1CreERT2-IRES-EGFP knock-in allele (green), Tomato (magenta), and Hoechst (blue) in sections of metastatic liver tumors. (F) Before tamoxifen injection (day 0), EGFP encoded in Dclk1CreERT2-IRES-EGFP knock-in allele was expressed in Dclk1+ cells (green) among Tomato-expressed tumor cells (magenta). (G) After tamoxifen injection (day 14), the progeny of Dclk1+ cells expressed EGFP (green) and non-progeny cells still expressed Tomato (magenta). Scale bar, 50 µm. (H) Quantification of EGFP+ area in liver tumor area before (day 0) and 14 days after tamoxifen injection (day 14, mean ± SEM; day 0, n = 6, left bar; day 14, n = 6, right bar; n: number of liver tumors, five mice in each groups). Statistical significance of the difference is indicated as **p<0.01, Student’s t-test. (I) Immunofluorescence staining for Dclk1 (cyan), GFP (green), Krt19 (magenta), and Hoechst (blue) of metastatic liver tumors developed by splenic injection of PDAC spheroids derived from DRKPF mice. Scale bars, 50 µm.
-
Figure 4—source data 1
Lineage tracing of Dclk1+ cells in established mouse metastatic liver tumors.
Measurement of EGFP+ area in liver tumor area derived from spleen-injected pancreatic ductal adenocarcinomas (PDACs) before (day 0) and 14 days after tamoxifen injection. Image J was used for the measurement.
- https://cdn.elifesciences.org/articles/55117/elife-55117-fig4-data1-v2.docx
Figure 5

Longitudinal imaging of PanINs and pancreatic ductal adenocarcinomas (PDACs) in live mice indicate Dclk1+ PDAC cells supply progeny PDAC cells.
(A) Photo of an abdominal imaging window (AIW) composed of a custom-made magnet ring and 12 mm cover glass. (B) Scheme of the microscopic observation of the pancreas through an AIW. CA: cyanoacrylate. (C) Layout of the system for mouse live pancreas imaging. (D) Macroscopic images of pancreas with a nodule (arrowhead) transferred on the peritoneum (left) and observed through AIW (right). (E) Protocol of live imaging of PanINs formed in DRKF mice. The mice were treated with caerulein to accelerate PanIN formation. (F and G) Live imaging of PanINs formed in DRKF mice. (F) On the day of AIW installation, the following day of the final tamoxifen injection (day 3), several EGFP+ cells were observed through AIW (green) among Tomato-expressed tumor cells (magenta). (G) Ten days after AIW installation (day 13), almost all PanIN cells expressed EGFP in the same PanIN lesions of the same live DRKF mouse. Scale bar, 50 µm. (H) Protocol of live imaging of PDACs formed in DRKPF mice. (I and J) Live imaging of PDACs formed in DRKPF mice. (I) On the day of AIW installation, the following day of the final tamoxifen injection (day 0), EGFP+ PDAC cells were scarcely observed (green). (J) Seven days after tamoxifen injection, numerous PDAC cells were EGFP+ in the same live mouse (green). Scale bars, 50 µm. (K) Representative images of H and E staining and immunofluorescence staining for GFP, Krt19, and Hoechst of PDAC after live imaging. Scale bar, 50 µm.
Figure 6

Dclk1+pancreatic ductal adenocarcinoma (PDAC) cells have remarkable spheroid- and tumor-forming potential.
(A) Scheme of FACS and 3D culture of Dclk1+ and Dclk1− PDAC cells from DKPF mice. (B) FACS-sorting of PDAC cells on the basis of Epcam and Dclk1 expression in DKPF mice. (C and D) Representative images of tumor spheroids derived from sorted Dclk1− (C) and Dclk1+ (D) PDAC cells at day 7. (E) Size of spheroids were compared (mean ± SEM; Dclk1+, n = 5; Dclk1−, n = 5; n: number of mice). Statistical significance of the differences is indicated as ***p<0.001, Student’s t-test. (F) The number of spheroids larger than 20 µm were compared (mean ± SEM; Dclk1+, n = 5; Dclk1−, n = 5; n: number of mice). Statistical significance of the differences is indicated as ***p<0.001, Student’s t-test. (G and H) Tumor-forming assay of Dclk1+ or Dclk1− PDAC cells. (G) Macroscopic image of the NOD/SCID mice after subcutaneous transplantation of Dclk1+ or Dclk1− PDAC cells into the flank. A thousand of Dclk1+ PDAC cells developed subcutaneous tumors whereas Dclk1− PDAC cells did not. (H) Dilution series showed 100, 500, or 1000 Dclk1+ PDAC cells developed subcutaneous tumors in 16.7%, 25.0%, and 75.0% of NOD/SCID mice, whereas same or larger numbers of Dclk1− PDAC cells did not. Statistical significance of the differences is indicated as p<0.05, chi-squared test. (I–K) Histological analysis of primary xenografts derived from FACS-sorted Dclk1+ PDAC cells. (I) Hematoxylin and Eosin (H and E) staining. (J) Immunostaining for Krt19. (K) Immunostaining for Dclk1. Scale bar, 200 µm (I), 50 µm (J and K). (L) Increasing curve of subcutaneous tumor (mean ± SEM; Dclk1+, n = 3; Dclk1−, n = 4; n: number of mice). Statistical significance of the differences is indicated as *p<0.05, Student’s t-test. (M) Passaged tumor-forming assay of Dclk1+ or Dclk1− xenograft cells collected by FACS. A thousand of Dclk1+ xenograft cells developed subcutaneous tumors whereas Dclk1− xenograft cells did not. (N–P) Histological analysis of passaged xenografts derived from FACS-sorted Dclk1+ primary xenograft cells. (N) Hematoxylin and Eosin (H and E) staining. (O) Immunostaining for Krt19. (P) Immunostaining for Dclk1. Scale bar, 200 µm (N), 50 µm (O and P).
-
Figure 6—source data 1
Growth of pancreatic ductal adenocarcinoma (PDAC) xenograft.
Measured value of increasing curve of subcutaneous tumor derived from Dclk1+ PDACs cells sorted by FACS.
- https://cdn.elifesciences.org/articles/55117/elife-55117-fig6-data1-v2.docx
Figure 7
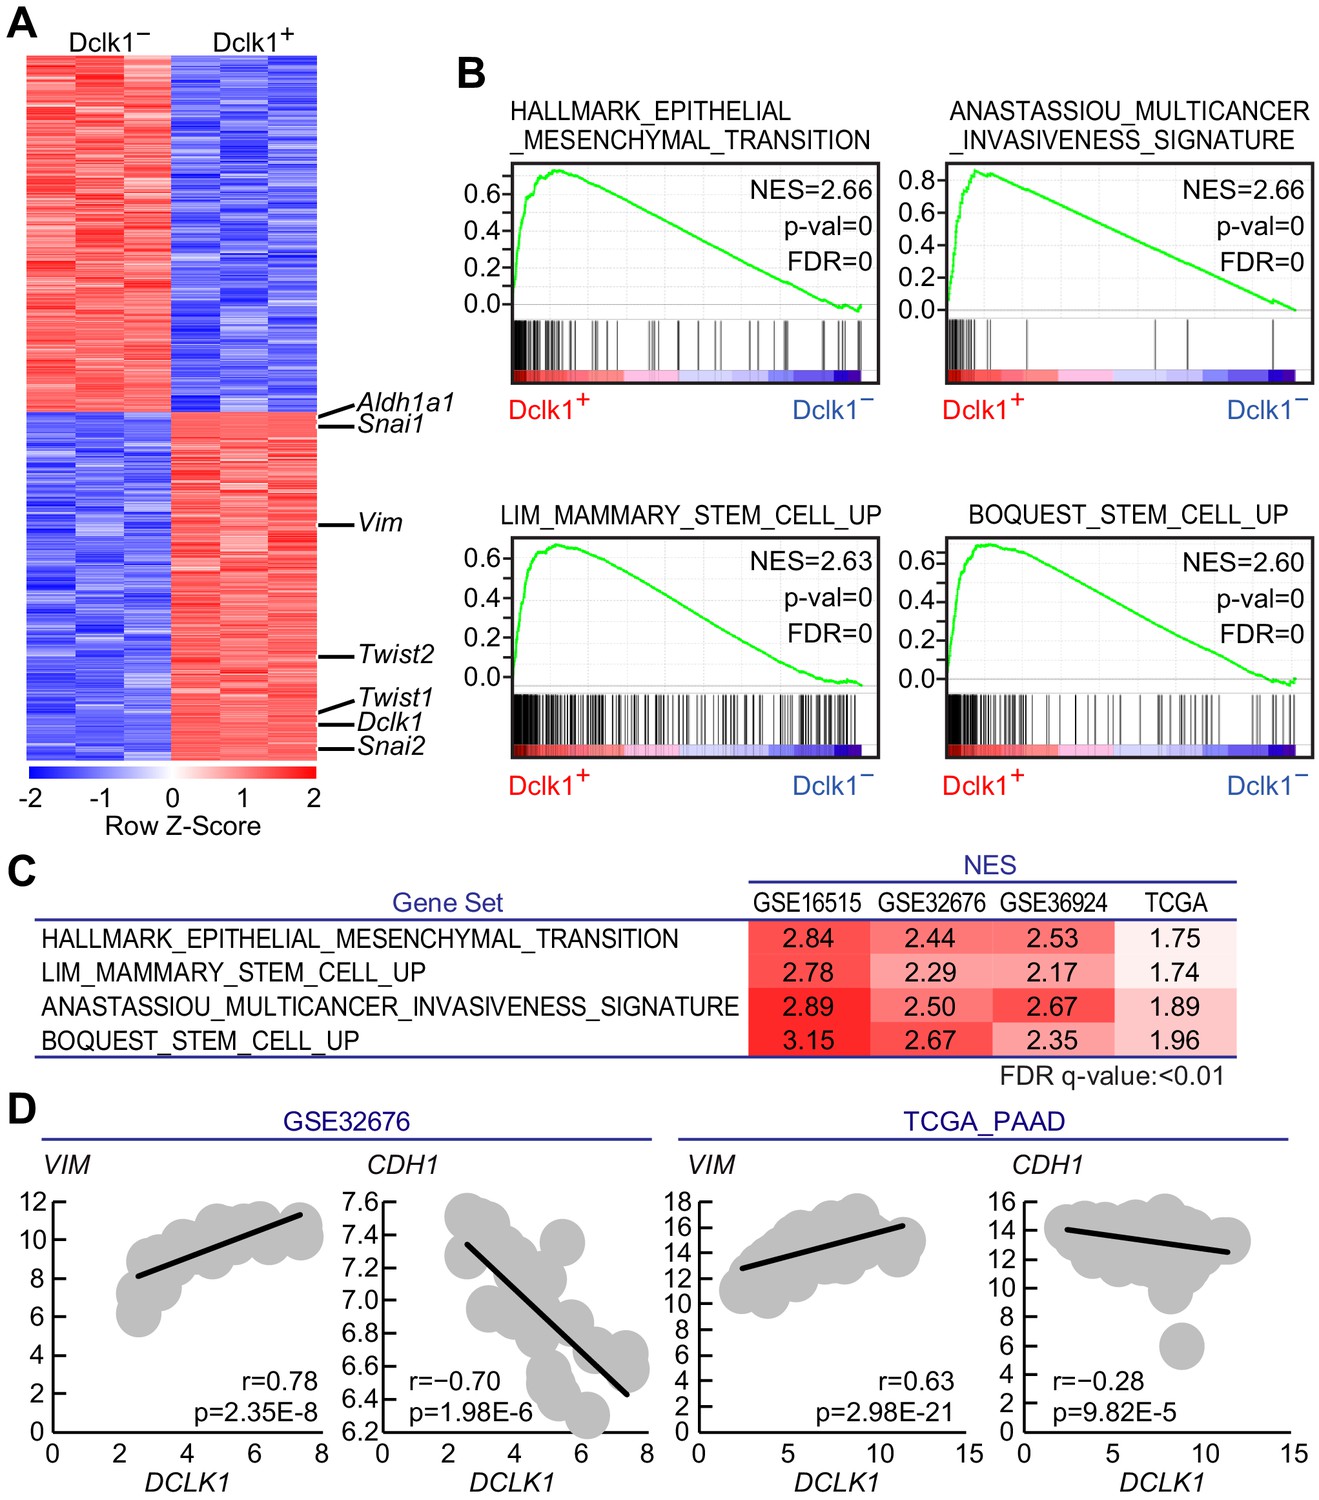
Gene expression profile revealed Dclk1+pancreatic ductal adenocarcinoma (PDAC) cells possessed cancer stem cell potential.
(A) The heatmap of representative differentially expressed genes with a significant difference, p<0.01 (Student’s t-test) in gene expression. (B) Gene set enrichment analysis (GSEA) in Dclk1+ versus Dclk1− PDAC cells. (C) Gene set enrichment analysis (GSEA) in DCLK1-high versus DCLK1-low PDACs in human PDAC data sets. (D) Correlation analysis with VIM or CDH1 and DCLK1 in human PDAC data sets. (r, Pearson correlation coefficient). Statistical significance of the differences is indicated as p<0.001, Student’s t distribution.
Tables
Key resources table
| Reagent type (species) or resource | Designation | Source or reference | Identifiers | Additional information |
|---|---|---|---|---|
| Gene Mus musculus | Dclk1 | NCBI Gene Database | NCBI Gene: 13175 | |
| Gene (Homo sapiens) | DCLK1 | NCBI Gene Database | NCBI Gene: 9201 | |
| Genetic reagent (Mus musculus) | Dclk1CreERT2-IRES-EGFP | Generated in our laboratory Nakanishi et al., 2013 | N/A | |
| Genetic reagent (Mus musculus) | Pdx1-Flp | Saur D. Schönhuber et al., 2014 | N/A | |
| Genetic reagent (Mus musculus) | KrasFSF-G12D | Saur D. Schönhuber et al., 2014 | N/A | |
| Genetic reagent (Mus musculus) | Rosa26mTmG | Saur D. Schönhuber et al., 2014 | N/A | |
| Genetic reagent (Mus musculus) | Trp53frt | Jackson Laboratory Schönhuber et al., 2014 | RRID:IMSR_JAX:017767 | |
| Genetic reagent (Mus musculus) | CAnN.Cg-Foxn1nu/Crl | Charles river | N/A | BALB/c-nu |
| Genetic reagent (Mus musculus) | NOD.CB17-Prkdcscid/J | Jackson Laboratory | RRID:IMSR_JAX:001303 | NOD scid |
| Antibody | Rabbit polyclonal anti-Dcamkl1 | Abcam | Cat#: ab31704 RRID:AB_873537 | 1:200 |
| Antibody | Goat polyclonal anti-Dcamkl1 | Santa Cruz Biotechnology | Cat#: sc46312 RRID:AB_2090091 | 1:50 |
| Antibody | Rat monoclonal anti-Cd24 | Abcam | Cat#: ab64064 RRID:AB_2291132 | 1:100 |
| Antibody | Rat monoclonal anti-Cd44 | Abcam | Cat#: ab119863 RRID:AB_10898986 | 1:100 |
| Antibody | Rat monoclonal anti-Cd326 | Thermo Fisher Scientific | Cat#: 13-5791-82 RRID:AB_1659713 | 1:100 |
| Antibody | Rabbit polyclonal anti-Aldh1a1 | Abcam | Cat#: ab23375 RRID:AB_2224009 | 1:100 |
| Antibody | Rat monoclonal anti-Cd326 (EpCAM) eFluor450 | Thermo Fisher Scientific | Cat#: 48-5791-82 RRID:AB_10717090 | 1:50 |
| Antibody | Goat polyclonal anti-GFP | Abcam | Cat#: ab6673 RRID:AB_305643 | 1:100 |
| Antibody | Mouse monoclonal anti-Cytokeratin | DAKO | Cat#: IR05361-2J RRID:AB_2868599 | 1:1 |
| Sequence-based reagent | Dclk1-CreERT2 Forward1 | This paper | PCR primers | CGAGCTGGACGGCGACGTAAACG |
| Sequence-based reagent | Dclk1-CreERT2 Forward2 | This paper | PCR primers | GATGGACTCAAGAAGATCTCC |
| Sequence-based reagent | Dclk1-CreERT2 Reverse | This paper | PCR primers | AGTGACCCTTAGTGACCCTTAGT |
| Sequence-based reagent | Pdx1-Flp Forward | Saur D. Schönhuber et al., 2014 | PCR primers | AGAGAGAAAATTGAAACAAGTGCAGGT |
| Sequence-based reagent | Pdx1-Flp Reverse | Saur D. Schönhuber et al., 2014 | PCR primers | CGTTGTAAGGGATGATGGTGAACT |
| Sequence-based reagent | Kras Common Forward | Saur D. Schönhuber et al., 2014 | PCR primers | CACCAGCTTCGGCTTCCTATT |
| Sequence-based reagent | Kras WT Reverse | Saur D. Schönhuber et al., 2014 | PCR primers | AGCTAATGGCTCTCAAAGGAATGTA |
| Sequence-based reagent | Kras FSF MUT reverse | Saur D. Schönhuber et al., 2014 | PCR primers | GCGAAGAGTTTGTCCTCAACC |
| Sequence-based reagent | p53-frt1 | Jackson Laboratory | PCR primers | CAAGAGAACTGTGCCTAAGAG |
| Sequence-based reagent | p53-frt2 | Jackson Laboratory | PCR primers | CTTTCTAACAGCAAAGGCAAGC |
| Software, algorithm | Image J | National Institutes of Health | RRID:SCR_003070 | https://imagej.net/ |
| Software, algorithm | InSight DeepSee Laser | Spectra Physics | RRID:SCR_012362 | http://www.scienceexchange.com/facilities/multiphoton-microscopy-core-rochester |
| Software, algorithm | FlowJo | FlowJo, LLC | RRID:SCR_008520 | https://www.flowjo.com/ |
Additional files
-
Supplementary file 1
GO enrichment analysis up to 100 Go terms on DAVID, GO Biological process using 2171 genes significantly (p<0.01) highly expressed in Dclk1+ PDAC cells.
- https://cdn.elifesciences.org/articles/55117/elife-55117-supp1-v2.docx
-
Supplementary file 2
Pathway analysis on DAVID, KEGG Pathway using 2171 genes significantly (p<0.01) highly expressed in Dclk1+ PDAC cells.
- https://cdn.elifesciences.org/articles/55117/elife-55117-supp2-v2.docx
-
Supplementary file 3
GO analysis (GO Biological Process) and pathway analysis (KEGG Pathway) on genes that were significantly highly expressed (p<0.05) in the DCLK1 high expression group up to 50 Go terms or pathways.
- https://cdn.elifesciences.org/articles/55117/elife-55117-supp3-v2.docx
-
Transparent reporting form
- https://cdn.elifesciences.org/articles/55117/elife-55117-transrepform-v2.docx
Download links
A two-part list of links to download the article, or parts of the article, in various formats.
Downloads (link to download the article as PDF)
Open citations (links to open the citations from this article in various online reference manager services)
Cite this article (links to download the citations from this article in formats compatible with various reference manager tools)
Visualization of stem cell activity in pancreatic cancer expansion by direct lineage tracing with live imaging
eLife 10:e55117.
https://doi.org/10.7554/eLife.55117


