Conformational distributions of isolated myosin motor domains encode their mechanochemical properties
- Department of Biochemistry and Molecular Biophysics, Washington University School of Medicine in St. Louis, United States
- Center for the Science and Engineering of Living Systems, Washington University in St. Louis, United States
Figures
Figure 1
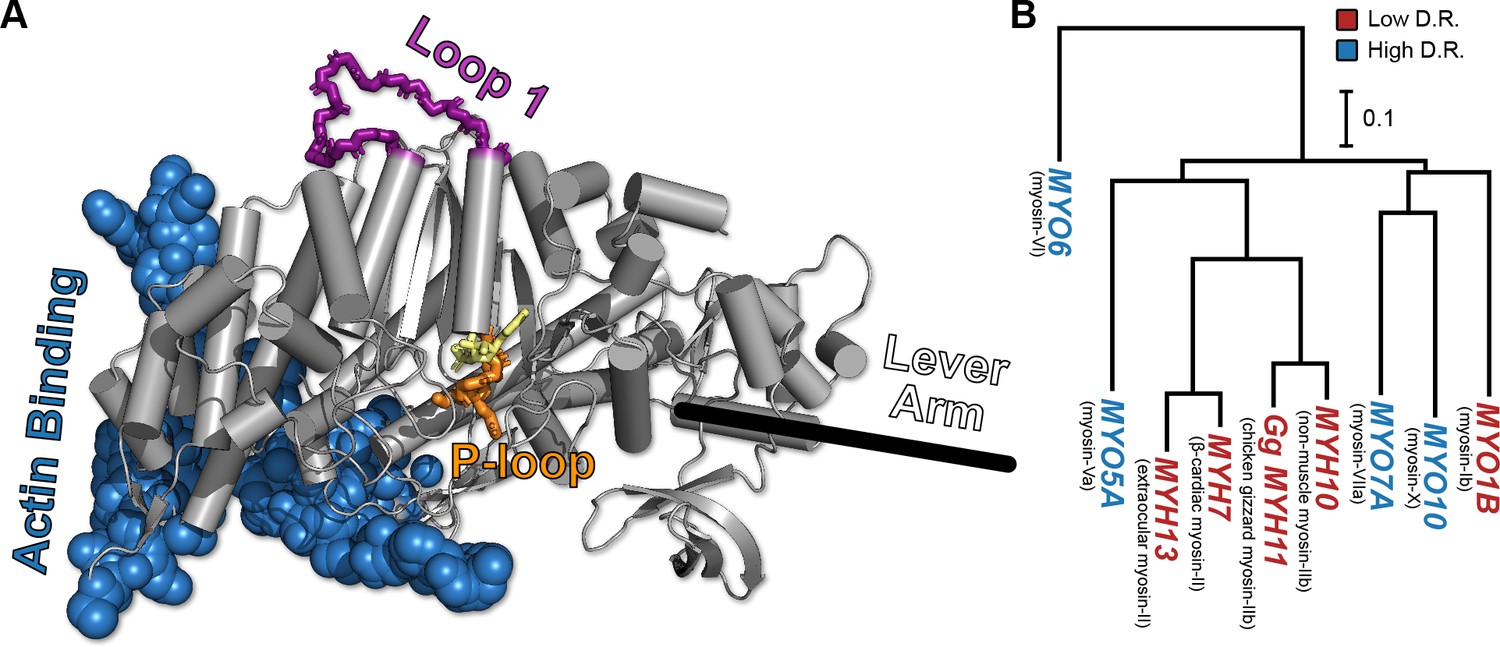
The conserved myosin motor domain fold across a diverse phylogeny of motors.
(A), A crystal structure (PDB ID 4PA0) (Winkelmann et al., 2015) of Homo sapiens β-cardiac myosin motor domain as an example of the conserved myosin motor domain fold. We note the structural elements most relevant to our work here (loop 1, in purple backbone sticks, and the P-loop, in orange sticks), along with the actin binding region (blue spheres). For orientation, we include the location of the lever arm (black line) and, to indicate the active site, the estimated location of ADP (yellow sticks). (B) The phylogenetic relationship the various myosin motor domains examined in this work. Except MYH11, all genes are from Homo sapiens. Gene names in blue indicate high duty ratio motors and red indicates low duty ratio. Common protein names are indicated as parentheticals to the left of each gene name. Phylogenetic relationships were inferred from the sequence of the motor domain using k-mer distances (Edgar, 2004a).
Figure 2
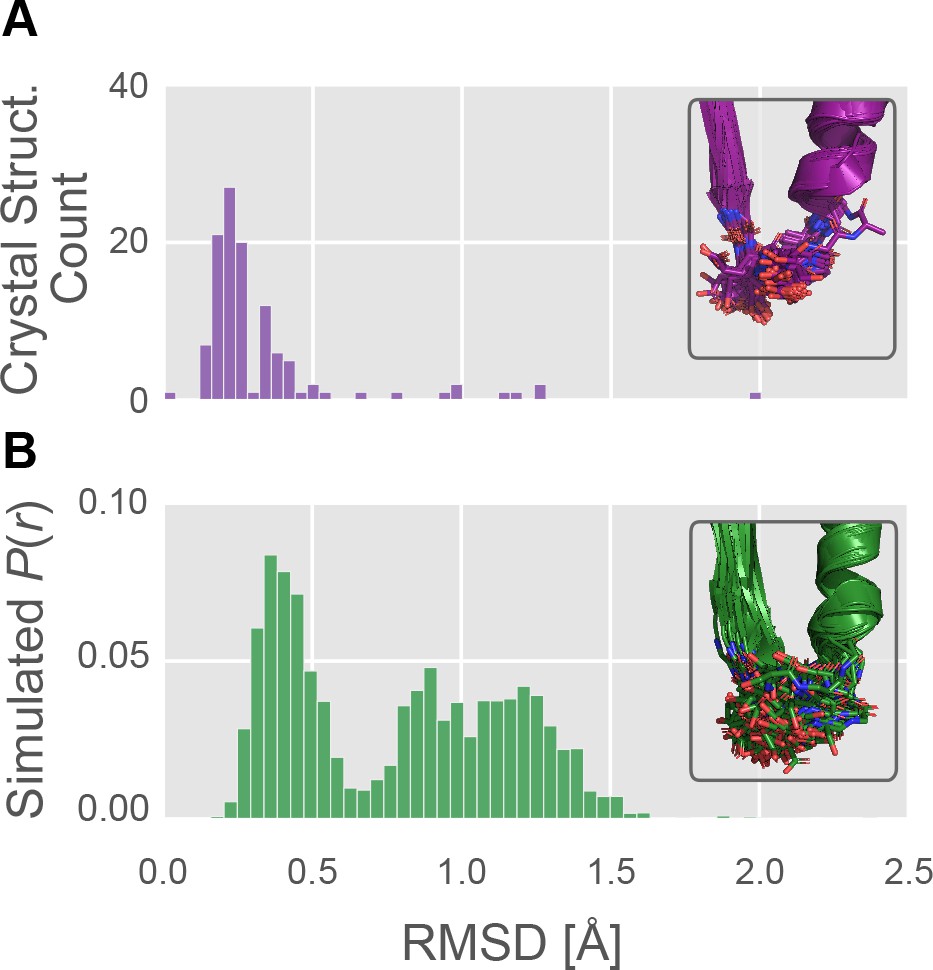
The P-loop conformational distribution observed in silico is substantially broader than the distribution found among crystal structures.
(A) The number of crystal structures (y-axis) as a function of P-loop RMSD to 4PA0 (x-axis). P-loop conformations in the PDB are largely restricted to backbone RMSD ≤0.6 Å to a reference conformation (PDB ID 4PA0). Inset, the 114 myosin crystal structures superimposed, with the P-loop shown as sticks. (B) The MSM-derived equilibrium probability (y-axis) as a function of P-loop RMSD to 4PA0 (x-axis). P-loop conformations from simulations of Hs β-cardiac myosin frequently explore conformations that are rare or not seen in crystal structures. Inset, the 114 most probable P-loop conformations extracted from our simulations of Hs β-cardiac myosin.
Figure 3 with 5 supplements
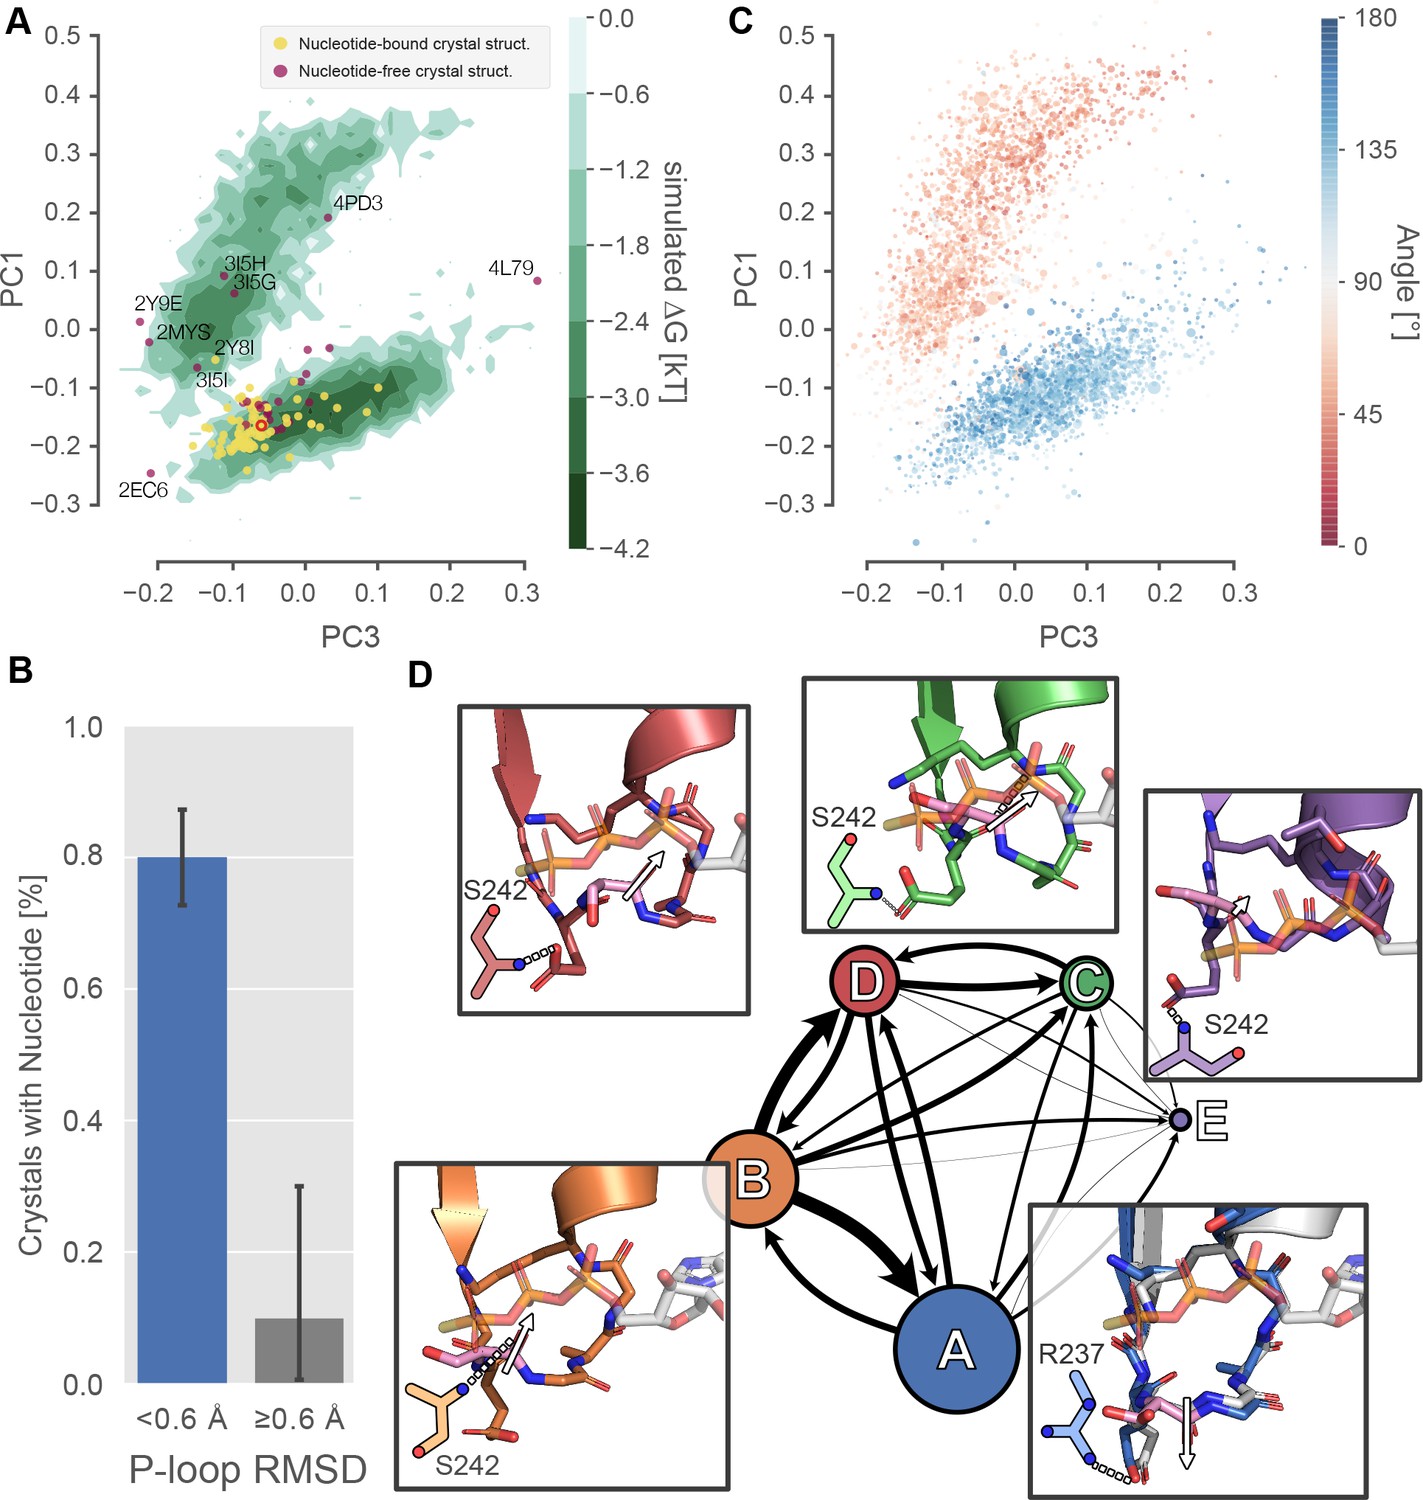
Excited P-loop states are less compatible with nucleotide than the states preferred in crystal structures.
(A) The β-cardiac whole-motor MSM-derived P-loop conformational space projected onto PCs 1 and 3 reveals two distinct free energy basins (green level sets). Yellow and purple points represent crystal structures with and without ligand, respectively. Structures farther than 0.6 Å from the β-cardiac myosin structure (red empty circle) are labeled with their PDB ID. (B) Proximity to the β-cardiac myosin reference conformation is associated with the presence of a nucleotide in crystal structures (p<1.3×10⁻⁵ by Fisher’s exact test), suggesting that the ligand stabilizes the A state. Error bars represent the 95% confidence interval of 1000 bootstrap realizations. (C) The re-orientation of the S180 backbone carbonyl accounts for the split between upper and lower basins. Points represent P-loop conformations from each state in the β-cardiac whole-motor MSM projected onto the same PCs as in panel A. Points are sized by their probability from the MSM and colored by the angle between the backbone carbonyl bond vectors of S180 and K184. (D) Center, each of the five states of the P-loop MSM are indicated as nodes in a network, sized by their equilibrium probability and connected by arrows with line width proportional to the transition probabilities between them. Surrounding the model, insets show example configurations of the P-loop in sticks colored to match the state they represent. State A is associated with a conformation of the S180 (pink sticks) carbonyl bond vector (white arrow) directed away from the nucleotide binding pocket, whereas states B-D are associated with the opposite orientation of the S180 backbone carbonyl bond vector. The A state conformation is the conformation found in most crystal structures. For reference, PDB 1MMA is shown in grey sticks and the crystallographic position of ATP is shown in semi-opaque grey sticks. For all states, important interactions with the Switch-I loop are shown as two-dimensional sketches for visual clarity. An interaction between R237 and E179 is specific to state A, whereas various interactions with S242 are indicative of other states (Figure 3—figure supplement 2).
Figure 3—figure supplement 1
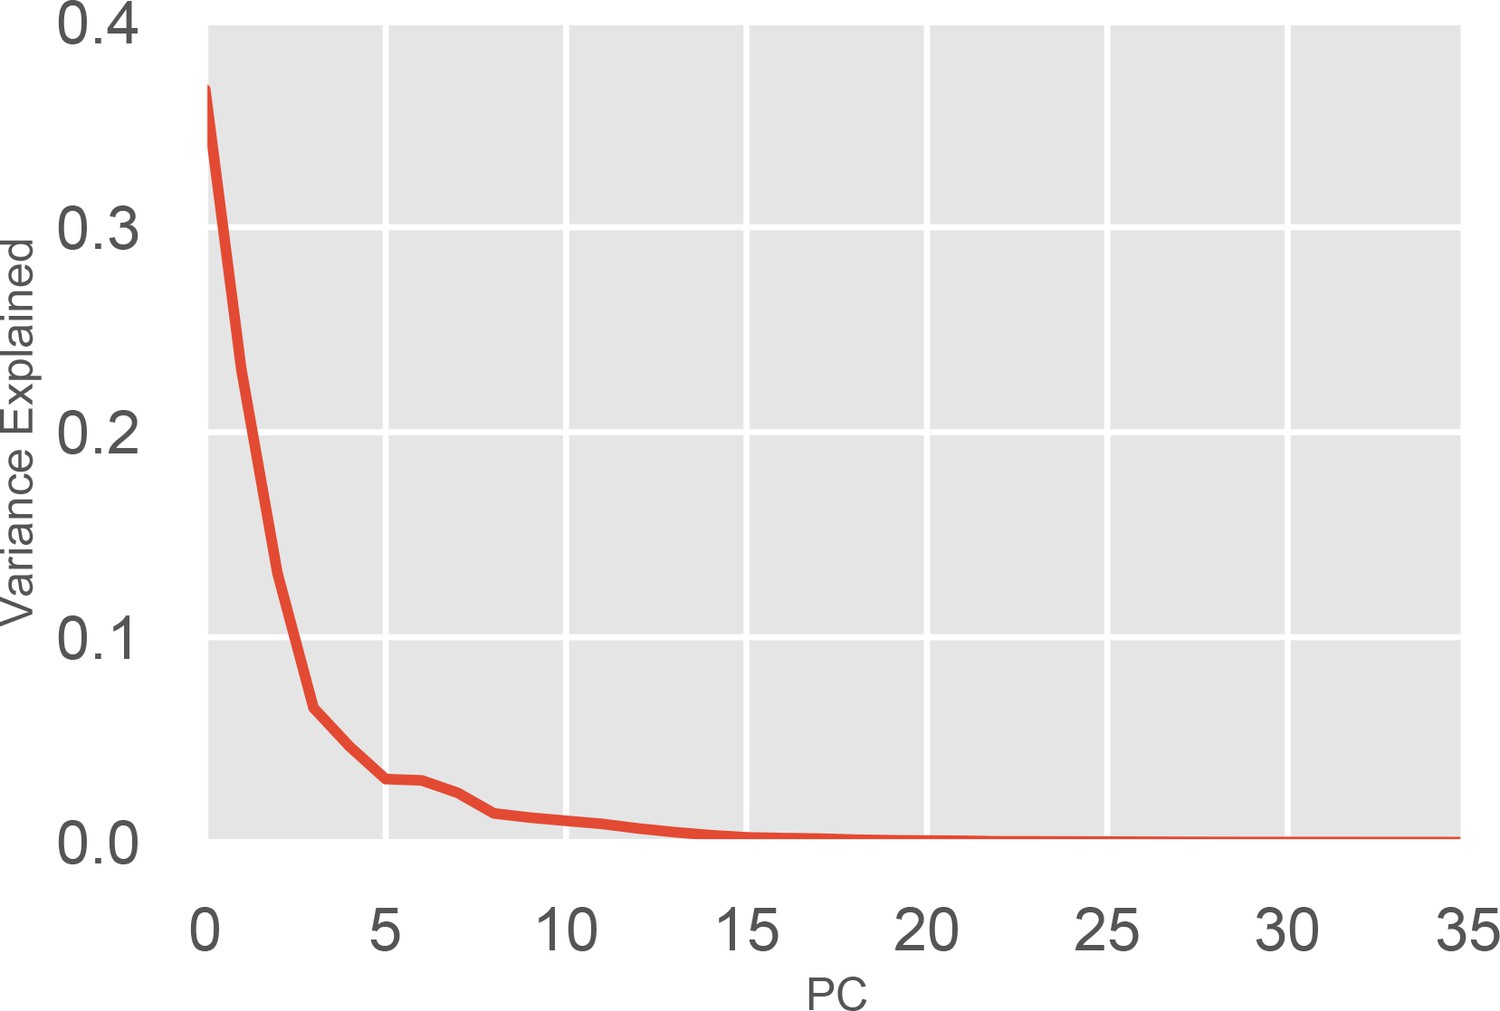
Variance explained by each component of the PCA of the of the P-loop on MYH7.
Each Principal Component (PC) in the PCA captures a certain fraction of the variance of the input data. Each PC is ranked by the amount of variance it explains. The above figure plots the PC number against the fraction of the overall variance it explains. Because 36 distances were used in total, 36 principal components are able to capture 100% of the variance. The top four PCs were used in clustering and for k-nearest neighbor state assignment.
Figure 3—figure supplement 2
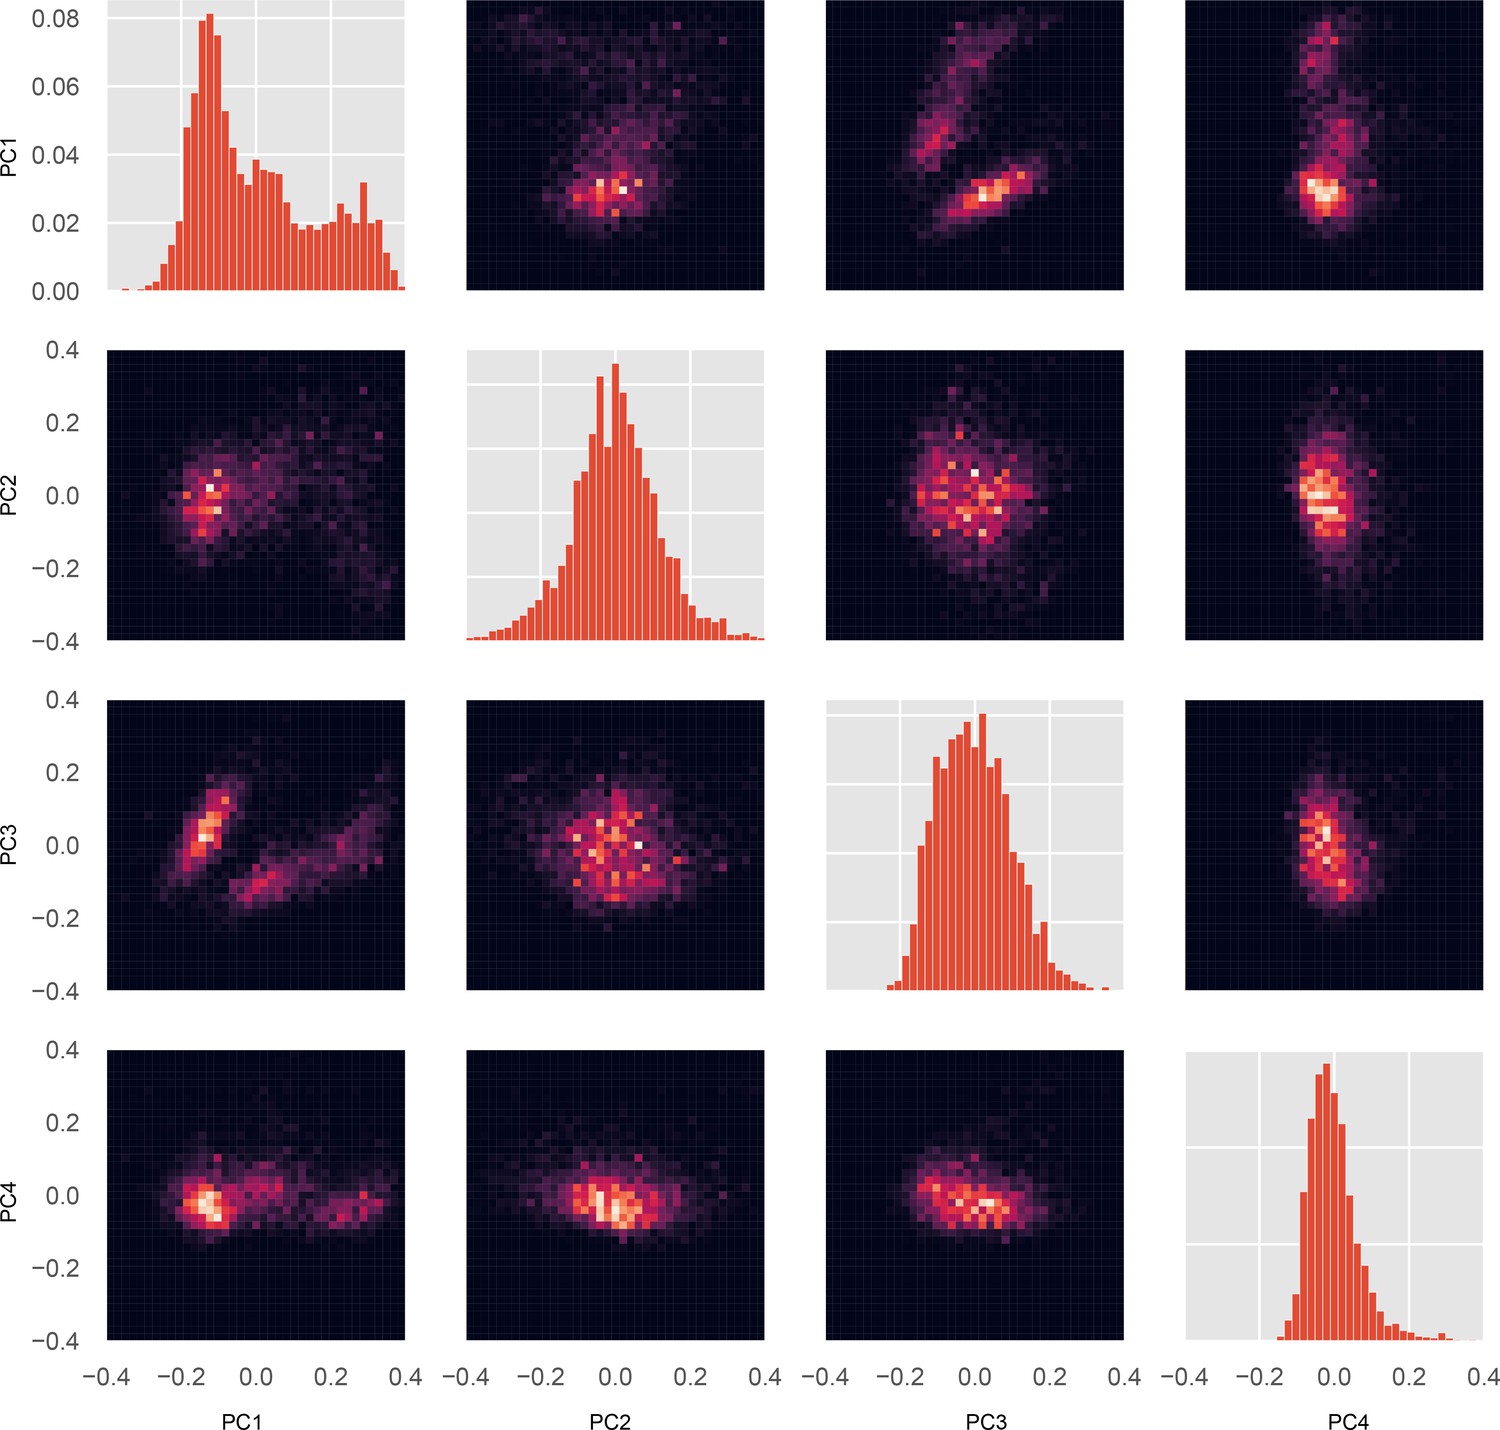
Joint and marginal distributions for all pairs of PCs.
Each conformation in the whole-motor MSM has a value for each PC. Using these values and the probability for each conformation, a probability distribution for every individual PC’s value, and for every pair of PCs, were constructed. For MYH7, we visualized every marginal distribution (a single PC’s probability distribution) and every pair of PCs’ joint distribution. Diagonal plots, marginal distributions for PCs 1 (top left) through 4 (bottom right). Off-diagonal plots, joint distributions for all pairs of PCs; each column i and row j has PC i on the x-axis and PC j on the y-axis, respectively.
Figure 3—figure supplement 3
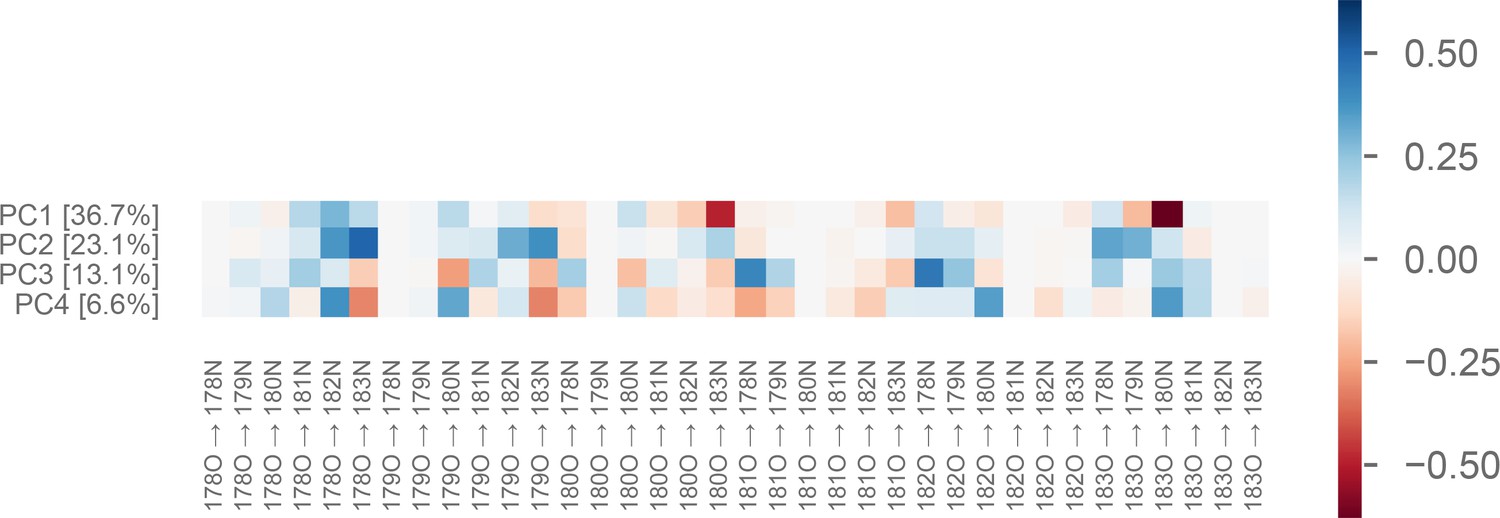
Weights of the first four principal components of the P-loop on MYH7.
The value of each PC for a particular conformation is a linear combination of each of the 36 input distances. In other words, it is the dot product of the vector of distances and the vector representing the PC (which weights each distance differently). This figure shows the relative contribution of each distance (x-axis) to each PC (y-axis). Percentages following principal component (PC) index indicate the fraction of the variance explained by that PC. Labels on the x-axis indicate a distance from [residue number][atom name] to [residue number][atom name], using the residue numbering found in the MYH7 crystal model 4PA0 (Winkelmann et al., 2015).
Figure 3—figure supplement 4
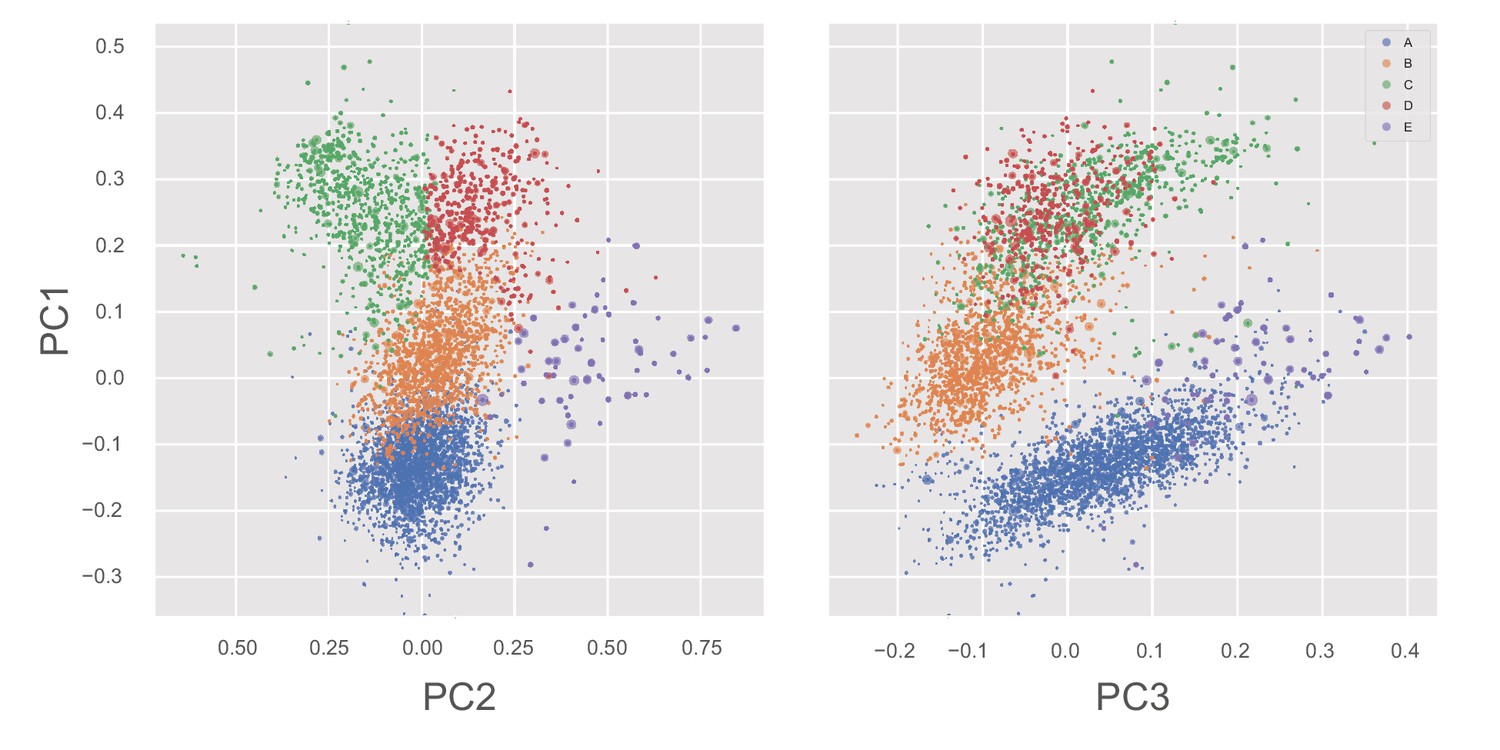
States of the whole-motor MSM of β-lactamase projected into PC1/PC2 and PC1/PC3 planes.
Each point, representing a single whole-motor MSM state, is colored by its P-loop state and sized according to its equilibrium probability. Note that, along the PC2 direction, the primary differences are between states C and E.
Figure 3—figure supplement 5

Specific interactions with Switch-I residues are statistical hallmarks of P-loop states.
Top left, the PDF over the distance between E179 sidechain carbonyl oxygens to the sidechain of R237. An interaction is a hallmark of the A state. Top right, the PDF over the S180O to S242H backbone-backbone distance. Close values are a hallmark of states B and E. Bottom left, the PDF over the E179 sidechain carbonyl oxygen to S242 amide proton distance. Low values are a hallmark of state C. Bottom left, the PDF over the distance between the G181 backbone carbonyl oxygen and the T185 backbone amide proton. Low values are a hallmark of state E. This is the i → i + 4 interaction typical of an alpha-helix.
Figure 4
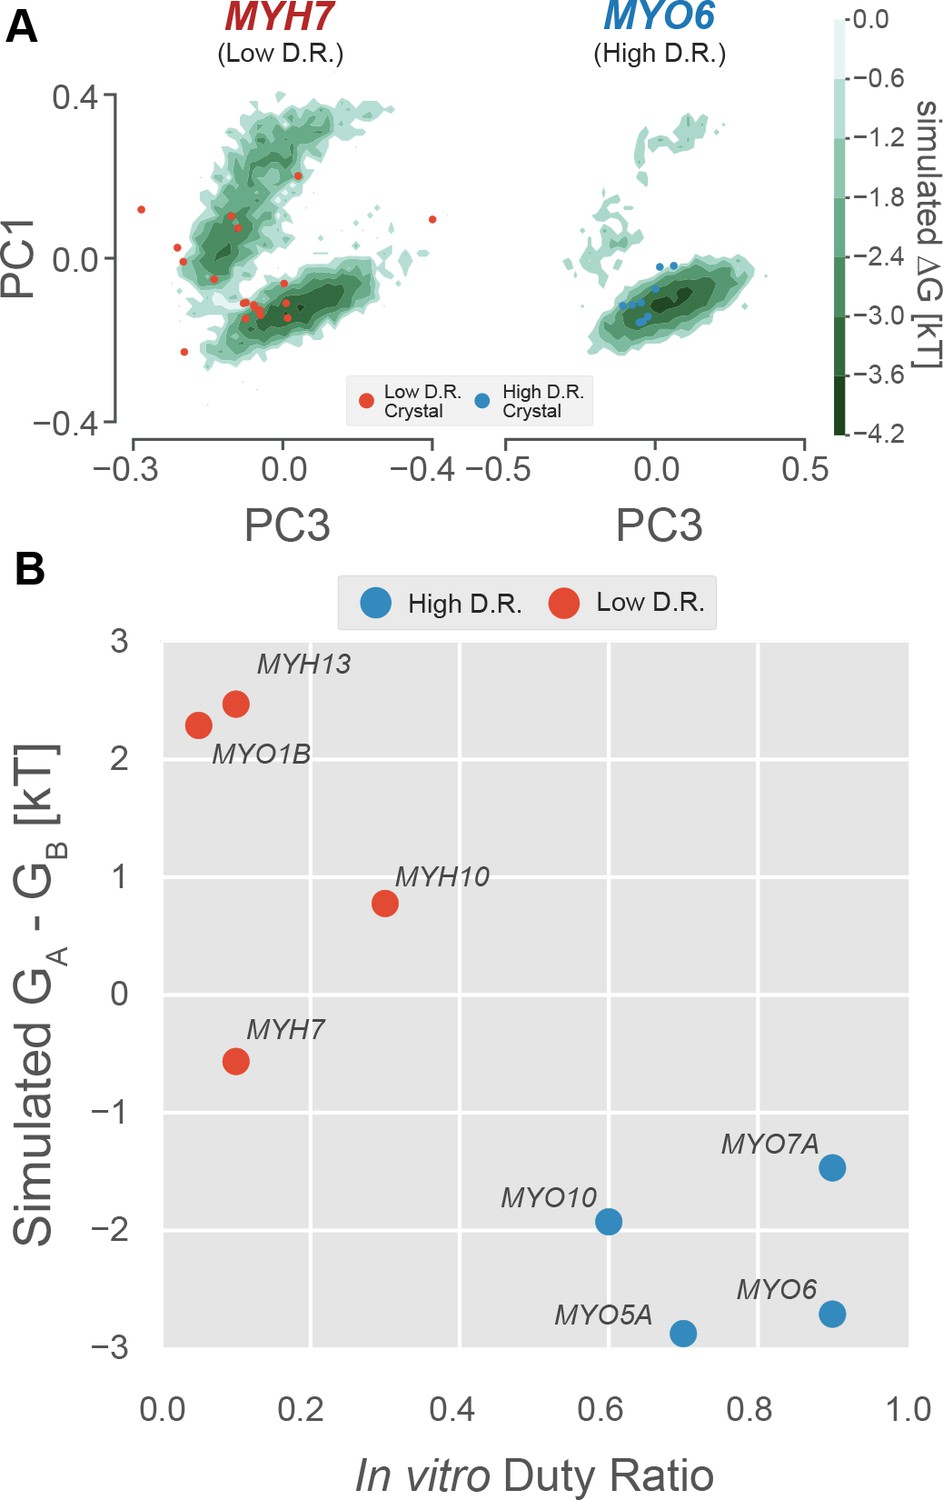
The free energy landscape of the P-loop encodes duty ratio.
(A) Free energy landscapes implied by whole-motor domain MSMs in the PC1/PC3 plane demonstrate that the upper basin is well sampled by an example low duty ratio motor (MYH7, left) and poorly sampled by an example high duty ratio motor (MYO6, right). Ligand-free crystal P-loop conformations from high and low duty ratio motors are shown as blue and red points, respectively. (B) Experimental duty ratio (x-axis) is correlated with the simulated free energy difference between (P-loop MSM-derived) nucleotide favorable and nucleotide-unfavorable states (y-axis, more negative values mean higher probability of the nucleotide-favorable A state). Free energy difference is used rather than probability because the log-scaling improves the legibility of the figure. Error in simulated free energy differences were estimated by jackknife resampling of trajectories and were too small to be visualized as error bars. Aggregate simulation times are listed in Table 3 and were between 126 µs and 323 µs for each point.
Figure 5
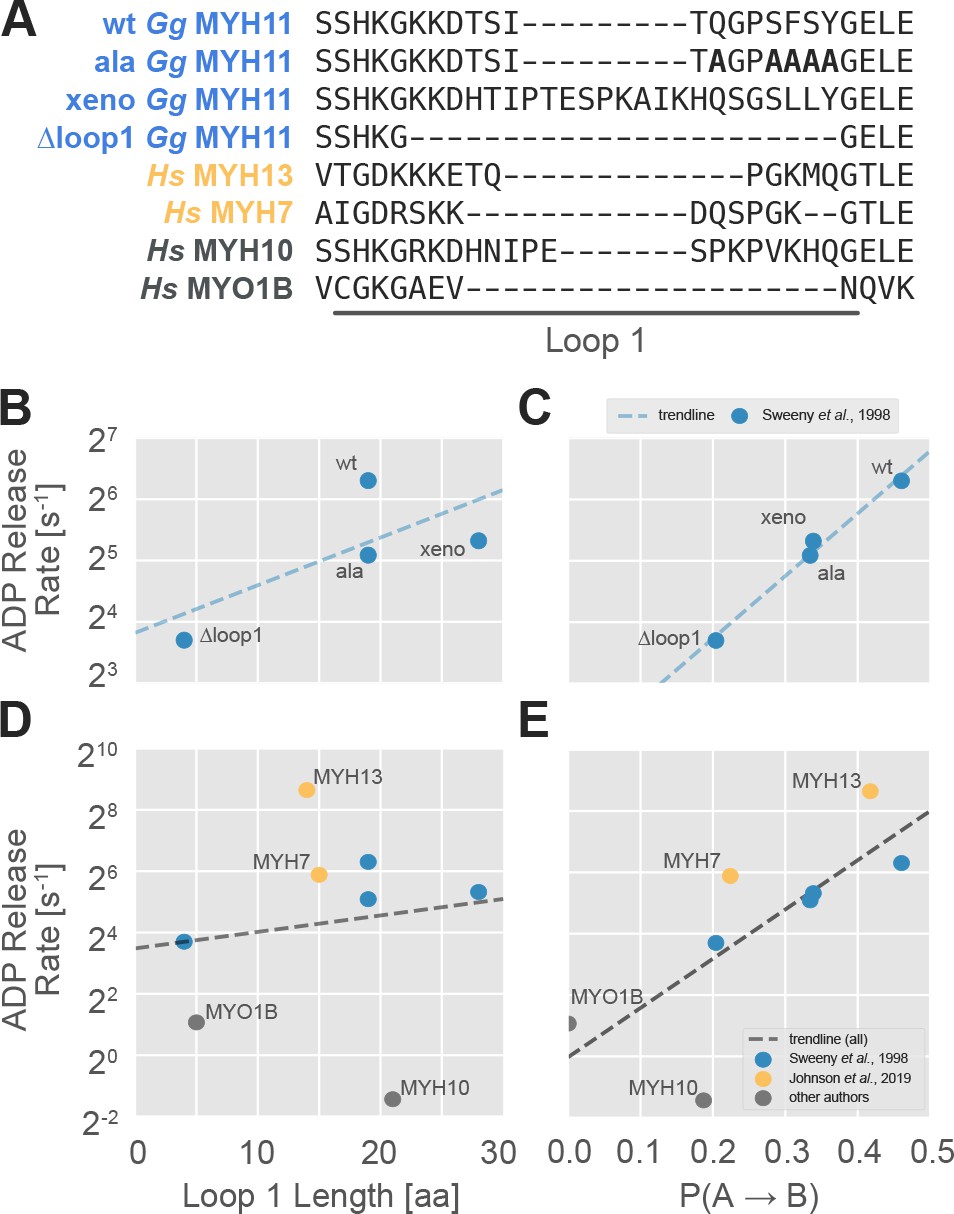
The probability of transitioning from nucleotide-favorable to nucleotide-unfavorable P-loop conformations (P(A→B), derived from P-loop MSMs) predicts experimental ADP release rates for motors with low duty ratios.
(A) Loop 1 sequences and lengths considered in this work. Residues mutated to alanine in the wild-type chicken gizzard MYH11 (wt Gg MYH11) are bolded in the appropriate row. (B) For the Sweeney dataset, there is a moderate relationship between loop 1 length and ADP release rate (Pearson’s R = 0.75) but, (C) there is a much stronger correlation between P(A→B) and ADP release rate (Pearson’s R = 0.99). (D) Across all datasets, the relationship between loop 1 length and ADP release rate is weak (Pearson’s R = 0.14), and (E) there is a much stronger correlation between P(A→B) and ADP release rate (Pearson’s R = 0.75). Error in MSM parameters was estimated by jackknife resampling of trajectories (aggregate simulation times are reported in Table 3, and are on the order of ~100 µs for human motors and ~10 µs for chicken motors) and errors in ADP release rates are those reported in the relevant original publication, where available.
Figure 6
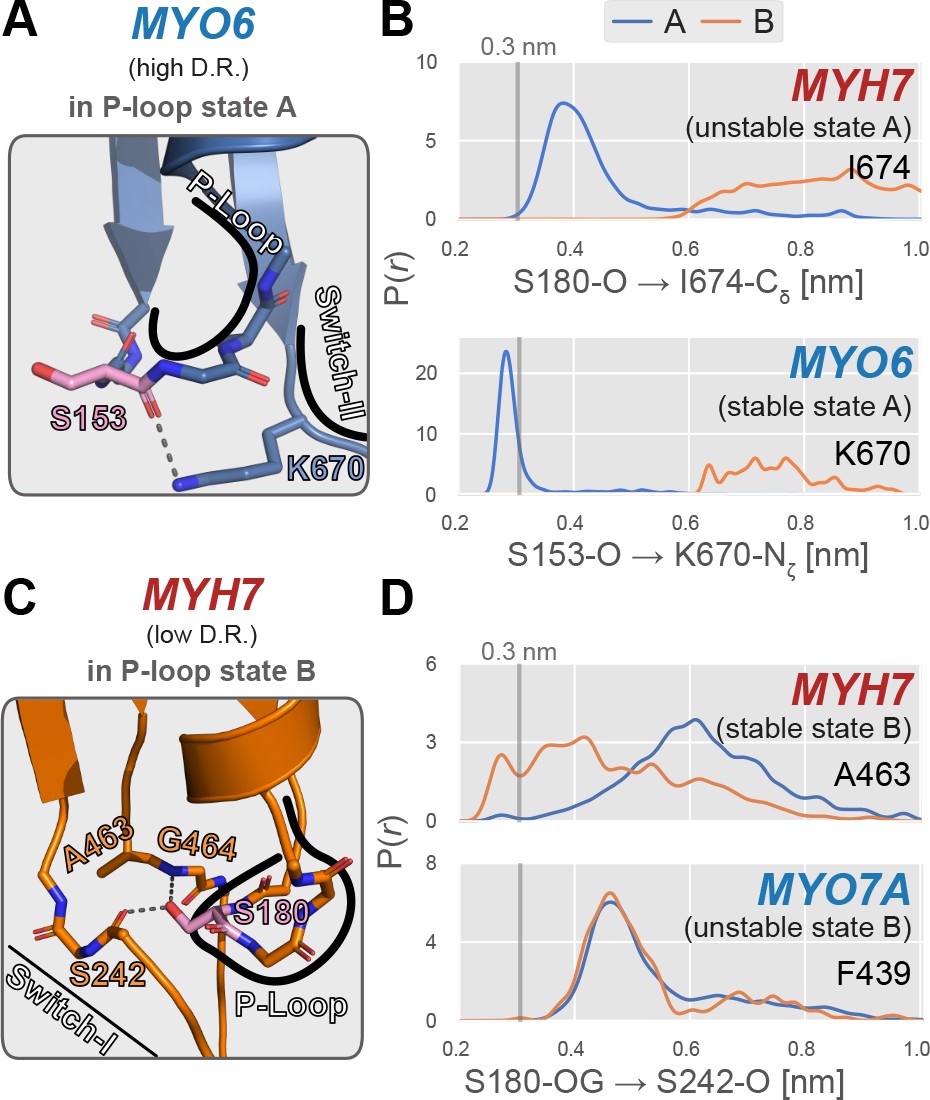
Examples of specific P-loop interactions that appear to modulate stability of specific P-loop states.
(A) MYO6, a high duty ratio motor, features an interaction between the backbone carbonyl oxygen of S153 (analogous to S180 in MYH7) and the side chain amide group of K670 on the switch-II loop. Myosin-IIs (MYH13, MYH7, and MYH10) feature an isoleucine at this position, eliminating this A state-stabilizing interaction. (B) In MYO6, the sidechain of K670 interacts tightly with the S153 backbone, whereas in MYH7, there is virtually no direct interaction between the homologous positions (S180 and I674). This presumably leads to a stabilization of state A in MYO6, contributing to its preference for the A state over the B state. An approximate cutoff distance for interaction, 3 Å, is marked as a vertical line. (C) In MYH7, a low duty ratio motor with a high relative B state probability permits interaction between the backbone carbonyl oxygen of S242 and the sidechain hydroxyl group of S180. This geometry is permitted by a small alanine sidechain at position 463. (D) When the P-loop is in state B, the sidechain hydroxyl group of S180 hydrogen bonds with the backbone carbonyl oxygen of S242 in MYH7, whereas MYO7A’s homologous positions do not interact in either state. This interaction presumably increases the relative probability of the B state relative to the A state and could in part account for MYH7’s higher propensity to adopt this excited conformation. The reference distance 3 Å is marked as a vertical line.
Tables
Table 1
Summary of simulations performed for this study.
Gene names are those found in PubMed Gene for the appropriate organism, and residue numbers are those used in the given template.
| Gene | Protein name | Construct | Species | Template | Agg. sim [µs] |
|---|---|---|---|---|---|
| MYH13 | Extraocular | 4–781 | H. sapiens | 4PA0 (Winkelmann et al., 2015) | 271.9 |
| MYH7 | β-cardiac | 2–780 | H. sapiens | 4PA0 (Winkelmann et al., 2015) | 276.2 |
| MYH10 | Nonmuscle IIb-B2 | 8–791 | H. sapiens | 4PD3 (Münnich et al., 2014) | 323.0 |
| MYO1B | Myosin-Ib | 5–703 | H. sapiens | 4L79 (Shuman et al., 2014) | 282.3 |
| MYO5A | Myosin-Va | 2–762 | H. sapiens | 1W8J (Coureux et al., 2004) | 297.5 |
| MYO6 | Myosin-VI | 2–770 | H. sapiens | 2BKI (Ménétrey et al., 2005) | 295.0 |
| MYO7A | Myosin-VIIa | 3–742 | H. sapiens | 1OE9 (Coureux et al., 2003) | 130.9 |
| MYO10 | Myosin-X | 3–740 | H. sapiens | 2AKA (Reubold et al., 2003) | 126.2 |
| MYH11 | Chicken gizzard | wt/2–782 | G. gallus | 4PD3 (Münnich et al., 2014) | 6.0 |
| MYH11 | Chicken gizzard | alanine | G. gallus | 4PD3 (Münnich et al., 2014) | 6.4 |
| MYH11 | Chicken gizzard | Xenopus | G. gallus | 4PD3 (Münnich et al., 2014) | 16.5 |
| MYH11 | Chicken gizzard | ∆loop 1 | G. gallus | 4PD3 (Münnich et al., 2014) | 10.5 |
Table 2
Experimentally-determined biochemical properties used in this study.
| Motor | Duty Ratio | ADP Release Rate [s-1] | Citation |
|---|---|---|---|
| MYH13 | 0.1 | 400 | Johnson et al., 2019 |
| MYH7 | 0.1 | 59 | Johnson et al., 2019 |
| MYH10 | 0.3 | 0.37 | Nagy et al., 2013 |
| MYO1B | 0.05 | 2.1 | Lewis et al., 2012 |
| MYO5A | 0.7 | 12 | De La Cruz et al., 1999 |
| MYO6 | 0.9 | 5.6 | De La Cruz et al., 2001 |
| MYO7A | 0.9 | 2.1 | Watanabe et al., 2006 |
| MYO10 | 0.6 | 18 | Kovács et al., 2005 |
| MYH11, wild-type | 0.15 | 79 | Sweeney et al., 1998 |
| MYH11, alanine sub. | 0.15 | 34 | Sweeney et al., 1998 |
| MYH11, Xenopus | 0.15 | 40 | Sweeney et al., 1998 |
| MYH11, ∆loop 1 | 0.15 | 13 | Sweeney et al., 1998 |
Table 3
Parameters of whole-motor Markov state models used in this study.
Fitting coarse-grained P-loop MSMs used the same procedure, but assignments based on P-loop state were used, rather than assignments to whole-motor SASA states. P(A → B) is a parameter of these MSMs. In all cases for coarse-grained P-loop MSMs, a lag time of 37.5 ns was used. Clustering and Markov state model routines are implemented in enspara, git revision f874ba. Solvent accessibility, atomic distance, and RMSD calculations were performed with MDTraj (McGibbon et al., 2015). We made extensive use of jug (Coelho, 2017) and GNU Parallel (Tange, 2011) for task-level parallelization and management of dependencies between tasks.
| Simulation set | No. of states | Cluster radius [nm2] | Lag time [ns] |
|---|---|---|---|
| MYH13 | 14102 | 7.4 | 0.4 |
| MYH7 | 5128 | 7.34 | 0.5 |
| MYH10 | 7746 | 8.0 | 1.5 |
| MYO1B | 6458 | 6.6 | 0.8 |
| MYO5A | 4728 | 7.25 | 0.4 |
| MYO6 | 4193 | 6.9 | 0.9 |
| MYO7A | 8737 | 6.9 | 0.4 |
| MYO10 | 9273 | 6.9 | 0.4 |
| MYH11, wild-type | 8050 | 4.9 | 1.5 |
| MYH11, alanine sub. | 7822 | 4.9 | 1.5 |
| MYH11, Xenopus | 12804 | 5.2 | 1.5 |
| MYH11, ∆loop 1 | 8925 | 5.0 | 1.5 |
Additional files
Download links
A two-part list of links to download the article, or parts of the article, in various formats.
Downloads (link to download the article as PDF)
Open citations (links to open the citations from this article in various online reference manager services)
Cite this article (links to download the citations from this article in formats compatible with various reference manager tools)
Conformational distributions of isolated myosin motor domains encode their mechanochemical properties
eLife 9:e55132.
https://doi.org/10.7554/eLife.55132


