Synergistic actions of v-SNARE transmembrane domains and membrane-curvature modifying lipids in neurotransmitter release
- Institute for Physiology, Center of Integrative Physiology and Molecular Medicine, Saarland University, Germany
- Institute for Physiology, Otto-von-Guericke University, Germany
Figures
Figure 1 with 1 supplement
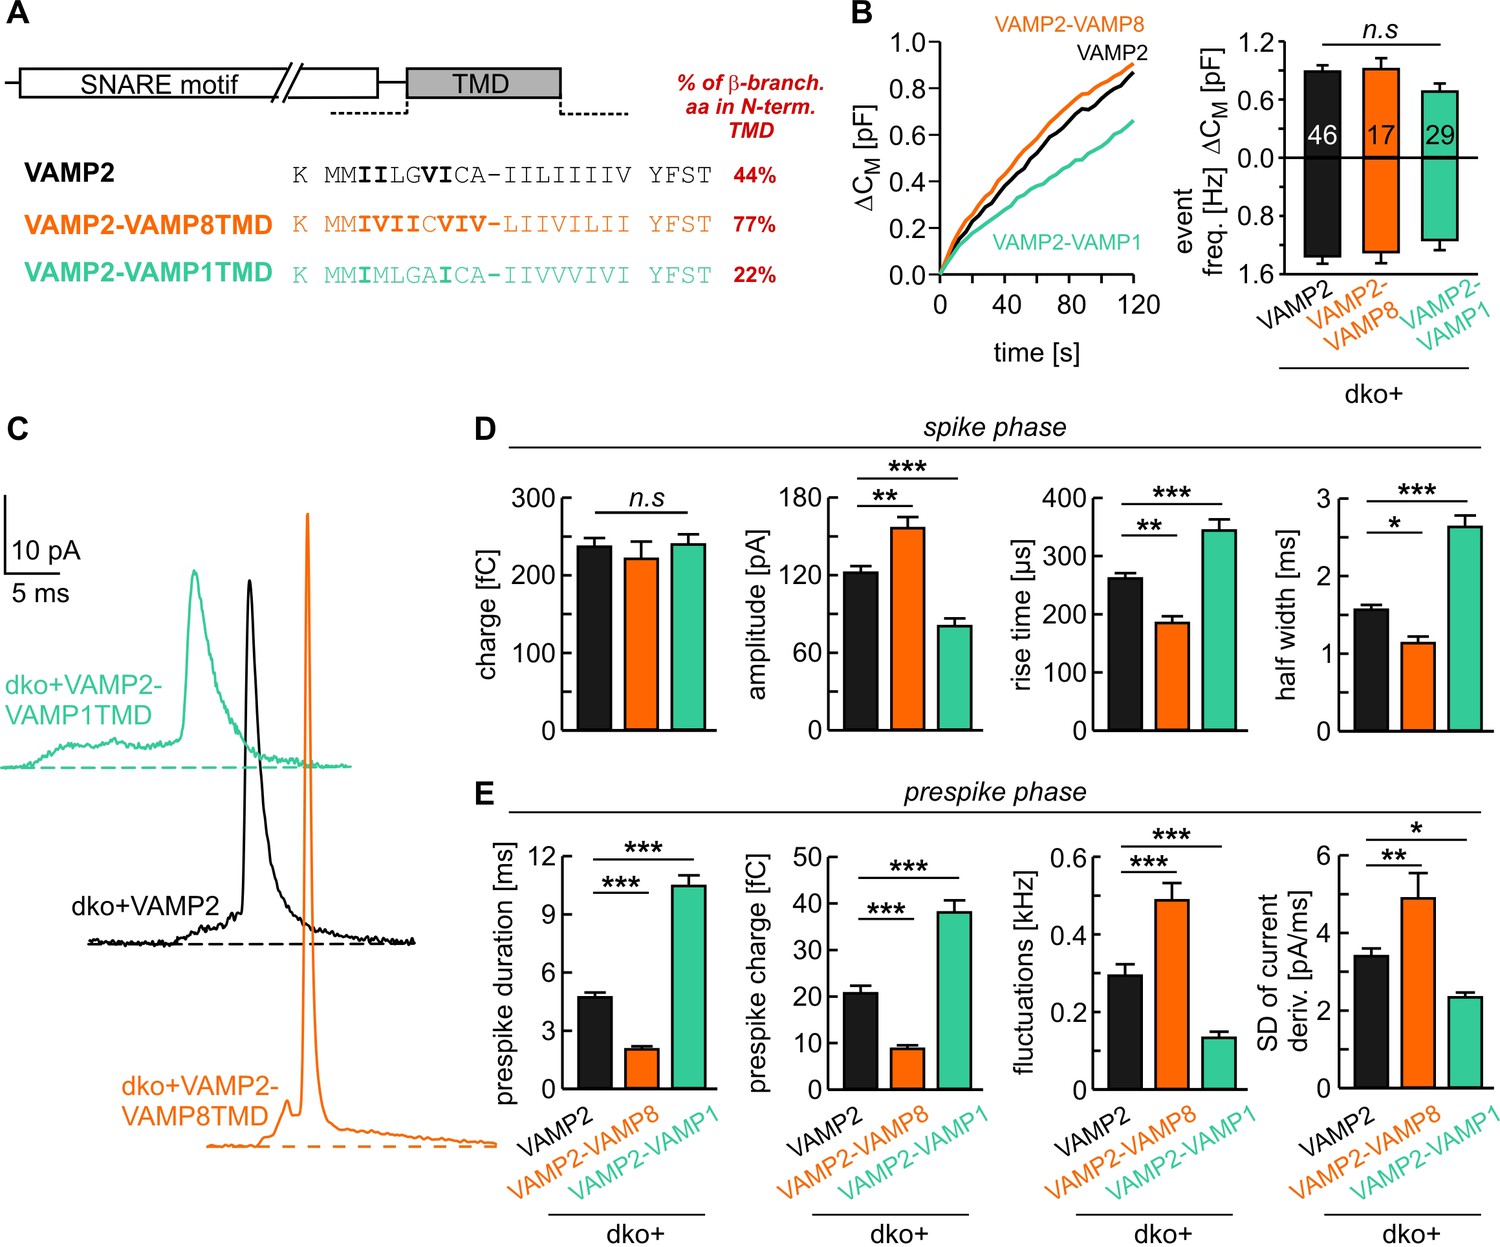
v-SNARE TMD variants differentially control fusion pore kinetics.
(A) Primary sequence of VAMP2 TMD and its chimeras with a VAMP8 or VAMP1 TMD. ß-branched residues of the N-terminal TMD region are highlighted in bold. (B) Mean capacitance changes in response to intracellular perfusion with 19 µM free Ca2+ in the indicated groups (left panel). Total ∆CM (top) and amperometric event frequency (bottom) measured over 120 s (right panel) show that both v-SNARE chimeric variants support normal exocytosis. T0 is the first time point of CM measurement, 2–3 s after starting the Ca2+-infusion via the patch pipette. (C) Exemplary amperometric events with similar charge but altered release profiles for the indicated VAMP2 variants. (D, E) VAMP2-VAMP8TMD mutant shortens the prespike duration and accelerates the spike waveform (increased amplitude, reduced 50–90% rise time, and half width). Conversely, the VAMP2-VAMP1TMD prolongs the prespike phase, slows down the kinetics of the spike and reduces its amplitude. Values are given as mean of median determined from the indicated parameter’s frequency distribution for each cell. Data were collected from cells/events measured for VAMP2 (46/3588), VAMP2-VAMP8TMD (17/1232), VAMP2-VAMP1TMD (29/1757). Only cells with >20 events were considered. Data are presented as mean ± SEM. *p<0.05, **p<0.01, ***p<0.001, one-way analysis of variance followed by Tukey-Kramer post test.
Figure 1—figure supplement 1
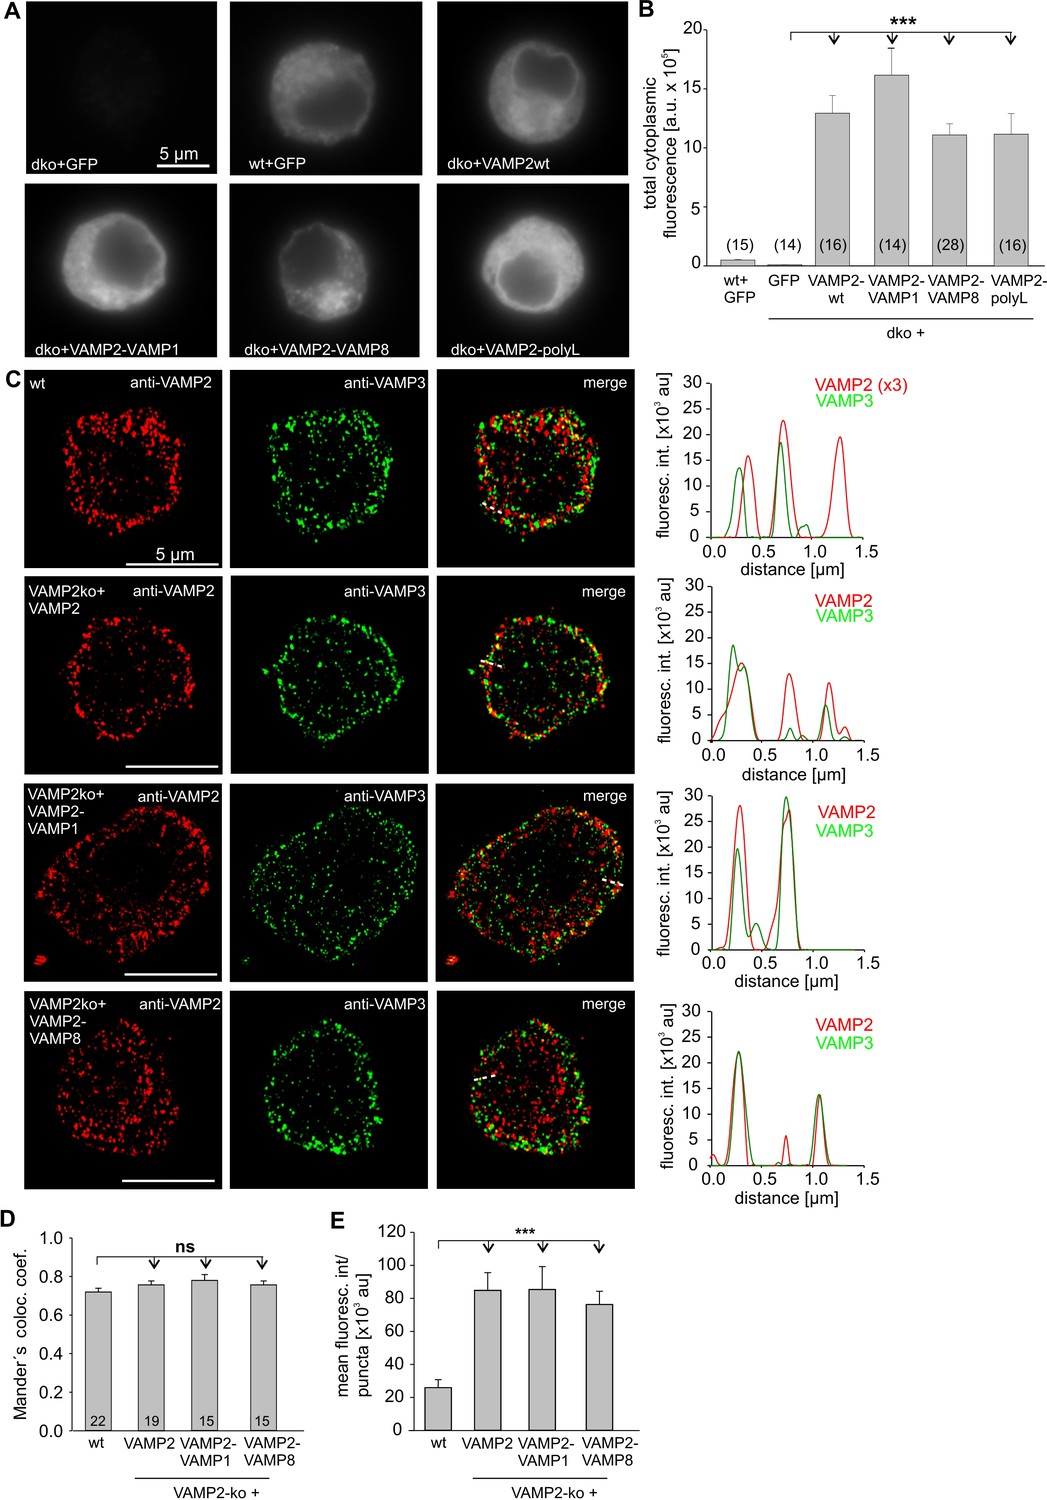
VAMP2-TMD mutants exhibit a similar expression and sorting pattern to granules as the wt protein.
(A) Exemplary immunofluorescence images of wt and dko cells expressing either GFP, VAMP2 or its TMD mutant variants. Cells were immunolabelled with an affinity purified mouse monoclonal antibody against VAMP2 (clone 69.1, antigen epitope amino acid position 1–14). Note that signals in dko cells expressing VAMP2 or its mutant variants were stronger than in wt+GFP cells and were visualized after adjustment of the camera’s exposure time (e.g. wt+GFP,1.18s; dko+VAMP2, 0.076 s). (B) Mean total fluorescence intensity of wt+GFP, dko+GFP and dko cells expressing VAMP2 or the indicated mutants (determined 3.5 hr after transfection). (C) Representative structured illumination microscopy images (SIM) for VAMP2 (red) and the other v-SNARE protein VAMP3 (green) in wt and VAMP2-ko chromaffin cells expressing either VAMP2 or the indicated VAMP2-TMD mutant. VAMP2 fluorescence signals of wt cells were illuminated with a threefold higher laser power than in virus-transfected cells. The merged images and the corresponding line scans (dashed lines, right panels) display a clear colocalization between VAMP3 and VAMP2 or its mutant variants. (D) Mander’s weighted colocalization of VAMP2 or its TMD mutants to endogenous VAMP3 indicates a similar colocalization coefficient (71.9 ± 2%) for VAMP2 and the TMD mutant variants (VAMP2ko+: VAMP2, 73.8 ± 2%; VAMP2-VAMP1, 78 ± 3%; VAMP2-VAMP8, 76 ± 2%). Numbers of analyzed cells are indicated in the bar. (E) The fluorescence intensity of the discrete immunopositive puncta is similar for VAMP2 and the mutant protein and four times higher than for the littermate control (wt) cells. Images were thresholded to values 6 x SD of the background fluorescence to isolate discrete regions of interest for analysis. Data are represented as mean ± SEM. ***p<0.001, one-way analysis of variance between indicated groups followed by Tukey-Kramer post test (B, D and E).
Figure 2
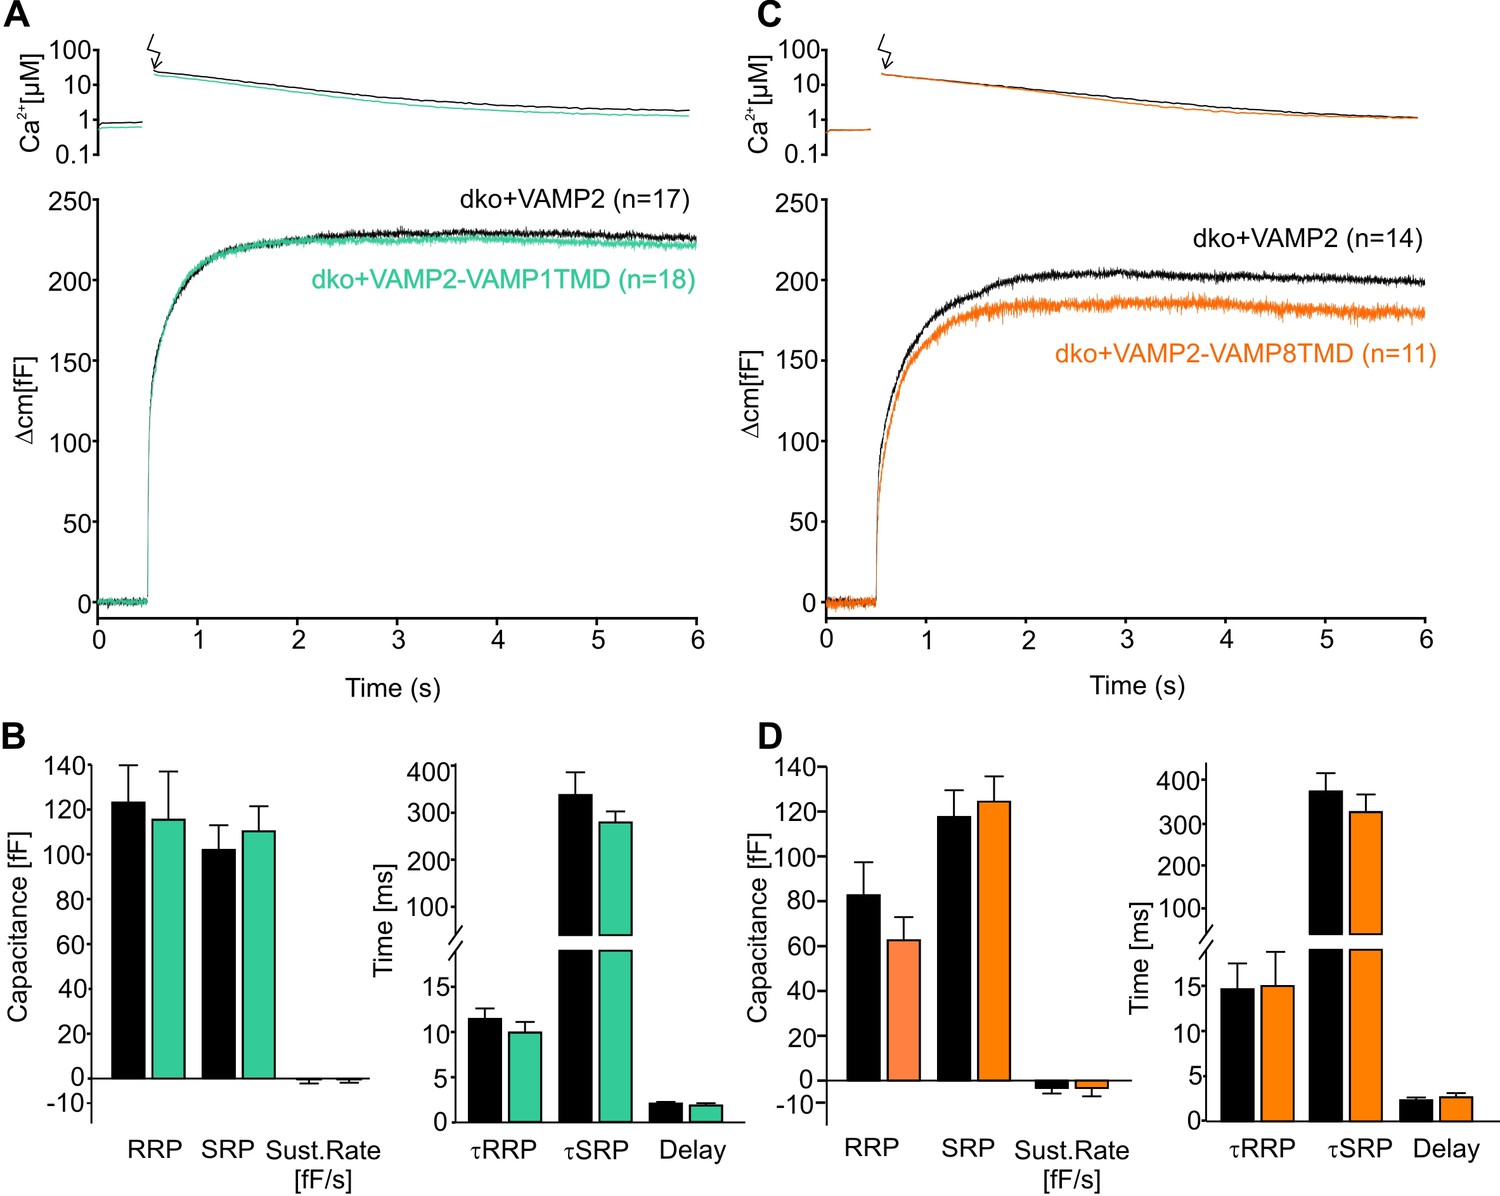
The naturally occurring v-SNARE TMD variants do not affect synchronous secretion.
(A) Mean flash-induced [Ca2+]i levels (top panel) and corresponding CM responses (lower panels) of dko cells expressing either VAMP2 or the VAMP2-VAMP1TMD mutant. (B) The VAMP2-VAMP1TMD mutant fully restored the flash evoked response with an unchanged RRP, SRP and sustained rate of release. Neither the kinetics of release τRRP, τSRP nor the secretory delay was altered. (C) Mean flash-induced [Ca2+]i levels (top panel) and corresponding CM responses (lower panels) of dko cells expressing either VAMP2 or the VAMP2-VAMP8TMD. (D) Neither the extent (left panel) nor the kinetics of secretion (right panel) were altered with expression of the VAMP2-VAMP8TMD. Arrow indicates UV-flash. Data are represented as mean ± SEM and numbers of cells are indicated within brackets. Mann-Whitney Rank Sum test.
Figure 3 with 1 supplement
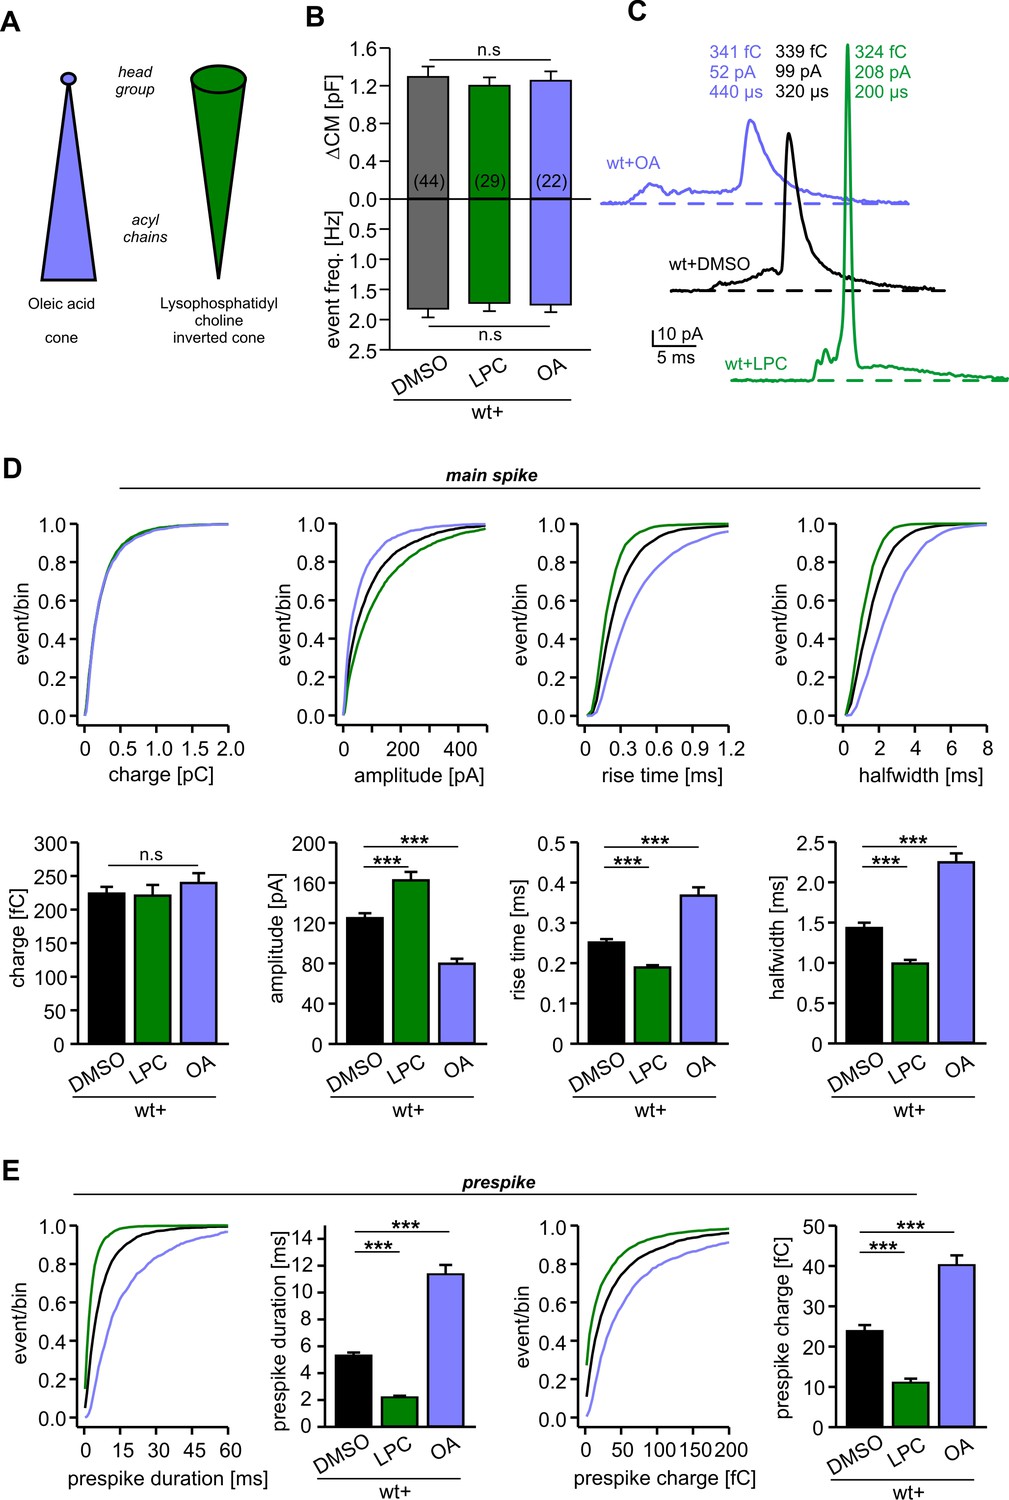
Extracellular application of cone and inverted cone shaped lipid molecules differentially controls fusion pore kinetics.
(A) Schematic representation of oleic acid (OA, cone) and lysophosphatidyl choline (LPC, inverted cone) inducing negative and positive curvature of the membrane, respectively. (B) Extracellular application of LPC or OA does not affect the average ∆CM (top) or the amperometric event frequency (bottom). Data are averaged from the indicated number of cells. (C) Exemplary amperometric events with similar charge but altered kinetic release profile for the indicated conditions. (D) Cumulative frequency distributions (upper panels) and cell-weighted averages (lower panels) for the indicated parameter of the main spike. Note that LPC accelerates the spike waveform, whereas OA slows down the current transient. (E) Extracellular LPC and OA oppositely affect the prespike phase. LPC shortens the prespike duration and reduces the prespike charge, while OA prolongs the prespike duration and increases its charge. Values are given as mean of median determined from the indicated parameter’s frequency distribution for each cell. Data were collected from cells/events measured for wt+DMSO (44/4322), wt+LPC (29/3554), wt+OA (22/2616). Only cells with >20 events were considered. Data are represented as mean ± SEM. ***p<0.001, one-way analysis of variance followed by Tukey-Kramer post test.
Figure 3—figure supplement 1
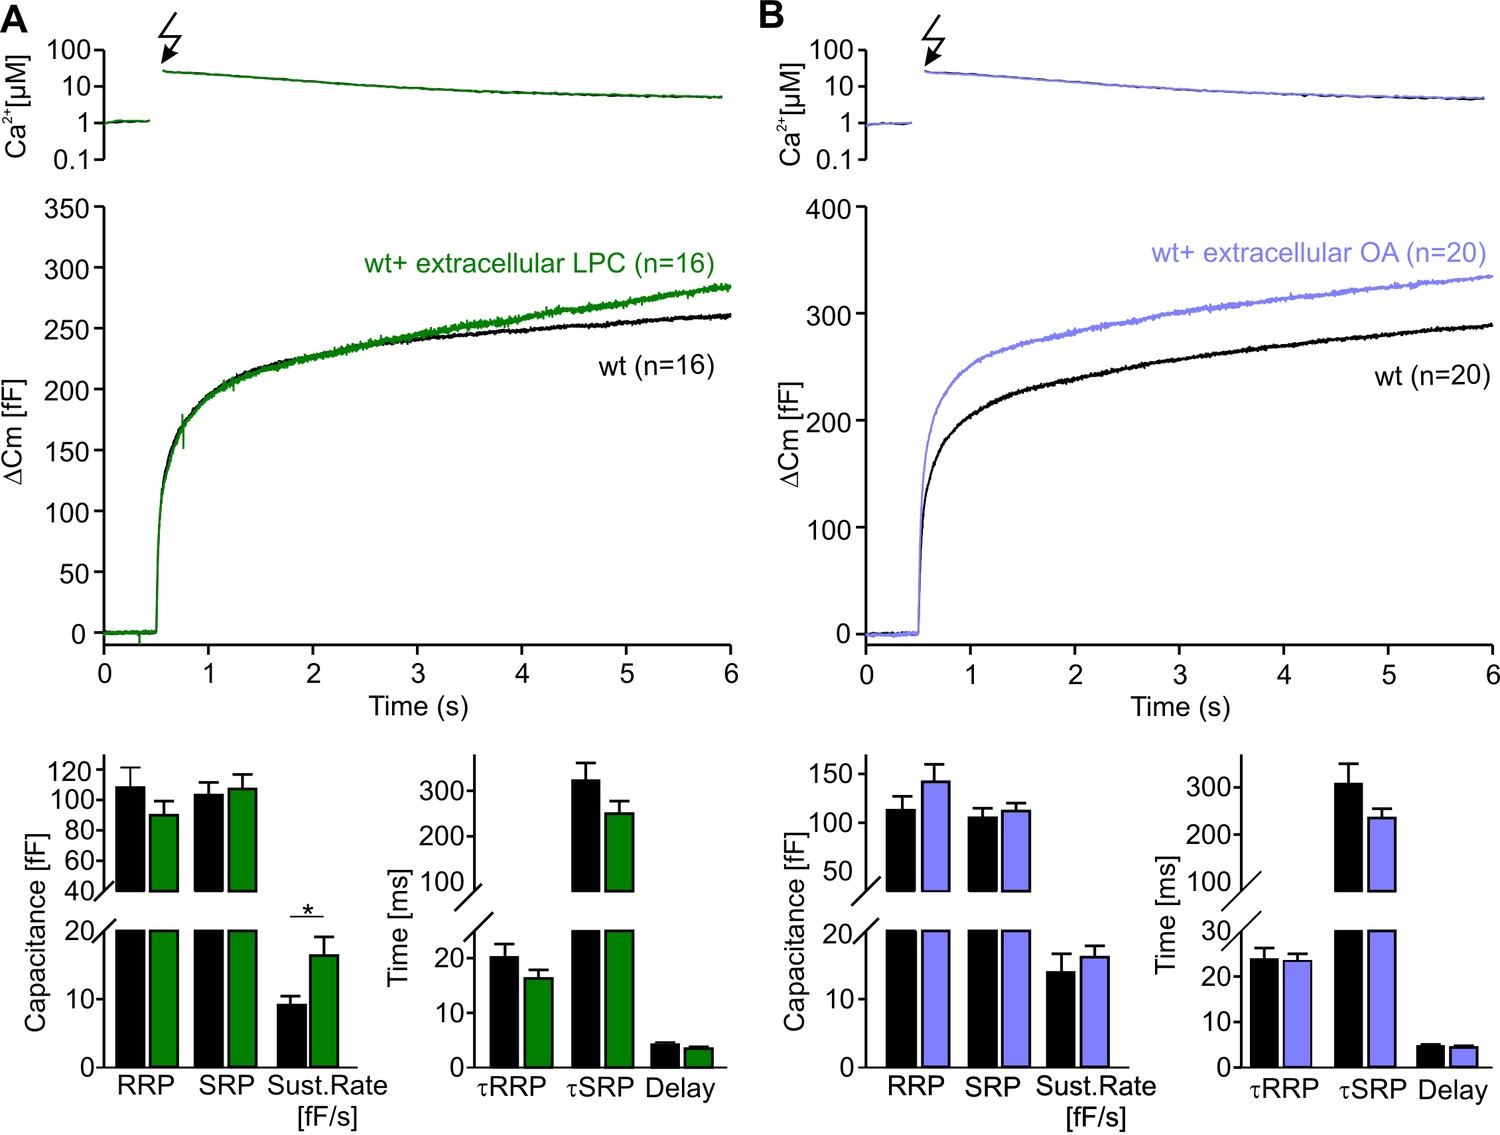
Extracellular application of LPC or OA does not affect overall secretion.
(A,C) Mean flash-induced [Ca2+]i levels (top panel) and corresponding CM responses (lower panels) of wt cells with extracellular LPC or OA application. (B,D) Neither LPC nor OA affects the extent of secretion (RRP, SRP, sustained rate of release, left panels) or the stimulus-secretion coupling (τRRP, τSRP and the secretory delay, right panels). Arrow indicates UV-flash. Data are represented as mean ± SEM and numbers of cells are indicated within brackets. *, p<0.05, Mann-Whitney Rank sum test.
Figure 4 with 1 supplement
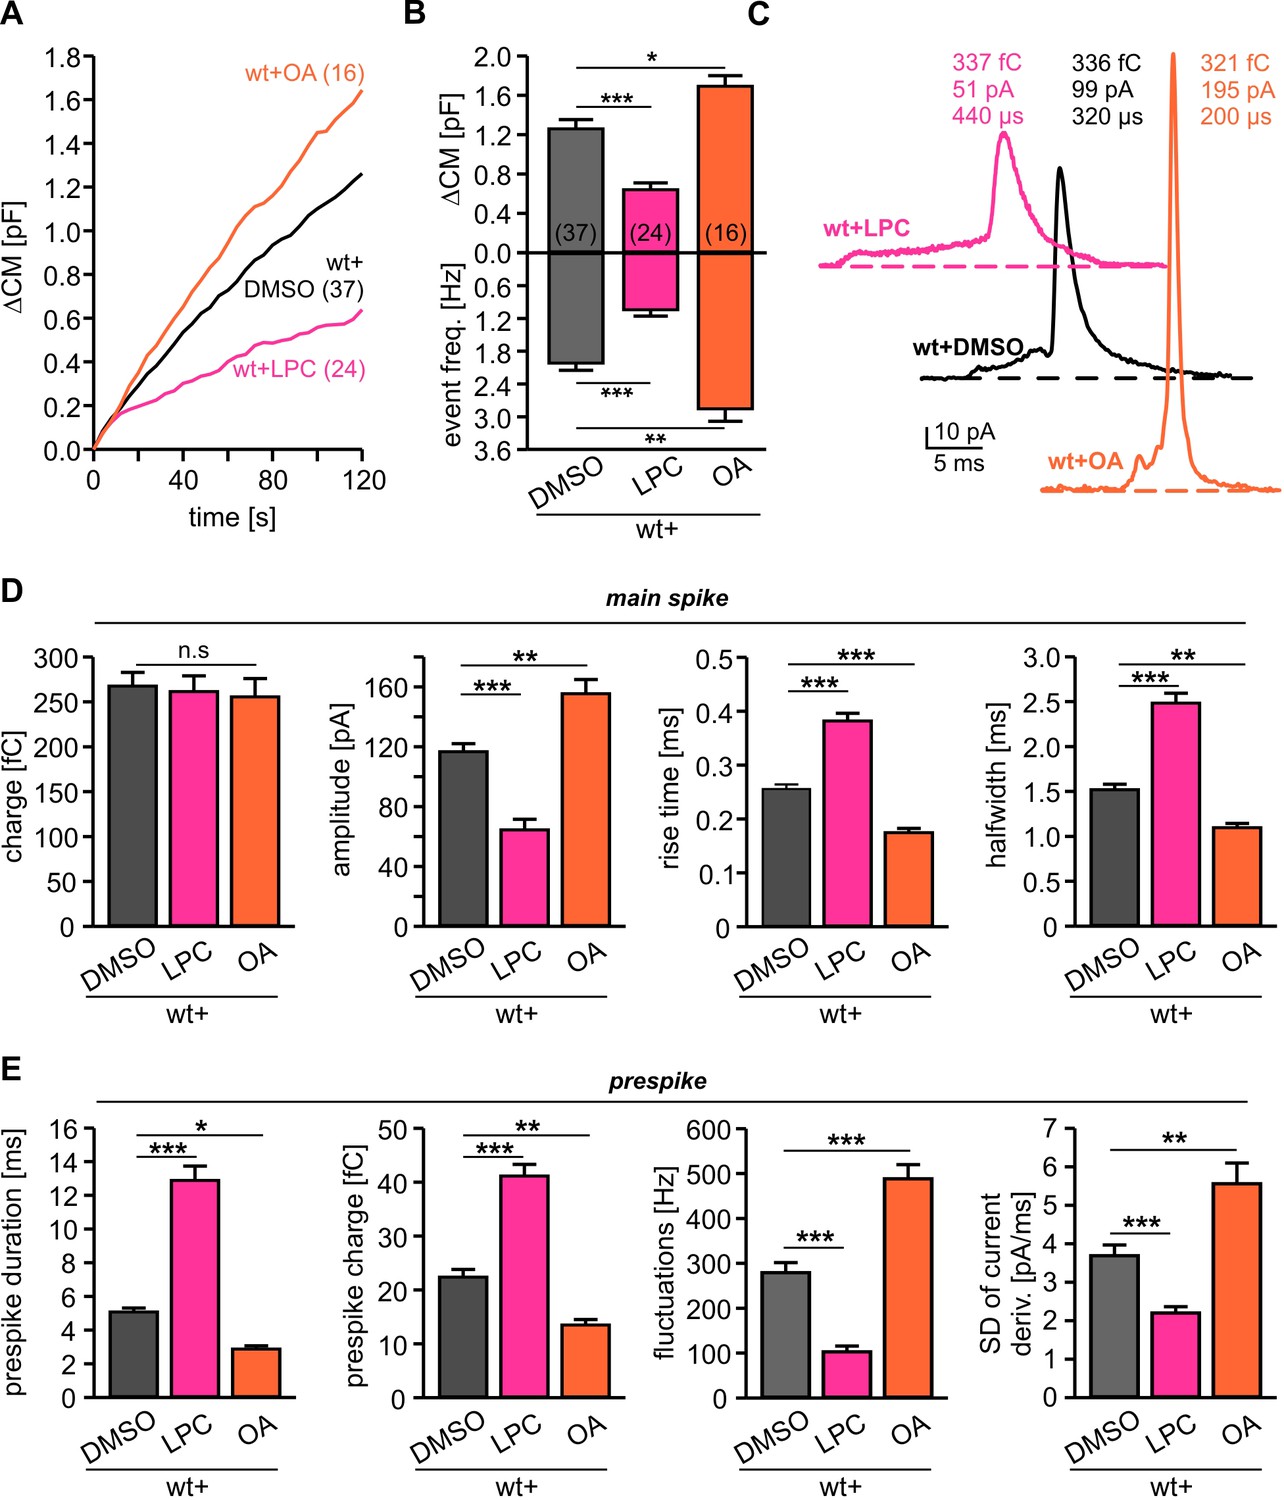
Intracellular application of LPC and OA oppositely affects total membrane fusion and fusion pore kinetics.
(A) Mean capacitance changes in response to stimulus for the indicated groups. (B) Intracellular LPC reduces and intracellular OA enhances total ∆CM response (top) and the corresponding amperometric event frequency (bottom). Data are averaged from the indicated number of cells. (C) Exemplary amperometric events with similar charge but altered release kinetic profile for wt+DMSO (control), wt+LPC and wt+OA. (D) Intracellular LPC decelerates the spike waveform by lowering the amplitude, prolonging the rise time and half width (without affecting the spike charge), whereas OA accelerates the current transient. (E) Intracellular LPC and OA oppositely affect the indicated parameters of the prespike phase. Values are given as mean of median determined from the indicated parameter’s frequency distribution for each cell. Data were collected from cells/events measured for wt (37/4023), wt+LPC (24/1674), wt+OA (16/2104). Only cells with >20 events were considered. Data are represented as mean ± SEM. *p<0.05, **p<0.01, ***p<0.001, one-way analysis of variance followed by Tukey-Kramer post test.
Figure 4—figure supplement 1
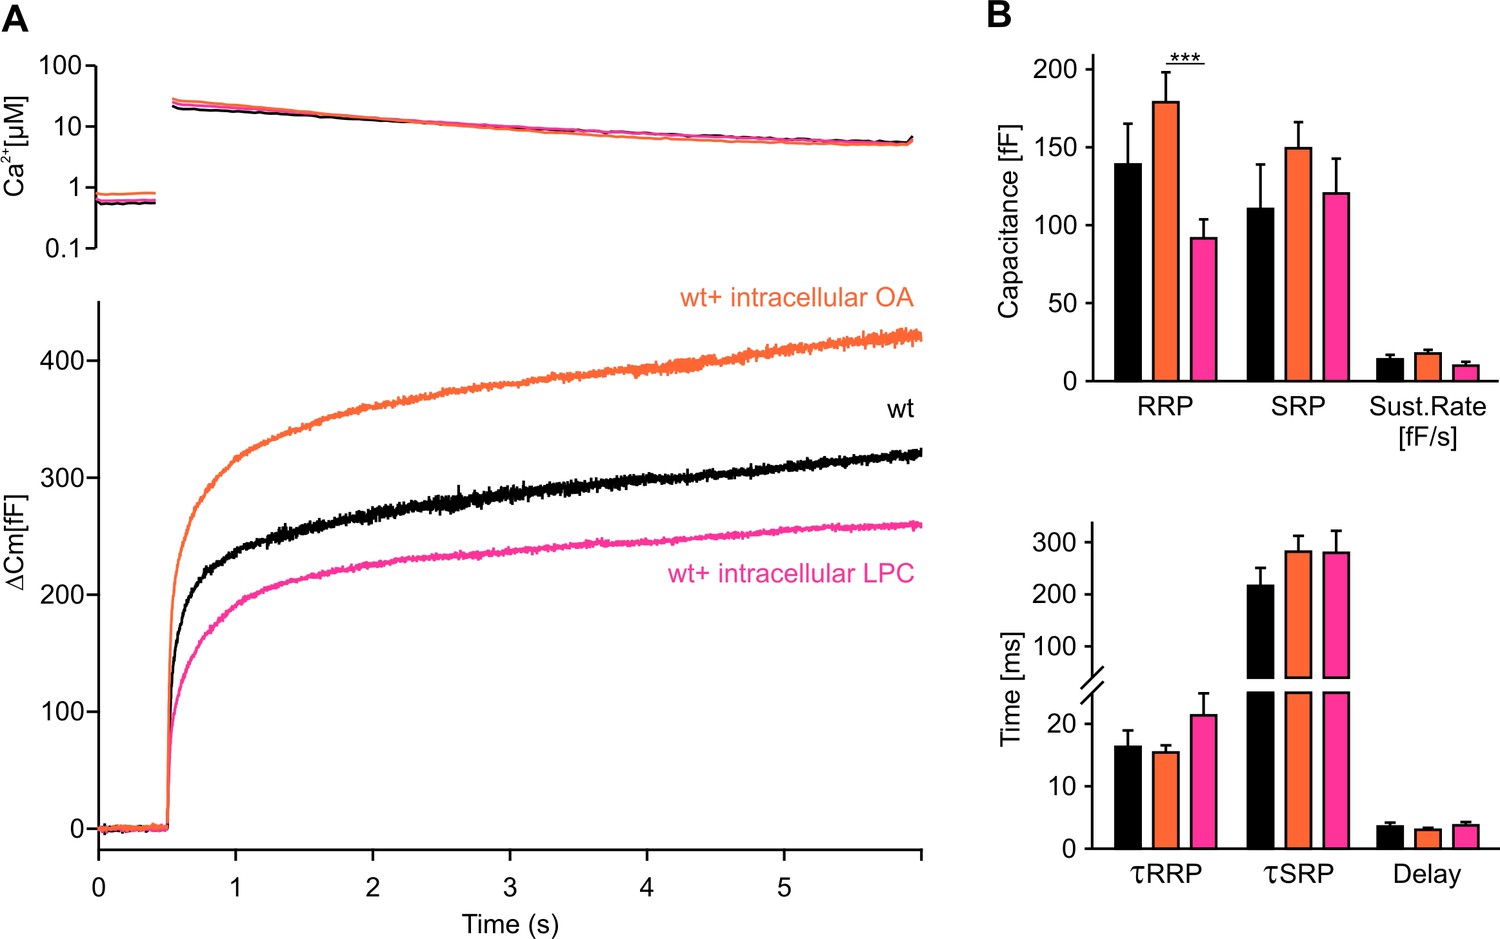
Intracellular application of LPC or OA affects synchronous secretion.
(A) Mean flash-induced [Ca2+]i levels (top panel) and corresponding CM responses (lower panel) of wt cells with intracellular LPC or OA application (5 µM). Intracellular LPC and OA oppositely affect the flash-evoked response. While LPC reduces total secretion, OA enhances it. (B) The RRP size is significantly larger in OA-treated cells compared with LPC cells (upper panel). No significant difference was detected for either group versus wt (RRPOA versus RRPWT, p=0.338; RRPLPC vs. RRPWT, p=0.199) Neither the kinetics of release τRRP and τSRP, nor the secretory delay is changed in both conditions (lower panel). Arrow indicates UV-flash. Data are represented as mean ± SEM and were collected from the following numbers of cells: wt (n = 8), wt+intra-OA (n = 13), wt+intra-LPC (n = 16). ***p<0.001, one-way analysis of variance followed by Tukey-Kramer post test.
Figure 5
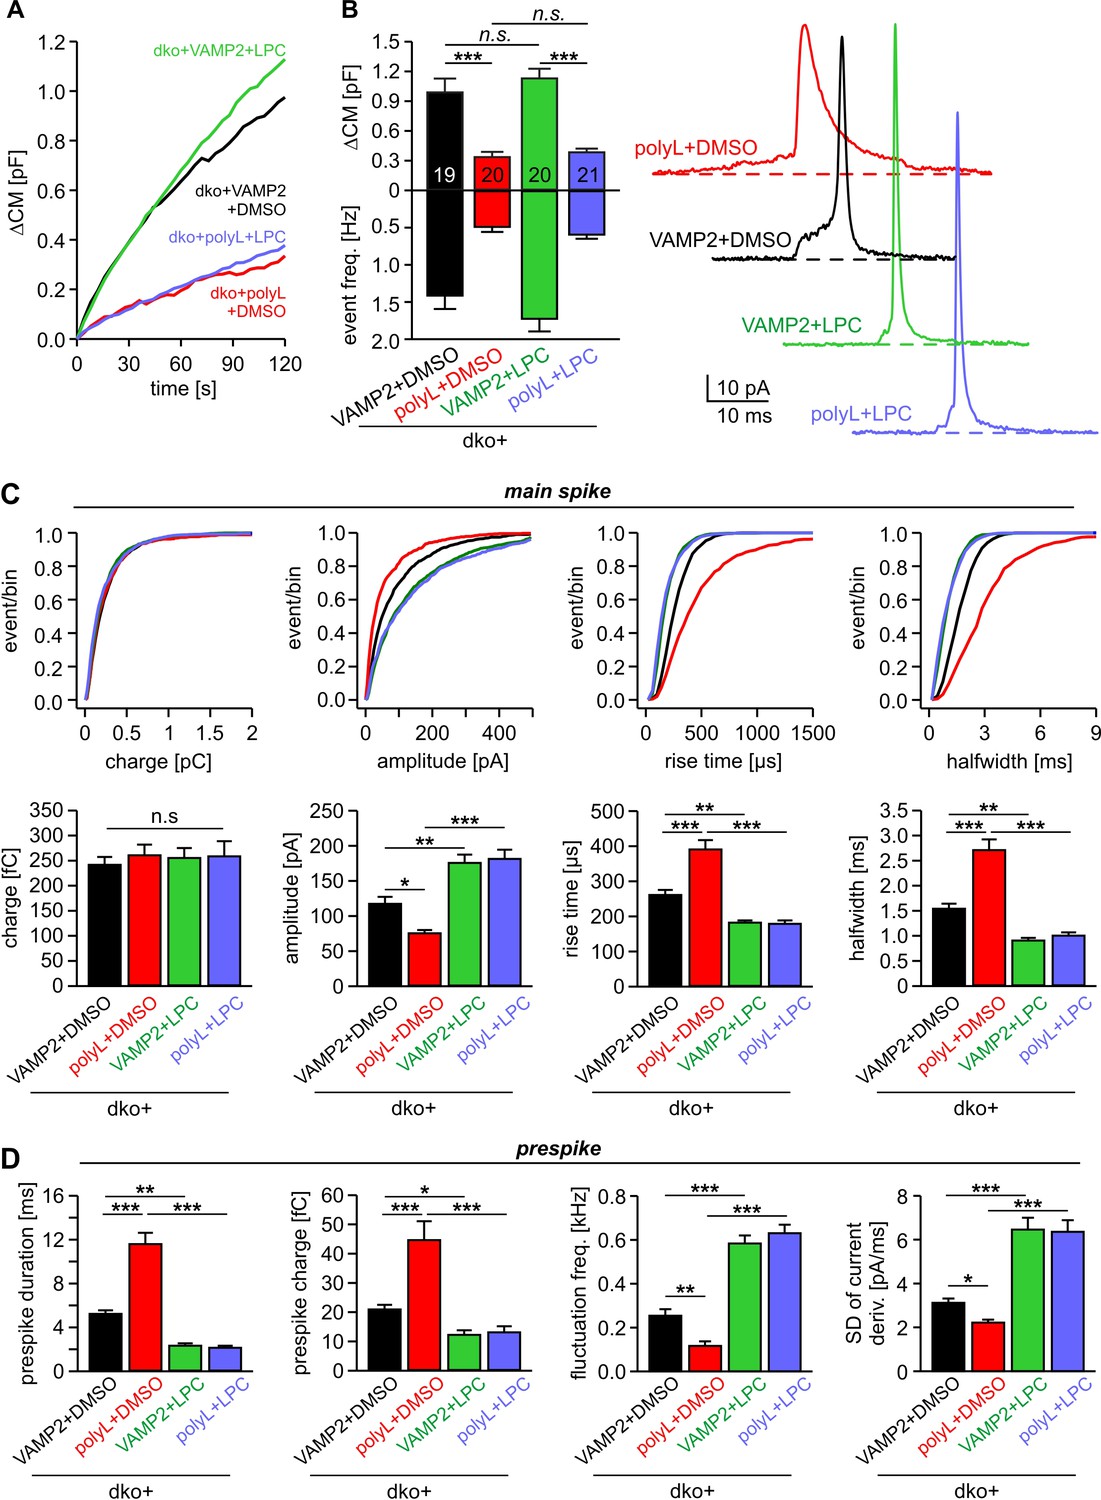
Extracellular LPC overrides the different fusion pore kinetics of VAMP2 and its TMD mutant.
(A) Mean capacitance changes in response to stimulus for the indicated groups. (B) Total ∆CM (top) and amperometric event frequency (bottom) show that VAMP2polyL reduces exocytosis, which is unaffected by extracellular LPC application. Data are averaged from the indicated number of cells. Exemplary amperometric events with similar charge but altered release kinetic profile for the indicated group (right panel). (C, D) Cumulative frequency distributions and cell-weighted averages for the indicated parameters of the spike (C) and prespike phase (D) of single fusion events. The VAMP2polyL mutant slows the overall spike and prespike kinetics. Extracellular LPC strongly accelerates the cargo discharge kinetics in VAMP2 and VAMP2polyL expressing cells and overrides the differences in fusion pore expansion between wt and mutant protein. Note that the similar 50–90% spike rise time of wt and VAMP2polyL is not due to signal filtering (2 kHz), which allows for minimum rise times of about 83 µs. Values are given as mean of median determined from the indicated parameter’s frequency distribution for each cell. Data were collected from cells/events measured for dko+VAMP2 (19/1315), dko+VAMP2polyL (20/705), dko+VAMP2+LPC (20/1698) and dko+VAMP2polyL+LPC (21/882). Only cells with >20 events were considered. Data are represented as mean ± SEM. *p<0.05, **p<0.01, ***p<0.001, one-way analysis of variance followed by Tukey-Kramer post test.
Figure 6

Intracellular OA enhances total exocytosis and reverses the slower release kinetics seen with polyL-TMD mutant.
(A) Mean capacitance changes in response to stimulus for the indicated groups. (B) Total ∆CM (top) and amperometric event frequency (bottom) reconfirm that polyL mutant reduces exocytosis. Intracellular application of OA increases secretion both in VAMP2 and polyL expressing cells. (C) Increase in total secretion with intracellular OA relative to DMSO is significantly higher in polyL expressing cell compared to VAMP2. (D, E) Cumulative frequency distributions and cell-weighted averages for the indicated parameters of the spike (D) and the prespike phase (E). Note that intracellular application of OA accelerates the cargo discharge kinetics in VAMP2 expressing cells and overrides the kinetic differences in transmitter release between VAMP2 and the polyL mutant. Values are given as mean of median determined from the indicated parameter’s frequency distribution for each cell. Data were collected from cells/events measured for dko+VAMP2 (18/1071), dko+VAMP2polyL (17/595), dko+VAMP2+LPC (18/2080) and dko+VAMP2polyL+LPC (18/1661). Only cells with >20 events were considered. Data are represented as mean ± SEM. *p<0.05, **p<0.01, ***p<0.001, one-way analysis of variance followed by Tukey-Kramer post test.
Figure 7
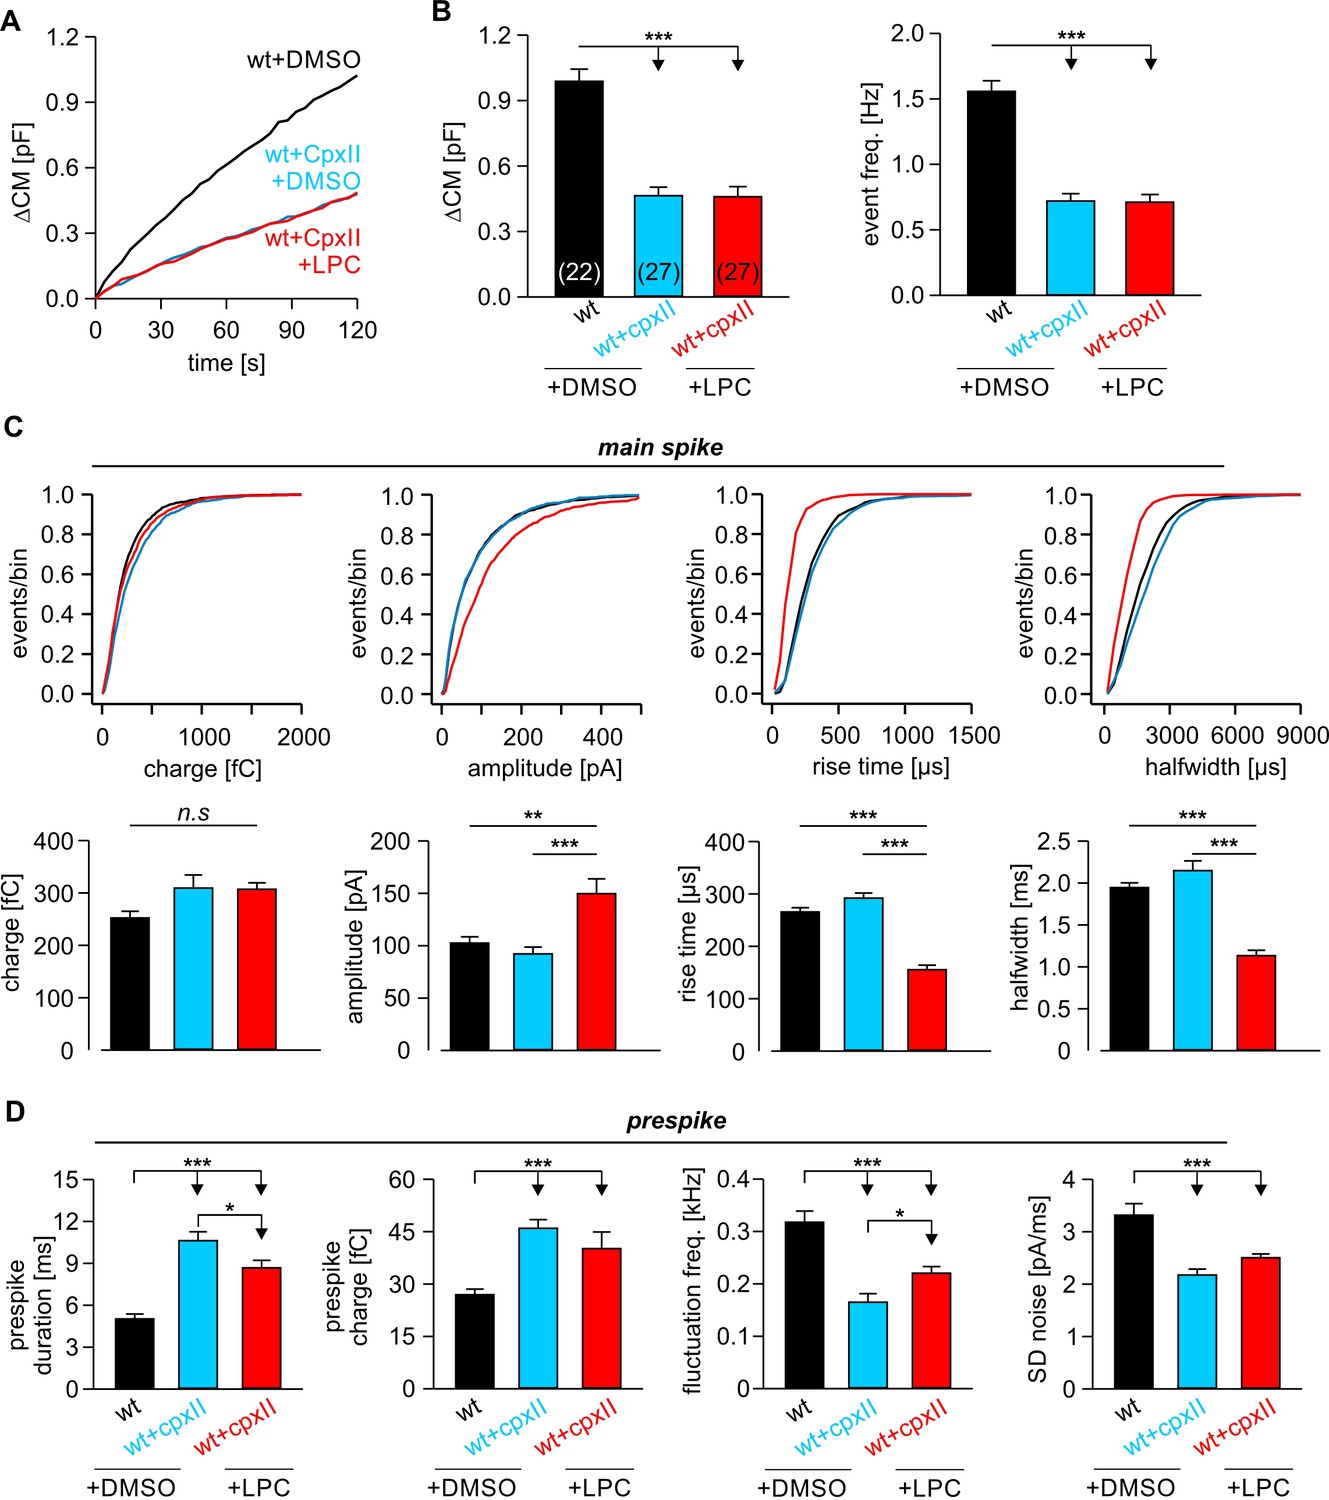
LPC fails to rescue the CpxII mediated prolongation in the expansion time of the nascent fusion pore.
(A) Stimulus evoked averaged ∆CM for the indicated groups. (B) The CpxII mediated reduction of total ∆CM (left panel) and the amperometric event frequency (right panel) is unaffected by application of LPC. Numbers indicate analyzed cells. (C) Cumulative frequency distributions (top panels) and cell-weighted averages (bottom panels) show that extracellular LPC speeds up the kinetics of the main spike in CpxII expressing cells. (D) CpxII selectively slows down the kinetics of prespike phase. Application of LPC largely fails to restore the CpxII mediated deceleration of neurotransmitter release from single vesicle. Values are given as mean of median determined from the indicated parameter’s frequency distribution for each cell. Data were collected from cells/events measured for wt+extra.DMSO (22/2171), wt+CpxII+extra.DMSO (27/995), and wt+CpxII+extra.LPC (27/1098). Only cells with >20 events were considered. Data are represented as mean ± SEM. *p<0.05, **p<0.01, ***p<0.001, one-way analysis of variance followed by Tukey-Kramer post test.
Figure 8
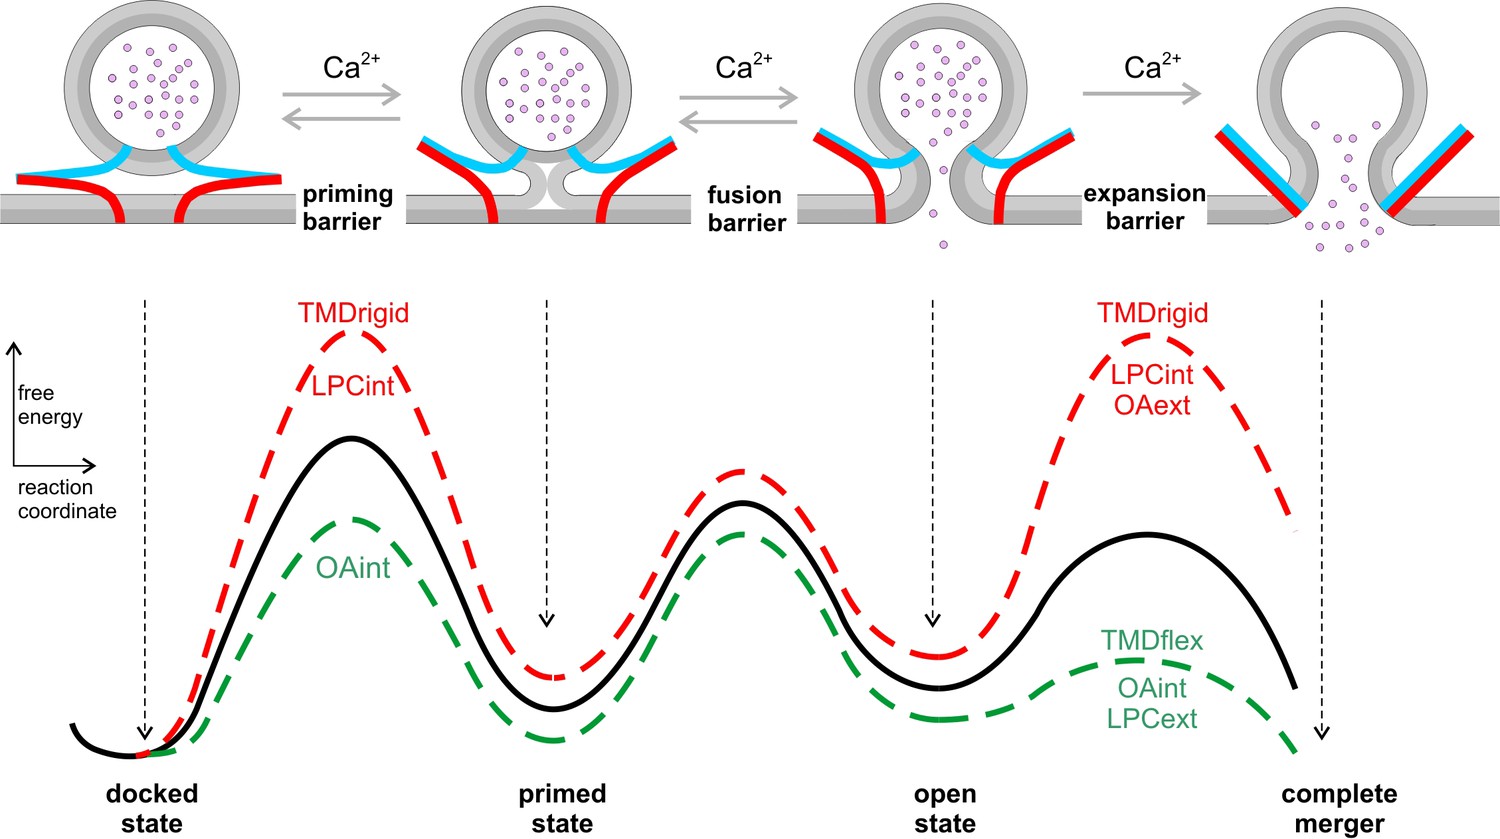
Hypothetical model of the energy landscape en route to membrane fusion.
Vesicles states are depicted as corresponding to local minima in an energy profile. The vesicles transit from a docked to a primed state, to the nascent fusion pore state and finally into the state of complete membrane merger. Progressive SNARE zipping (VAMP2, blue; syntaxin, red; SNAP-25 not shown for clarity) together with Ca2+ drives the forward reactions throughout the whole fusion process overcoming the energy barriers for priming and fusion up to the expansion of the fusion pore. TMD rigidity increases the energy for priming and also for pore expansion, whereas TMD flexibility profoundly lowers the latter. Intracellular OA rescues in part the secretion deficit of the VAMP2polyL mutant because the spontaneous curvature of the cytoplasmic leaflet is energetically significant in stalk formation. Neither TMD mutations nor curvature-modifying phospholipids affect the exocytosis timing. For pore expansion, instead, OA and LPC produce opposing effects in the same leaflet but similar actions when applied in different leaflets, consistent with membrane curvature-driven changes in the expansion kinetics of a purely lipidic pore. Notably, curvature accommodating phospholipids are expected to lower the energy of the semi-stable highly curved open pore state, but even more strongly reduce the energy barrier for pore growth (Chizmadzhev et al., 2000), thereby leveling of any differences in pore expansion between VAMP2 or its VAMP2polyL mutant.
Tables
Key resources table
| Reagent type (species) or resource | Designation | Source or reference | Identifiers | Additional information |
|---|---|---|---|---|
| Strain, strain background (Mus musculus) | C57BL/6 | |||
| Genetic reagent (Mus musculus) | VAMP2 – VAMP3 null allele | Borisovska et al., 2005 | PMID:15920476 | |
| Antibody | mouse anti- VAMP2 | Synaptic Systems | Cat# 104 211 | ICC, 1:1000 |
| Antibody | rabbit anti-VAMP3 | Synaptic Systems | Cat# 104 103 | ICC, 1:1000 |
| Antibody | Alexa Fluor 555 goat anti-mouse | Invitrogen | Cat# A21422 | ICC: 1:1000 |
| Antibody | Alexa Fluor 488 goat anti-rabbit | Invitrogen | Cat# A11008 | ICC: 1:1000 |
| Recombinant DNA reagent (Mus musculus) | VAMP2 | GeneID: 22318 | cDNA (Mus musculus) | |
| Recombinant DNA reagent (Mus musculus) | VAMP1 | GeneID: 22317 | cDNA (Mus musculus) | |
| Recombinant DNA reagent (Mus musculus) | VAMP8 | GeneID: 22320 | cDNA (Mus musculus) | |
| Recombinant DNA reagent (Mus musculus) | CpxII | GenBank: U35101.1 | cDNA (Mus musculus) | |
| Transfected construct (Mus musculus) | pSFV-VAMP2- IRES-EGFP | this paper | Semliki Forest virus derived from 22318, expression of wild type full length protein | |
| Transfected construct (Mus musculus) | pSFV-VAMP1- IRES-EGFP | this paper | Semliki Forest virus derived from 22317, expression of wild type full length protein | |
| Transfected construct (Mus musculus) | pSFV-VAMP8- IRES-EGFP | this paper | Semliki Forest virus derived from 22320, expression of wild type full length protein | |
| Transfected construct (Mus musculus) | pSFV-VAMP2-poly L-IRES-EGFP | this paper | Semliki Forest virus derived from 22318 with indicated mutations | |
| Transfected construct (Mus musculus) | pSFV-VAMP2-VAMP1TMD-IRES-EGFP | this paper | Semliki Forest virus derived from 22318 and from 22317, chimeric mutant protein | |
| Transfected construct (Mus musculus) | pSFV-VAMP2-VAMP8TMD-IRES-EGFP | this paper | Semliki Forest virus derived from 22318 and from 22320, chimeric mutant protein | |
| Transfected construct (Mus musculus) | pSFV-CpxII- IRES-EGFP | this paper | Semliki Forest virus derived from U35101.1; expression of wild type full length protein | |
| Software algorithm | IgorPro | WaveMetrics Software | ||
| Software algorithm | AutesP | NPI electronics | ||
| Software algorithm | ImageJ | NIH | ||
| Software algorithm | Zen2008 | Zeiss |
Additional files
Download links
A two-part list of links to download the article, or parts of the article, in various formats.
Downloads (link to download the article as PDF)
Open citations (links to open the citations from this article in various online reference manager services)
Cite this article (links to download the citations from this article in formats compatible with various reference manager tools)
Synergistic actions of v-SNARE transmembrane domains and membrane-curvature modifying lipids in neurotransmitter release
eLife 9:e55152.
https://doi.org/10.7554/eLife.55152


