Condensin I subunit Cap-G is essential for proper gene expression during the maturation of post-mitotic neurons
- Department of Life Sciences, Imperial College London, United Kingdom
- Lehrstuhl für Genetik, University of Bayreuth, Germany
Figures
Figure 1 with 1 supplement
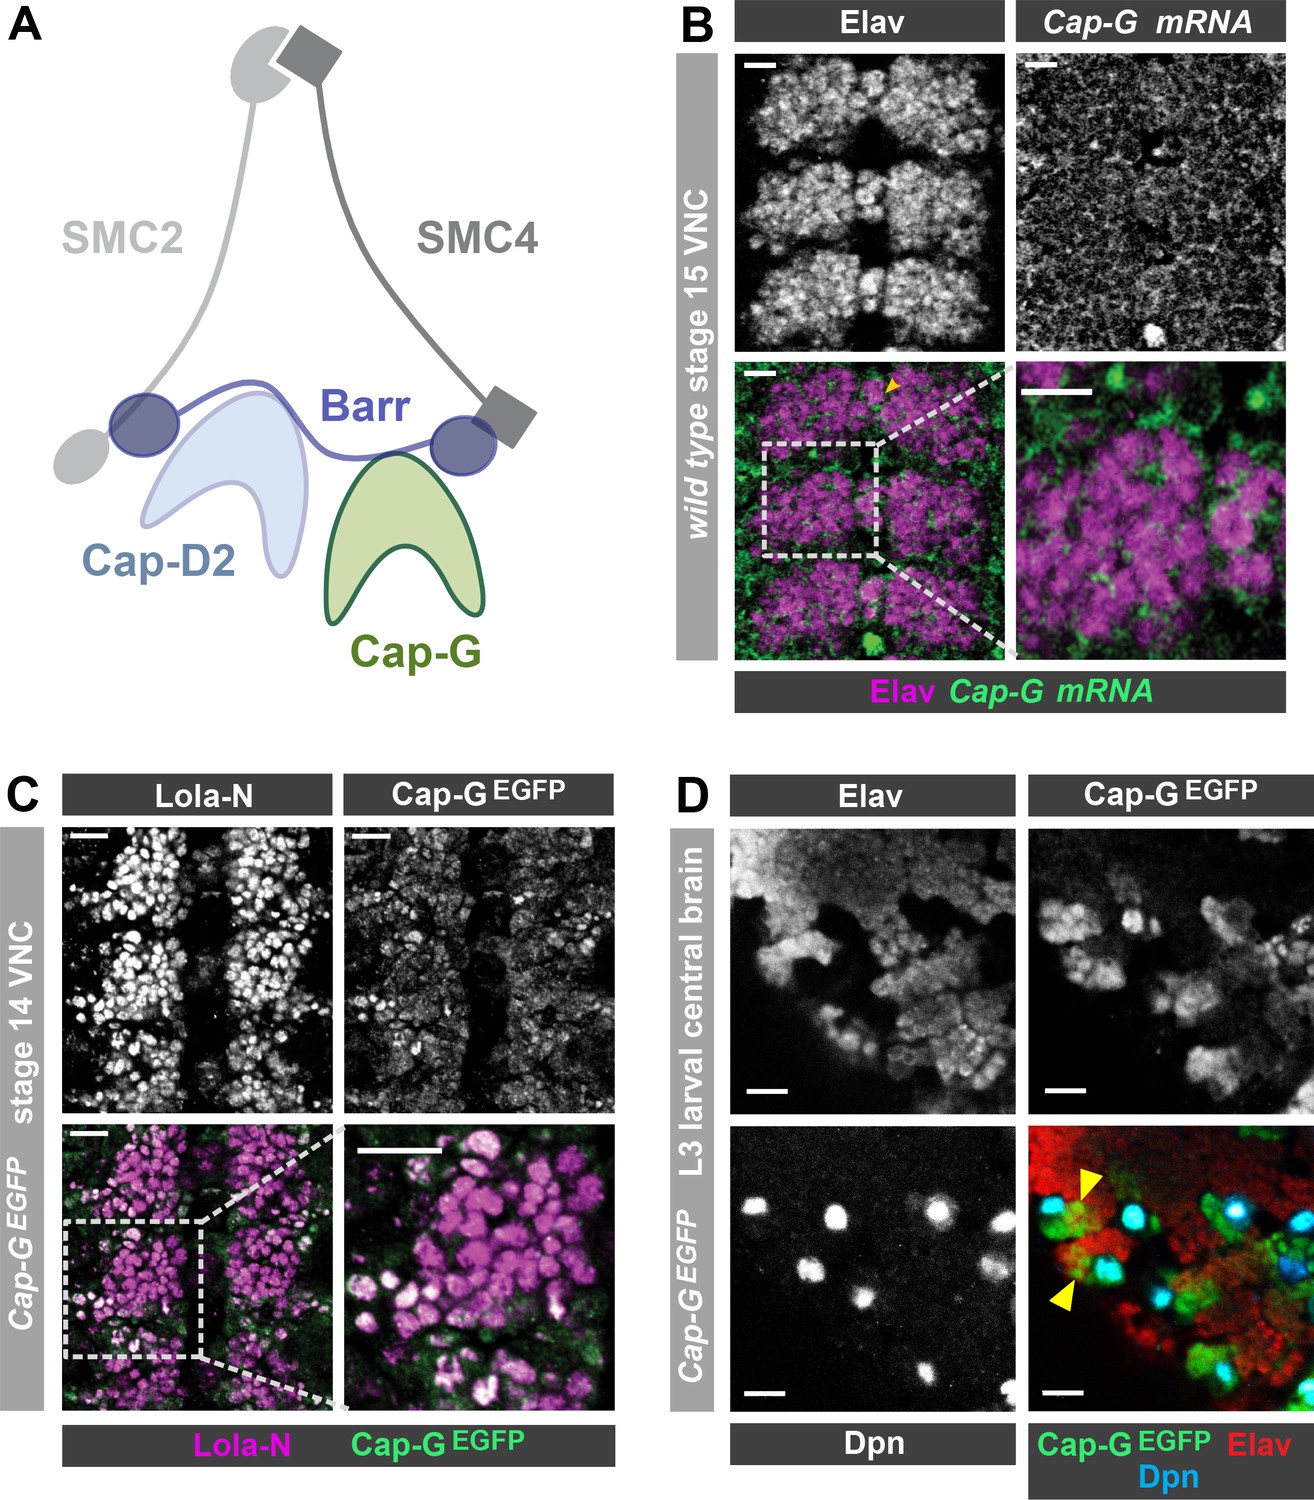
Cap-G expression in Drosophila neurons.
(A) Schematic representation of the Drosophila condensin I complex. (B) w1118 embryo (stage 15, anterior top). Cap-G mRNA is ubiquitously present in neuronal cytoplasm, neurons marked by Elav. (C) Cap-GEGFP embryo (stage 14, anterior top). Cap-GEGFP co-localises with Lola-N in neuronal nuclei of the VNC. (D) Optic lobe of 3rd instar larvae Cap-GEGFP. Cap-G is strongly present in NSCs marked by Dpn. Cap-G is present in neurons (Elav positive) in proximity of NSCs (yellow arrowheads). Scale bars 10 µm.
Figure 1—figure supplement 1
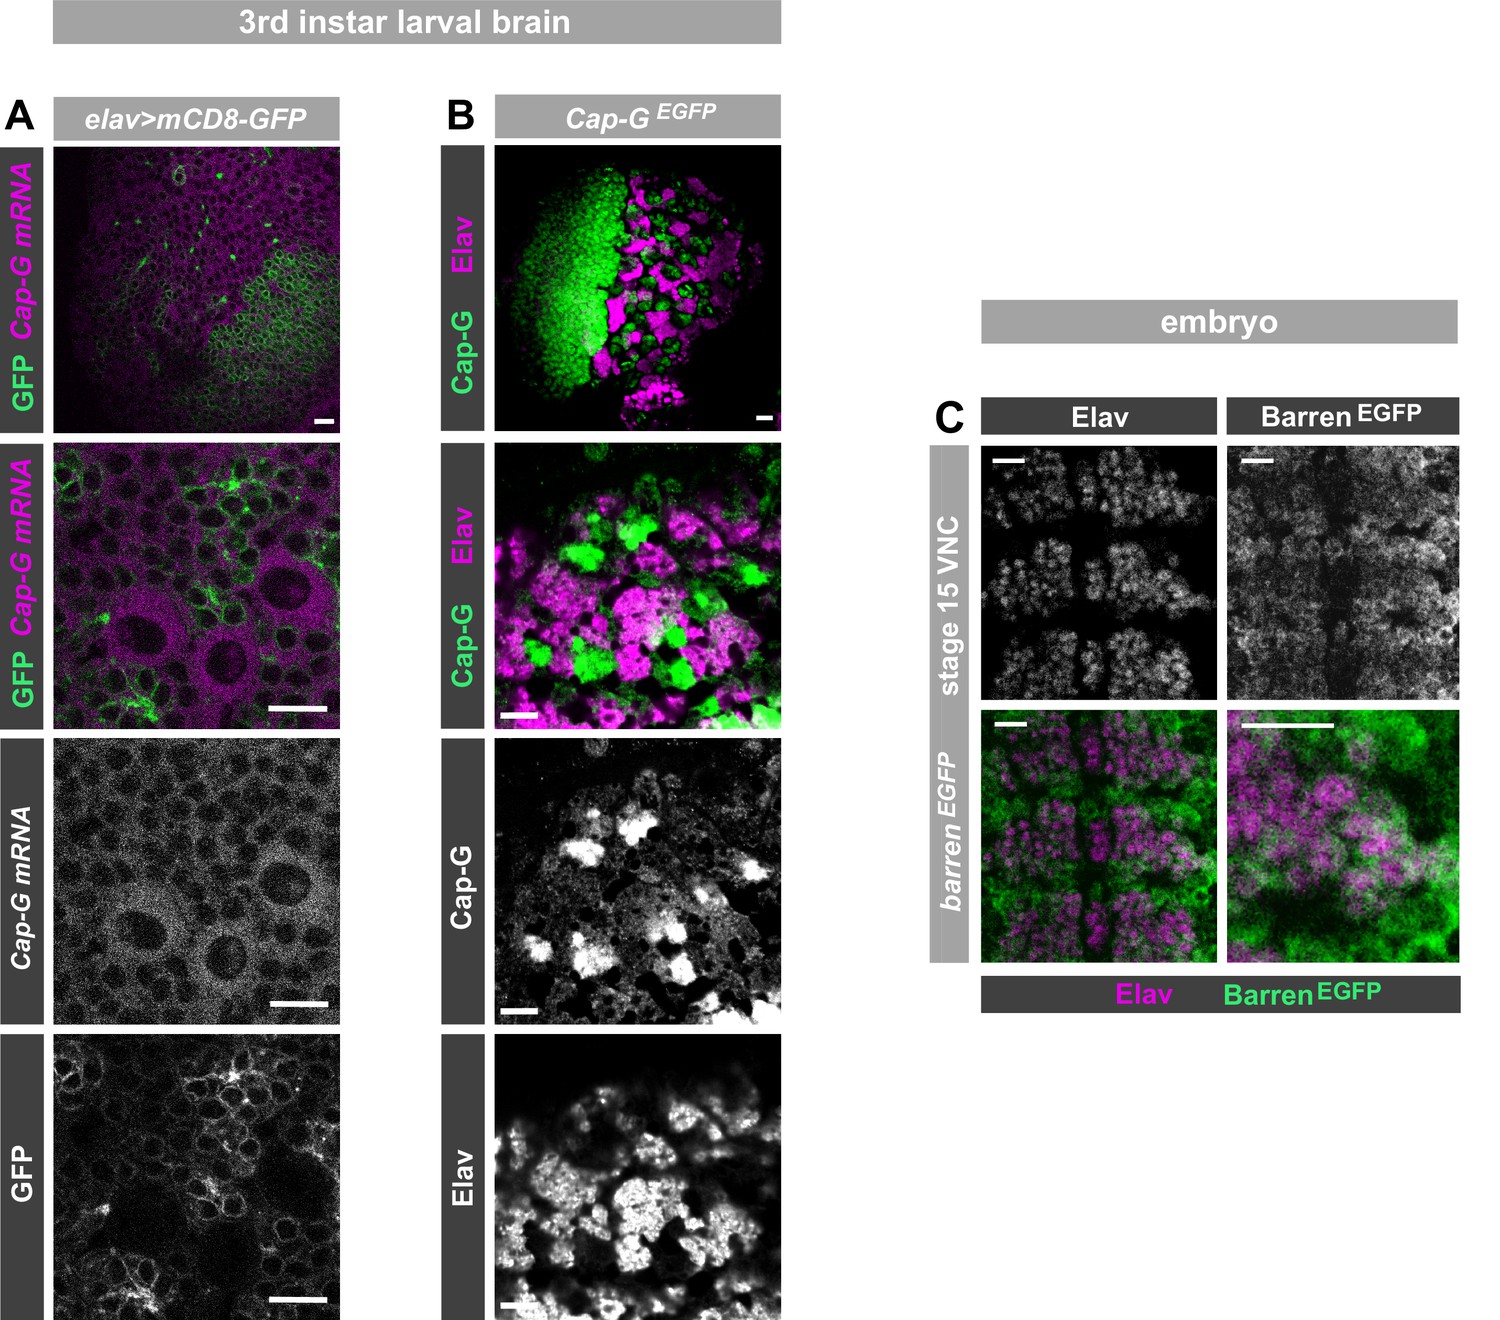
Cap-GEGFP expression in neurons.
(A) Optic lobe of 3rd instar larvae. Cap-G mRNA is ubiquitously expressed in the lobes. mCD8-GFP marks neuronal membrane. Zoom in of central brain section shows expression of Cap-G mRNA in neurons marked by elav-driven GFP expression. (B) Optic lobe of 3rd instar Cap-GEGFP larvae. Cap-G is strongly present in the Optic Proliferation centre and the Central brain (CB). Zoom in on CB shows Cap-G is present in neuronal nuclei as it overlaps with marker Elav. (C) BarrenEGFP embryo (stage 15). BarrenEGFP is present in all cells of the VNC, including Elav positive neurons. All images show ventral view of embryonic VNC (anterior -top). Scale bars = 10 µm.
Figure 2 with 3 supplements
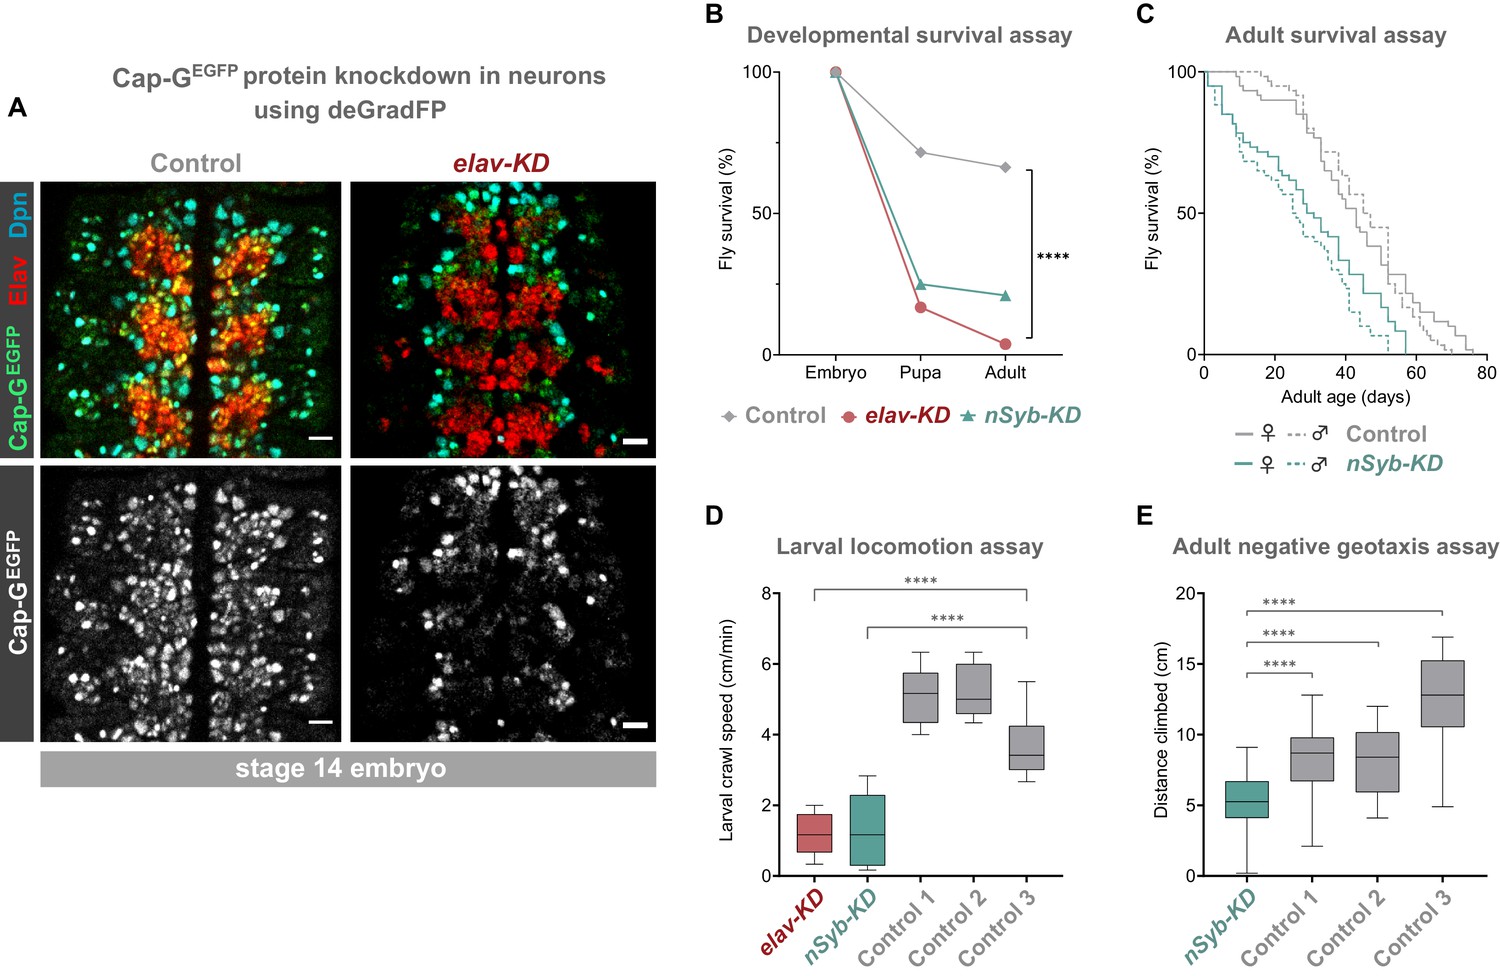
Cap-G knockdown in neurons results in premature developmental arrest and severe mobility defects.
(A) Effective knockdown of Cap-GEGFP in neurons. Embryonic VNC (stage 14, anterior top) showing reduced Cap-GEGFP levels in neurons marked by Elav in elav-KD compared to Cap-GEGFP control. Cap-GEGFP is still detected in NSCs marked by Dpn in both Cap-GEGFP control and elav-KD. (B) Survival of developing flies recorded at pupal and adult stages. Cap-GEGFP flies were used as the control genotype. Survival expressed as a percentage of the initial total number of embryos. 300 biological replicates/genotype. Logrank test and weighted Gehan-Breslow-Wilcoxon model (****, p<0.0001). (C) Survival of adult nSyb-KD and Cap-GEGFP control recorded daily until all flies deceased. Survival expressed as a percentage of starting flies, 60 biological replicates/genotype. Logrank test and weighted Gehan-Breslow-Wilcoxon model (****, p<0.0001). (D) Locomotion assay of L3 larvae from three independent experiments. Control 1 = Cap GEGFP; UAS-deGradFP. Control 2 = elav-GAL4; Cap-GEGFP. Control 3 = Cap GEGFP; nSyb-GAL4. Mean crawling speed from 10 technical replicates for each of the 30 biological replicates/genotype. Kruskal-Wallis test one-way ANOVA (****, p<0.0001). (E) Negative geotaxis assay from three independent experiments. Control 1 = Cap GEGFP; nSyb-GAL4. Control 2 = Cap GEGFP; UAS-deGradFP. Control 3 = nSyb-GAL4; UAS-deGradFP. Mean distance climbed from 10 technical replicates for each of the 30 biological replicates/genotype. Kruskal-Wallis test one-way ANOVA (****, p<0.0001).
Figure 2—figure supplement 1

Characterisation of Cap-G knockdown with elav-GAL4.
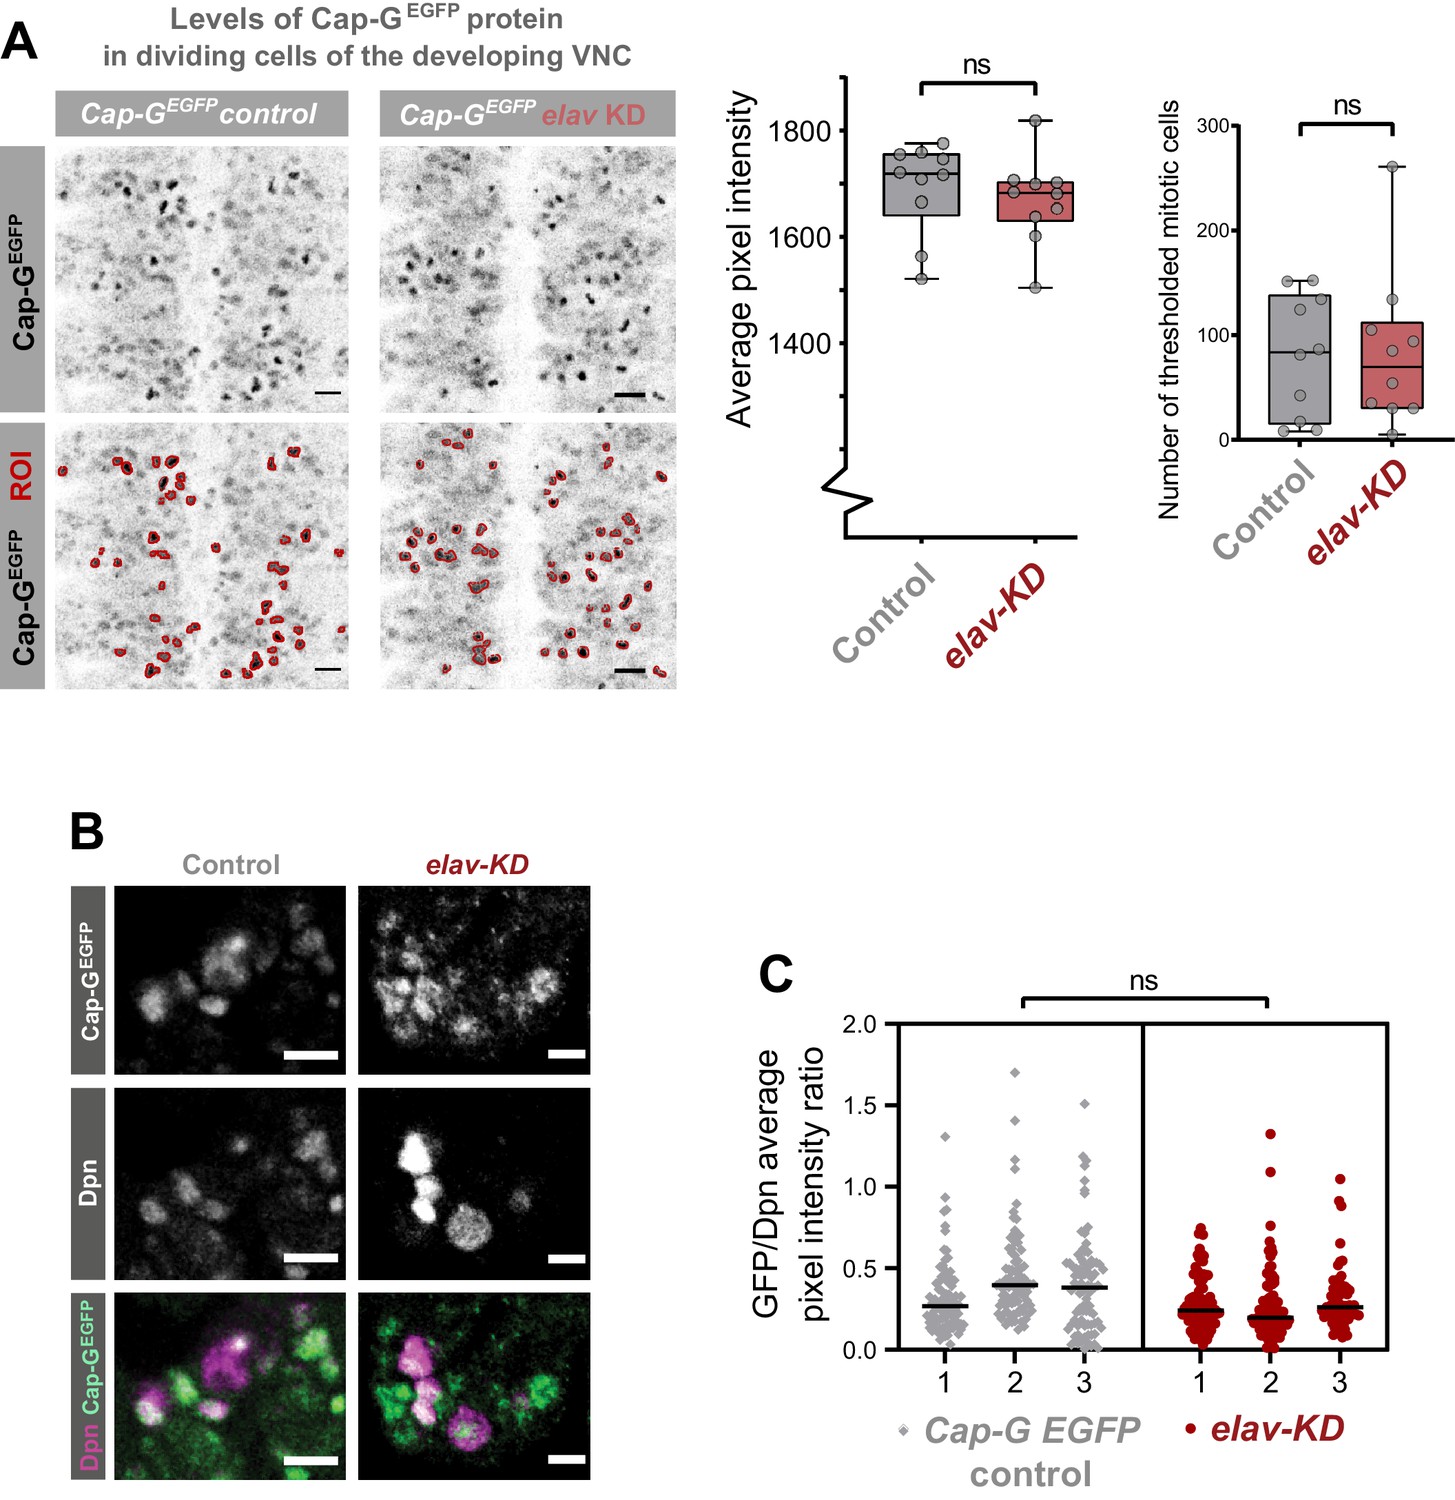
(A) Quantification of Cap-GEGFP protein levels in dividing cells in Cap-GEGFP control and elav-KD embryonic VNC (stage 15 – anterior top). Pixel intensity thresholding was performed to produce images in which dividing cells were defined as regions of interest (ROI) whilst neurons (lower pixel intensity) were excluded from the analysis. The average pixel intensity of dividing cells is calculated for >30 cells/ embryo, with 10 biological replicates per genotype. No significant difference in Cap-GEGFP levels, t-test (p=0.522). Number of mitotic cells (ROIs) remains constant. (B) Representative images showing Cap-GEGFP in NSCs. Note that NSCs show variable Cap-G expression depending on cell-cycle stage. (C) Quantification of Cap-GEGFP protein levels in NSCs normalised against Dpn signal. Y-axis displays ratio of EGFP/DPN average signal intensity per cell. The average pixel intensity is calculated for >70 cells/ embryo, with three biological replicates per genotype (Cap-GEGFP control and elav-KD). No significant difference as per Nested t-test (p>0.05).
Figure 2—figure supplement 2
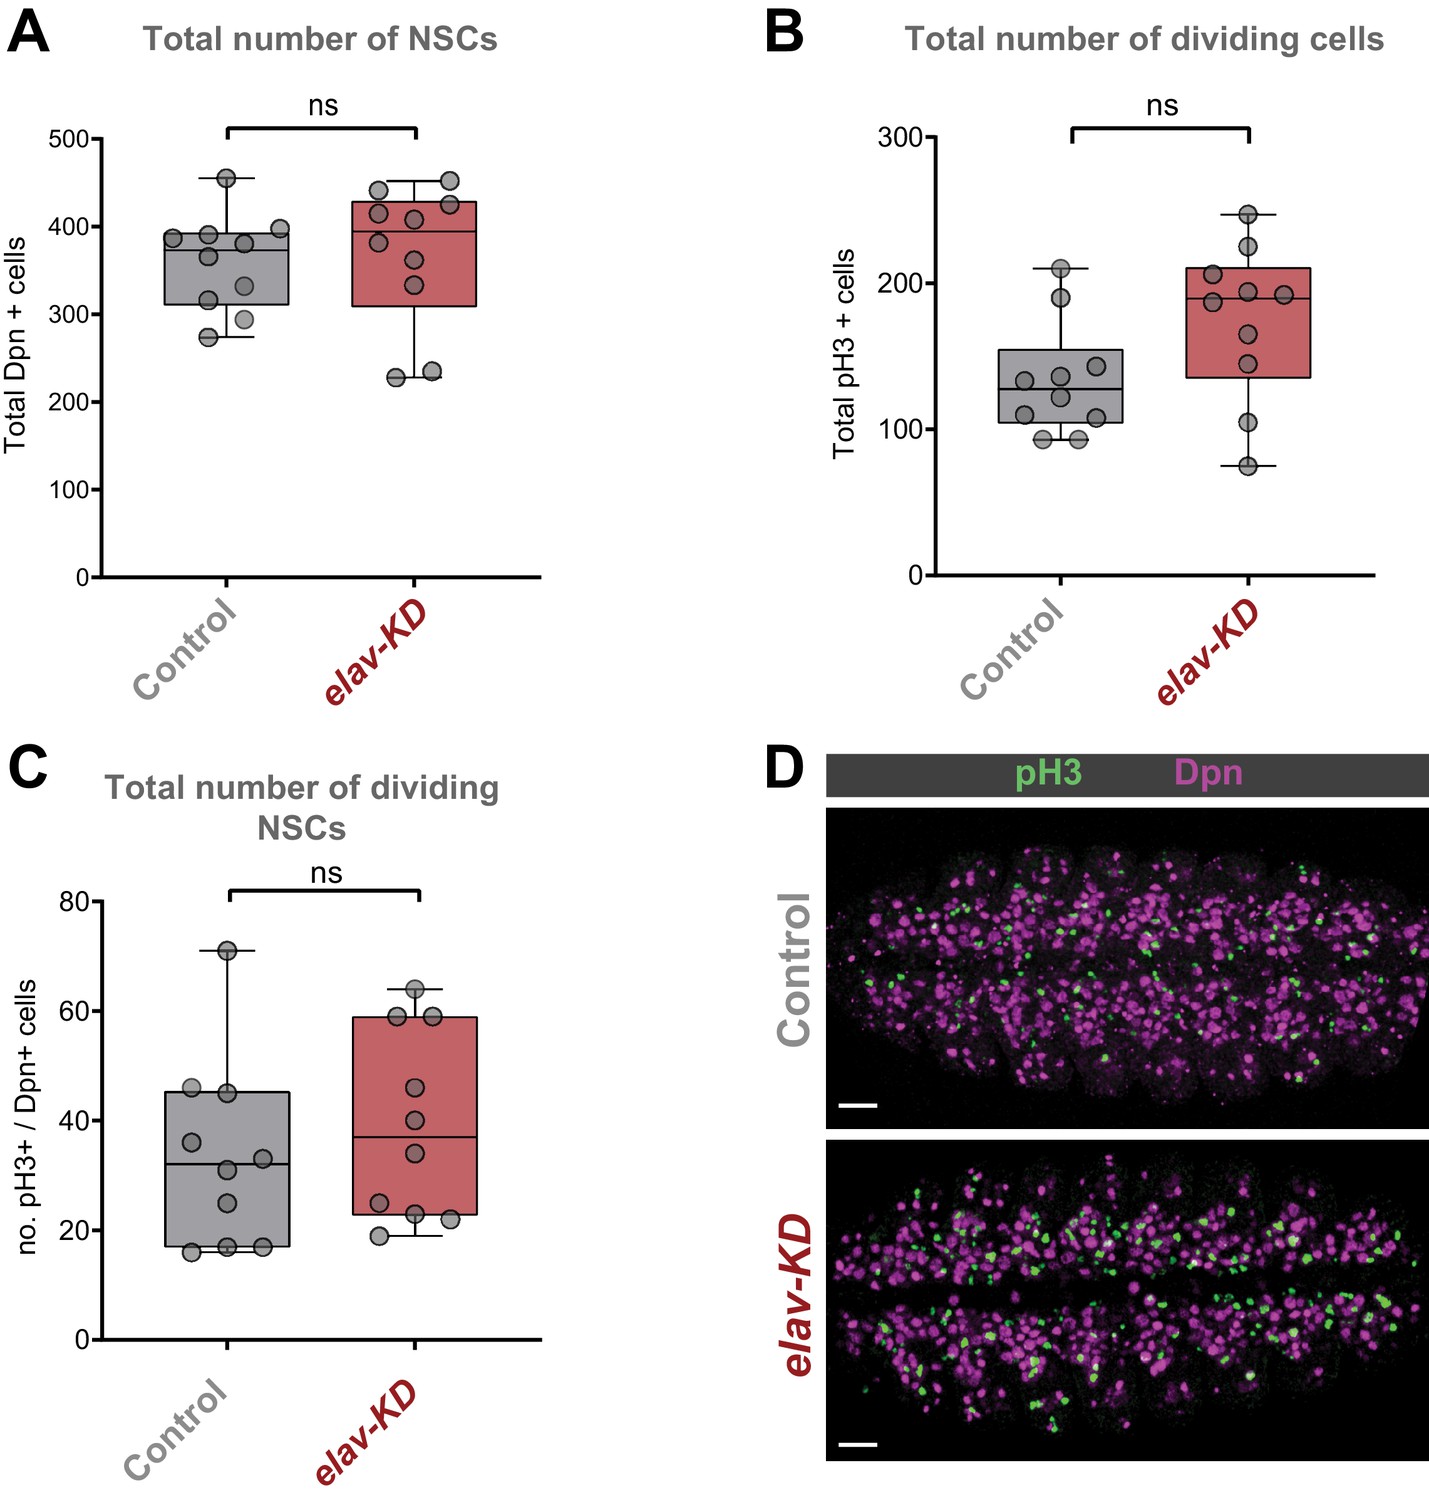
Characterisation of Cap-G knockdown with elav-GAL4.
(A-C) Quantification of NSCs numbers and cell division in Cap-GEGFP control and elav-KD individuals. Z-stacks of embryonic VNC stage 15 for Cap-GEGFP and elav-KD were used. (A) Quantification of total number of NSCs marked by Dpn. (B) Quantification of total number of mitotic cells marked by pH3. (C) Quantification of total number of dividing NSCs as number of pH3+/Dpn+ cells. 10 replicates per genotype. No significant difference as per t-test (p>0.05). (D) Maximum Z-projection of stage 15 embryonic VNC for both Cap-GEGFP and elav-KD showing quantified NSCs (Dpn) and dividing cells (pH3). Anterior left, posterior right. Scale bar 10 µm.
Figure 2—figure supplement 3
Apoptosis in elav-KD.
(A) Staining for apoptotic cells in embryonic VNC stage 16 for Cap-GEGFP (control) and elav-KD. Neurons marked in green by Elav and apoptotic cells in magenta by TUNEL staining. Anterior left, posterior right. Maximum Z-projection. Scale bar 10 µm. (B-C) Quantification of apoptosis in embryonic VNC stage 16 for Cap-GEGFP and elav-KD. 10 replicates per genotype. (B) No significant difference in number of apoptotic non-neuronal cells (TUNEL +, Elav -) between Cap-GEGFP control and elav-KD. (C) Significant difference in number of apoptotic neurons (TUNEL+, Elav +), t-test p=0.006. Outliers have been identified and removed using the Grubbs’ test.
Figure 3
Cap-G knockdown leads to increased DNA damage in larval neurons.
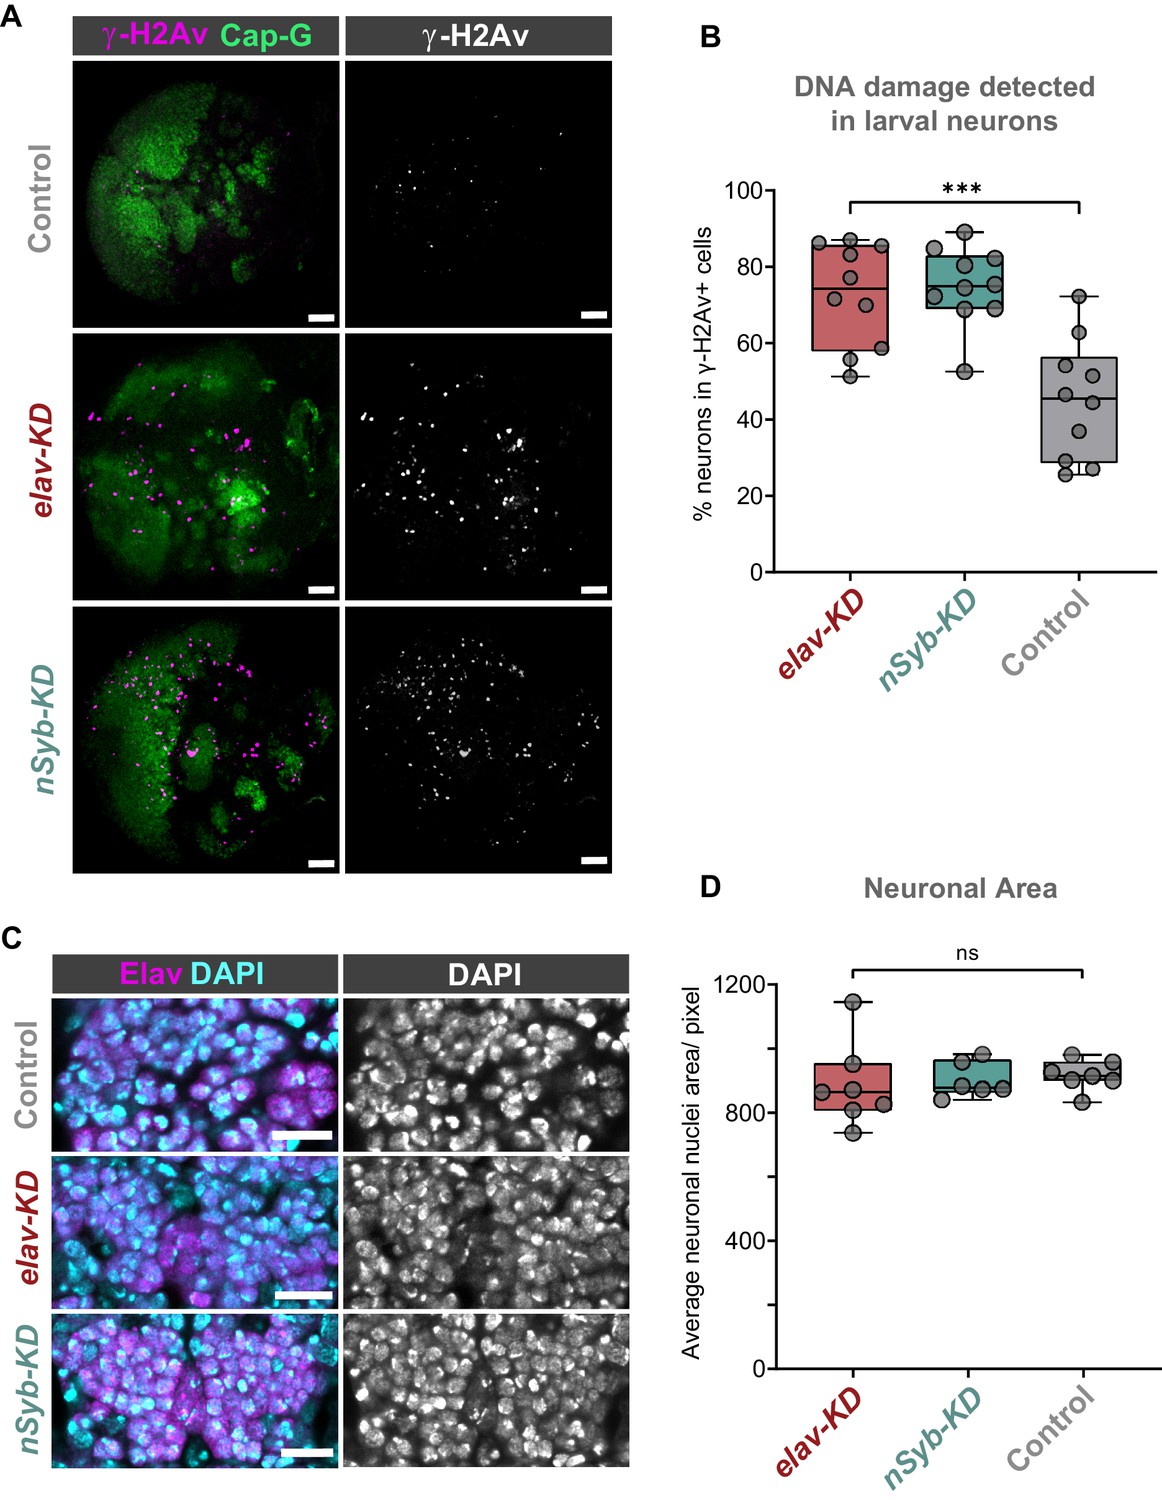
(A) Larval optic lobes for Cap-GEGFP controls and Cap-G KD genotypes. γ-H2Av indicates DNA damage, Cap-G signal is strongest in dividing cells. Scale bars 10 µm. (B) Quantification of γ-H2Av+ neurons as percentage of total γ-H2Av+ cells. 10 biological replicates per genotype. Kruskal-Wallis test one-way ANOVA (***, p<0.001). (C) Section of embryonic VNC (ventral view) stage 15 for all genotypes. Elav to mark neuronal nuclei and DAPI as nuclei stain. Control (Cap-GEGFP), elav-KD and nSyb-KD genotypes. (D) Quantification of neuronal nuclei area. Pixel area average of at least 1000 cells per replicate was analysed. seven biological replicates per genotype. No statistical difference determined by one-way ANOVA (p>0.5).
Figure 4 with 2 supplements
Cap-G binds to DNA in NSCs and neurons.
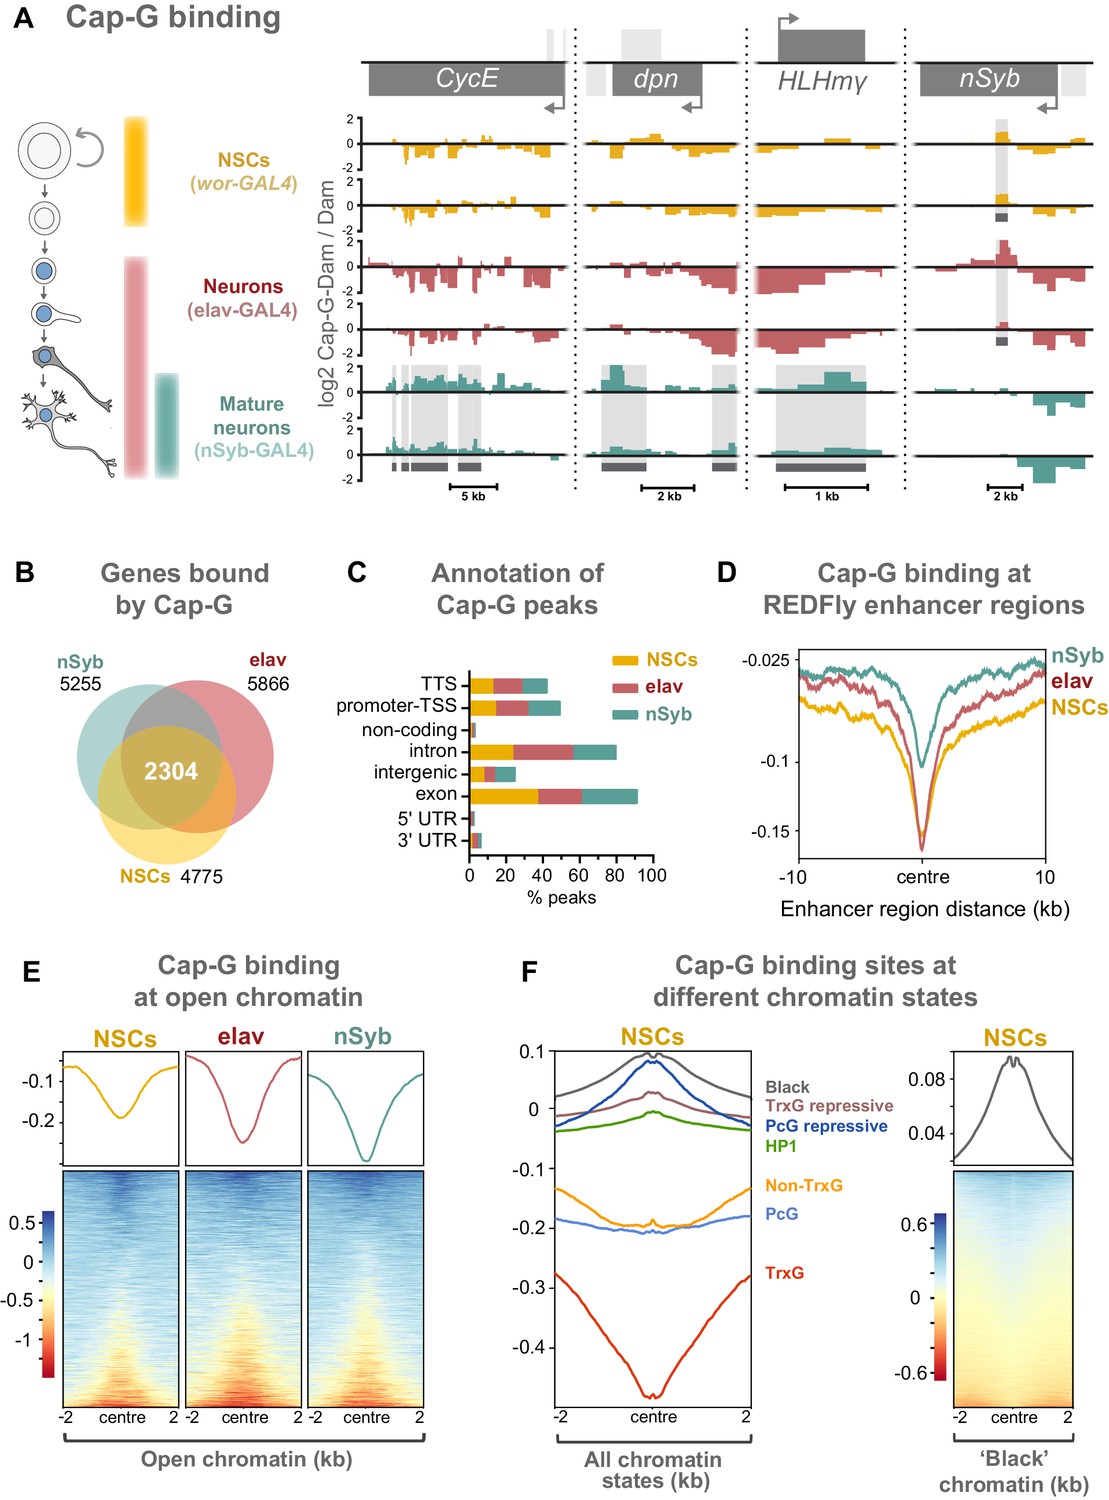
(A) Cap-G binding at example loci in NSCs (wor-GAL4), all neurons including immature neurons (elav-GAL4) and mature (nSyb-GAL4) neurons. Light grey boxes on the gene annotation tracks represent other genes. Horizontal grey bars on the data tracks indicate statistically significant peaks. Y-axes display normalised ratio of log2 Cap-G-Dam/Dam. N.b. since TaDa data is normalised to Dam-only signal it is normal to observe ‘negative peaks’ at sites of depleted binding that have higher background Dam-only methylation. (B) Venn diagram showing unique genes bound by Cap-G and the total overlap between all cell types. (C) Genomic annotation of Cap-G peaks shows enrichment in gene bodies (introns and exons) whilst binding at non-coding regions are depleted. (D) Cap-G binding is depleted at known Drosophila Regulatory Elements (REDfly, http://redfly.ccr.buffalo.edu/index.php). Profiles plotted against centre of enhancer region and 10 Kb up/downstream. (E) Average Cap-G binding is depleted at accessible chromatin for all cell types. Plot shows 2 Kb up/downstream centre of an open chromatin region. Note that a subset of sites appear enriched for Cap-G binding (blue lines on heatmap) (F) Average Cap-G binding in different chromatin states in NSCs. Cap-G binding is enriched in repressive states (Black, HP1, TrxG-repressive, and PcG repressive), and depleted in permissive chromatin states (non-TrxG, TrxG, and PcG). Heatmap is shown for the most highly enriched ‘black’ state (non-HP1, non-PcG repressive state).
Figure 4—figure supplement 1

Analysis of Cap-G binding.
(A) Scatterplots indicating correlation between replicates for each cell-type. (B) Principal component analysis indicating close relationship between replicates. (C) Average binding of Cap-G across scaled gene-regions (all genes). Binding is relatively increased within the gene body. (D) Cap-G binding at example loci. Light grey boxes on the gene annotation tracks represent other genes. Horizontal grey bars on the data tracks indicate statistically significant peaks. Note increased binding of Cap-G to stg upstream regulatory region and ase up and downstream regions in mature neurons. Unc-89 (not expressed in CNS) shows strong Cap-G binding in all cell stages.
Figure 4—figure supplement 2

Comparisons between chromatin accessibility and Cap-G binding.
(A) Correlation heatmap between Cap-G binding and Accessible Chromatin (AC) per cell type. Cap-G binding negatively correlates with AC in each cell type. Numbers represent Spearman’s rank correlation coefficient. Cap-G binding and AC samples cluster separately by k-means. (B) PCA of Cap-G binding and AC per cell type. Cap-G binding (red) and AC (grey) cluster separately. Elav and NSC cluster in proximity of each other reflecting their greater similarity, whilst nSyb is more distant, observed in both AC and Cap-G binding samples.
Figure 5 with 1 supplement
Cap-G knockdown in neurons display severe misregulation of gene expression.
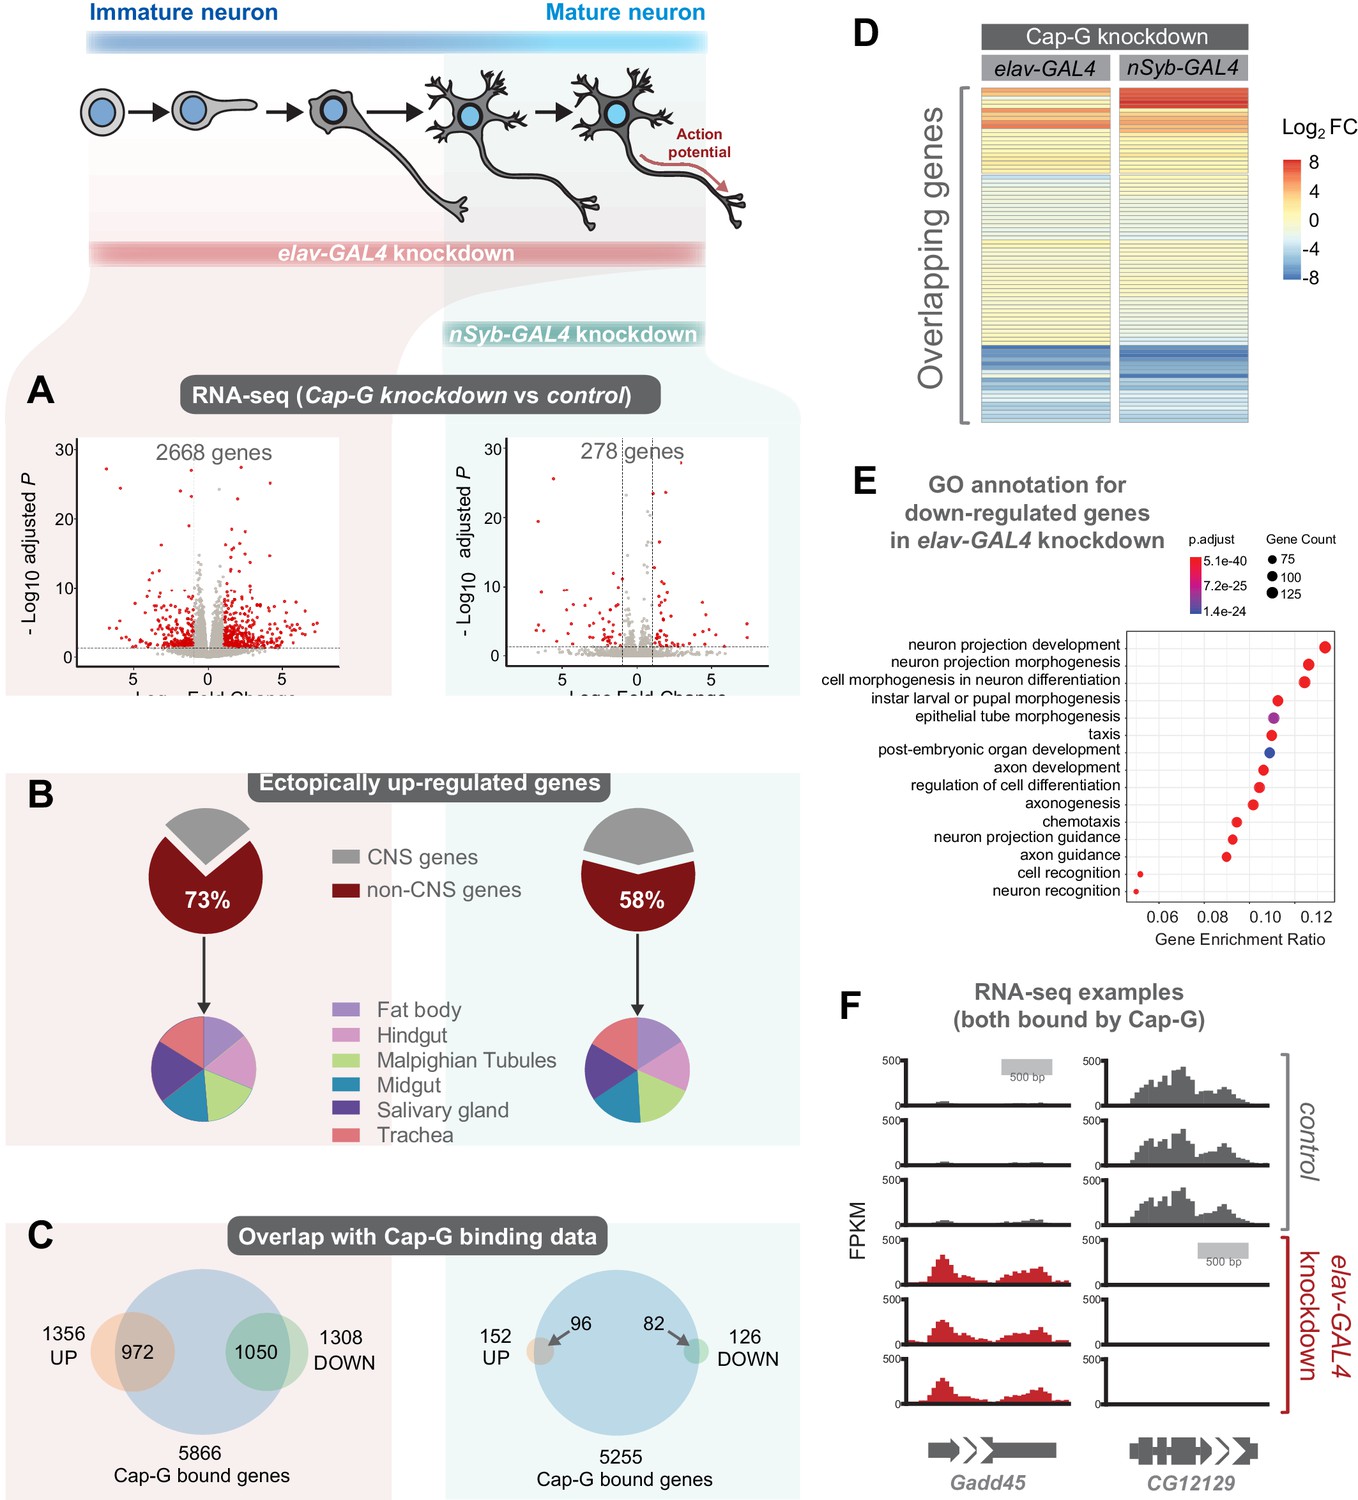
(A) Volcano plots showing differentially expressed genes in elav-KD and nSyb-KD respectively. Significant differential expression marked in red by a Log2 fold change > 1 or <-1 and FDR < 0.05. Control genotypes are elav-GAL4; UAS-deGradFP and nSyb-GAL4; UAS-deGradFP for elav-KD and nSyb-KD respectively. (B) Pie charts showing tissue of origin expression data for upregulated genes in Cap-G KD datasets taken from FlyAtlas. The majority of genes are not normally expressed in the CNS but in alternative tissues. (C) Venn diagrams showing significant overlap between Up/Down regulated genes and Cap-G DamID peaks for elav and nSyb neurons respectively, Fisher’s exact test (p<1×10⁻²⁰). (D) Heatmap of overlapping differentially expressed genes between elav-KD and nSyb-KD. (E) Enriched Gene Ontology analysis of downregulated genes from elav-KD shows mostly neuron-specific terms. (F) Example of differentially expressed genes directly bound by Cap-G in elav-KD (all three replicates displayed).
Figure 5—figure supplement 1
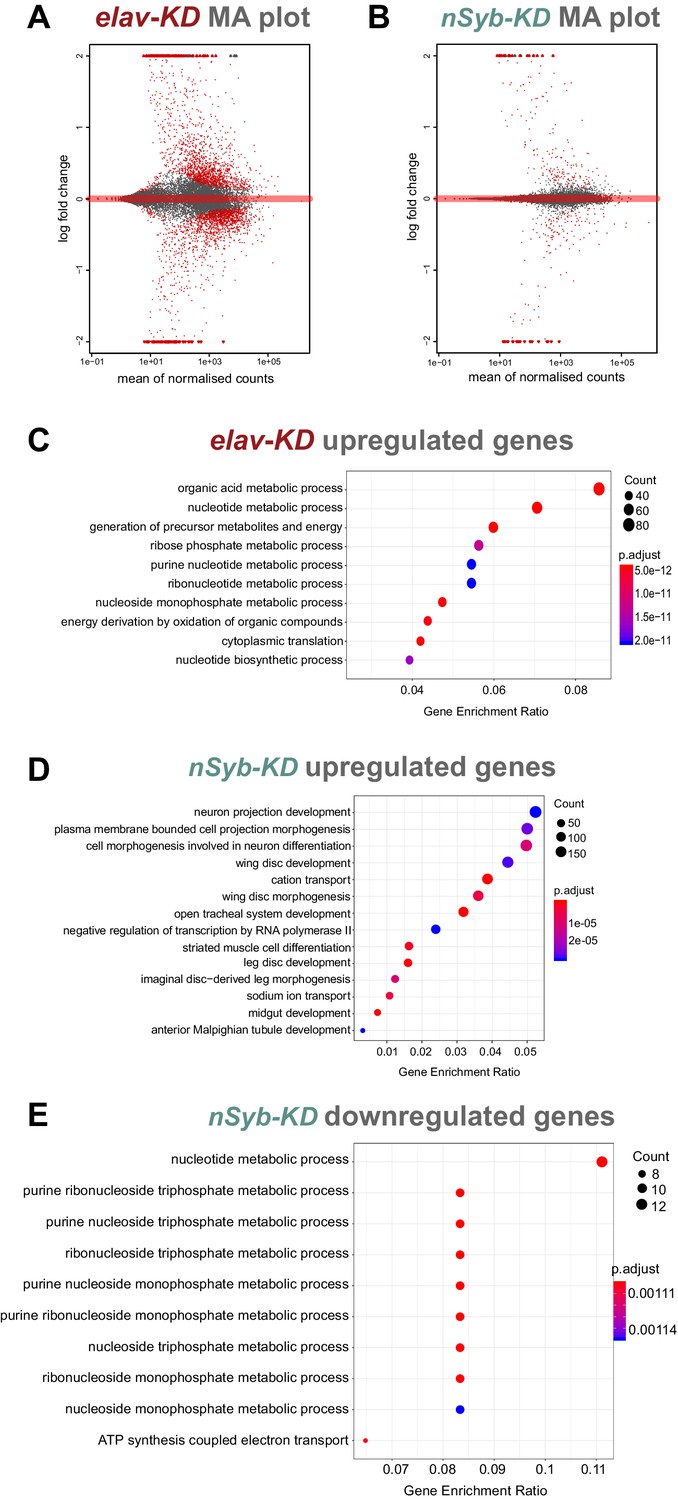
Analysis of RNA-seq data.
(A-B) MA plot of RNAseq datasets for elav-KD and nSyb-KD respectively showing mean of normalised counts and log2 fold change values, significant genes marked in red. (C-E) Enriched GO terms analysis for differentially expressed genes, gene enrichment ratio shown, circle size correlates with number of genes detected and colour with p-adjust value. (C) Upregulated genes in elav-KD showing generic, non-CNS specific terms GO terms. (D) Upregulated genes in nSyb-KD showing generic, non-CNS specific terms. (E) Downregulated genes in nSyb-KD showing metabolic-related GO terms.
Tables
Key resources table
| Reagent type (species) or resource | Designation | Source or reference | Identifiers | Additional information |
|---|---|---|---|---|
| Gene (D. melanogaster) | Cap-G | FLYB: FBgn0259876 | ||
| Strain, strain background (E. coli) | DH5α | NEB | # C2987I | Competent cells |
| Genetic reagent (D. melanogaster) | P{GawB}elavC155 -GAL4 ‘elav-GAL4’ | BloomingtonDrosophilaStock Center | BDSC: #458 | |
| Genetic reagent (D. melanogaster) | w1118; P{y+t7.7 w+mC = GMR57 C10-GAL4}attP2 ‘nSyb-GAL4’ | BloomingtonDrosophilastock Center | BDSC: #39171 | |
| Genetic reagent (D. melanogaster) | w*;; P[w+mC = UAS-Nslmb-vhhGFP4] ‘UAS-deGradFP’ | BloomingtonDrosophilastock Center | BDSC: #38421 | Caussinus et al., 2012 |
| Genetic reagent (D. melanogaster) | Cap-GEGFP | Kleinschnitz, 2020 | Stefan Heidmann Lab | |
| Genetic reagent (D. melanogaster) | barrenEGFP | Kleinschnitz, 2020 | Stefan Heidmann Lab | |
| Genetic reagent (D. melanogaster) | wor-GAL4; tub-GAL80ts | Southall Lab | Southall Lab stocks | |
| Genetic reagent (D. melanogaster) | tub-GAL4 | BloomingtonDrosophilastock Center | ||
| Genetic reagent (D. melanogaster) | UAS-LT3-Cap-G-Dam | This paper | See Materials and methods | |
| Genetic reagent (D. melanogaster) | UAS-LT3-Dam | Southall Lab, Southall et al., 2013 | ||
| Antibody | Anti-GFP (chicken-polyclonal) | Abcam | ab13970 | IF(1:2000) |
| Antibody | Anti-Lola-N (rabbit- | Southall Lab, Southall et al., 2014 | IF(1:10) | |
| Antibody | Anti-elav (c) (rat- monoclonal) | DSHB | IF(1:500) | |
| Antibody | Anti-deadpan (guinea pig) | Brand Lab | Donated by Andrea Brand Lab IF(1: 10000) | |
| Antibody | Anti-pH3 (rabbit-polyclonal) | Millipore | #06–570 | IF(1:500) |
| Antibody | Anti-γ-H2AV (mouse-monoclonal) | DSHB | Cat name: UNC93-5.2.1 | IF(1:200) |
| Recombinant DNA reagent | Plasmid- pUAST-attB | Bischof et al., 2007 | ||
| Sequence-based reagent | Cap-G_FW | This paper | TGGTACCGCATAATAACATGGCCAAACCAAAG | |
| Sequence-based reagent | Cap-G_RV | This paper | GCGATTTTTCTTCATCAGATCCTCTTCAGAGATGAGTTTCTGTTCTTTCCTCCTGCTGCG | |
| Sequence-based reagent | Dam_FW | This paper | GCGCAGCAGGAGGAAAGAACAGAAACTCATCTCTGAAGAGGATCTGATGAAGAAAAATCGC | |
| Sequence-based reagent | Dam_RV | This paper | TTCACAAAGATCCTCTAGAGGTACCCTCGATTAACCGGCTTTTTTCGCGGGTGAAACGACTCC | |
| Commercial assay or kit | Click-iT TUNEL Alexa Fluor 549 | Thermo Fisher | Cat no: C10618 | |
| Software, algorithm | R, R Studio | R 3.4.3 | ||
| Software, algorithm | Prism 8 | Graphpad Prismeight for Windows | ||
| Other | DAPI (DNA stain) | Thermo Fisher | #D1306 | Concentration: 1:20000 |
Additional files
Download links
A two-part list of links to download the article, or parts of the article, in various formats.
Downloads (link to download the article as PDF)
Open citations (links to open the citations from this article in various online reference manager services)
Cite this article (links to download the citations from this article in formats compatible with various reference manager tools)
Condensin I subunit Cap-G is essential for proper gene expression during the maturation of post-mitotic neurons
eLife 9:e55159.
https://doi.org/10.7554/eLife.55159


