A highly accurate platform for clone-specific mutation discovery enables the study of active mutational processes
- Weatherall Institute of Molecular Medicine, University of Oxford, United Kingdom
- Nuffield Department of Women's & Reproductive Health, University of Oxford, United Kingdom
- Ludwig Maximilian University of Munich, Germany
- Radcliffe Department of Medicine, University of Oxford, United Kingdom
- Institute of Cancer and Genomic Sciences, University of Birmingham, United Kingdom
- Siemens AG, Corporate Technology, Germany
Figures
Figure 1 with 3 supplements
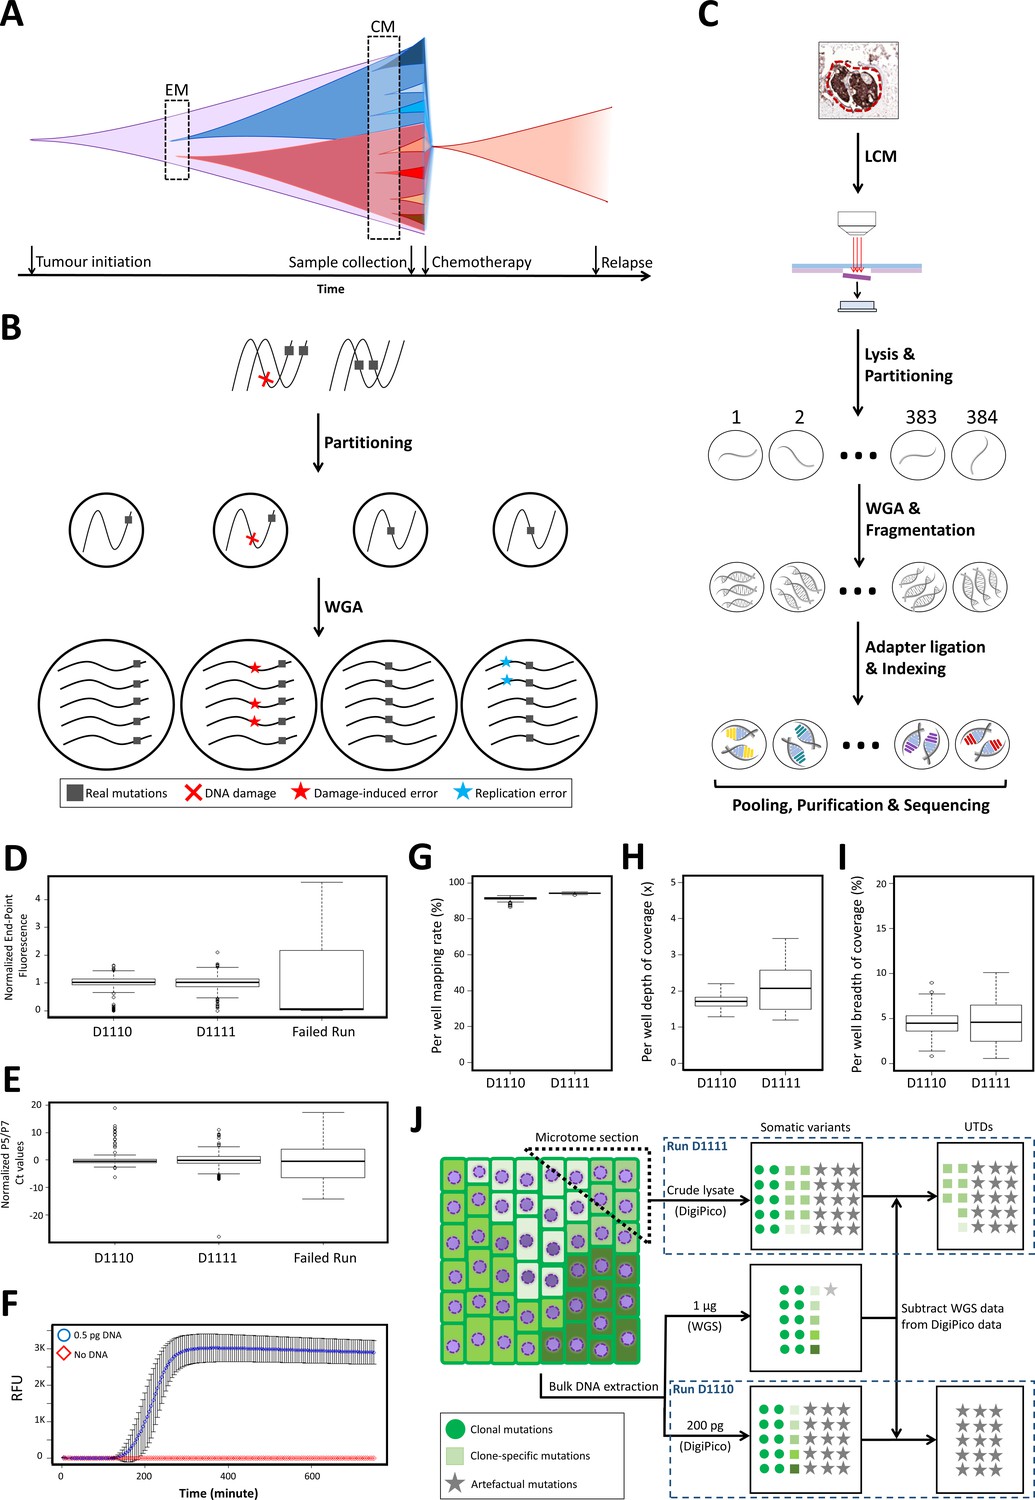
DigiPico sequencing rationale, workflow, and performance.
(A) WGS approaches can only identify early mutational processes (EM) in dominant expanded clones in a tumor (red and blue). Currently active mutational processes (CM) result in a diverse set of sub-clones with different clone-specific mutations. This diversity determines the evolutionary trajectory of the tumor. (B) Template partitioning prior to WGA so that each compartment receives no more than one DNA molecule from each locus allows for the identification of artificial mutations. Since damage-induced errors (red) and replication errors (cyan) occur stochastically during replication, artefactual mutations result in dual-allelic compartments. (C) DigiPico sequencing workflow. LCM: Laser-capture micro-dissection. (D) End-point relative fluorescent unit (RFU) from EvaGreen-labeled DNA was used to ensure homogeneous distribution of template and WGA process across the plate. RFU values were normalized to achieve a median of 1 in each run. (E) Per well qPCR using Illumina adapter primers (P5 and P7) measures the relative quantity of adapter-ligated products in each well. Ct values were normalized to achieve a median of 0 in each run. (F) Streamlining the DigiPico library preparation process required miniaturized a WGA that can specifically and sensitively amplify sub-picogram quantities of DNA in every well. Values represent the mean RFU values across nine replicates. Error bars represent SD. (G, H, and I) preliminary analysis of DigiPico sequencing data from individual wells in each run confirms sequencing high-quality and homogeneity of mapping rate, depth of coverage and breadth of coverage as indicated. (J) Definition of unique to DigiPico (UTD) variants. Subtracting the SNVs that are identifiable in standard WGS data from corresponding DigiPico data results in UTD variants. These will mainly be consisted of artefactual mutations as well as some clone-specific mutations. Since the template in run D1110 is practically a subset of the template used for the standard WGS, all true variants in the DigiPico run D1110 are expected to also be present in the standard WGS data. In contrast, clone-specific variants in run D1111 are likely to be absent in the standard WGS data because of depth limitation, even though the DNA molecules supporting such variants might have been present in the bulk DNA sample at very low frequencies. In all boxplots the horizontal line represents the median. Boxes represent interquartile range (between the 25th and the 75th percentile). Whiskers represent the range excluding outliers. Outliers are defined as data points above or below 1.5 times the interquartile range.
-
Figure 1—source data 1
Raw values for the whole genome amplification monitoring of runs D1110 and D1111.
- https://cdn.elifesciences.org/articles/55207/elife-55207-fig1-data1-v3.xlsx
-
Figure 1—source data 2
Raw relative fluorescent values for miniaturized whole genome amplification reactions over time.
- https://cdn.elifesciences.org/articles/55207/elife-55207-fig1-data2-v3.xlsx
-
Figure 1—source data 3
Per well mapping rate, breadth and depth of coverage for runs D1110 and D1111.
- https://cdn.elifesciences.org/articles/55207/elife-55207-fig1-data3-v3.xlsx
-
Figure 1—source data 4
Sequence of oligonucleotides used in DigiPico library preparation.
- https://cdn.elifesciences.org/articles/55207/elife-55207-fig1-data4-v3.xlsx
Figure 1—figure supplement 1
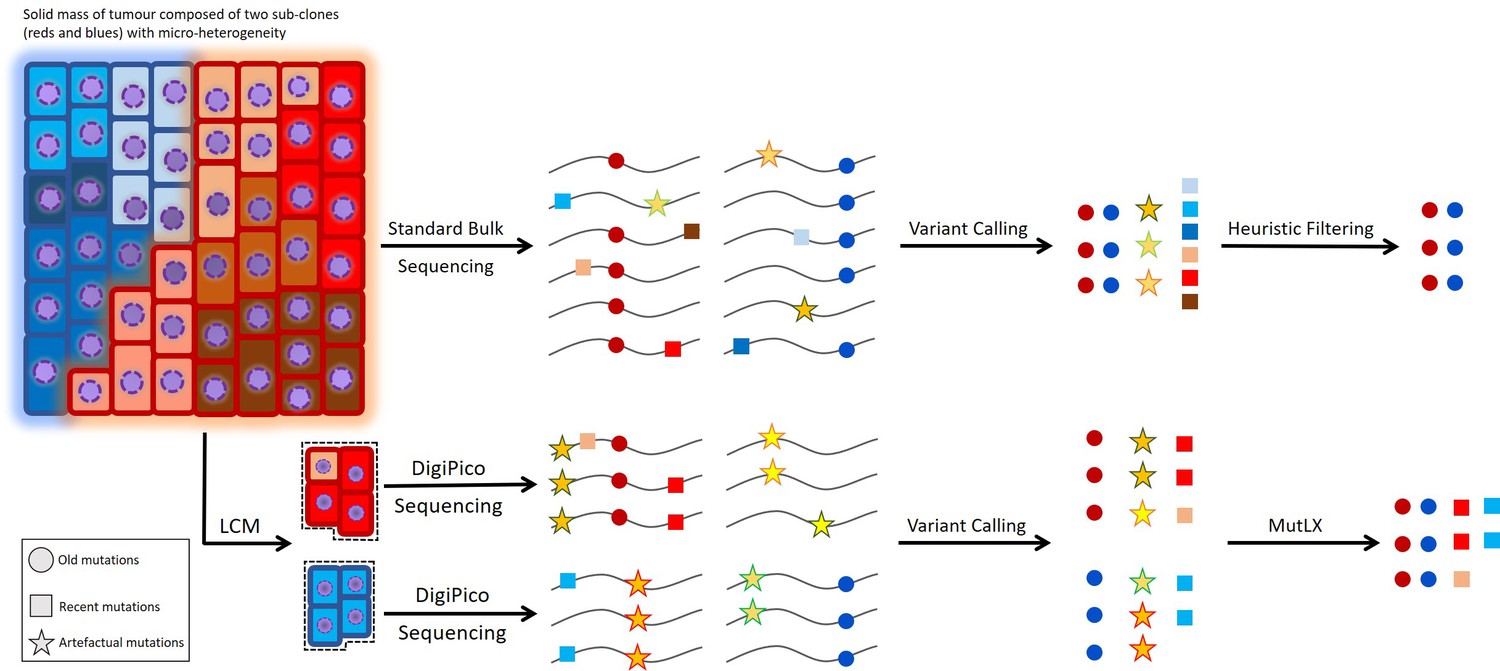
Challenges in identifying recent mutations.
While old mutations can easily be studied from bulk sequencing data of the tumor, the study of recent mutations from such data is hampered because of the low variant allele fraction (VAF) of the involved mutations. Therefore, heuristic filtering criteria are not sufficient in identifying recent mutations. Reliable study of recent mutations requires the study of single cancer cells or tumor islets isolated via laser-capture micro-dissection (LCM) (Figure 1). However, WGA of the limited amount of template in such samples results in a large number of false positive variant calls that obstruct the identification of islet-specific variants. Our analysis pipeline, MutLX, can overcome this issue by eliminating FP variant calls from DigiPico sequencing data.
Figure 1—figure supplement 2
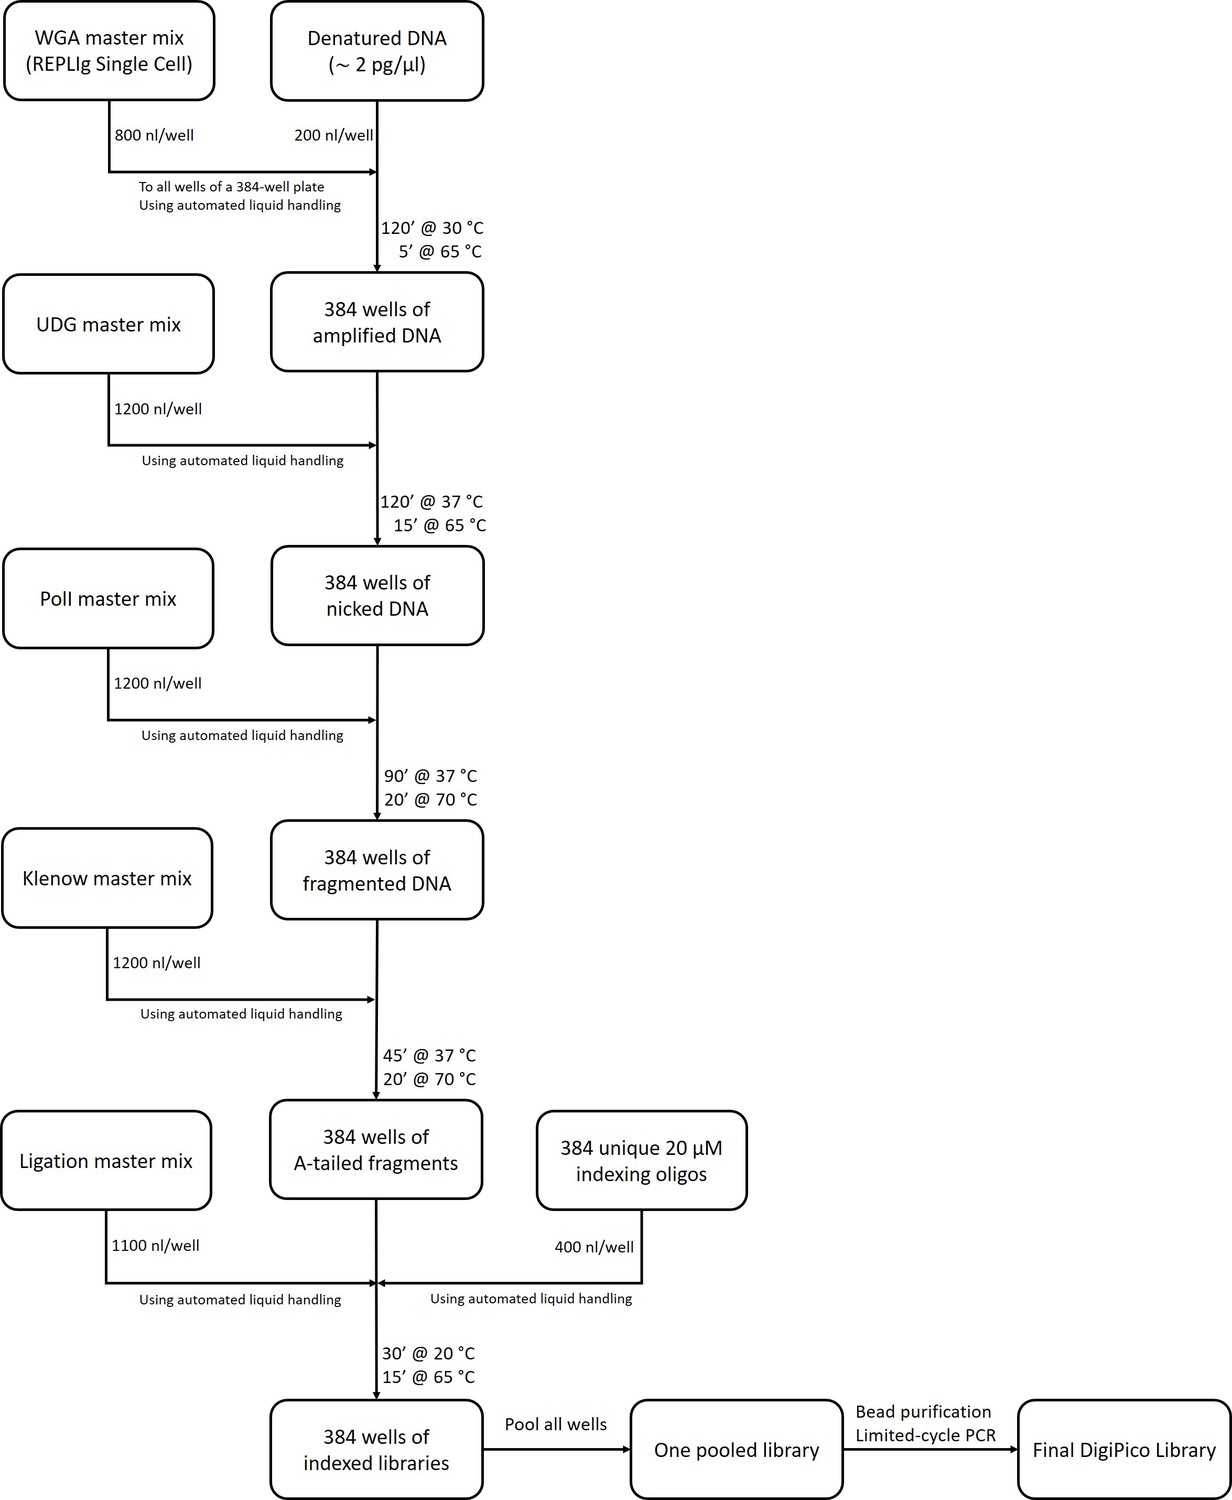
DigiPico library preparation workflow.
The exact composition of all master mixes is explained in the methods section. All liquid handling steps were performed using Mosquito liquid handler (Video 1).
Figure 1—figure supplement 3
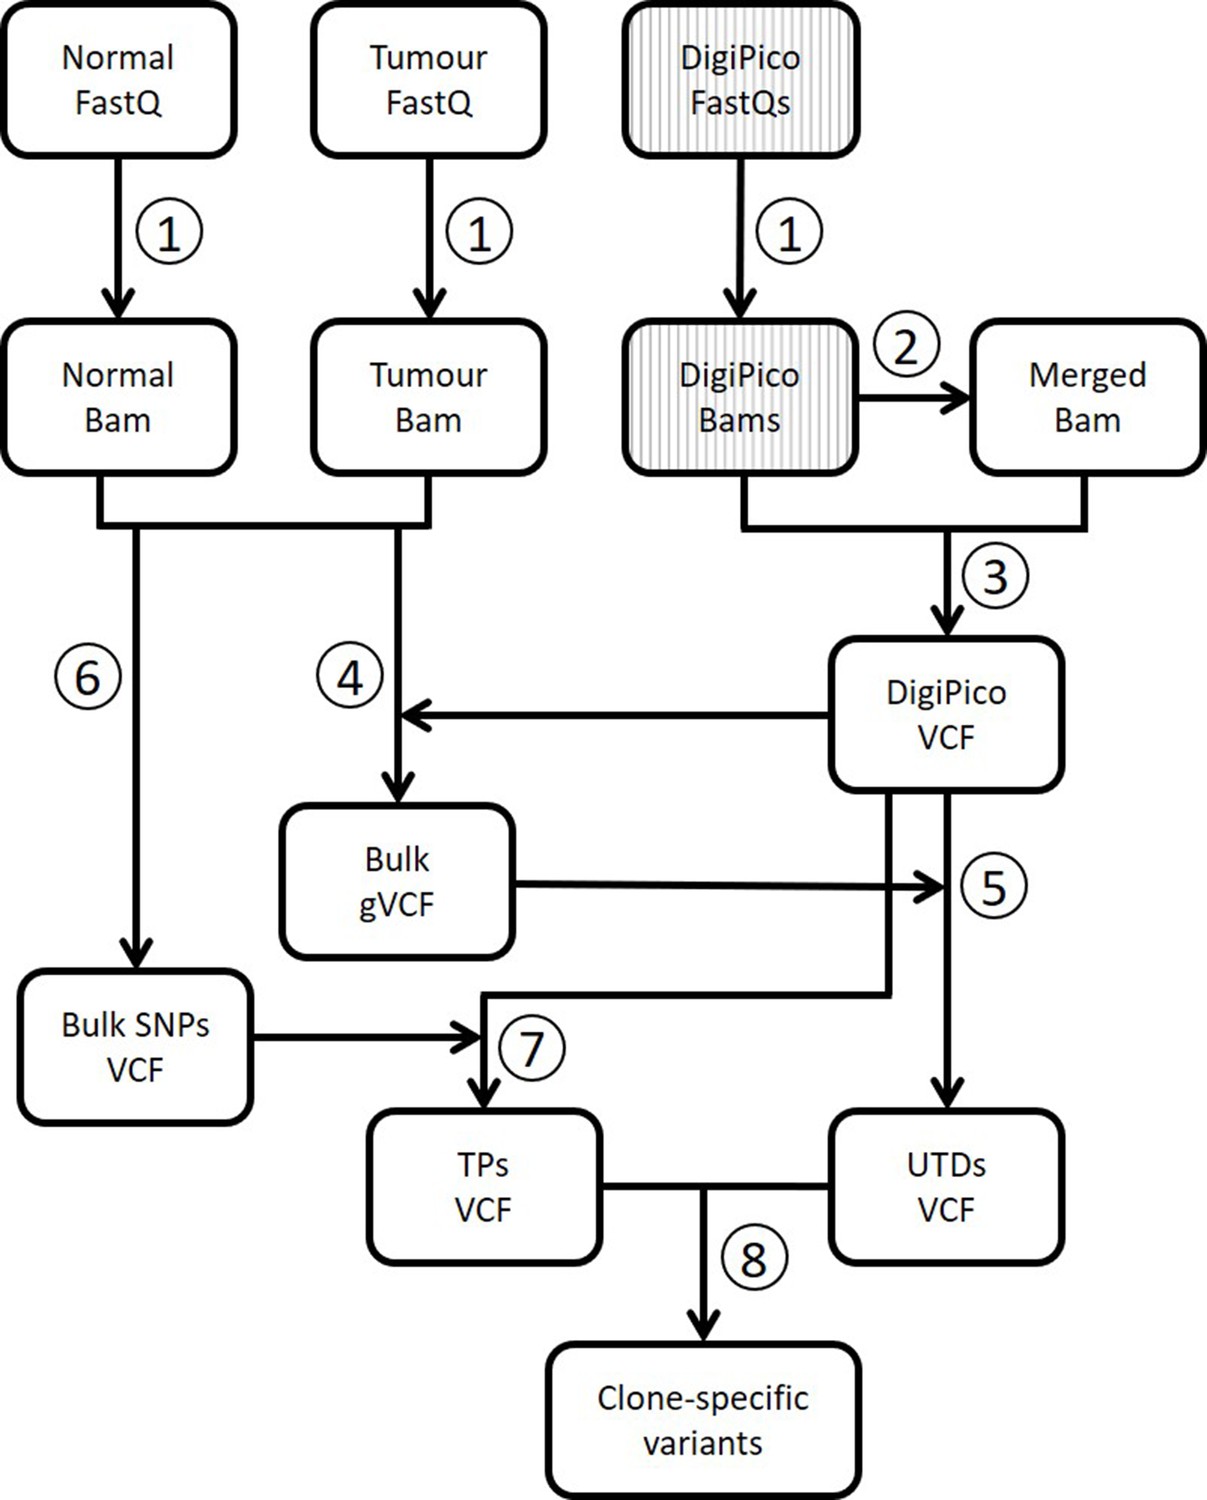
Analysis workflow for DigiPico data.
(Turajlic et al., 2019) Next generation sequencing reads from normal tissue, bulk of the tumor, and DigiPico library are first mapped to human genome to generate bam files. DigiPico reads are divided into 384 FastQ files, one for each well of the 384-well plate. (Zhang et al., 2018) The 384 individual bam files from DigiPico are merged into a single bam file. (Gerstung et al., 2017) De novo joint variant calling is performed on 384 individual bam files as well as the merged bam file using Platypus variant caller. Addition of the merged bam file ensures that variants that have a low per-well coverage will not be missed during variant calling. (Barber et al., 2015) The resulting de novo DigiPico variants are then used as a reference for variant re-calling from standard WGS data of the normal tissue and the bulk of the tumor. (Bohrson et al., 2019) The variant re-calling data can then be used to extract unique to DigiPico (UTD) variants by eliminating any variant that has supporting reads in the standard WGS data. (Chen et al., 2017a) Standard WGS data are also used for variant calling using GATK to obtain a list of high-confidence germline SNPs. (Costello et al., 2013) This list will then be used as a guide to extract TP variant calls from DigiPico data. For this, any variant that was identified using GATK in the bulk blood sample and was also identified in the DigiPico data using Platypus was assumed real. (Nik-Zainal et al., 2012) UTDs and germline SNPs are then used by MutLX to train a binary classification model for extraction of clone-specific variants from UTDs (Figure 2—figure supplement 1).
Figure 2 with 5 supplements
MutLX algorithm, design and results.
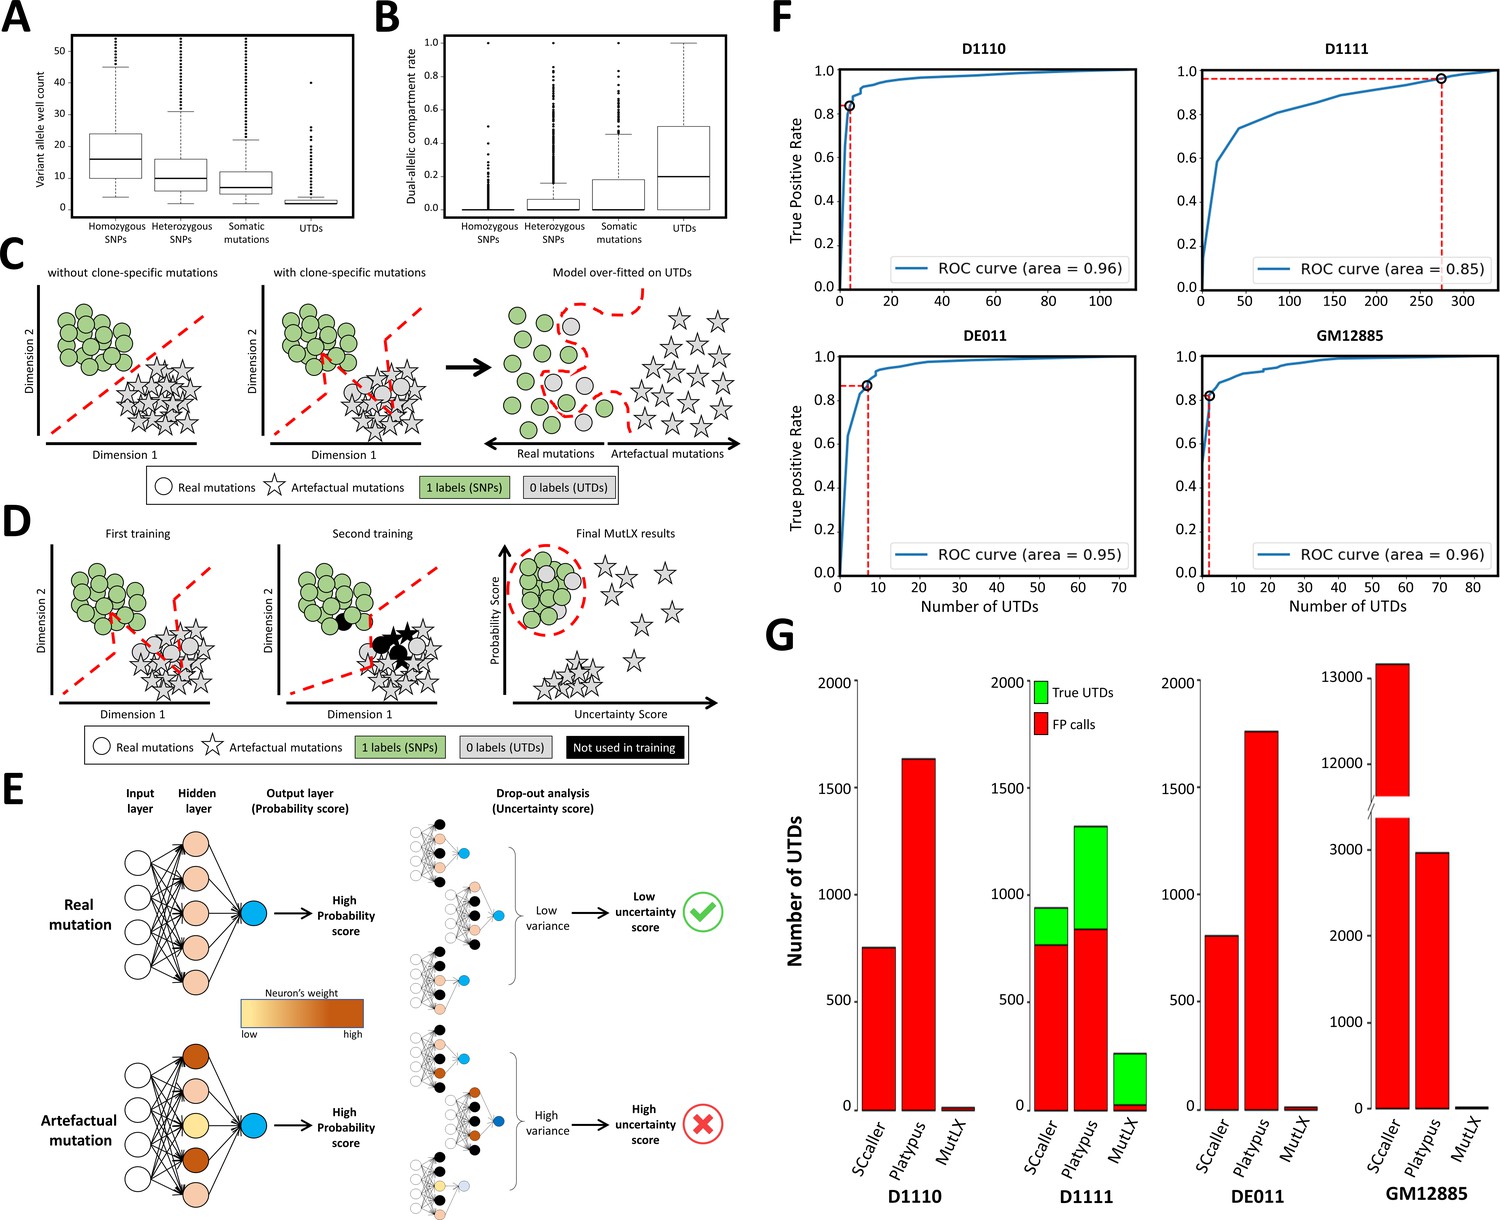
(A) Comparing the number of wells supporting various mutation types in run D1110 confirms that, as hypothesized, the majority of UTDs are present in only a few wells. Horizontal lines represent median. Boxes represent interquartile range. Whiskers show the range excluding outliers which are defined as being outside 1.5 times the interquartile range. (B) Similarly, the dual-allelic compartment rate of UTDs appears to be significantly higher when compared with true variants. This value was calculated by dividing the number of wells with co-presence of variant and reference alleles to the total number of wells with evidence for variant allele. (C) A diagram showing the main challenges in analyzing DigiPico data using ANNs. Each circle/star indicates one variant. Red lines show the behavior of the classification model. All variants above and/or to the left of the lines are predicted to be true variants by the model. The analysis of a sample without clone-specific variant would result in precise separation between real and artefactual mutations. In contrast, the analysis of a sample with true clone-specific mutations would result in a suboptimal model, which could lead to an over-fitting against true UTDs. This will enforce a model that removes all FP calls at the cost of losing nearly all clone-specific variants. (D) A diagram showing the two-step training process in MutLX. The first training step identifies some of the mislabeled true mutations (grey circles) among UTDs. All potentially mislabeled data points are temporarily removed from the analysis in the second training (colored in black) so that a better model is obtained for assigning a probability score to all mutations. Finally, combining the probability scores obtained from the model with the uncertainty estimate (as described in E) of these probability scores allows for effective elimination of FP calls while maintaining an excellent sensitivity for true clone-specific variants. (E) A diagram showing the test-time drop-out analysis to compute the uncertainty estimate of probability scores. Black neurons indicate the neurons that had been turned off during the drop-out analysis. Accepting only variants with a high probability score and a low uncertainty score should allow for elimination of FP variant calls. (F) The ROC curves of the output of MutLX analysis for runs D1110, D1111, DE011, and GM12885 are presented. Circles represent the default cut-off values determined by MutLX. (G) Bar plots representing the number of passed UTDs in the output of SCcaller, Platypus and MutLX. Since no true UTDs are expected to be present in runs D1110, DE011, and GM12885 the number of UTDs in these runs represent the FP rate for each analysis method. Values for Platypus are based on DigiPico-specific filtering criteria prior to the application of MutLX.
-
Figure 2—source data 1
Comparison of MutLX analysis with Platypus and SCcaller.
- https://cdn.elifesciences.org/articles/55207/elife-55207-fig2-data1-v3.xlsx
-
Figure 2—source data 2
Targeted sequencing of some of the clone-specific variants identified in run D1111.
Amplicon sequencing of the target sites was performed on the MiSeq platform. 3 out of the 14 targets appeared to have a high noise levels in the blood sample (highlighted in orange) and were therefore deemed inconclusive. Of the remaining 11 mutations only one did not seem to have any evidence in the bulk DNA sample of the PT2R tumor (highlighted in blue). VAWF: Variant Allele Well Fraction.
- https://cdn.elifesciences.org/articles/55207/elife-55207-fig2-data2-v3.docx
-
Figure 2—source data 3
Targeted sequencing of some of the artefactual variants identified in run DE111.
- https://cdn.elifesciences.org/articles/55207/elife-55207-fig2-data3-v3.docx
-
Figure 2—source data 4
Number of different mutation types in various sequencing runs.
- https://cdn.elifesciences.org/articles/55207/elife-55207-fig2-data4-v3.xlsx
-
Figure 2—source data 5
Primer pairs used for targeted validation of UTD variants.
- https://cdn.elifesciences.org/articles/55207/elife-55207-fig2-data5-v3.xlsx
Figure 2—figure supplement 1
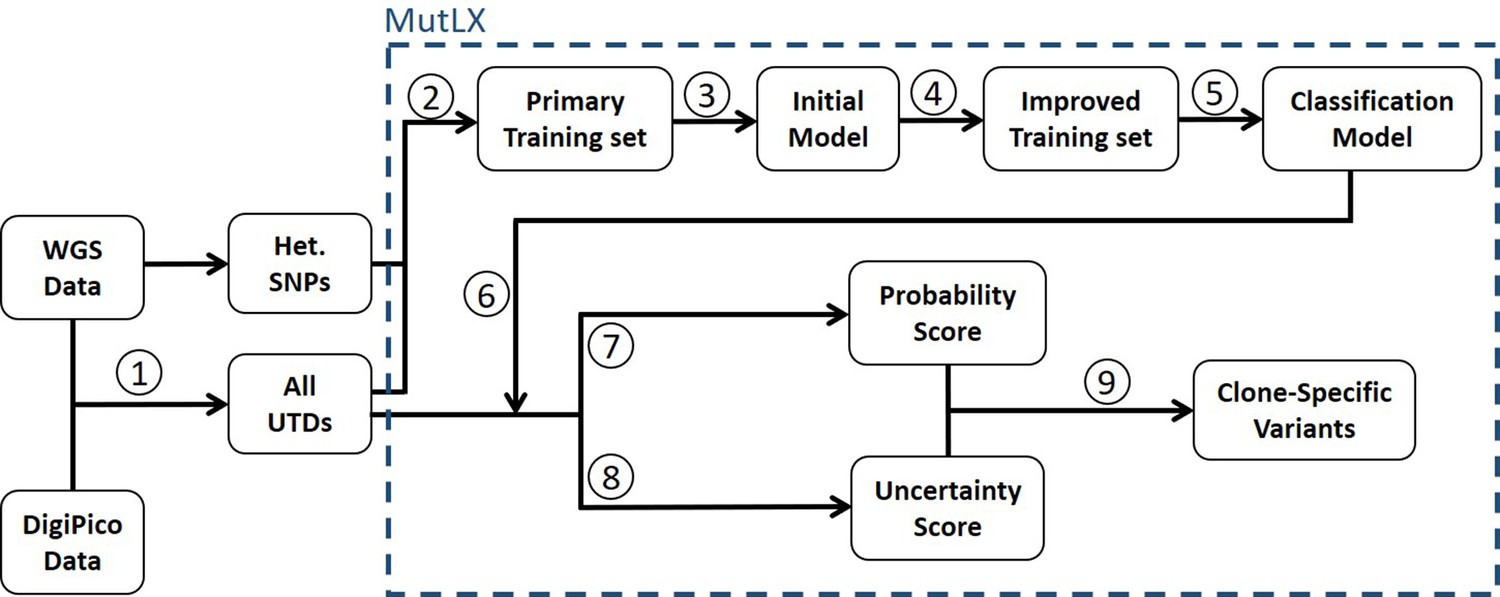
MutLX analysis algorithm.
(Turajlic et al., 2019) UTD variants are identified by subtracting WGS data from DigiPico data. (Zhang et al., 2018) UTDs and SNPs are used as training sets to train a primary binary classification model. (Gerstung et al., 2017) This model is used for primary analysis of the training set which allows for (Barber et al., 2015) generation of an improved training set. (Bohrson et al., 2019) The improved training set is then used to generate a classification model, which (Chen et al., 2017a) can be used for analysis of UTDs. (Costello et al., 2013) A ‘probability score’ indicating the likelihood for a mutation to be real, and (Nik-Zainal et al., 2012) an ‘uncertainty score’, as a measure of unreliability of the calculated probability scores, is calculated for each mutation using the model. (Martincorena et al., 2018) True variants are identified by a high probability score with high certainty (low uncertainty score).
Figure 2—figure supplement 2

Analysis of the synthetic DigiPico datasets.
Various numbers of high-confidence somatic mutations were artificially mislabeled as UTDs (UTD*s) to synthetically inflate the number of true UTDs at various UTD*/UTD ratios in runs (A) D1110 and (B) DE111. Since both of these runs had been performed on 200 pg of purified DNA from bulk tumor samples, neither of them is expected to have true UTD variants. Results indicate that presence of true UTD variants amongst a majority of artefactual UTDs does not appear to compromise the integrity of the classification models generated by MutLX. Each box plot shows the results from 10 different UTD* subsets used for the analysis. To achieve comparable FP rates between runs, cut-off values for analysis were used to achieve a TPR of 90% and 95% in germline variants for all synthetic datasets of runs D1110 (A) and DE111 (B), respectively. Boxplots show the median, interquartile range, and the range excluding outliers. Outliers are defined as being above or below 1.5 times the interquartile range.
Figure 2—figure supplement 3
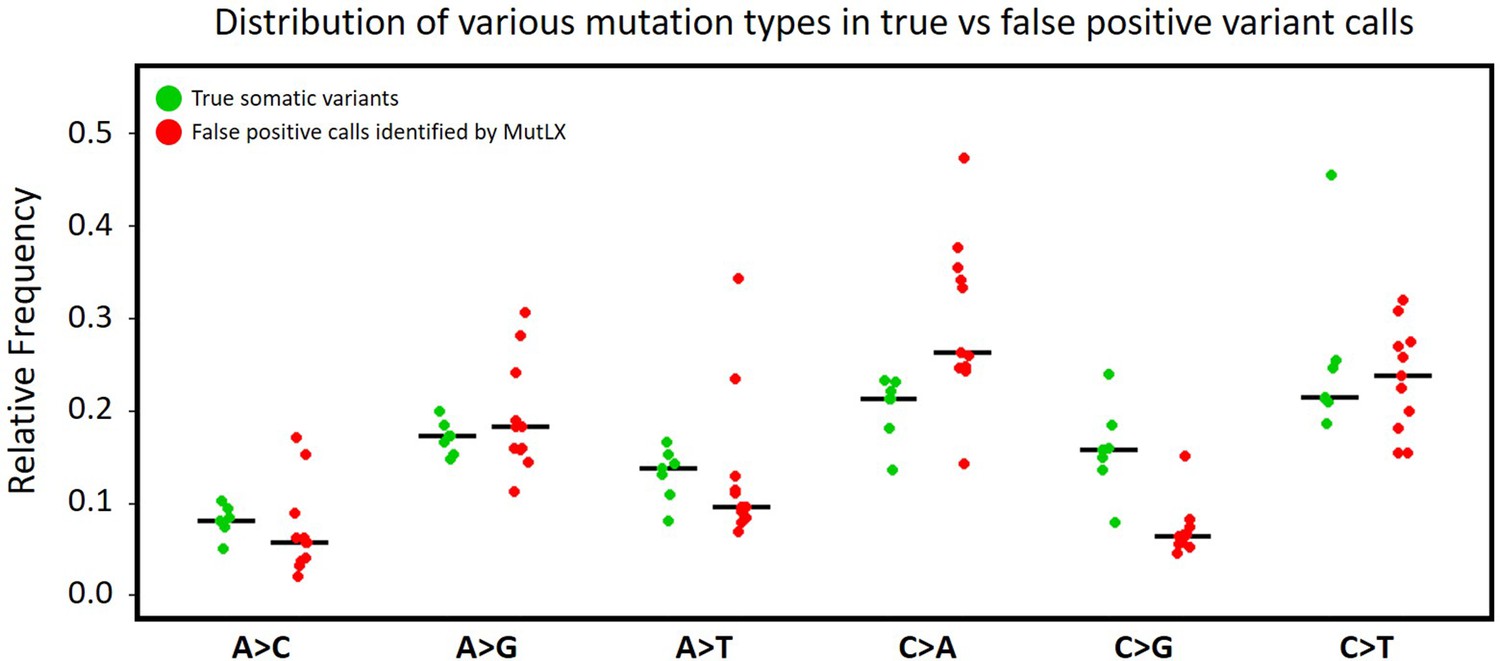
Frequency of various mutation types among FP calls identified by MutLX in DigiPico data.
Green dots (on the left) are obtained from the analysis of somatic variants in standard WGS data from patients #11152, #11513, and OP1036. Red dots (on the right) are obtained from all of artefactual mutations that were identified by MutLX from DigiPico data of the same patients. Black lines represent the median of the values in each set. The higher ratio of C > A mutations among the mutations that are eliminated by MutLX is in agreement with previous studies showing that oxidative DNA damage during library preparation results in formation of artefactual C > A mutations (Figure 2—source data 4).
Figure 2—figure supplement 4
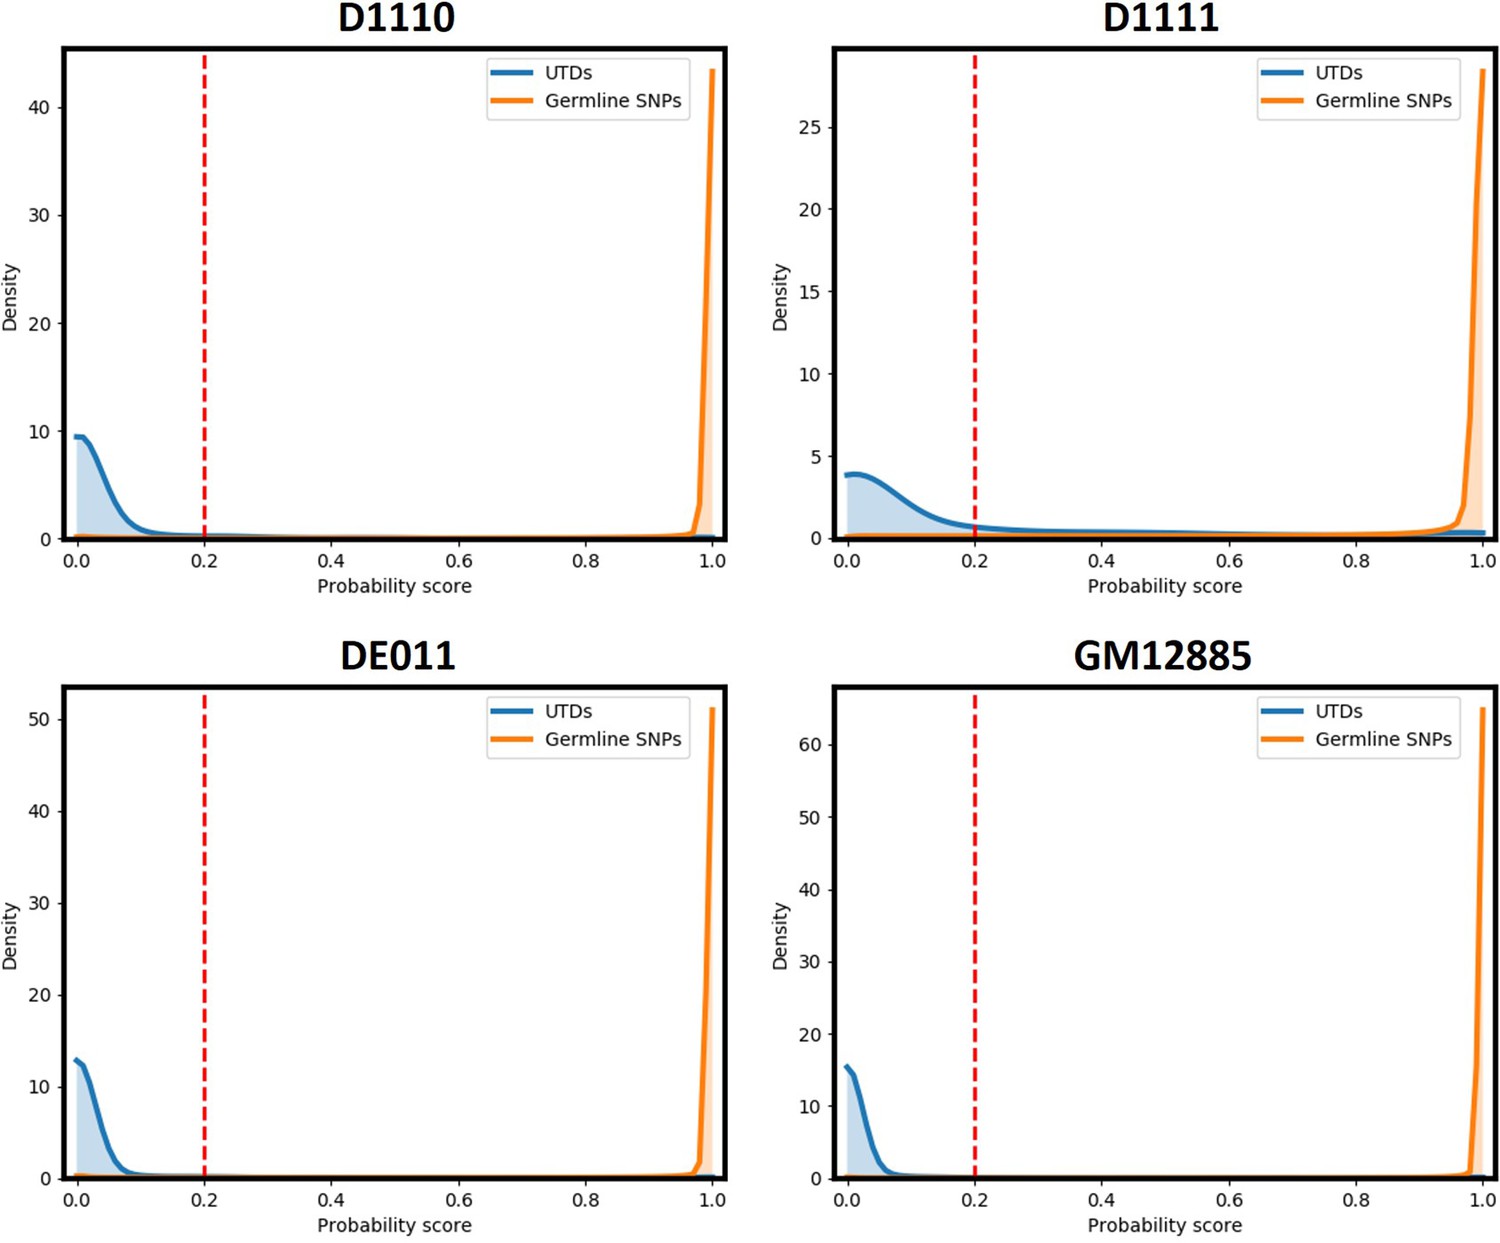
Probability score values for runs D1110, D1111, DE011, and GM12885.
A cut-off value of 0.2 removes the majority of FP variant calls from UTDs while retaining nearly all germline SNPs in all samples.
Figure 2—figure supplement 5
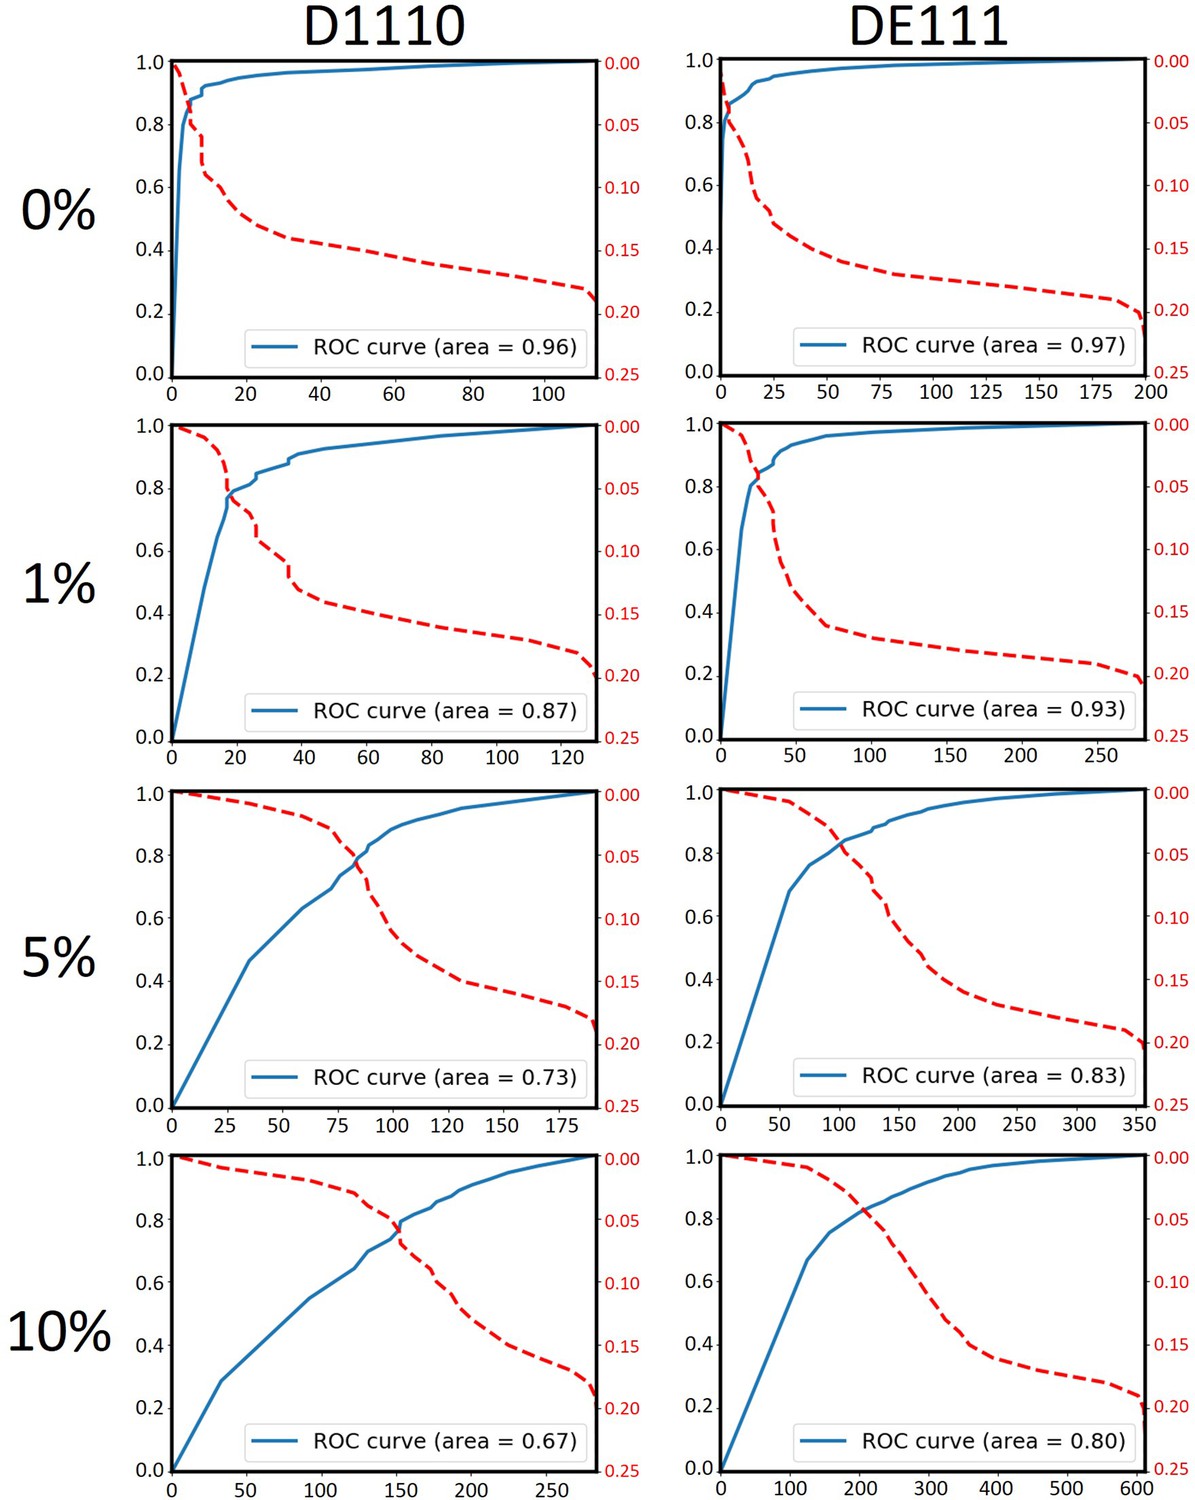
Data simulation confirmed that the AUC negatively correlates with the number of true UTD variants.
Various number of somatic mutations were artificially mislabeled as UTDs (UTD*s) to achieve 1%, 5%, and 10% UTD*/UTD ratios in runs D1110 and DE111. Since both of these runs had been performed on 200 pg of purified DNA from bulk tumor samples, neither of them is expected to have true UTD variants. The independent analysis of each of these simulated datasets using MutLX confirmed the negative correlation between the number of true UTDs in the dataset and the AUC. Notably, it appears that a UTD*/UTD ratio of as little as 1% (16 and 36 variants in runs D1110 and DE11, respectively) can reduce the AUC suggesting that the presence of even a minor proportion of true clone-specific variants perturbs the ROC curve.
Figure 3 with 1 supplement
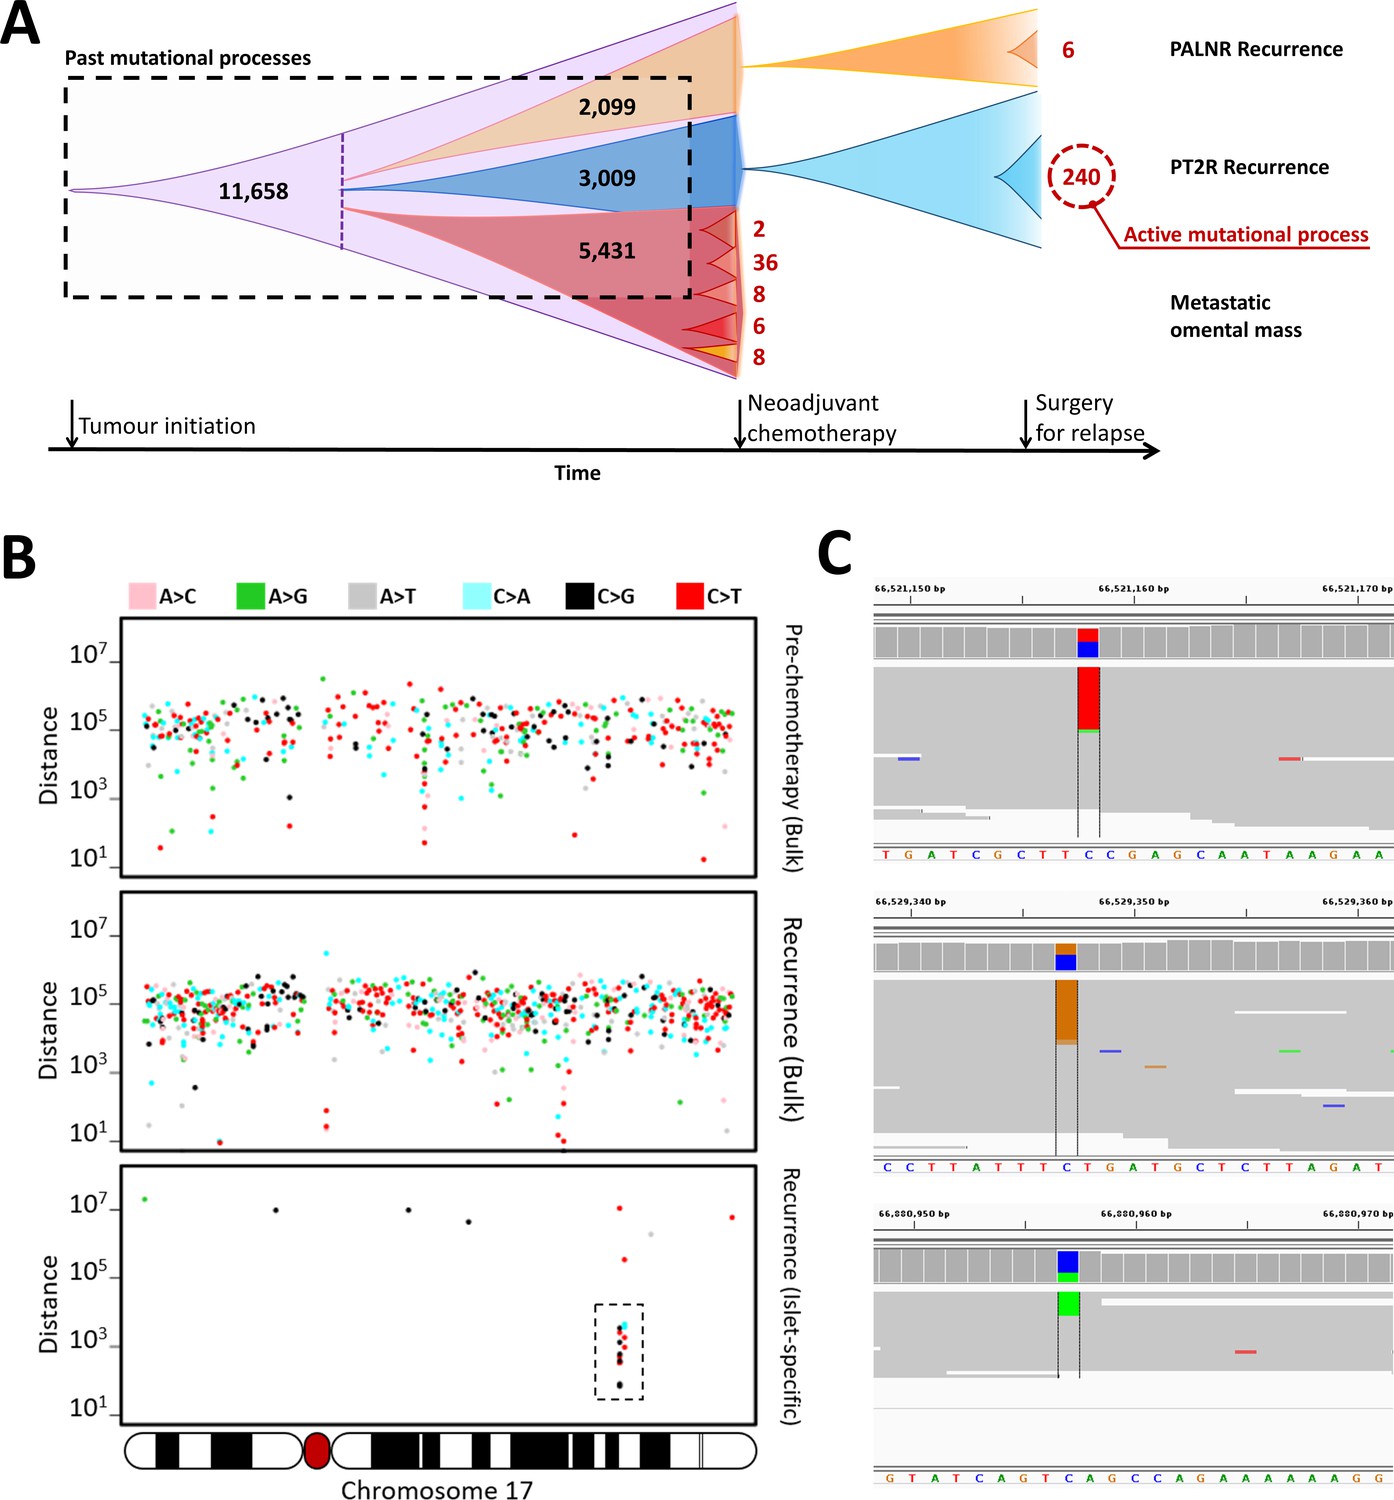
Identification of an active mutational process using DigiPico/MutLX.
(A) Schematic representation of tumor evolution in HGSOC patient #11152. Standard bulk WGS of various tumor samples identified ∼11000 shared somatic mutations among all sites. Dotted purple line indicates the point at which the most recent common ancestor of the studied tumor samples has diverged. Bulk sequencing also identified nearly 5000, 3000, and 2000 sub-clonal mutations specific to the pre-chemotherapy omental mass, PT2R recurrence, and PALNR recurrence, respectively. These mutations however could have occurred anytime during the expansion of these clones and is biased towards older mutations. This is due to the limitations in identifying low-prevalence somatic mutations. DigiPico sequencing of five pre-chemotherapy tumor islets, PT2R and PALNR recurrence sites, however, identified various numbers of recently emerged clone-specific mutations in each of these samples (represented in red numbers). The significantly higher number of clone-specific variants in PT2R indicates the presence of an active mutational process. (B) This active mutational process is highlighted by the presence of a strong clone-specific kataegis event on chromosome 17 in run D1111. Y-axis represents the pair-wise distance of consecutive somatic mutations in log scale. Only mutations from chromosome 17 are shown. Mutations involved with the sub-clonal Kataegis event are highlighted in the box, nearly all of which are in the form of strand-specific C > T or C > G mutations. This suggests the involvement of APOBEC enzymes in this hyper-mutagenesis process. (C) Representative examples of some of the mutations involved in the kataegis. The presence of all the mutations on the forward strand of the genome further confirms the involvement of a hyper-mutagenesis event (Figure 3—figure supplement 1).
Figure 3—figure supplement 1
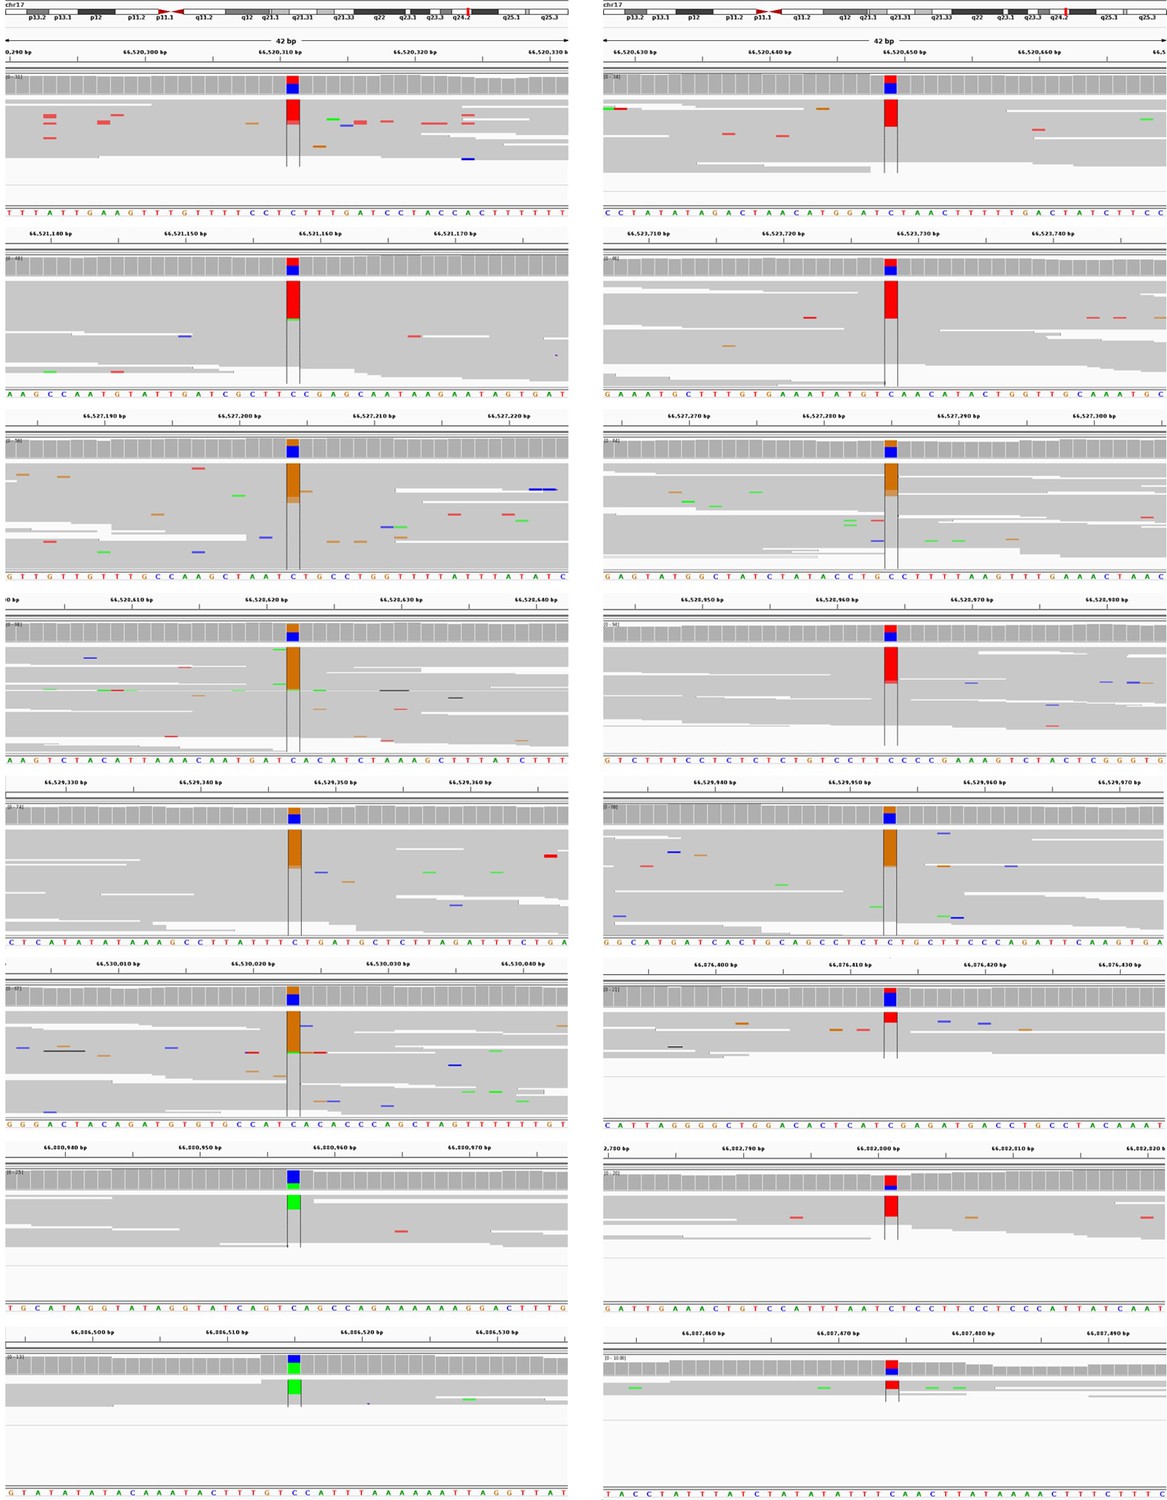
IGV images of SNVs that were identified in the sub-clonal kataegis in PT2R sample.
Note that nearly all mutations are in the form of C > T or C > G mutations on the forward strand of the genome.
Videos
Video 1
Automated pipetting procedure of DigiPico library preparation.
Tables
Table 1
Application of DigiPico sequencing and MutLX analysis to a diverse set of clinical samples.
| Run ID | Patient ID | Sample type | Collection site | Sequencing platform | Total UTD | Passed UTDs | Validation rate* | AUC |
|---|---|---|---|---|---|---|---|---|
| D1110 | #11152 | Recurrence | PT2R | NextSeq | 1634 | 4b | NA | 0.95 |
| D1111 | #11152 | Recurrence | PT2R | NextSeq | 1325 | 266 | 240/266c | 0.85 |
| D1112* | #11152 | Recurrence | PT2R | HiSeq 4000 | 1219 | 210 | 189/210c | 0.85 |
| D1511 | #11152 | Recurrence | PALNR | HiSeq X | 1786 | 9 | NA | 0.94 |
| D1210 | #11152 | Pre-chemo | OM | NextSeq | 3139 | 28 | 16/28c | 0.94 |
| D1211 | #11152 | Pre-chemo | OM | HiSeq 4000 | 5521 | 69 | 17/69c | 0.91 |
| D1212 | #11152 | Pre-chemo | OM | HiSeq 4000 | 5015 | 24 | 16/24c | 0.94 |
| D1213 | #11152 | Pre-chemo | OM | HiSeq 4000 | 5090 | 46 | 25/46c | 0.93 |
| D1214 | #11152 | Pre-chemo | OM | HiSeq 4000 | 3415 | 37 | 27/37c | 0.93 |
| DE011 | #11513 | Normal | Blood | HiSeq X | 1759 | 7b | NA | 0.95 |
| DE111 | #11513 | Pre-chemo | Ascites | HiSeq X | 3685 | 4b | NA | 0.97 |
| D6311 | OP1036 | Pre-chemo | RPCG | HiSeq X | 3185 | 12 | NA | 0.96 |
| DA111 | #11502 | Pre-chemo | LPrt | NextSeq | 12511 | 10 | NA | 0.97 |
| GM12885 | - | Cell line | - | NextSeq | 2970 | 3b | NA | 0.96 |
-
* Run D1112 is a technical replicate of run D1111. b Runs where true UTDs are not expected to be present.c Validation through comparison with independent high-depth WGS data from the bulk of the tumor. * Validation rate is an under-estimation for the positive predictive value of clone-specific variants. PT2R: Pelvic Tumor Recurrence; PALNR: Para-Aortic Lymph Node Recurrence; OM: Omental Mass; RPCG: Right Paracolic Gutter; LPrt: Left Peritoneum; NA: Not Available; AUC: Area Under the Curve of receiver operating characteristic plot.
The study of active mutational processes using DigiPico/MutLX.
Table 2
Summary of patient samples and associated sequencing experiments.
| Patient ID | Sample type | Collection site | Analysis performed | |
|---|---|---|---|---|
| Bulk WGS | DigiPico sequencing | |||
| #11152 | Normal | Blood | x | |
| #11152 | Pre-chemo | Omentum | x | x |
| #11152 | Recurrence | Pelvic tumor | x | x |
| #11152 | Recurrence | Lymph node | x | |
| #11513 | Normal | Blood | x | x |
| #11513 | Pre-chemo | Ascites | x | x |
| OP1036 | Normal | Blood | x | |
| OP1036 | Pre-chemo | Paracolic gutter | x | x |
| #11502 | Normal | Blood | x | |
| #11502 | Pre-chemo | Peritoneum | x | x |
Additional files
Download links
A two-part list of links to download the article, or parts of the article, in various formats.
Downloads (link to download the article as PDF)
Open citations (links to open the citations from this article in various online reference manager services)
Cite this article (links to download the citations from this article in formats compatible with various reference manager tools)
A highly accurate platform for clone-specific mutation discovery enables the study of active mutational processes
eLife 9:e55207.
https://doi.org/10.7554/eLife.55207


