Principles of operation of a cerebellar learning circuit
- Department of Neurobiology, Duke University School of Medicine, United States
Figures
Figure 1
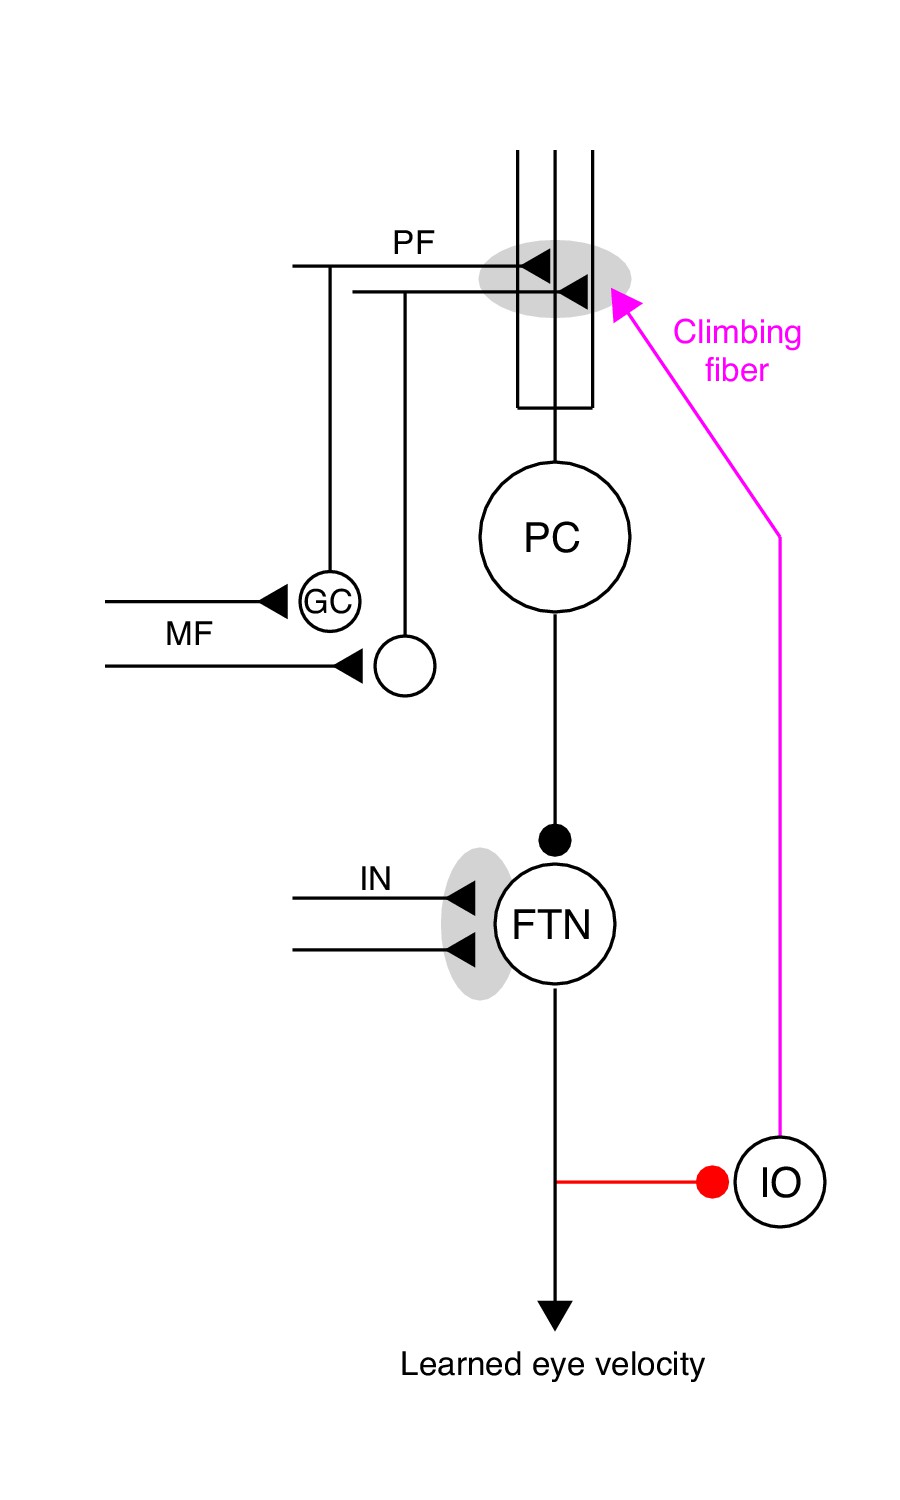
The essential cerebellar circuit responsible for the acquisition and expression of motor memories during pursuit direction learning.
Mossy fibers (MFs) relay image motion and eye kinematic signals to granule cells (GCs) in the floccular complex of the cerebellum. The parallel fiber (PF) axons of cerebellar granule cells synapse on Purkinje cells (PCs). Joint activity of parallel fibers and an action potential on climbing fibers (magenta) from the inferior olive (IO) drives plasticity at the parallel fiber to Purkinje cell synapse. Purkinje cells send inhibitory projections to floccular target neurons (FTNs) in the vestibular nucleus. FTNs receive non-Purkinje cell inputs (IN). FTNs send monosynaptic projections to motoneurons, driving learned behavior. The output of the learning system sends inhibitory projections to the inferior olive (red).
-
Figure 1—source data 1
Figure composer source data for the cerebellar schematic.
- https://cdn.elifesciences.org/articles/55217/elife-55217-fig1-data1-v2.zip
Figure 2

Dual-trial experimental paradigm used to selectively measure the signals associated with acquisition and generalization of a motor memory.
(A) Motion of the target in two dimensions during learning and probe trials. Dashed and continuous arrows show the trajectory followed by target position during learning and subsequent probe trials, respectively. (B, C) Eye (solid) and target velocity (dashed) traces in the learning trial (B) and the probe trial (C) of each learning-probe trial pair. Blue and red traces show the pursuit direction and the orthogonal learning direction. The red dashed trace in (B) shows the onset of the instruction, which produces target motion in the learning direction at 30 deg/s. Gray shaded regions denote the time interval used to quantify behavioral learning on single trials, 225–275 ms after the onset of target motion. Arrow heads show the visually-driven response in (B) and the learned response in (C) due to presence of the instruction in the learning trial. (D, E) Eye and target position traces associated with the velocity traces in (B) and (C).
-
Figure 2—source data 1
Figure composer source data for example learning and probe trials.
- https://cdn.elifesciences.org/articles/55217/elife-55217-fig2-data1-v2.zip
Figure 3
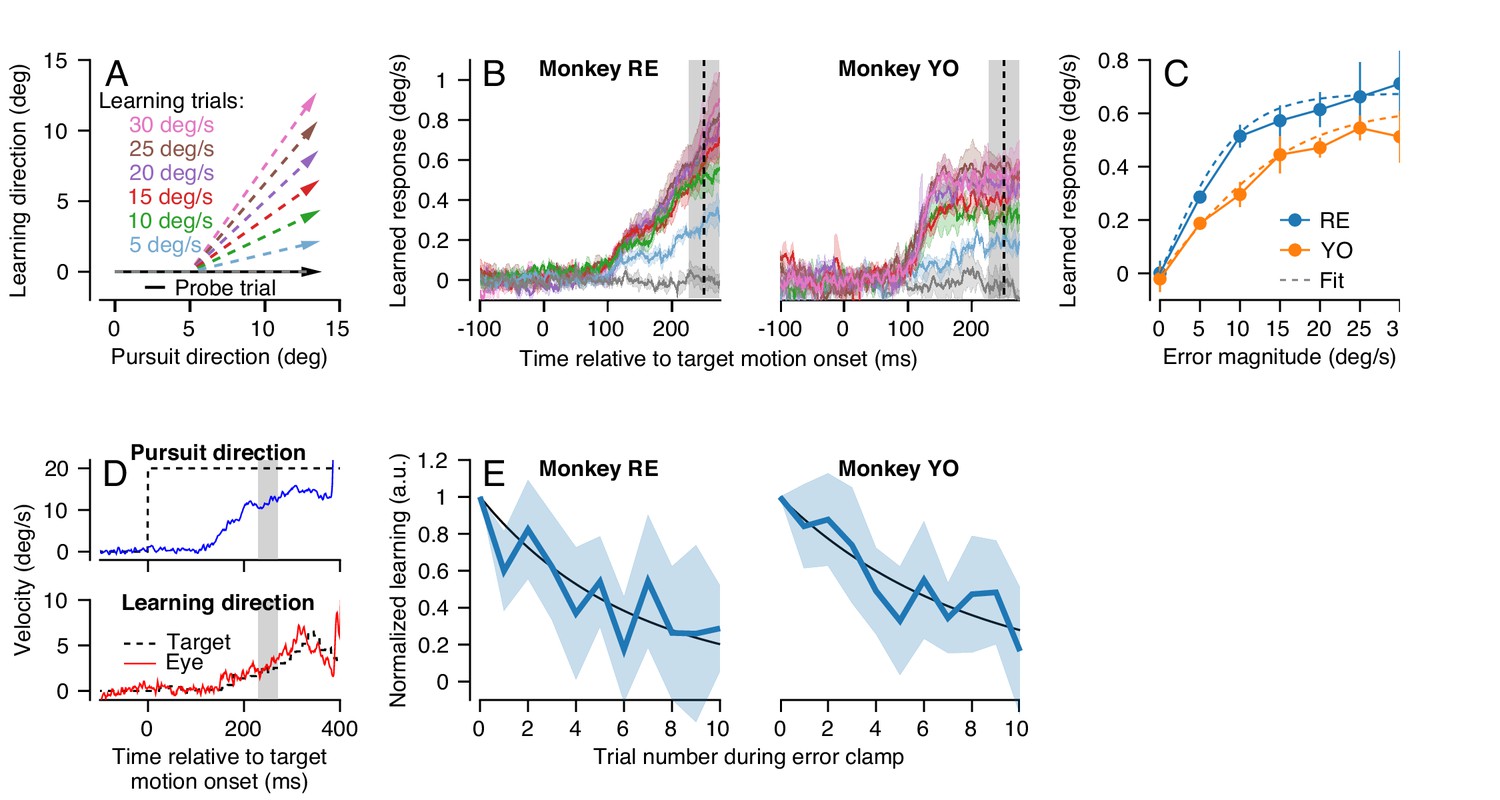
Characteristics of short-term pursuit learning acquisition and retention.
(A) Colored arrows show the target position trajectory in two dimensions during learning trials. Different colors show learning trials with instruction speeds of 5, 10, 15, 20, 25, or 30 deg/s. Black arrow shows the subsequent probe trial (learning speed 0 deg/s). Pursuit and instruction directions were randomized from trial-to-trial (see Materials and methods). (B) Average eye velocity in the direction of the previous instruction (learning direction) as a function of time during probe trials averaged across experiments from Monkeys RE (left) and YO (right). Different colors indicate average responses for the different error magnitudes using the same color scheme as in (A). The vertical dashed line shows the time of the instruction in the preceding learning trial and the gray shaded region shows the interval used for quantitative analysis, 225 to 275 ms after the onset of pursuit target motion. (C) The amplitude of single-trial learning as a function of the error magnitude created by the previous instruction. Dashed lines show best-fit sigmoid for each monkey. (D) Example ‘error-clamp’ trial used to minimize the retinal image motion in the learning direction, allowing characterization of motor memory retention in the absence of error. Red and blue traces show eye velocity and the black dashed traces show target velocity. (E) Trial-course of forgetting after 20 learning trials, probed under error-clamp conditions for Monkeys RE (left) and YO (right). Data are normalized to the magnitude of behavioral learning in the last learning trial (trial 0). Black curves show best fitting exponentials. Error bands and error bars show ± SEM across experiments for each monkey.
-
Figure 3—source data 1
Figure composer source data characterizing single-trial pursuit learning.
- https://cdn.elifesciences.org/articles/55217/elife-55217-fig3-data1-v2.zip
Figure 4
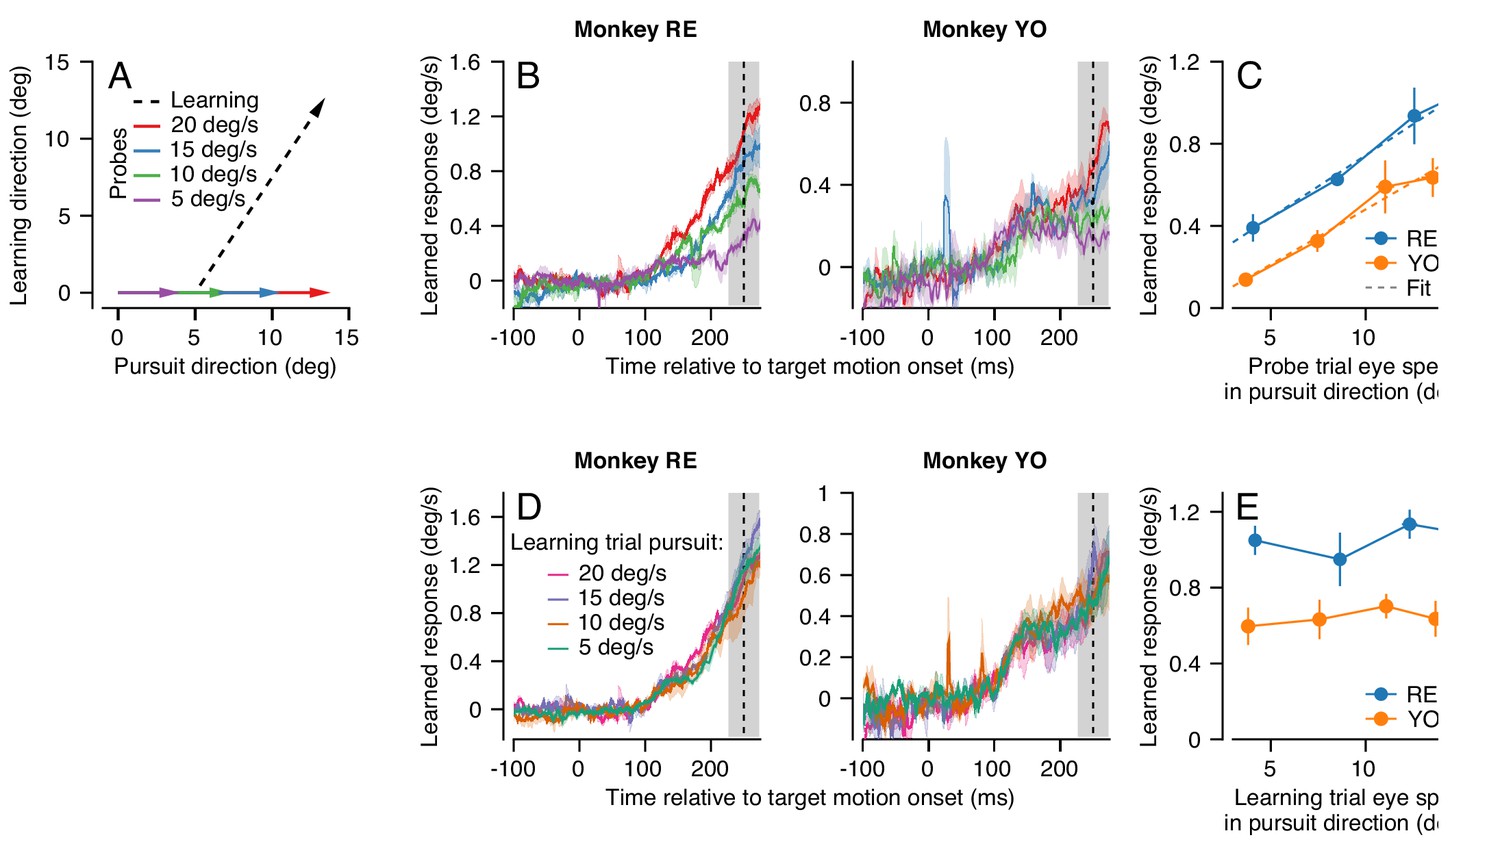
Effect (and non-effect) of pursuit eye speed on expression (and acquisition) of single-trial learning.
(A) Experimental paradigm for evaluating the effect of pursuit speed on expression of learning, showing target motion in two dimensions. Black dashed trace shows the learning trial and colored arrows show probe trials with different pursuit speeds. (B) Learned eye velocity in the direction of the previous instruction (learning direction), recorded in the probe trials and averaged across experiments for each monkey. Different colors show responses for different pursuit speeds in the probe trial, as in (A). Vertical dashed line shows the time of the instruction from the preceding learning trial. (C) Symbols connected by lines show the learned response measured in the gray shaded region in (B) as a function of the measured eye velocity in the pursuit direction during the same interval. Dashed lines show the best fit linear model. (D) Learned eye velocity in the direction of the previous instruction, recorded in the probe trial (20 deg/s pursuit speed) and averaged across experiments for each monkey. Different colors show responses for different pursuit speeds in the preceding learning trial. Vertical dashed line shows the time of the instruction in the preceding learning trial. (E) Summary of the learned response in the probe trial during the gray-shaded region in (D) as a function of the eye speed in the pursuit direction in the preceding learning trial. Error bands and error bars show ± SEM across experiments for each monkey.
-
Figure 4—source data 1
Figure composer source data showing the effects of pursuit speed on expression of single-trial learning.
- https://cdn.elifesciences.org/articles/55217/elife-55217-fig4-data1-v2.zip
Figure 5
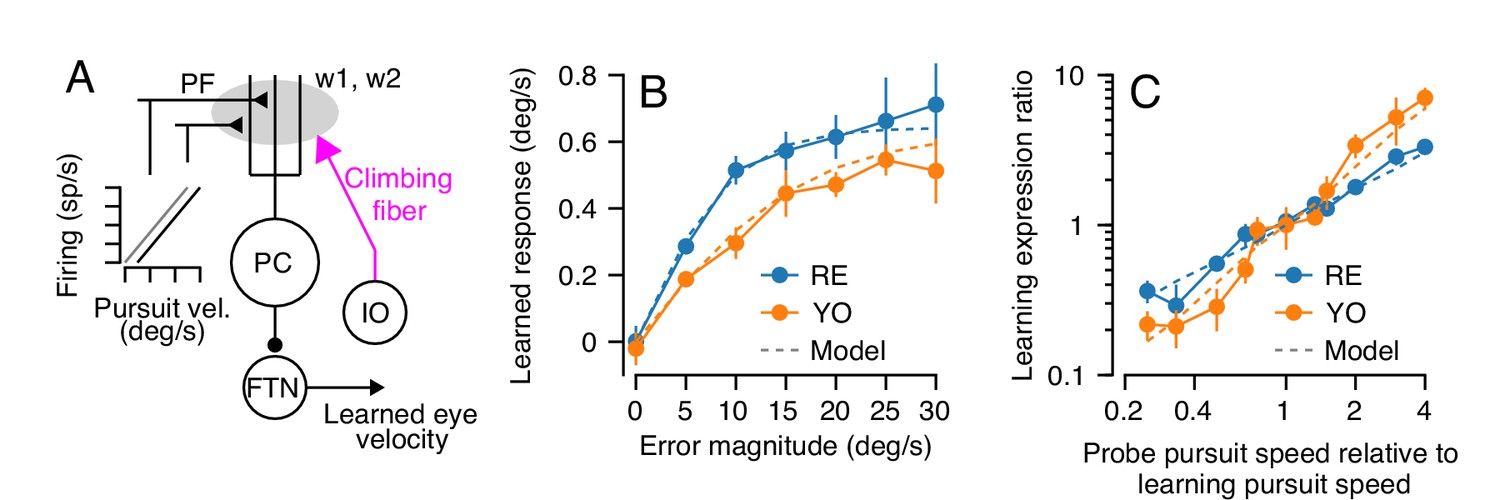
Properties of a cerebellar model of single-trial learning with a single site of plasticity.
(A) Simplified model of cerebellar learning with a single-site of plasticity at the parallel fiber to Purkinje cell synapse (gray shaded oval). Abbreviations are the same as in Figure 1. In this single-learning-process model, the firing of parallel fibers is linearly related to the speed of the eye in the pursuit direction. (B) Dashed lines show the model’s prediction of learned responses as a function of error magnitude. Filled symbols connected by lines are reproduced from Figure 3C. (C) Learning expression ratio as a function of the ratio of pursuit speed in the probe trial to the pursuit speed in the learning trial (note that both axes are on a log scale). By definition, the learning expression ratio is ~1.0 when the pursuit speed in the probe trial and the preceding learning trial are identical. As in (B), dashed lines show the prediction of the single-learning-process model and symbols connected by lines summarize data from the two monkeys. Error bars show ± SEM across experiments for each monkey.
-
Figure 5—source data 1
Figure composer source data comparing the single-site model of cerebellar learning with behavioral results.
- https://cdn.elifesciences.org/articles/55217/elife-55217-fig5-data1-v2.zip
Figure 6
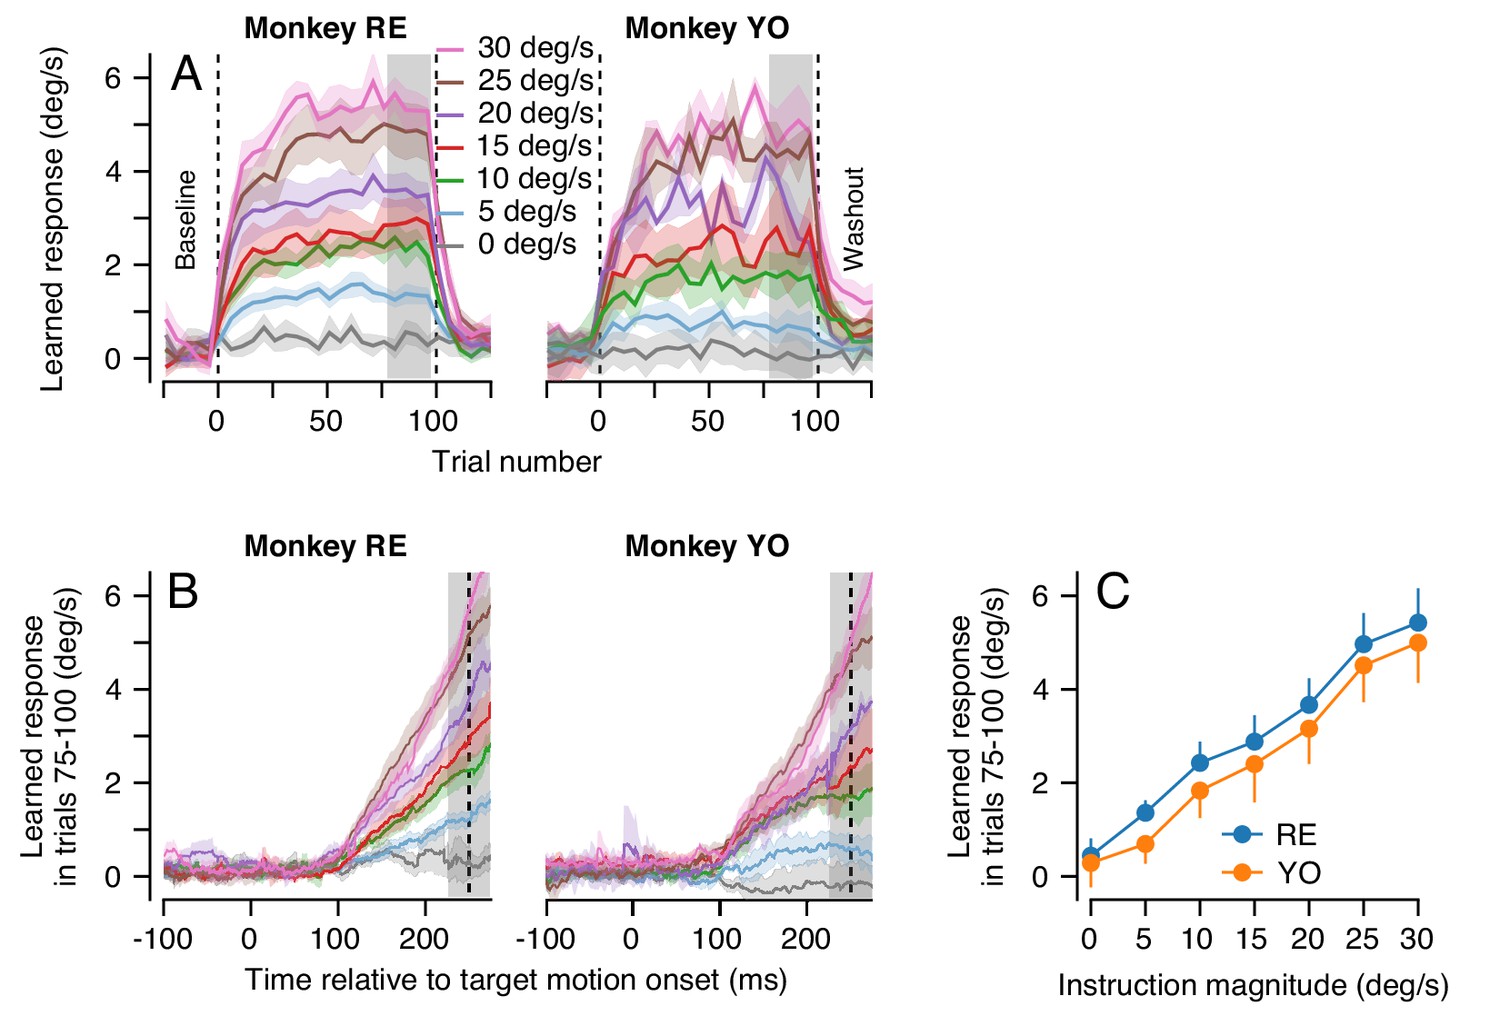
Effect of instruction magnitude on behavior learning after 100 trials of repeated instructions.
(A) Trial-courses of learning for blocks of 100 learning trials with a consistent instruction magnitude. Different colors show trial-courses for different instruction magnitudes. Dashed vertical lines show the first and last learning trials. Data are binned in discrete five-trial bins and averaged across experiments in each monkey. Gray shading shows the range of trials used to assess the magnitude of asymptotic learning. (B) Average learned eye velocity as a function of time in the final 25 learning trials for blocks of 100 learning trials, averaged across experiments for each monkey. Gray shading shows the time interval used for quantitative analysis of the learned eye velocity. (C) Summary of the effect of instruction magnitude on the asymptotic learned eye velocity in the final 25 trials of a learning block. Error bands and error bars show ± SEM for each monkey across repetitions of 100-trial learning blocks.
-
Figure 6—source data 1
Figure composer source data showing the cumulative effects of multiple learning trials.
- https://cdn.elifesciences.org/articles/55217/elife-55217-fig6-data1-v2.zip
Figure 7

Long-term behavioral learning is not merely accumulation of single-trial learning.
(A) Trial-courses of learning for different instruction magnitudes, averaged across experiments for both monkeys. Thin traces with error bands show learning as a function of trial number as mean ± SEM (data reproduced from Figure 6A without binning). Bold traces show the predictions of the single-learning-process model described in the text. (B) Asymptotic learning measured in the last 25 trials of a 100-trial learning block, plotted as a function of the speed of the instruction in that block. Connected symbols and error bars show the data for each monkey (reproduced from Figure 6C). Dashed traces show the predictions of the single-learning-process model. Error bands and error bars show ± SEM for each monkey across repetitions of 100-trial learning blocks.
-
Figure 7—source data 1
Figure composer source data showing the progression of learning across 100 trial blocks of learning trials compared to the results predicted by a single-site model of cerebellar learning.
- https://cdn.elifesciences.org/articles/55217/elife-55217-fig7-data1-v2.zip
Figure 8

A cerebellar model that captures the amplitude and trial-course of learning across multiple timescales.
(A) Trial course of forgetting under error-clamp conditions. Orange and blue traces show forgetting after >1000 or 20 trials (the latter reproduced from Figure 3E). Black curves show best fitting exponentials. Error bands show SEM across n = 4 experiments. (B) Schematic diagram of a cerebellar model with two sites of plasticity, capable of recapitulating the properties of pursuit learning across multiple timescales. Magenta arrows denote teaching/transfer signals. The red pathway denotes recurrent inhibition of the internal representation of the error that drives learning. (C) Trial-course predictions of the cerebellar model in (B) without recurrent feedback to the inferior olive for a range of instruction magnitudes. (D) Exemplar fits of the cerebellar learning model in (B) to trial-courses of learning for repeated presentations of instructions at different speeds. Thin traces with error bands show learning averaged (± SEM) across multiple experiments as a function of trial number for Monkey RE (reproduced from Figure 6A, unbinned). Bold traces show the predictions of the best-fitting cerebellar circuit model for each instruction magnitude. (E) Asymptotic learning measured in the last 25 trials of a 100-trial learning block, plotted as a function of the speed of the instruction in that block. Connected symbols and error bars show the data for each monkey (reproduced from Figure 6C). Dashed traces show the predictions of the asymptotic response of the cerebellar model from (B).
-
Figure 8—source data 1
Figure composer source data showing the predictions of a model of cerebellar motor learning which includes multiple sites of plasticity operating at different timescales.
- https://cdn.elifesciences.org/articles/55217/elife-55217-fig8-data1-v2.zip
Figure 9
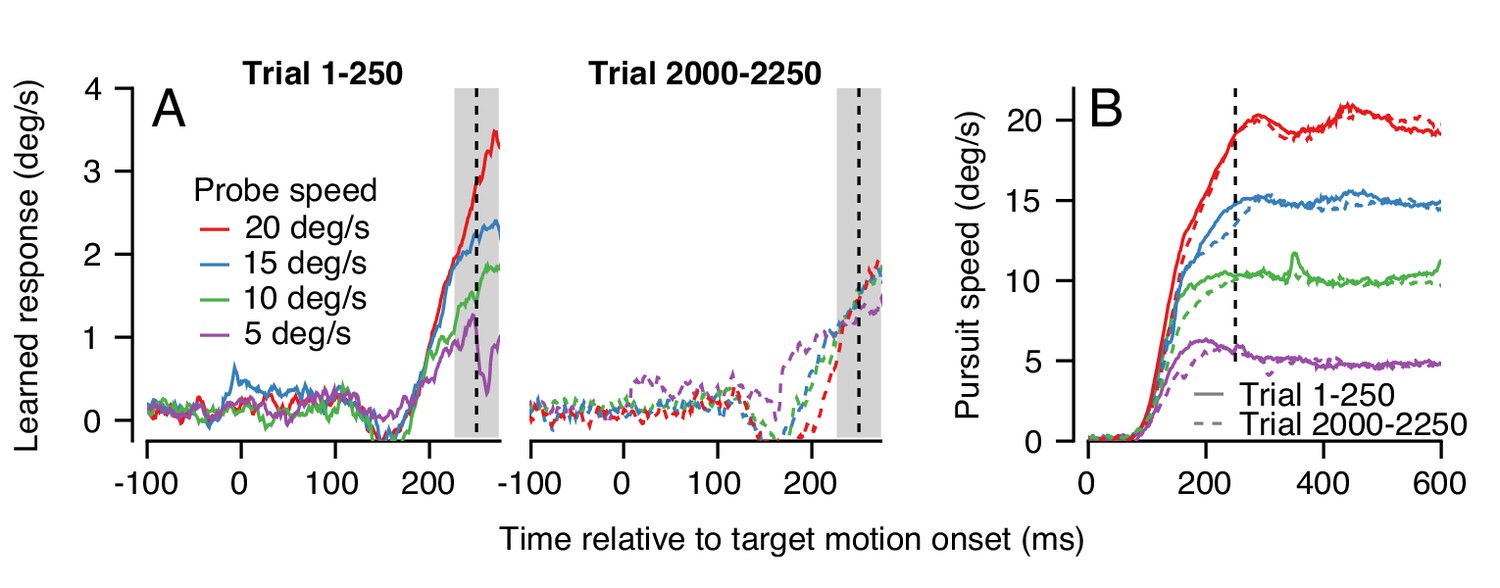
Changes in the pattern of behavioral generalization across an exemplar learning session in Monkey RE when pursuit speed in the learning trial is 5 deg/s.
(A) Effect of pursuit speed in the probe trial on the expression of learning in the first 250 (solid, left) versus last 250 trials (dashed, right) of a long learning session. Data plot average learned eye velocity as a function of time from a single exemplar session in Monkey RE with pursuit speed of 5 deg/s and an instruction magnitude of 30 deg/s in the learning trials. Traces of different colors show the learned response for different pursuit target speeds in the probe trials. (B) Continuous and dashed traces show eye speed in the pursuit direction early versus late in the learning session during probe trials from (A).
-
Figure 9—source data 1
Figure composer source data showing changes in the generalization to pursuit speed in the probe trial across a learning session.
- https://cdn.elifesciences.org/articles/55217/elife-55217-fig9-data1-v2.zip
Figure 10
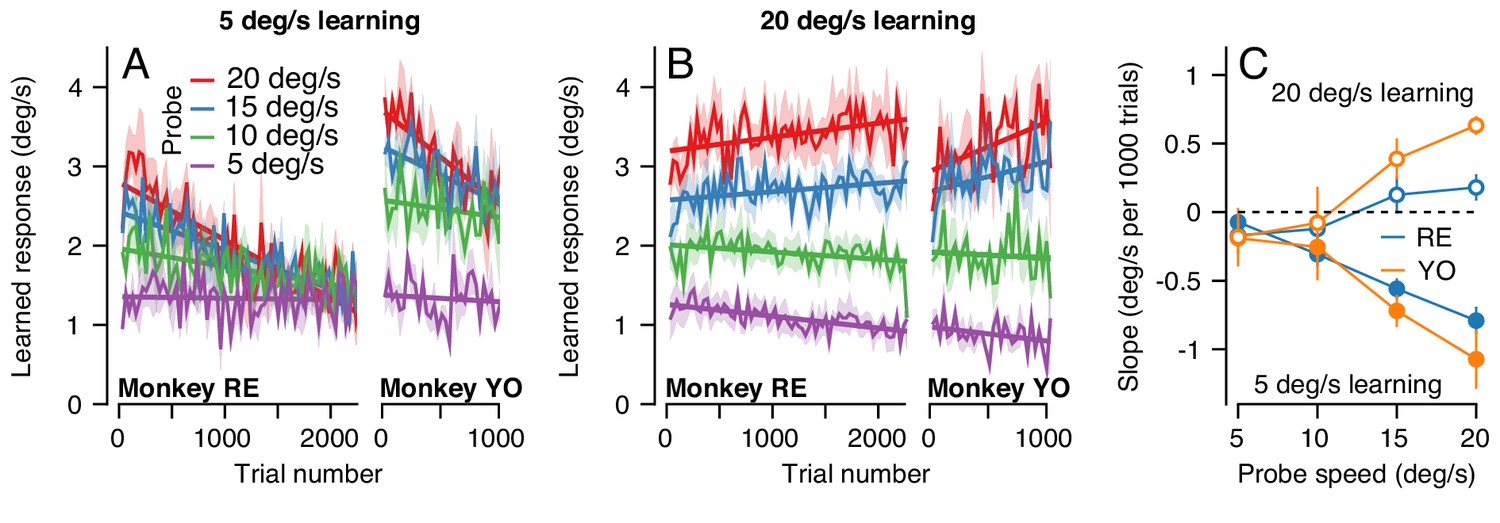
The pattern of generalization across a learning session depends on the relative speeds of target motion in the pursuit direction during learning versus probe trials.
(A) Continuous changes in learned responses measured in probe trials across sessions when pursuit speed in the learning trial was 5 deg/s. Different colors show the responses for different target speeds in the probe trials. Note that the trial axis represents cumulative trials (learning and probe). (B) Generalization across learning sessions when pursuit speed in the learning trial was 20 deg/s. Different colors show expression of learning for probe trials with pursuit speeds of 5, 10, 15, or 20 deg/s as in (A). (C) Slopes of the trial-course of the expression of learning as a function of pursuit speed in the probe trial. Open and filled symbols show results for learning trials with pursuit speeds of 20 versus 5 deg/s. Instruction magnitude was always 30 deg/s. Error bars in (C) and error bands in (A) and (B) show ± SEM across days for each monkey.
-
Figure 10—source data 1
Figure composer source data showing the differential effects of pursuit speed in the learning trial on the generalization of learning.
- https://cdn.elifesciences.org/articles/55217/elife-55217-fig10-data1-v2.zip
Figure 11
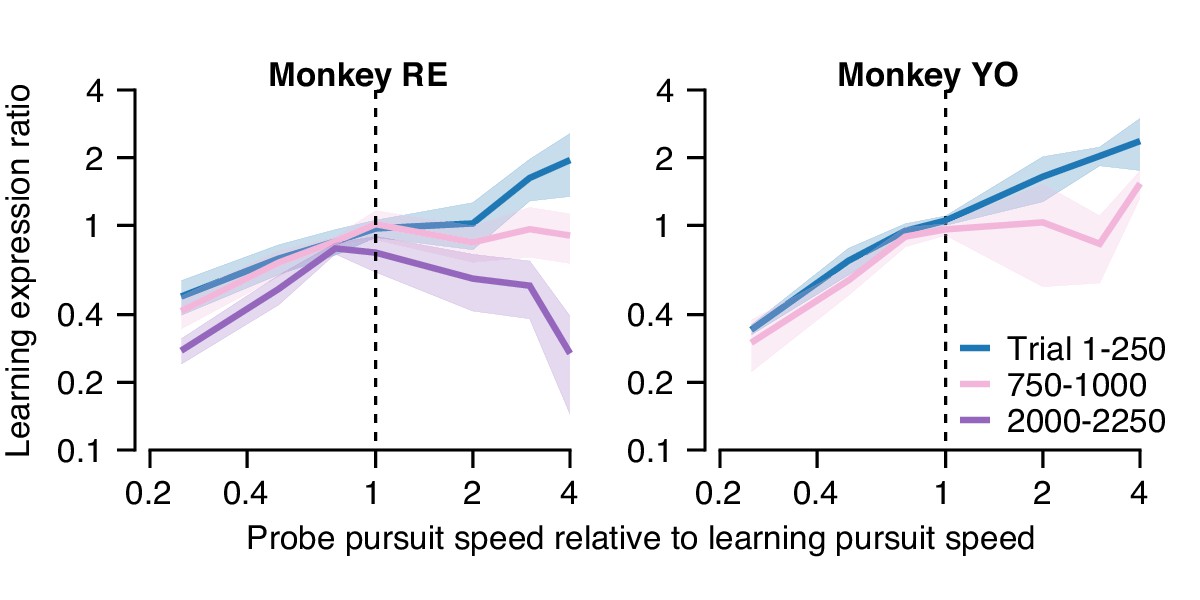
Quantification of changes in the generalization of learning expression across trials.
Fraction of the behavioral learning that generalizes from a learning trial to the subsequent probe trial as a function of the ratio between the pursuit speed in the probe versus learning trial (both axes are shown on a log scale). Blue, pink, and purple curves show the shape of the generalization function early, in the middle, and late in long learning bouts, respectively. Error bands show ± SEM across sessions for each monkey.
-
Figure 11—source data 1
Figure composer source data characterizing changes in the shape of the generalization function across trials.
- https://cdn.elifesciences.org/articles/55217/elife-55217-fig11-data1-v2.zip
Figure 12
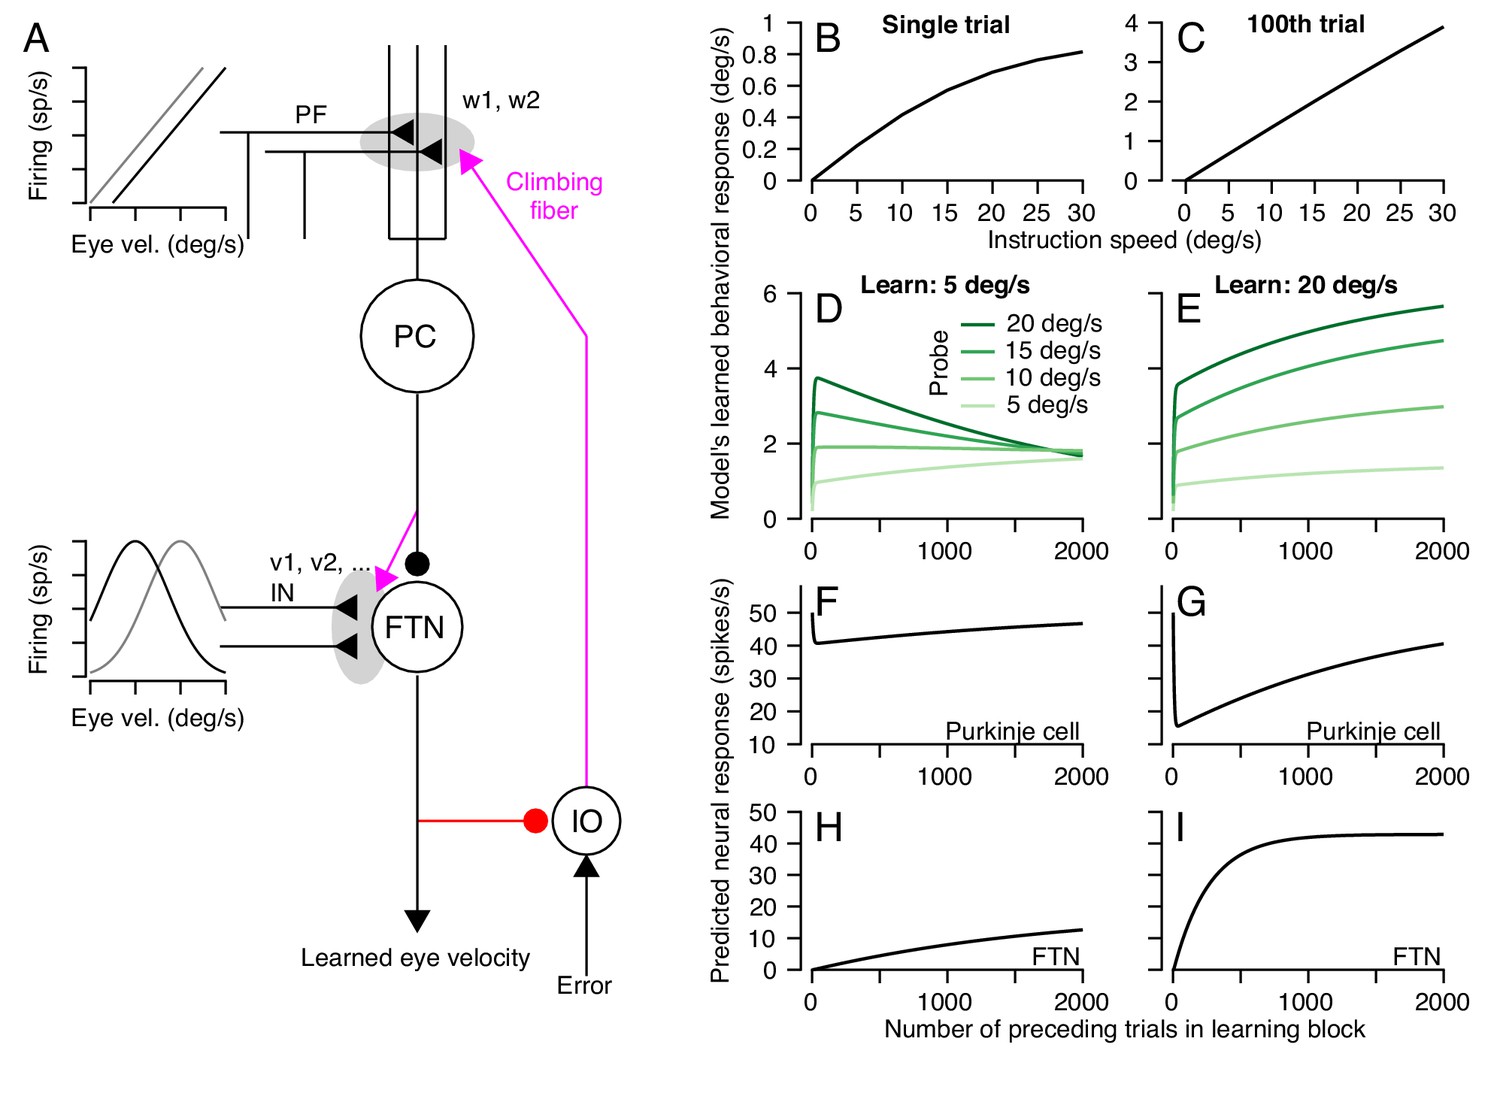
A circuit-level cerebellar learning model predicts many features of pursuit learning across timescales.
(A) The schematic shows the structure of the model, which is described in Equations 2-9 in the text. Magenta colors show pathways that transmit instructions for plasticity and the red pathway provides recurrent inhibition to the inferior olive. (B, C) Model’s prediction for the size of learning as a function of instruction speed for single-trial learning (B) and after 100 learning trials (C). (D, E) Behavioral learning trial courses predicted by the model for learning sessions with a 30 deg/s instruction magnitude and pursuit speeds in the learning triasl of 5 deg/s (D) versus 20 deg/s (E). Different shades of green show predictions for the expression of learning using different pursuit speeds in probe trials. (F, G) Predicted learned Purkinje cell simple-spike responses across a learning session with pursuit speeds in the learning trials of 5 deg/s (F) and 20 deg/s (G). (H, I) Predicted size of inputs to FTNs after weighing through plastic changes in vi, again across a learning session with pursuit speeds in the learning trials of 5 deg/s (H) and 20 deg/s (I).
-
Figure 12—source data 1
Figure composer source data showing predictions from a circuit-level model of motor learning.
- https://cdn.elifesciences.org/articles/55217/elife-55217-fig12-data1-v2.zip
Tables
Table 1
Pursuit learning model parameters.
| Model parameter | Value | Description |
|---|---|---|
| r | 1 | Parallel fiber eye velocity (deg/s) to firing rate (Hz) |
| 1 | Parallel fiber to Purkinje cell baseline weights | |
| 0.85 | Parallel fiber to Purkinje cell weight retention | |
| 1.5 | Change in parallel fiber to PC weights due to a complex spike | |
| c | 0.0625 | FTN firing rate (Hz) to eye movement (deg/s) |
| σ | 7.5 | Standard deviation of Gaussian FTN input responses |
Additional files
-
Source code 1
Jupyter notebook implementing a single-process-model of pursuit learning.
Implementation of the model shown schematically in Figure 5A, corresponding to a single-learning-process model with a single site of plasticity at the parallel fiber to Purkinje cell synapse. The source code is released under the MIT software license.
- https://cdn.elifesciences.org/articles/55217/elife-55217-code1-v2.ipynb
-
Source code 2
Jupyter notebook implementing a circuit model of cerebellar pursuit learning.
Implementation of the model shown schematically in Figure 8B, featuring two sites of learning in the cerebellar circuit. The source code is released under the MIT software license.
- https://cdn.elifesciences.org/articles/55217/elife-55217-code2-v2.ipynb
-
Transparent reporting form
- https://cdn.elifesciences.org/articles/55217/elife-55217-transrepform-v2.pdf
Download links
A two-part list of links to download the article, or parts of the article, in various formats.
Downloads (link to download the article as PDF)
Open citations (links to open the citations from this article in various online reference manager services)
Cite this article (links to download the citations from this article in formats compatible with various reference manager tools)
Principles of operation of a cerebellar learning circuit
eLife 9:e55217.
https://doi.org/10.7554/eLife.55217


