Dynamics at the serine loop underlie differential affinity of cryptochromes for CLOCK:BMAL1 to control circadian timing
- Department of Chemistry and Biochemistry, University of California Santa Cruz, United States
- Institute of Transformative Bio-Molecules, Nagoya University, Japan
- The Scripps Research Institute, United States
- Department of Pharmacology, University of Washington, United States
- Graduate School of Pharmaceutical Sciences, Kyoto University, Japan
- Howard Hughes Medical Institute, United States
- Department of Physics, Nagoya University, Japan
- RIKEN Center for Computational Science, Japan
- Center for Circadian Biology, University of California San Diego, United States
Figures
Figure 1

CRY1 and CRY2 bind similarly to the BMAL1 transactivation domain.
(A) Crystal structure of the CRY1 PHR domain (PDB: 5T5X) highlighting the CC helix (BMAL1/2 TAD binding interface (blue)) and the secondary pocket (CLOCK PAS-B binding interface (green)). This is the standard orientation of the CRY1 and CRY2 PHR domain used as a reference for all other views. (B) Domain schematic of core clock proteins. bHLH, basic helix-loop-helix; PAS, PER-ARNT-SIM domain, TAD, transactivation domain; PHR, photolyase homology region; CKBD, Casein Kinase Binding Domain; CBD, CRY-binding domain. (C) Fluorescence polarization (FP) assay of 5,6-TAMRA-labeled BMAL1 minimal TAD (residues 594–626) binding to CRY1 PHR (gray), replotted from Gustafson et al. (2017), and CRY2 PHR (blue). Mean ± SD data shown from one representative assay of n = 3 independent assays. Binding constants (mean ± SD) derived from n = 3 assays. (D) Crystal structures of CRY1 PHR:PER2 CBD (PDB: 4CT0) and CRY2 PHR:PER2 CBD (PDB: 4U8H) with the PER2 CBD (orange), CRY1 PHR (gray) and CRY2 PHR (blue), in the standard view and 90° rotated to show the BMAL1 TAD binding interface (blue). (E) FP assay of 5,6-TAMRA-labeled BMAL1 TAD binding to preformed CRY1 PHR:PER2 CBD (gray), CRY2 PHR:PER2 CBD (blue) or PER2 CBD (orange). Mean ± SD data shown from one representative assay of n = 3 independent assays. Binding constants shown (mean ± SD) were derived from n = 3 assays. n.d., not determined.
Figure 2 with 1 supplement
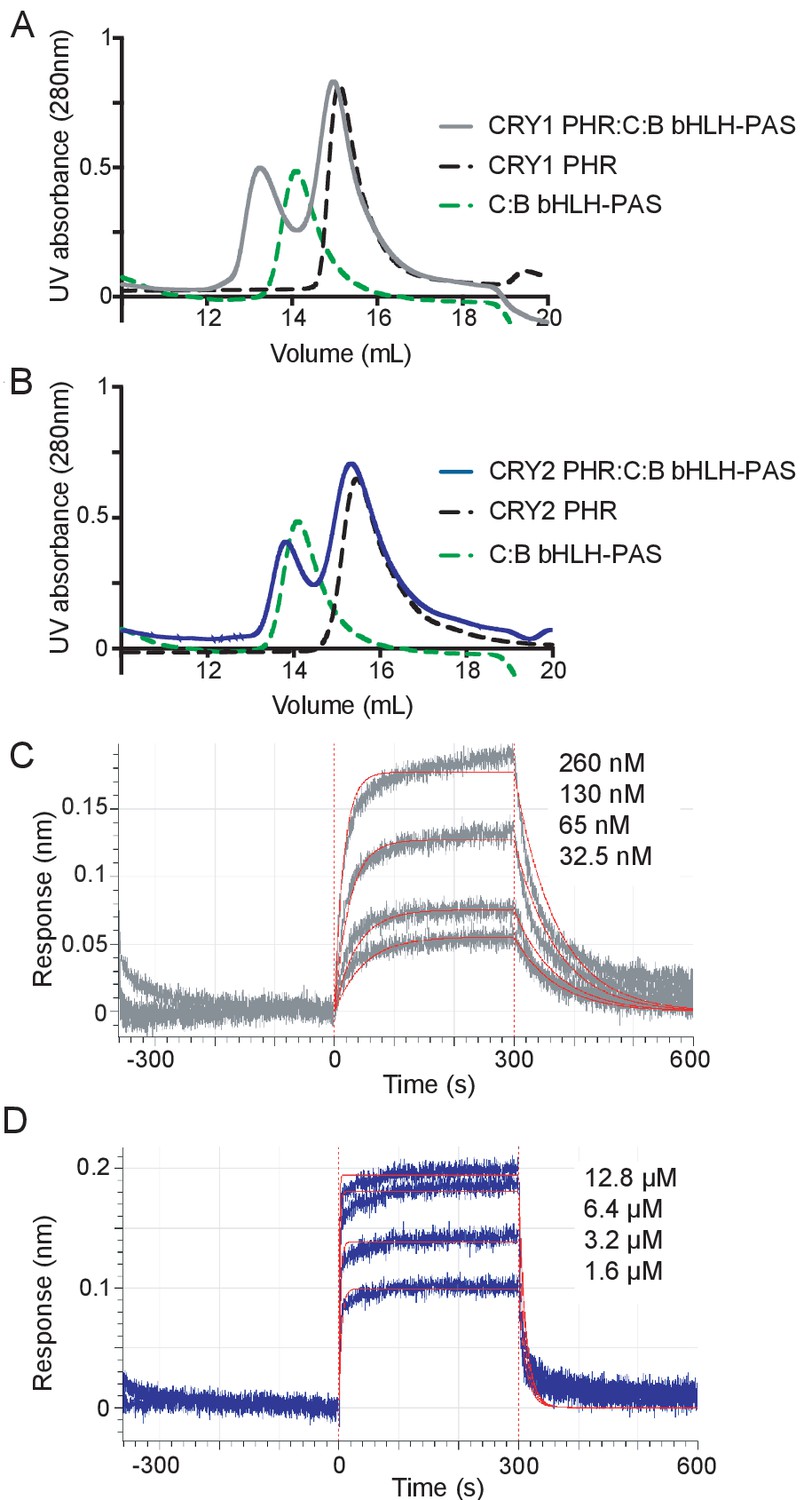
CRY1 binds more tightly to PAS domain core of CLOCK:BMAL1 than CRY2.
(A) Gel filtration analysis of complex formation of CRY1 PHR domain mixed with the CLOCK:BMAL1 (C:B) bHLH-PAS heterodimer. CRY1 PHR domain (black), C:B bHLH-PAS (green), or CRY1 PHR domain incubated with C:B bHLH-PAS (gray) were run on a Superdex 200 10/300 GL column. B, Gel filtration analysis of complex formation of CRY2 PHR domain mixed with the CLOCK:BMAL1 (C:B) bHLH-PAS heterodimer. CRY2 PHR domain (black), C:B bHLH-PAS (green), or CRY2 PHR domain incubated with C:B bHLH-PAS (blue) were run on a Superdex 200 10/300 GL column. C-D, BLI data for CRY1 PHR domain (gray, (C) or CRY2 PHR domain (blue, (D) binding to immobilized, biotinylated CLOCK:BMAL1 PAS-AB. Inset values represent the concentrations of CRY for individual binding reactions, top to bottom. Vertical red dashed lines indicate the beginning of association and dissociation. The red solid line is the nonlinear least squares fitting. CRY1 PHR domain Kd = 65 ± 6 nM; CRY2 PHR domain Kd = 1.2 ± 0.2 µM (mean of two independent experiments). Data shown from one representative experiment of n = 2 assays. See Figure 2—figure supplement 1 for additional information related to this figure.
Figure 2—figure supplement 1
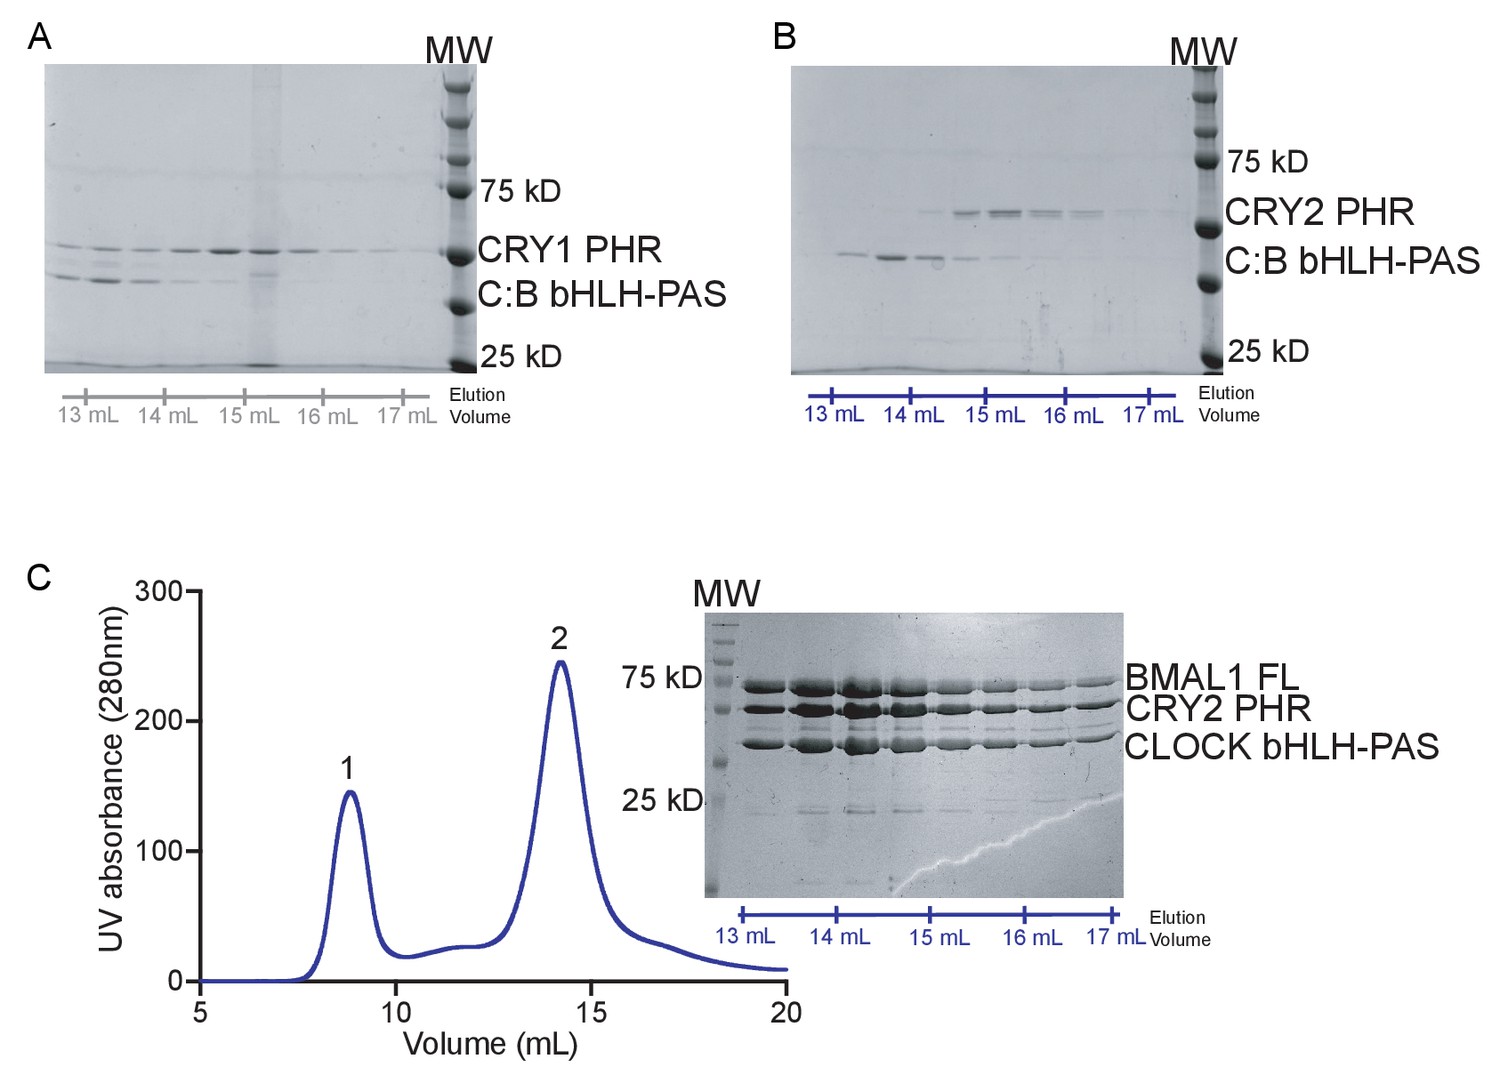
Gel filtration analysis of CRY1, CRY2 and CLOCK:BMAL bHLH-PAS proteins.
(A) SDS-PAGE analysis of the peak fractions from the CRY1 PHR incubated with C:B bHLH-PAS (gray) injection on the S200 10/300 GL column (Figure 2A). Elution volume (mL) is marked below the gel. (B) SDS-PAGE analysis of the peak fractions from the CRY2 PHR incubated with C:B bHLH-PAS (blue) injection on the S200 10/300 GL column (Figure 2B). Elution volume (mL) is marked below the gel. (C) Chromatographic analysis of complex formation by CRY2 PHR and a heterodimer of CLOCK bHLH-PAS with full-length BMAL1, as above. The addition of the BMAL1 C-terminus resulted in co-elution of CLOCK:BMAL1 with CRY2 PHR in peak 2 (peak 1 contains aggregated protein eluting in the void volume).
Figure 3 with 3 supplements

Flexibility of the serine loop controls size of the secondary pocket and CLOCK:BMAL1 binding in CRYs.
(A) Structural alignment of CRY1 PHR domain (PDB: 5T5X) and CRY2 PHR domain (PDB: 4I6E). The serine loops are highlighted in yellow and boxed. (B) Root mean square fluctuation (RMSF) values obtained from MD simulations for Cɑ atoms of each residue in CRY1 PHR domain (gray) or CRY2 PHR domain (blue) from n = 3 independent runs. The mean RMSF is depicted in dark shades with the variation between minimum and maximum values in light shades. Secondary structure is depicted at the top of the plot (ɑ-helix, gray; β-strand, black) and residues in the serine loop and p-loop are shaded yellow and green, respectively. (C) Crystal structure of CRY2 PHR domain (PDB: 4I6E) highlighting two residues that vary from CRY1 on the serine loop adjacent to the secondary pocket. (D) RMSF values for the wild-type CRY2 PHR domain (dark blue) or mutCRY2 (S64N/A61G, light blue), as above. (E) Volume of the secondary pocket (yellow cartoon and surface representation) and residues used for distance measurements of the secondary pocket opening in CRY2 (S62 and F123, depicted) or CRY1 (S44 and F105, by conservation). Black line indicates distance measured. (F) Scatter plot of secondary pocket volume (Å3) versus opening distance between CRY2 S62 and F123 (or S44 and F105 in CRY1). (G) Surface representation of the CRY2 PHR domain crystal structure (PDB: 4I6E) with the two mutations highlighted in yellow on the serine loop. (H) BLI data for CRY2 2M PHR domain (blue) binding to immobilized, biotinylated CLOCK:BMAL1 PAS-AB. Inset values represent the concentrations of CRY for individual binding reactions, top to bottom. Vertical red dashed lines indicate the beginning of association and dissociation. Red solid line, nonlinear least squares fitting to a one-site binding model. Calculated Kd for CRY2 2M PHR domain = 343.8 ± 26.9 nM (mean ± SD from n = 2 independent assays). See Figure 3—figure supplements 1–3 and Supplementary file 1 for additional information related to this figure.
Figure 3—figure supplement 1
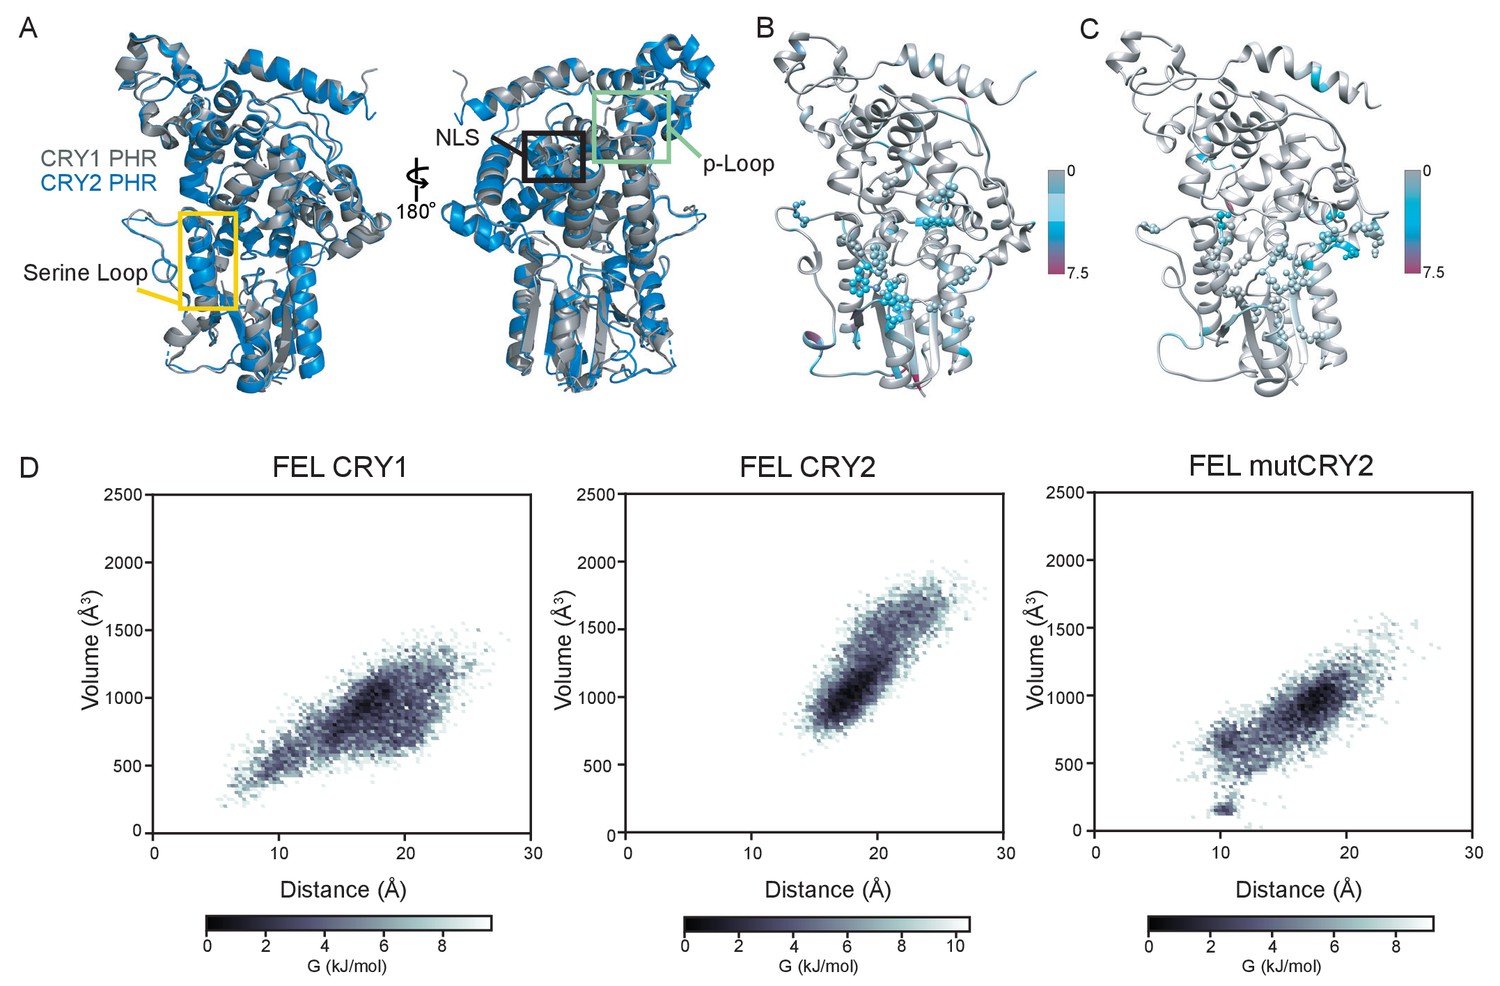
Kullback-Leibler divergence and Free Energy Landscape of CRY PHR domains.
(A) Structural alignment of CRY1 PHR (PDB: 5T5X) and CRY2 PHR (PDB: 4I6E). The standard view of CRY with the serine loops highlighted in yellow and boxed (left) and a 180° rotation of the alignment showing the other highly variable regions boxed (right). (B) KL divergence between CRY1 and CRY2 ensembles. The residues are colored as per the KL divergence. The color bar shows values of the KL divergence corresponding to different colors. (C) KL divergence between CRY2 and mutCRY2 ensembles. Residues showing high KL divergence near the secondary pocket are displayed in ball and stick representation. (D) Free energy landscape (FEL) corresponding to the volume and distance at the entrance of secondary pocket for CRY1 (left), CRY2 (middle) and mutCRY2 (right). The colors represent relative energies with minimum being the most populated region of the landscape. See Supplementary file 1 for more information.
Figure 3—figure supplement 2
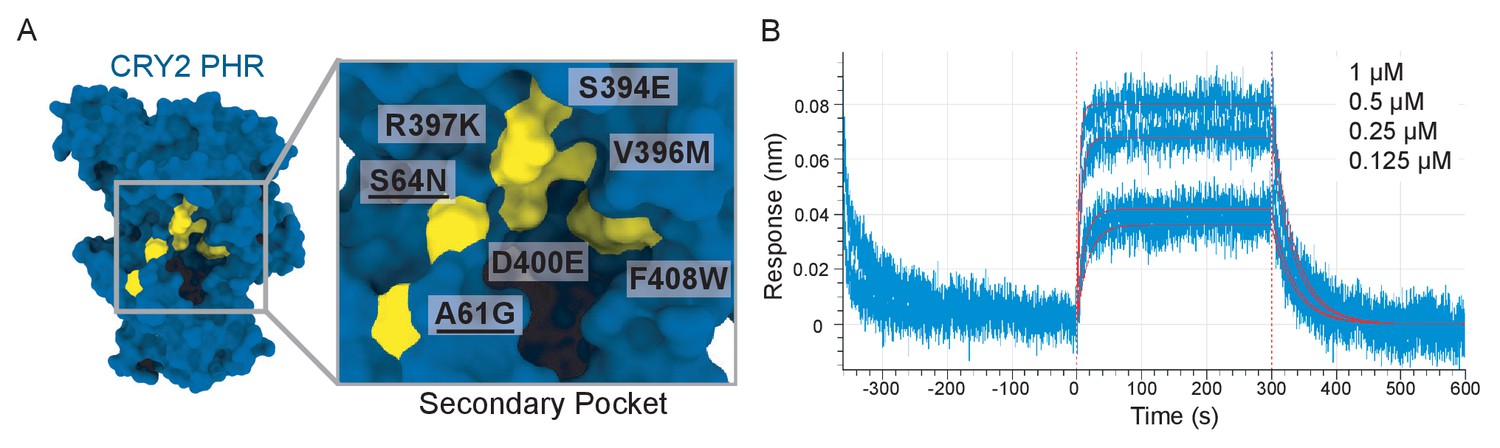
The CRY2 7M mutant increases affinity for the PAS domain core of CLOCK:BMAL1.
(A) Crystal structure of CRY2 PHR with the seven mutations (7M) identified in Rosensweig et al. (2018). (B) BLI data for CRY2 7M (blue) binding to immobilized, biotinylated CLOCK:BMAL1 PAS-AB. Inset values represent the concentrations of CRY for individual binding reactions, top to bottom. Vertical red dashed lines indicate the beginning of association and dissociation. Red solid line, nonlinear least squares fitting to a one-site binding model. Calculated Kd for CRY2 7M PHR = 130 ± 12 nM (mean from n = 2 independent assays).
Figure 3—figure supplement 3
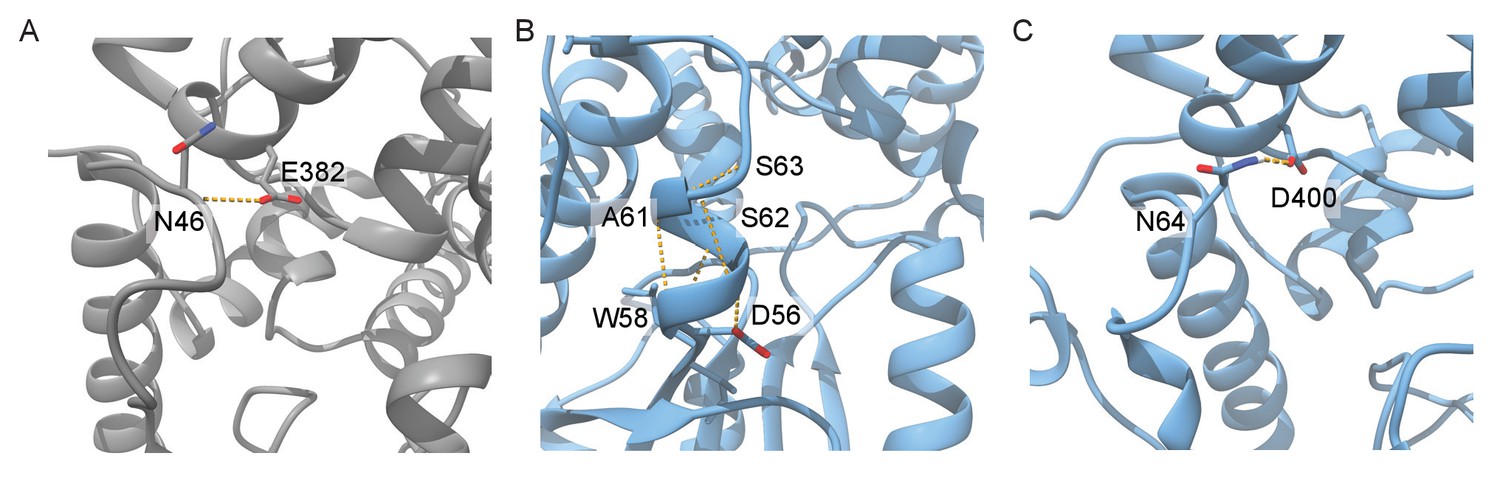
Analysis of hydrogen bonds in CRY PHR domain serine loops.
(A) Hydrogen bond (shown in orange) between N46 and E382 seen in the CRY1 simulation with high frequency. (B) Multiple intra-loop hydrogen bonds in a representative frame from CRY2 simulations. (C) Hydrogen bond formed between mutated N64 and D400 in one the representative frames from mutated CRY2 simulations. See Supplementary file 1 for more information.
Figure 4 with 3 supplements
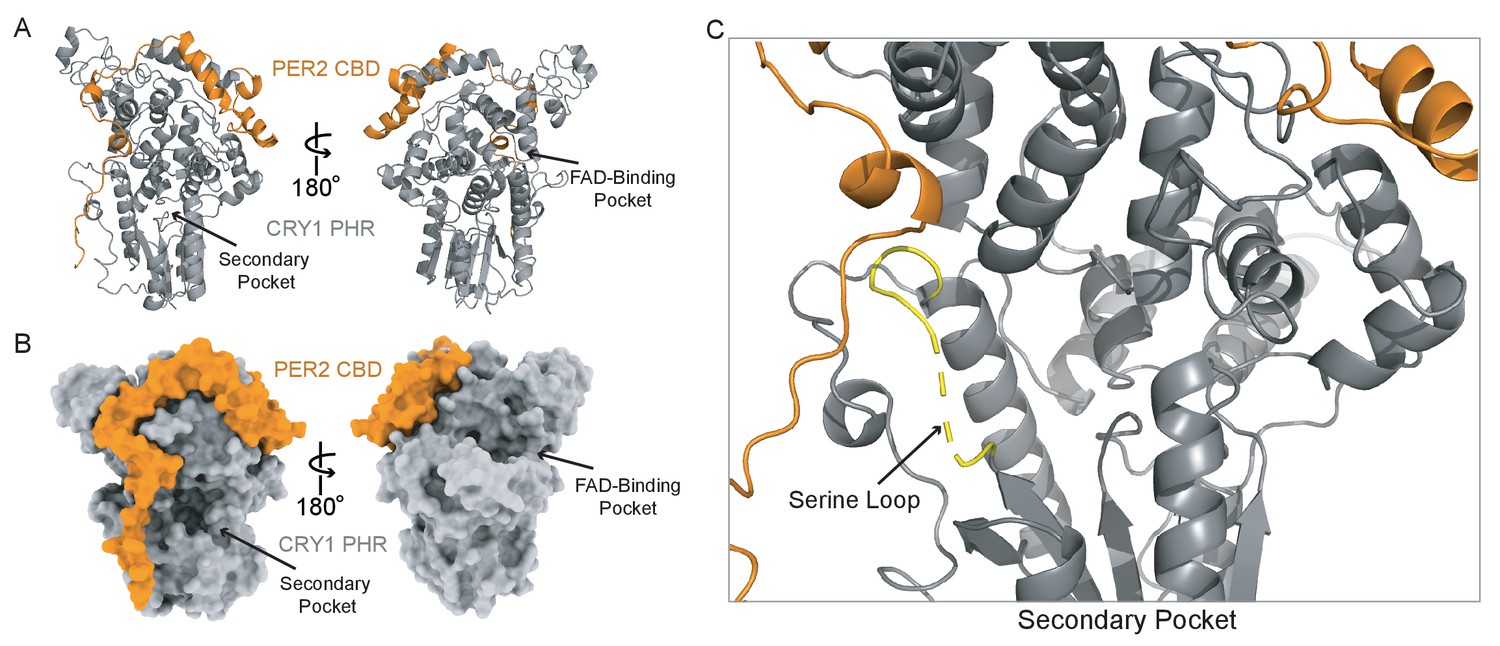
A new CRY1 PHR:PER2 CBD crystal structure.
(A-B) Crystal structure of the CRY1 PHR:PER2 CBD complex (PDB: 6OF7) with CRY1 PHR domain (gray) and PER2 CBD (orange). Ribbon and surface representations on the left highlight the secondary pocket, while the FAD binding pocket is shown on the right. (B) Zoomed in view of the secondary pocket showing the partially ordered serine loop (yellow). See Figure 4—figure supplements 1–3 and Supplementary file 2 for additional information related to this figure.
Figure 4—figure supplement 1

Additional views of the new CRY1 PHR:PER2 CBD crystal structure.
(A) Left, zoomed in view of the secondary pocket (CLOCK PAS-B binding site) of our crystal structure (PDB: 6OF7) showing the partially ordered serine loop (yellow). Right, same view of the secondary pocket from the previously published CRY1 PHR:PER2 CBD crystal structure (PDB: 4CT0) (Schmalen et al., 2014) with the serine loop (yellow) that is ordered by contact with the vector artifact (cyan). (B) Crystal structure of CRY1 PHR:PER2 CBD. CRY1 PHR is shown in gray and PER2 CBD is shown in orange. The standard view is shown in ribbon representation (left) and a 90° rotation along the horizontal axis to display the CC helix, where the TAD of BMAL1 binds, is shown in ribbon (middle) and surface (right). (C) Zoomed in view of the CC helix. (D) Zoomed in view of the CC helix of the previously solved crystal structure of CRY1 PHR:PER2 CBD (4TC0). CRY1 PHR is shown in gray and PER2 CBD is shown in orange. The far C-terminus of the CBD of PER is coordinating a zinc ion (green) with CRY1 PHR. The zinc ion and subsequent coordinating residues are missing from the new structure. See Supplementary file 2 for more information.
Figure 4—figure supplement 2
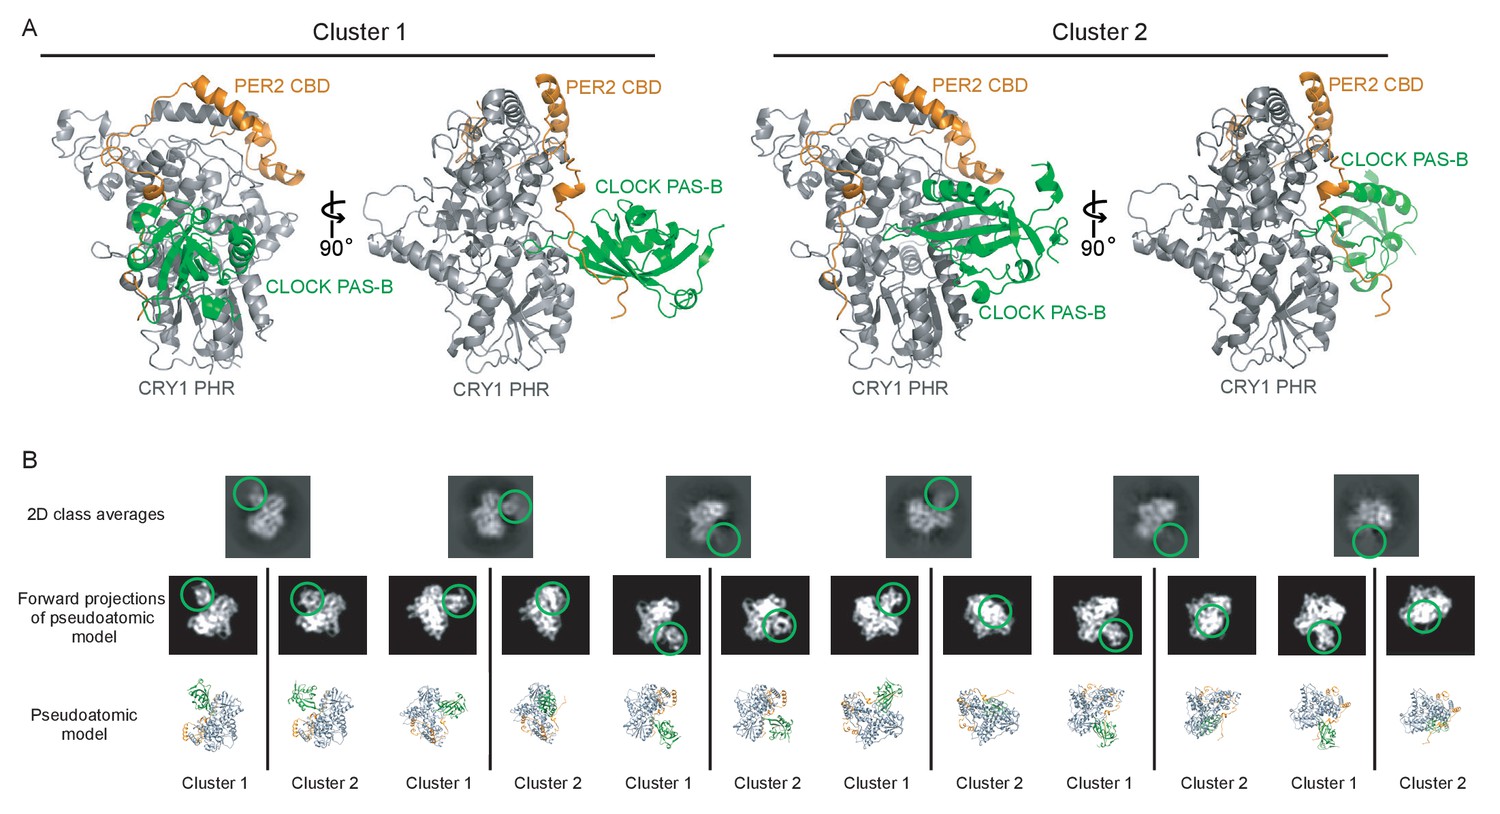
Representative HADDOCK models of the PER2 CBD:CRY1 PHR:CLOCK PAS-B complex and comparison to 2D class averages from cryo-EM data.
(A) Representative structures of the top two HADDOCK clusters. Standard views of Cluster 1 (left) and the complex rotated 90° and Cluster 2 (right) are depicted. (B) Comparison between 2D class averages (top row) from the cryo-EM data and the two pseudoatomic models of CRY PHR:PER2 CBD bound to CLOCK PAS-B generated from HADDOCK (Cluster 1 and Cluster 2). Forward projections (middle row) of the pseudoatomic models (bottom row) were generated to match the angular orientations observed in the experimental data. The general position of the CLOCK PAS-B domain is denoted with a green circle for both 2D class averages and forward projections of the pseudoatomic models. CLOCK PAS-B appears to adopt a range of orientations, leading it to become blurred in some 2D class averages. See Supplementary file 2 for more information.
Figure 4—figure supplement 3

CRY PHR binding to PAS domain core with CLOCK W362A mutation.
BLI data for CRY1 PHR (gray) or CRY2 PHR (blue) binding to immobilized, biotinylated W362A CLOCK:BMAL1 PAS-AB. Inset values represent the concentrations of CRY for individual binding reactions, top to bottom. Vertical red dashed lines indicate the beginning of association and dissociation. Red solid line, nonlinear least squares fitting to a one-site binding model. Calculated Kd for CRY1 PHR = 6.6 ± 2.6 μM, CRY2 PHR = 10.2 ± 0.2 μM (mean from n = 2 independent assays).
Figure 5 with 3 supplements
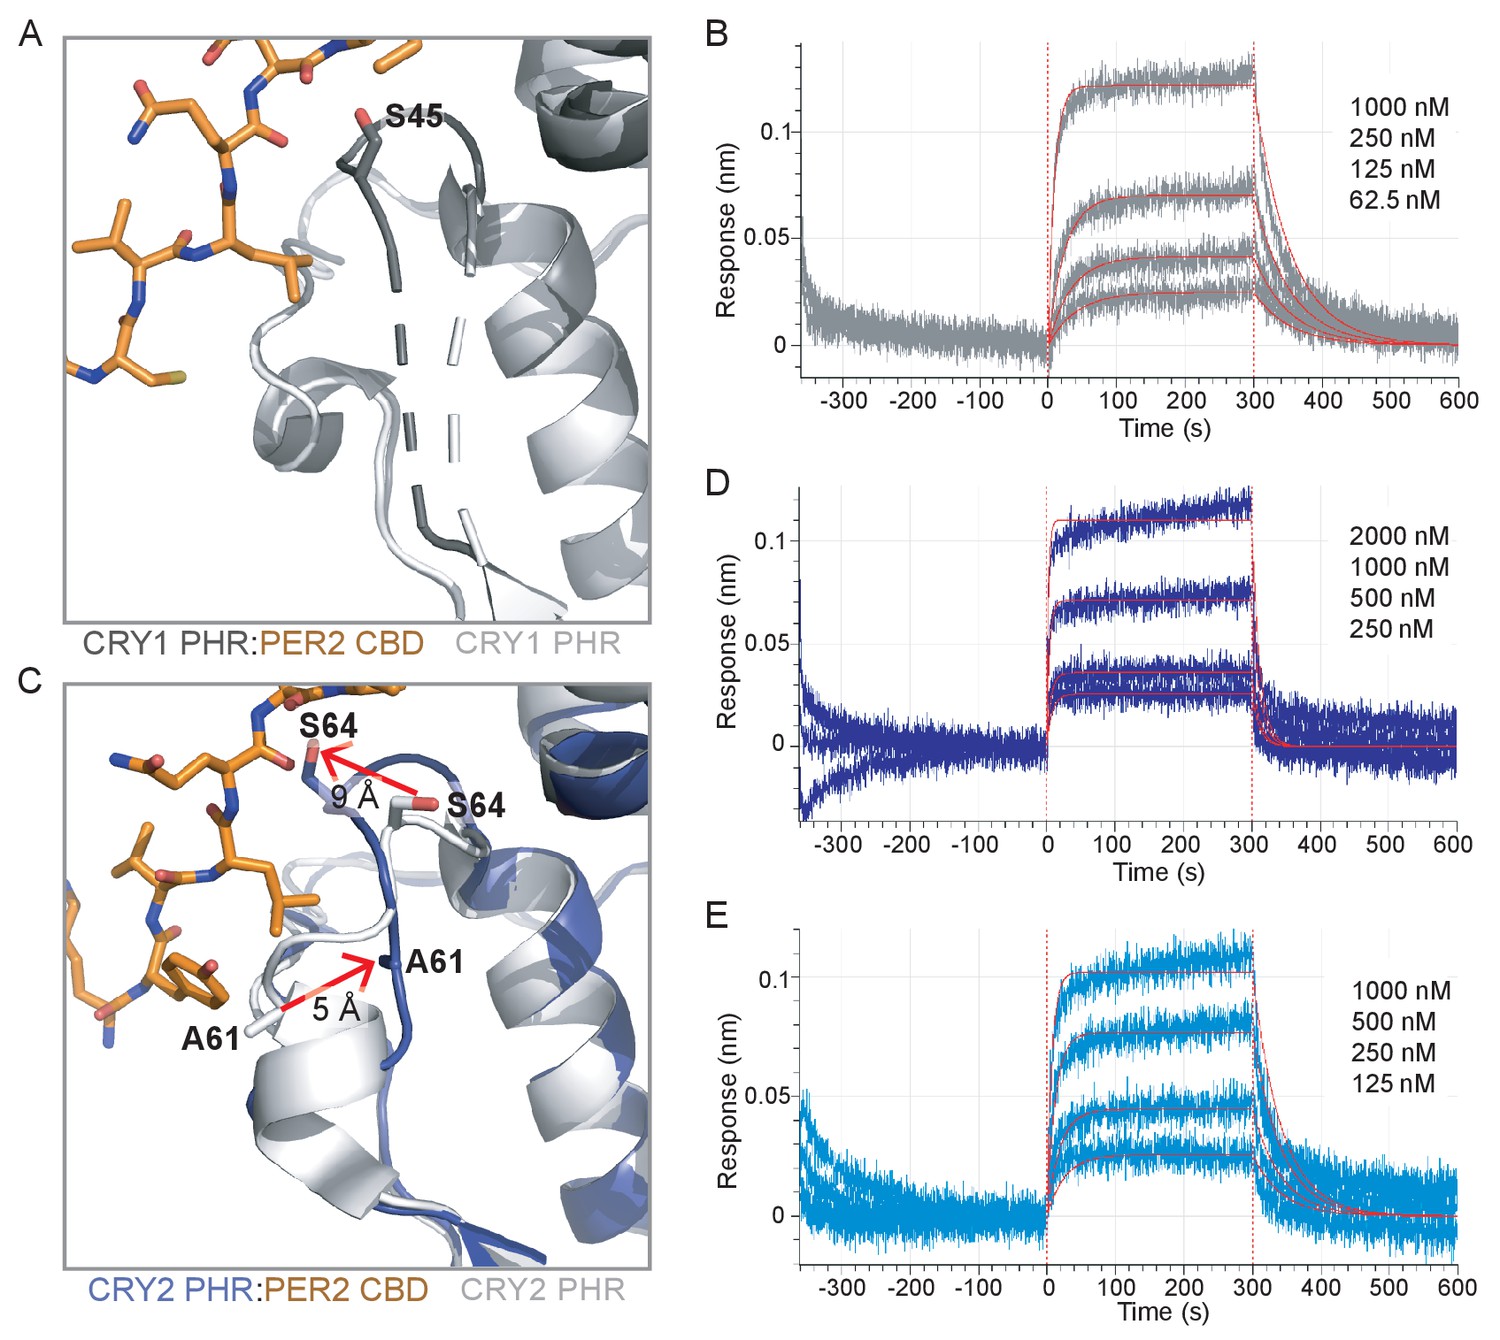
The PER2 CBD alters the CRY serine loops to modulate their affinity for the CLOCK:BMAL1 PAS core.
(A) Comparison of the serine loop from apo CRY1 PHR domain (light gray, PDB: 5T5X) and the CRY1 PHR:PER2 CBD complex (dark gray:orange, PDB: 6OF7). A slight structuring of the C-terminus of the serine loop occurs upon addition of PER2 CBD, while the N-terminus remains flexible (dashed line). (B) BLI data for the CRY1 PHR:PER2 CBD complex (gray) binding to immobilized, biotinylated CLOCK:BMAL1 PAS-AB. Inset values represent the concentrations of CRY for individual binding reactions, top to bottom. Vertical red dashed lines indicate the beginning of association and dissociation. Red solid line, nonlinear least squares fitting to a one-site binding model. Calculated Kd for CRY1 PHR:PER2 CBD = 196 ± 34 nM (mean ± SD from n = 2 independent assays). (C) Comparison of the serine loop from the apo CRY2 PHR domain (light gray, PDB: 4I6E) and the CRY2 PHR:PER2 CBD complex (blue:orange, PDB: 4U8H). (D) BLI data for the CRY2 PHR:PER2 CBD complex (dark blue) binding to immobilized, biotinylated CLOCK:BMAL1 PAS-AB domains. Calculated Kd for CRY2 PHR:PER2 CBD = 604 ± 29 nM (mean ± SD from n = 2 independent assays). (E) BLI data for the CRY2 7M PHR:PER2 CBD complex (light blue) binding to immobilized, biotinylated CLOCK:BMAL1 PAS-AB. Calculated Kd for CRY2 7M PHR:PER2 CBD = 159 ± 66 nM (mean ± SD from n = 2 independent assays). See Figure 5—figure supplements 1–3 for additional information related to this figure.
Figure 5—figure supplement 1
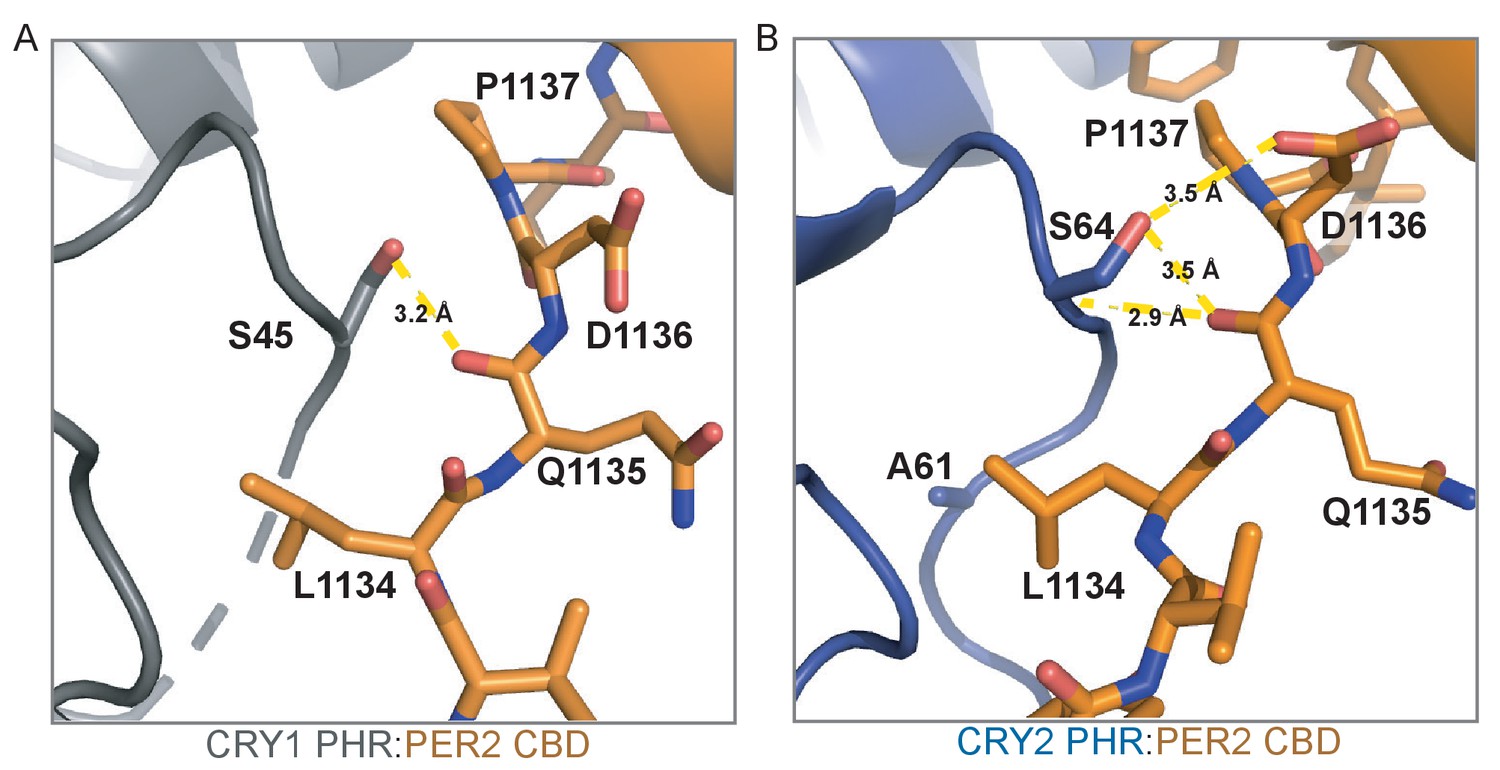
Binding to PER2 CBD rearranges the serine loops on CRY1 and CRY2.
(A) Zoomed in view of the serine loop of CRY1 PHR:PER2 CBD (gray:orange). Interaction between Ser45 of CRY1 and the backbone of Gln1135 of PER2 CBD shown with yellow dashed lines. (B) Zoomed in view of the serine loop of CRY2 PHR:PER2 CBD (blue:orange). Interaction between Ser64 of CRY2 and the backbone of Gln1135 and the side chain of Asp1136 of PER2 CBD shown with yellow dashed lines.
Figure 5—figure supplement 2
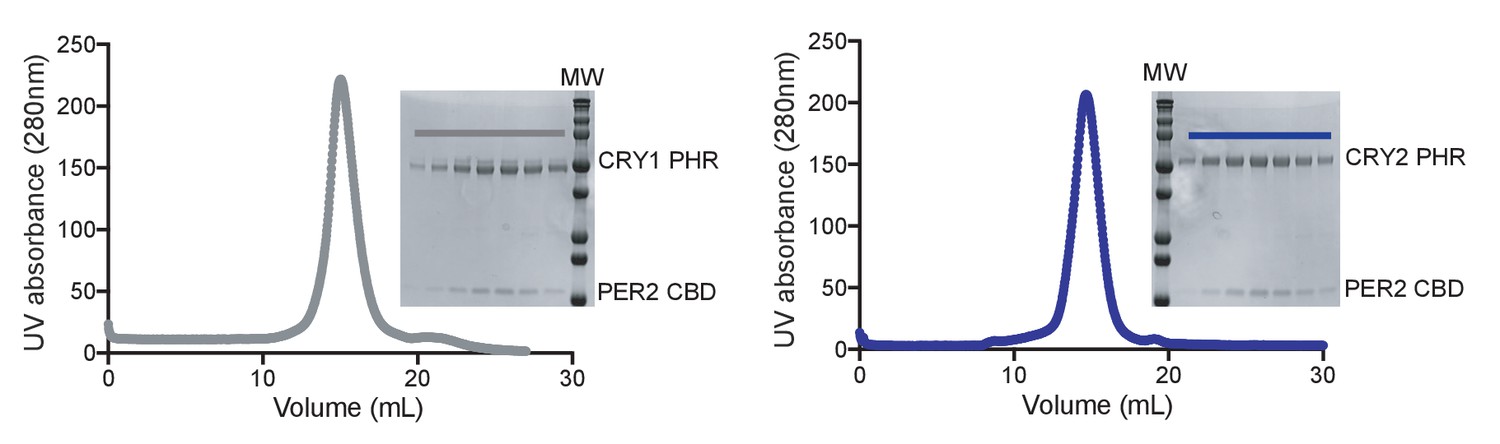
Formation of stable CRY PHR domain:PER2 CBD complexes for binding studies.
Gel filtration analysis of CRY1 PHR:PER2 CBD (left, gray) and CRY2 PHR:PER2 CBD (right, blue). Complexes were preassembled on ice and then resolved on a S200 10/300 GL column. Peak fractions were analyzed by SDS-PAGE.
Figure 5—figure supplement 3

The PER2 CBD does not bind directly to the PAS domain core of CLOCK:BMAL1.
Processed bio-layer interferometry (BLI) data for PER2 CBD (orange) binding to biotin labeled CLOCK:BMAL PAS-AB. Inset values represent the concentrations of CRY for the individual binding reactions, top to bottom. The red line is the nonlinear least squares fitting. PER2 CBD does not bind to CLOCK:BMAL1 PAS-AB at the concentrations tested.
Additional files
-
Supplementary file 1
Details of molecular dynamics simulations.
This supplementary file contains two tables (1a, 1b) on separate tabs.
- https://cdn.elifesciences.org/articles/55275/elife-55275-supp1-v2.xlsx
-
Supplementary file 2
Details of the experimental structure and computational docking models.
This supplementary file contains two tables (2a, 2b) on separate tabs.
- https://cdn.elifesciences.org/articles/55275/elife-55275-supp2-v2.xlsx
-
Transparent reporting form
- https://cdn.elifesciences.org/articles/55275/elife-55275-transrepform-v2.docx
Download links
A two-part list of links to download the article, or parts of the article, in various formats.
Downloads (link to download the article as PDF)
Open citations (links to open the citations from this article in various online reference manager services)
Cite this article (links to download the citations from this article in formats compatible with various reference manager tools)
Dynamics at the serine loop underlie differential affinity of cryptochromes for CLOCK:BMAL1 to control circadian timing
eLife 9:e55275.
https://doi.org/10.7554/eLife.55275


