Different neuronal populations mediate inflammatory pain analgesia by exogenous and endogenous opioids
- Institute of Neuroscience, State Key Laboratory of Neuroscience, CAS Center for Excellence in Brain Science & Intelligence Technology, Chinese Academy of Sciences, China
- University of Chinese Academy of Sciences, China
- Shanghai Center for Brain Science and Brain-Inspired Intelligence Technology, China
Figures
Figure 1 with 1 supplement
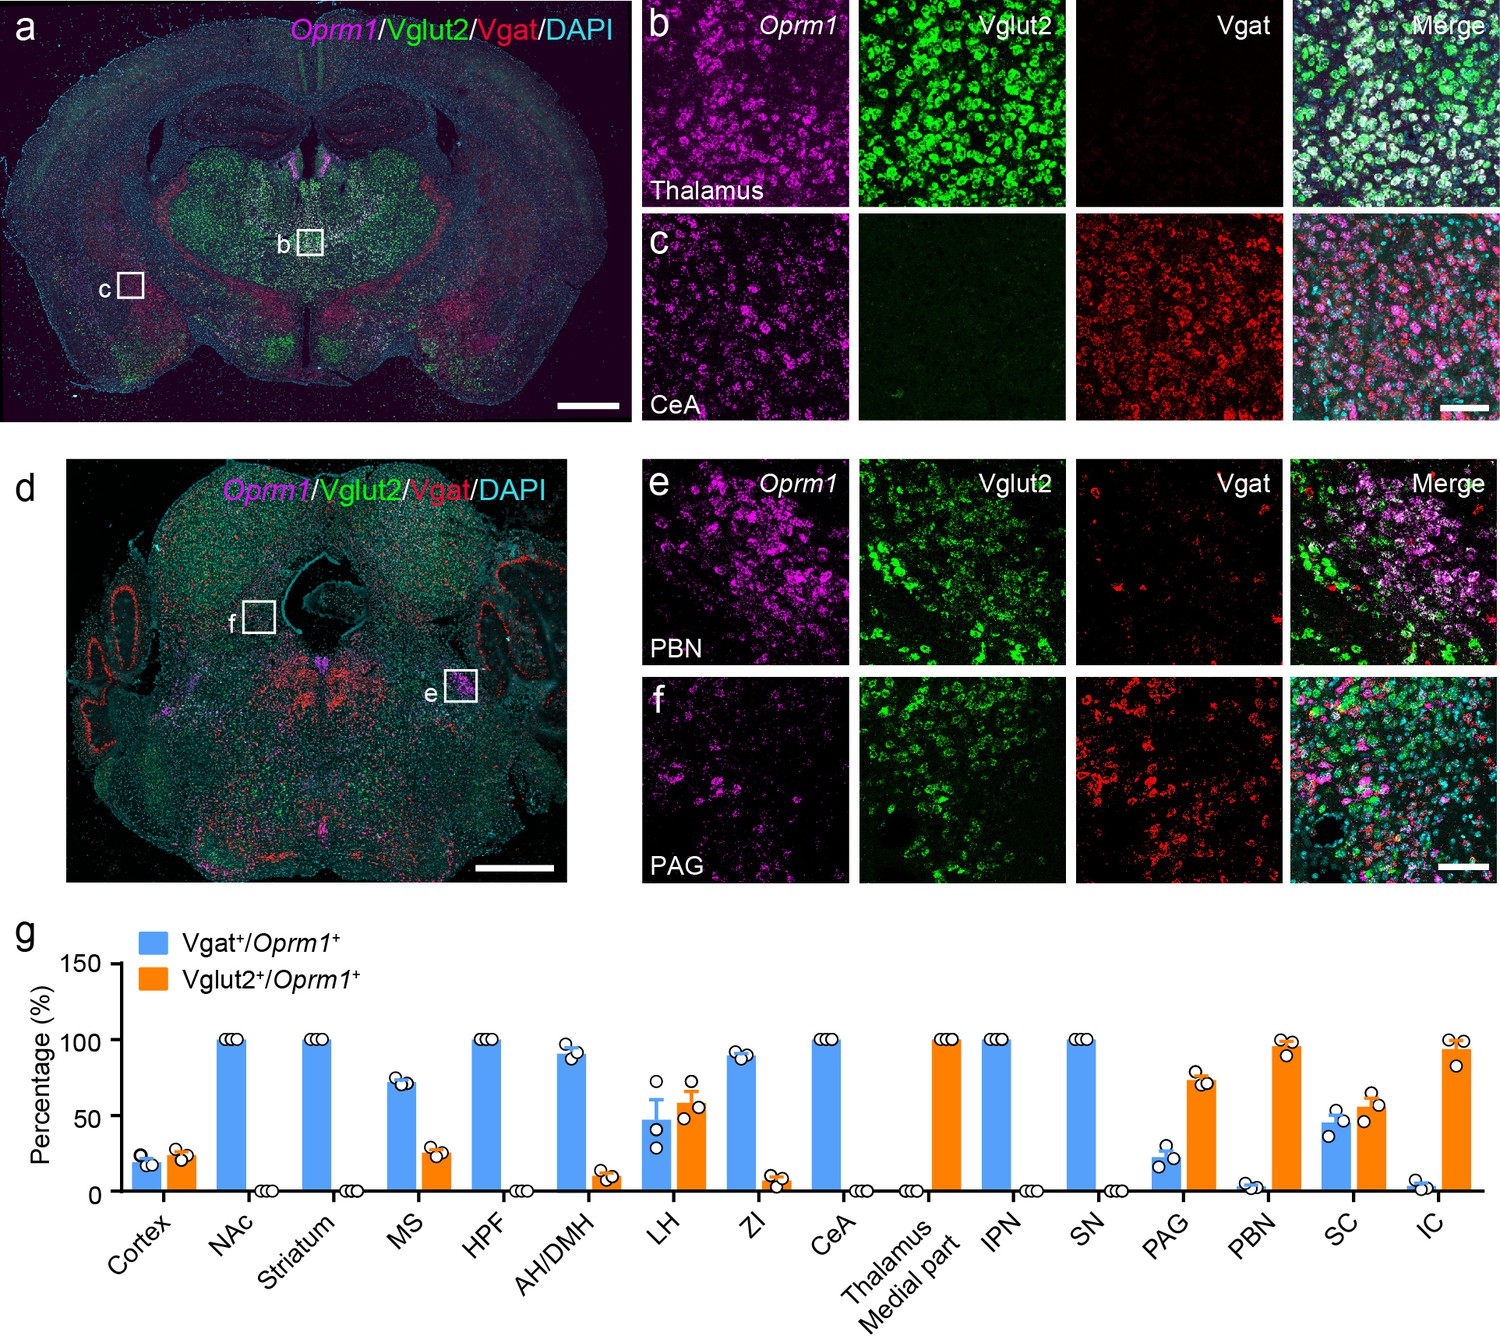
Distribution of Oprm1 in Vglut2+ and Vgat+ neurons in the mouse brain.
(a–f) Multiple in situ hybridization in wild-type mice shows the distribution of Oprm1 in glutamatergic and GABAergic neurons using RNAscope assay. Scale bars, 1 mm (a and d), 100 μm (b), (c), (e), and (f). (g) Percentage of glutamatergic and GABAergic neurons in MOR expressing neurons in representative brain regions (n = 3 mice). NAc, nucleus accumbens; MS, medial septal nucleus; HPF, hippocampal formation; AH/DMH, anterior hypothalamic area/dorsomedial hypothalamic nucleus; LH, lateral hypothalamic area; ZI, zona incerta; CeA, central amygdala; IPN, interpeduncular nucleus; SN, substantia nigra; PAG, periaqueductal gray; PBN, parabrachial nucleus; SC, superior colliculus; IC, inferior colliculus. Data are presented as mean ± SEM.
-
Figure 1—source data 1
Percentage of glutamatergic and GABAergic neurons in MOR expressing neurons in representative brain regions.
- https://cdn.elifesciences.org/articles/55289/elife-55289-fig1-data1-v2.xlsx
Figure 1—figure supplement 1
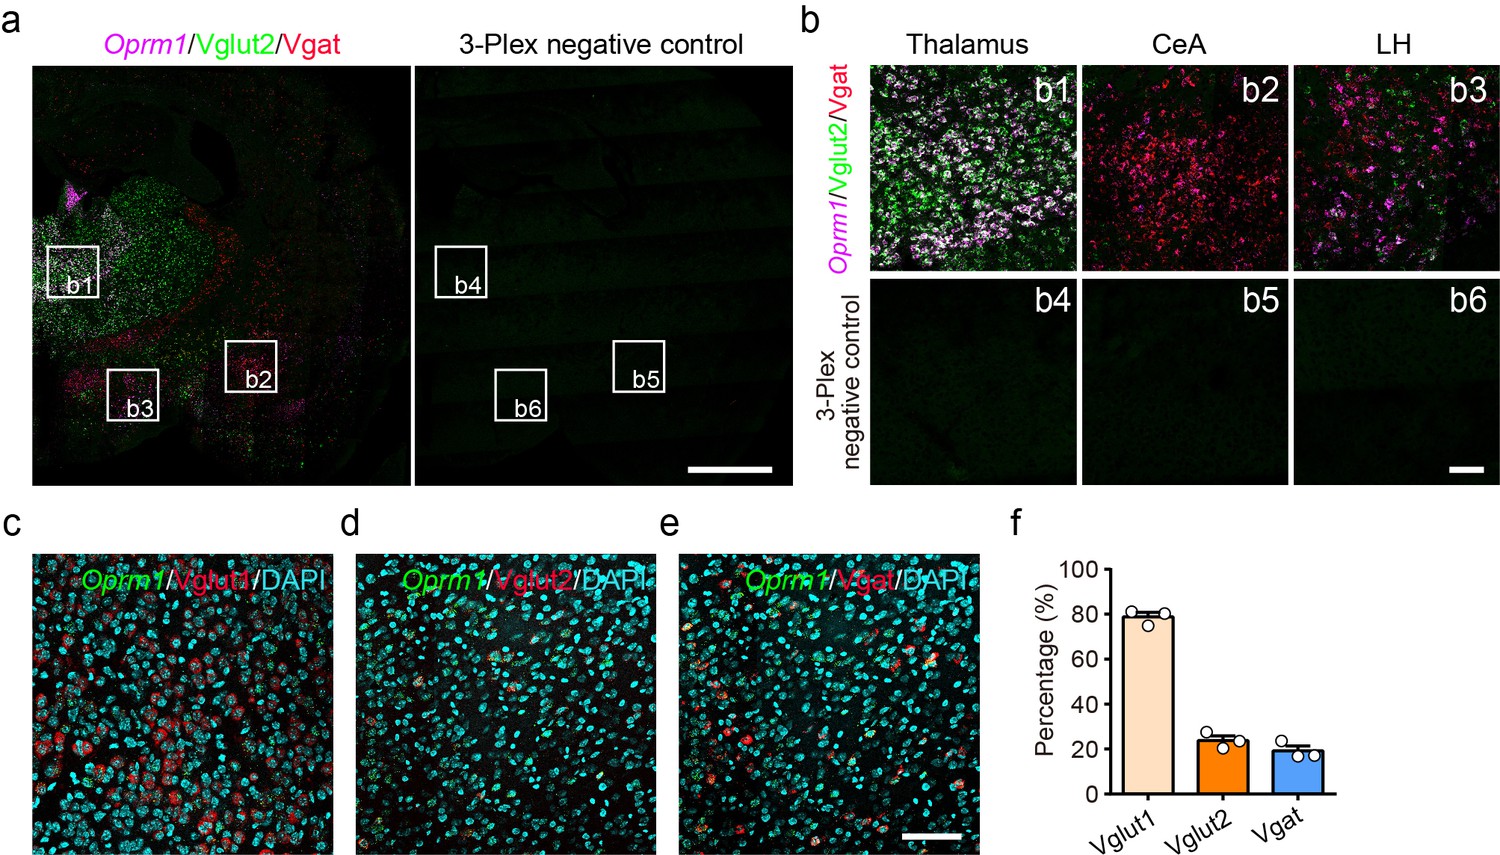
Multiple in situ hybridization in wild-type mice.
(a) Multiple in situ hybridization in wild-type mice showing the distribution of Oprm1, Vglut2 and Vgat by using RNAscope assay. Scale bar, 1 mm. (b) Enlarged images of the frames in (a). Scale bar, 100 μm. (c–e) Multiple in situ hybridization shows the distribution of Oprm1 in Vglut2+ and Vglut1+ excitatory and Vgat+ inhibitory neurons in the cortex of an example wild-type mouse using RNAscope assay. Scale bar, 100 μm. (f) Percentage of Vglut2+/Vglut1+/Vgat+ neurons in Oprm1+ cortical neurons. n = 3 mice. Data are presented as mean ± SEM.
Figure 2 with 1 supplement
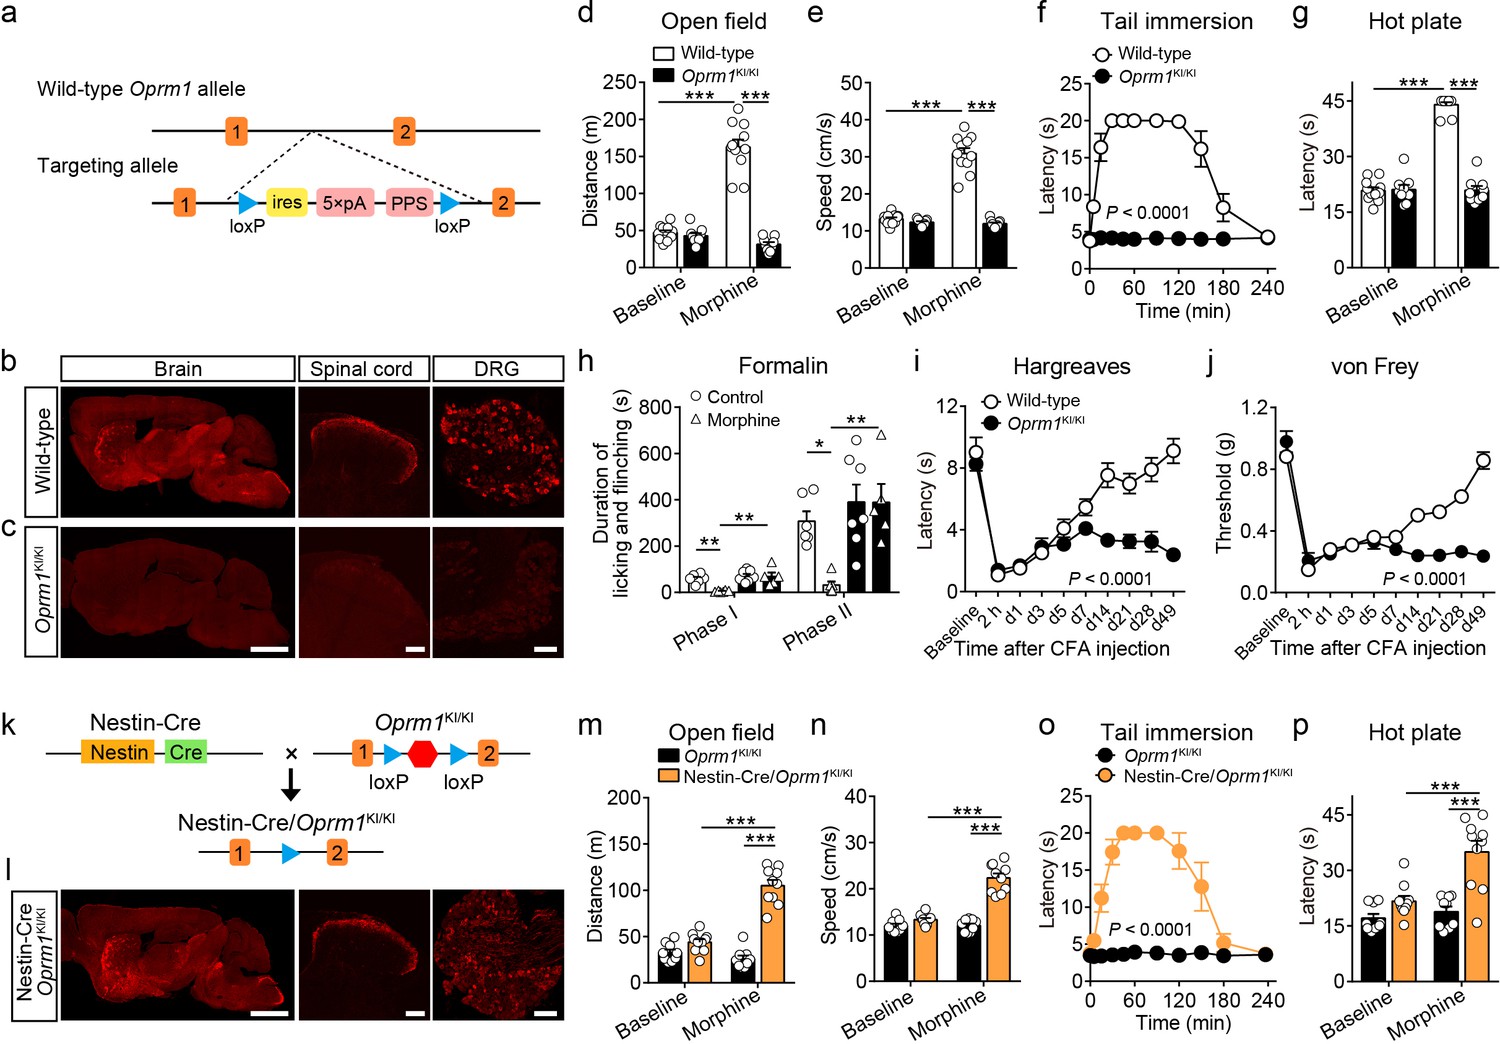
Generation and verification of the Oprm1KI/KI mouse line.
(a) Targeting strategy for generating the Oprm1KI/KI mouse line through inserting a stop cassette flanked by two loxP sites between Oprm1 exon 1 and exon 2. PPS, RNA polymerase pause site. (b and c) MOR expression in brain, spinal cord and DRG sections of wild-type and Oprm1KI/KI mice. Scale bars, 2 mm (left), 100 μm (middle and right). (d and e) Effects of morphine (10 mg/kg, subcutaneous, s.c.) on locomotor activity in open field test for Oprm1KI/KI mice (n = 9) compared with wild-type (n = 11) littermates. Two-way ANOVA (d), F1,36 = 102.1, p<0.0001; (e), F1,36 = 107.3, p<0.0001 with Bonferroni correction. (f and g) Effects of morphine (10 mg/kg, s.c.) on thermal pain tested with tail immersion (50°C) and hot plate (52°C) tests in Oprm1KI/KI mice compared with wild-type littermates. n = 7–11 mice. Two-way ANOVA (f), F10,132 = 36.01, p<0.0001; (g), F1,36 = 145.0, p<0.0001 with Bonferroni correction. (h) Summary of the formalin-induced behavioral responses in phase I (0–10 min) and phase II (10–60 min) in Oprm1KI/KI mice and wild-type littermates treated with saline or morphine (10 mg/kg, intraperitoneal, i.p.). n = 5–7 mice. One-way ANOVA (Phase I, F3,20 = 10.10, p=0.0003; Phase II, F3,20 = 8.085, p=0.0010) with Bonferroni correction. (i and j) Thermal and mechanical pain tests during complete Freund's adjuvant (CFA)-induced inflammatory pain in Oprm1KI/KI (n = 6) and wild-type (n = 9) littermates. Two-way ANOVA (i), F9,130 = 8.312, p<0.0001; (j), F9,130 = 17.90, p<0.0001 with Bonferroni correction. (k) Schematic diagram for driving MOR re-expression. Nestin-Cre mice were crossed with Oprm1KI/KI mice, and the stop cassette (red hexagon) was excised. (l) MOR expression in the brain, spinal cord and DRG sections of Nestin-Cre/Oprm1KI/KI mice. Scale bars, 2 mm (left), 100 μm (middle and right). (m and n) Effects of morphine (10 mg/kg, s.c.) on moving distance and average speed of locomotion with open field test in Nestin-Cre/Oprm1KI/KI mice (n = 10) compared to Oprm1KI/KI (n = 9) littermates. Two-way ANOVA (m), F1,34 = 61.95, p<0.0001; (n), F1,34 = 51.10, p<0.0001 with Bonferroni correction. (o and p) Effects of morphine (10 mg/kg, s.c.) on thermal pain tested with tail immersion (50°C) and hot plate (52°C) tests in Nestin-Cre/Oprm1KI/KI mice, compared to Oprm1KI/KI littermates. n = 5–10 mice. Two-way ANOVA (o), F10,99 = 16.66, p<0.0001; (p), F1,34 = 8.616, p=0.0059 with Bonferroni correction. Data are presented as mean ± SEM, *p<0.05, **p<0.01, ***p<0.001.
-
Figure 2—source data 1
Raw data of the behavioral tests and MOR expression level in wild-type and Nestin-Cre/Oprm1-KI mice.
- https://cdn.elifesciences.org/articles/55289/elife-55289-fig2-data1-v2.xlsx
Figure 2—figure supplement 1
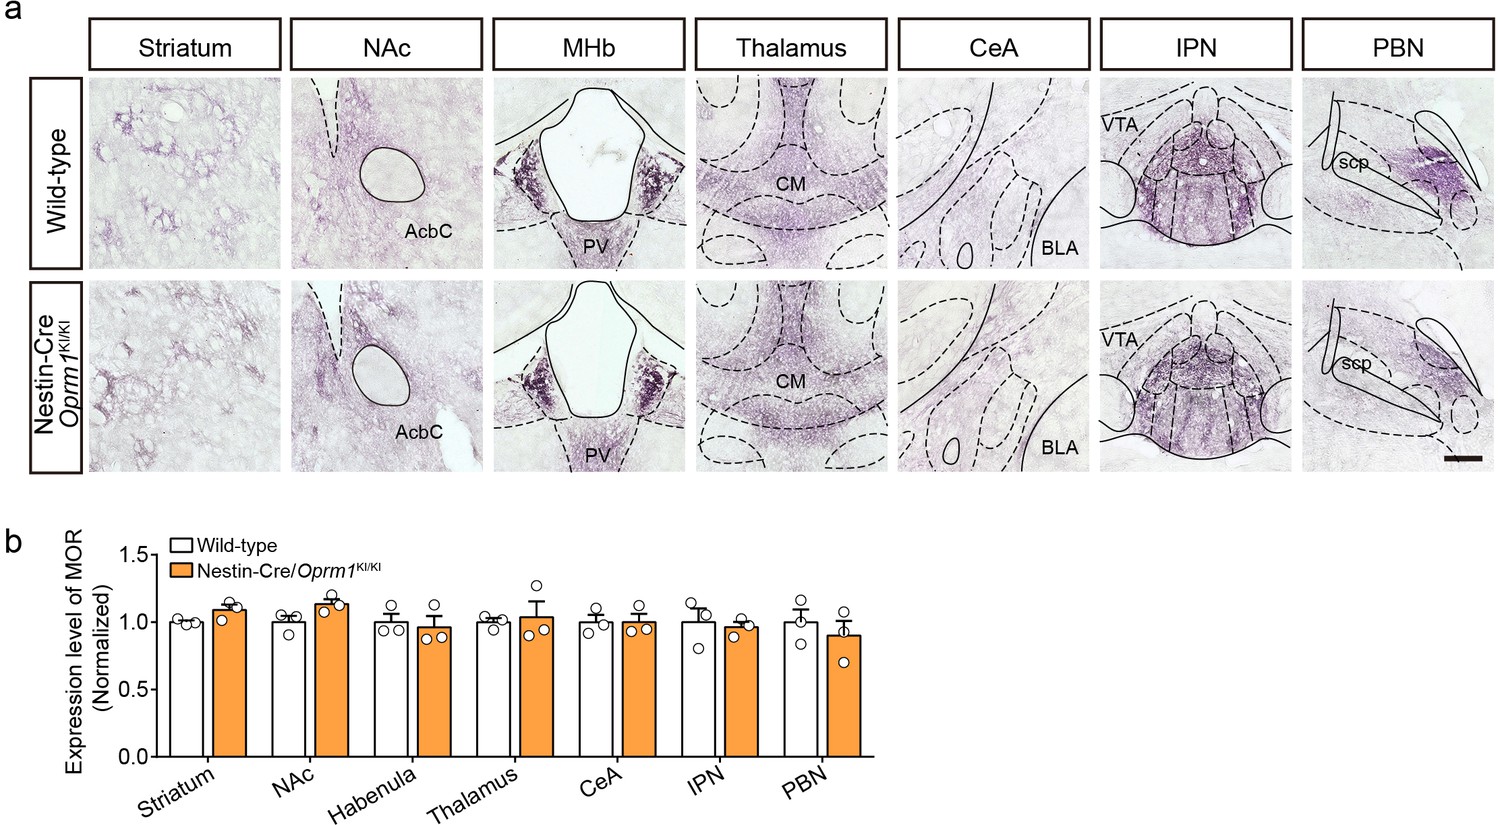
MOR expression in Nestin-Cre/Oprm1KI/KI mice.
(a) MOR expression in representative brain regions in Nestin-Cre/Oprm1KI/KI mice compared to wild-type mice. Scale bar, 200 μm. (b) Quantification of MOR expression level in Nestin-Cre/Oprm1KI/KI mice compared to wild-type mice. The MOR expression level was normalized to the mean gray value of MOR signal in each brain region of wild-type mice. n = 3 mice. NAc, nucleus accumbens; AcbC, accumbens nucleus, core; MHb, medial habenula; PV, paraventricular thalamic nucleus; CM, central medial thalamic nucleus; CeA, central amygdala; BLA, basolateral amygdala; IPN, interpeduncular nucleus; VTA, ventral tegmental area; PBN, parabrachial nucleus; scp, superior cerebellar peduncle. Data are presented as mean ± SEM.
Figure 3 with 2 supplements
MORs in Vglut2+ glutamatergic neurons mediate exogenous opioid analgesia.
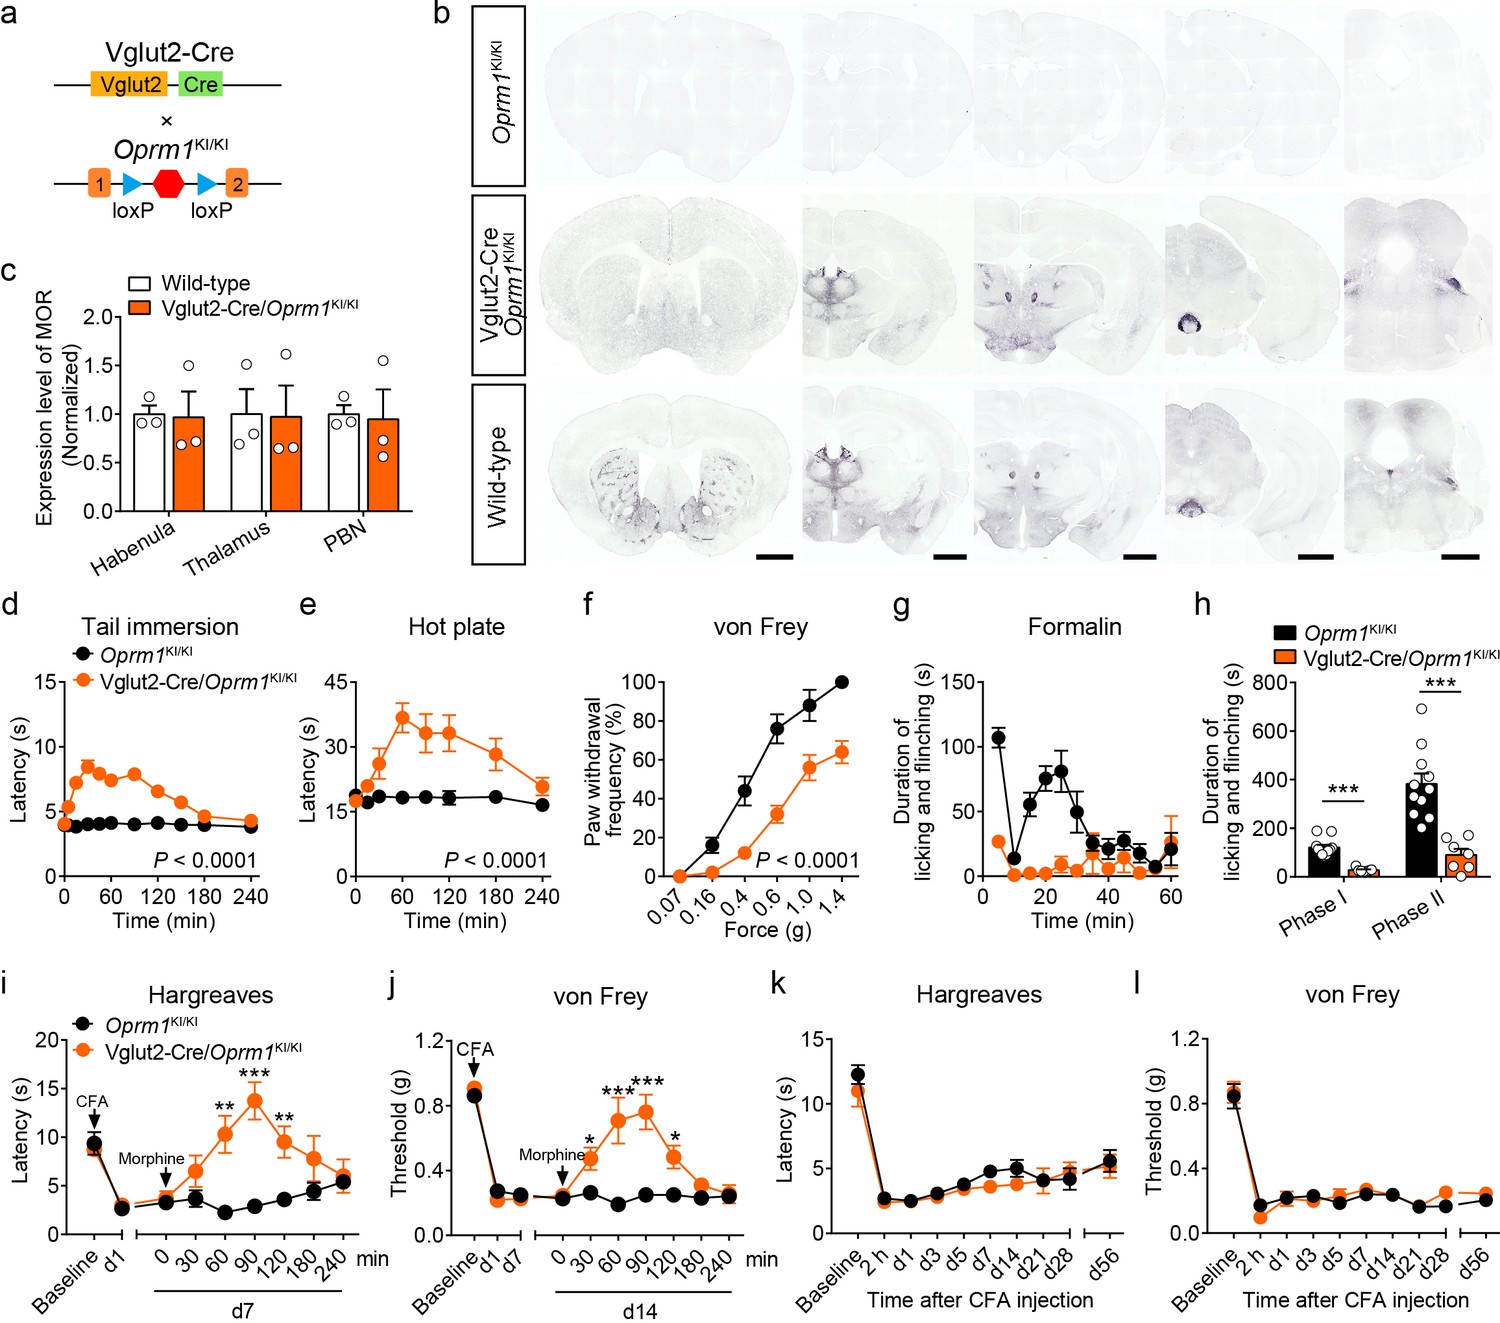
(a) Schematic diagram for re-expression of MORs in glutamatergic neurons. Vglut2-Cre mice were crossed with Oprm1KI/KI mice to generate Vglut2-Cre/Oprm1KI/KI mice. Red hexagon: Stop cassette. (b) Graphs showing the immunostaining of MOR in brain sections of Oprm1KI/KI, Vglut2-Cre/Oprm1KI/KI and wild-type mice. Scale bars, 1 mm. (c) Expression level of MOR in Vglut2-Cre/Oprm1KI/KI mice compared to wild-type mice determined by quantification of signals of MOR by immunostaining. The expression level of MOR was normalized to the mean gray value of MOR signal in each brain region of wild-type mice. (d–f) Effects of morphine (10 mg/kg, s.c.) on pain tests with tail immersion (50°C), hot plate (52°C) and von Frey tests in Oprm1KI/KI mice (n = 5–12) and Vglut2-Cre/Oprm1KI/KI mice (n = 8–10). Two-way ANOVA (d), F10,220 = 19.87, p<0.0001; (e), F7,120 = 4.045, p=0.0005; (f), F5,78 = 4.956, p=0.0005 with Bonferroni correction. (g) Time course of formalin-induced nocifensive behaviors in Oprm1KI/KI (n = 11) and Vglut2-Cre/Oprm1KI/KI (n = 7) mice with subcutaneous morphine injection (10 mg/kg). (h) Summary of the nocifensive behaviors in phase I (0–10 min) and phase II (10–60 min) of formalin test in Oprm1KI/KI mice (n = 11) and Vglut2-Cre/Oprm1KI/KI mice (n = 7) with subcutaneous morphine injection (10 mg/kg). Student’s unpaired t-test, t16 = 6.767, p<0.0001 (Phase I); t16 = 5.017, p=0.0001 (Phase II). (i and j) Time-course effects of morphine (10 mg/kg, s.c.) on thermal and mechanical sensitivities after CFA application in Oprm1KI/KI mice and Vglut2-Cre/Oprm1KI/KI mice on day 7 (d7) and d14, respectively. n = 7 mice for each group. Student’s unpaired t test, t12 = 4.165, p=0.0013 (i), 60 min; t12 = 5.371, p=0.0002 (i), 90 min; t12 = 3.430, p=0.005 (i), 120 min; t12 = 4.273, p=0.0011 (j), 30 min; t12 = 4.110, p=0.0014 (j), 60 min; t12 = 7.365, p<0.0001 (j), 90 min; t12 = 3.983, p=0.0018 (j), 120 min; t12 = 5.517, p=0.0001 (j), 180 min. (k and l) Thermal and mechanical pain tests during CFA-induced inflammatory pain in Oprm1KI/KI and Vglut2-Cre/Oprm1KI/KI mice. n = 7–9 mice. Two-way ANOVA (k), F9,140 = 0.7866, p=0.9075; (l), F9,140 = 0.4463, p=0.6291 with Bonferroni correction. Data are presented as mean ± SEM, *p<0.05, **p<0.01, ***p<0.001.
-
Figure 3—source data 1
Raw data of the behavioral tests and MOR expression level in Vglut2-Cre/Oprm1-KI and Vglut2-Cre/Oprm1-fl groups of mice.
- https://cdn.elifesciences.org/articles/55289/elife-55289-fig3-data1-v2.xlsx
Figure 3—figure supplement 1
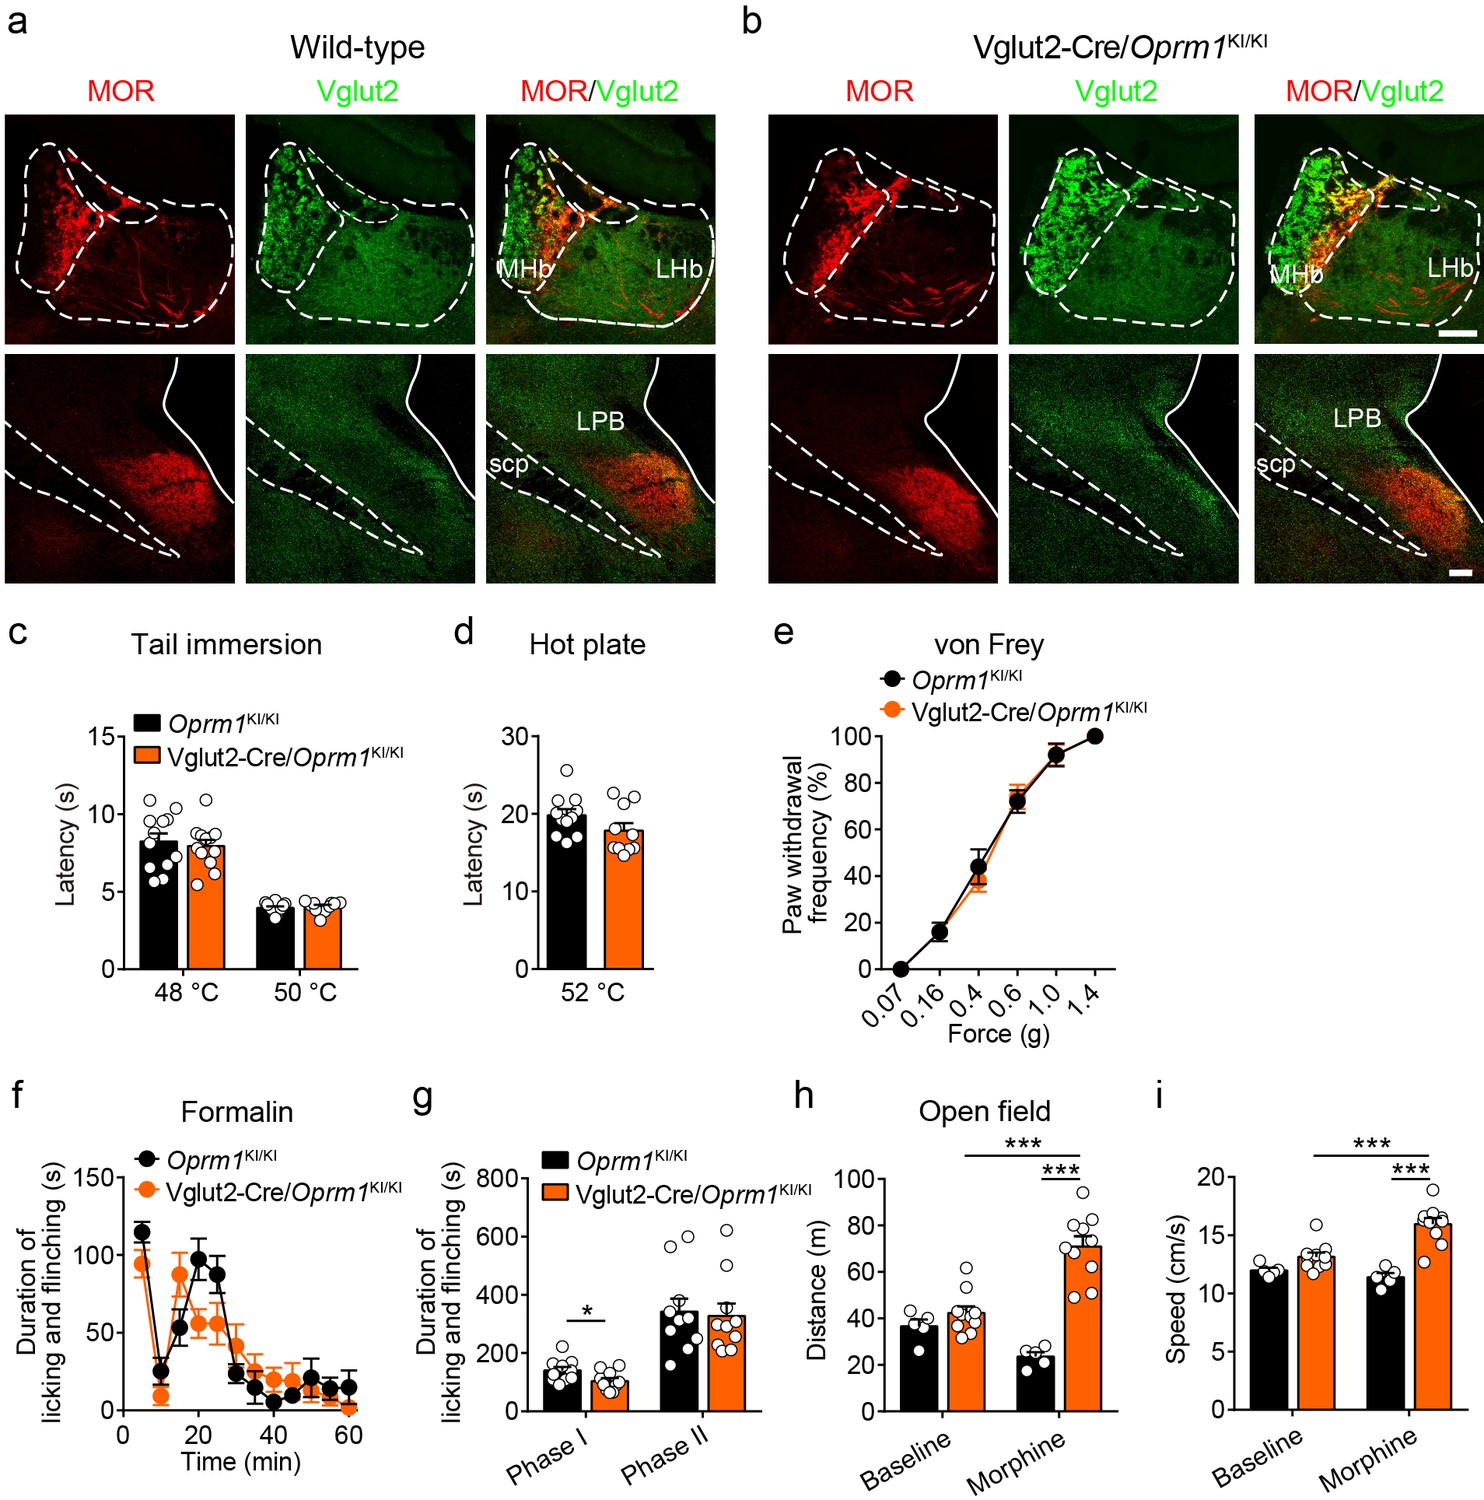
Expression pattern of the re-expressed MOR and functional role of MORs in Vglut2+ glutamatergic neurons in morphine analgesia.
(a and b) Immunofluorescent staining showing the expression of MOR and Vglut2 expression in the habenula and parabrachial nucleus of wild-type and Vglut2-Cre/Oprm1KI/KI mice. Scale bars, 100 μm. MHb, medial habenula; LHb, lateral habenula; LPB, lateral parabrachial nucleus; scp, superior cerebellar peduncle. (c–e) Basal pain threshold tests with tail immersion, hot plate and von Frey tests in Oprm1KI/KI mice and Vglut2-Cre/Oprm1KI/KI mice. n = 7–12 mice. Student’s unpaired t-test, tail immersion 48°C: t22 = 0.4600, p=0.6501, 50°C: t222 = 0.5325, p=0.6003; hot plate: t19 = 1.566, p=0.1337 and two-way ANOVA (e), F5,78 = 0.2110, p=0.9569 with Bonferroni correction. (f) Time course of formalin-induced nocifensive behaviors in Oprm1KI/KI and Vglut2-Cre/Oprm1KI/KI mice. n = 10 mice for each group. (g) Summary of the nocifensive behaviors in phase I (0–10 min) and phase II (10–60 min) of formalin test in Oprm1KI/KI and Vglut2-Cre/Oprm1KI/KI mice. n = 10 mice for each group. Student’s unpaired t-test, t18 = 0.9344, p=0.0376 (Phase I); t18 = 0.2308, p=0.8201 (Phase II). (h and i) Effects of morphine (10 mg/kg, s.c.) on moving distance and average speed with open field test in Oprm1KI/KI mice (n = 5) and Vglut2-Cre/Oprm1KI/KI mice (n = 10). Two-way ANOVA (h), F1,16 = 27.25, p<0.0001; (i), F1,26 = 12.48, p=0.0016 with Bonferroni correction. Data are presented as mean ± SEM, *p<0.05, ***p<0.001.
Figure 3—figure supplement 2
Functional role of MORs in glutamatergic neurons in opioid analgesia.
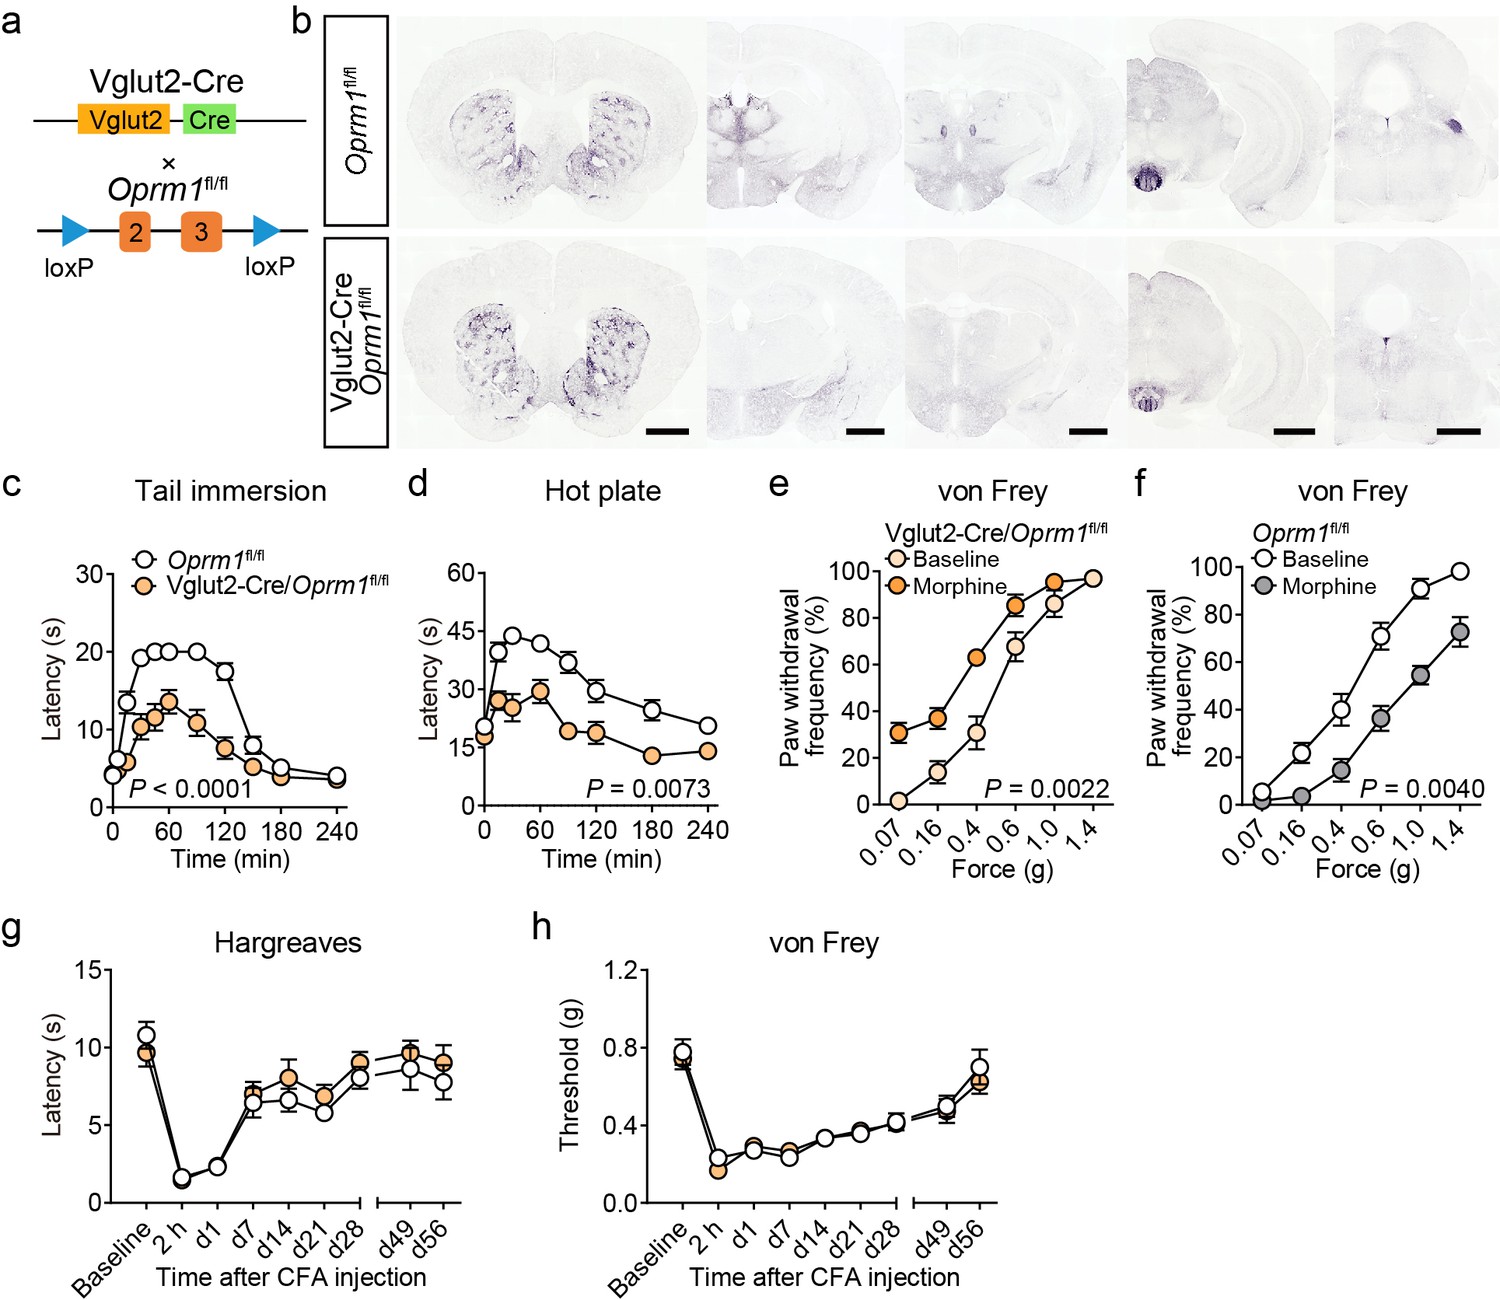
(a) Schematic diagram for conditional knockout MORs from glutamatergic neurons. Vglut2-Cre mice were crossed with Oprm1fl/fl mice to generate Vglut2-Cre/Oprm1fl/fl mice. (b) Immunostaining of MOR in Oprm1fl/fl and Vglut2-Cre/Oprm1fl/fl mouse brain sections. Scale bars, 1 mm. (c and d) Pain tests with tail immersion (50°C) and hot plate (52°C) in Oprm1fl/fl mice (n = 13) and Vglut2-Cre/Oprm1fl/fl mice (n = 15). Two-way ANOVA (c), F10,242 = 10.05, p<0.0001; (d), F7,208 = 2.851, p=0.0073 with Bonferroni correction. (e and f) Effect of morphine (10 mg/kg, s.c.) on mechanical threshold in Oprm1fl/fl mice (n = 11) and Vglut2-Cre/Oprm1fl/fl mice (n = 13). Two-way ANOVA (e), F5,144 = 3.956, p=0.0022; (f), F5,120 = 3.665, p=0.0040 with Bonferroni correction. (g and h) Thermal and mechanical pain tests during CFA-induced inflammatory pain in Oprm1fl/fl and Vglut2-Cre/Oprm1fl/fl mice. n = 10 mice for each group. Two-way ANOVA (g), F8,162 = 0.5217, p=0.8390; (h), F8,162 = 0.3305, p=0.9533 with Bonferroni correction. Data are presented as mean ± SEM.
Figure 4 with 2 supplements
MORs in GABAergic neurons mediate endogenous opioid analgesia.
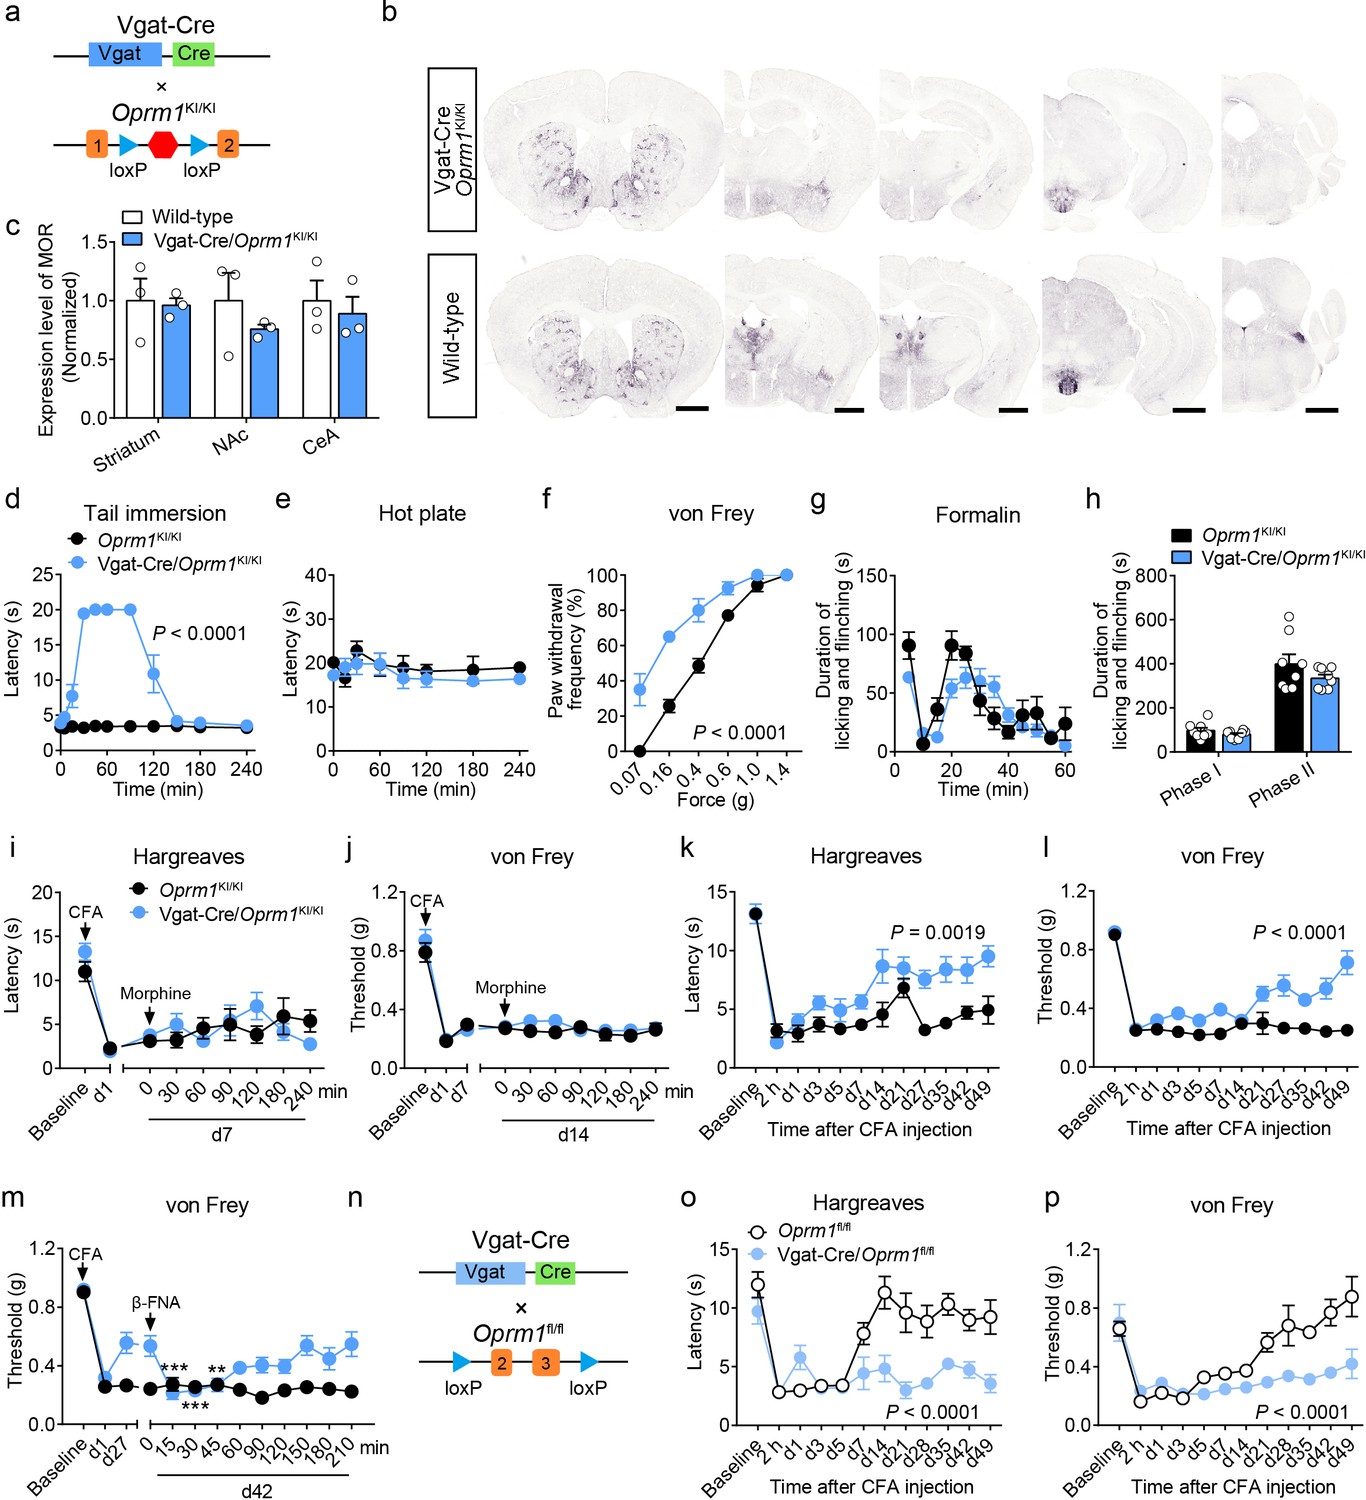
(a) Schematic diagram for re-expression of MORs in GABAergic neurons. Vgat-Cre mice were crossed with Oprm1KI/KI mice to generate Vgat-Cre/Oprm1KI/KI mice. Red hexagon: Stop cassette. (b) Graphs showing the immunostaining of MOR in Vgat-Cre/Oprm1KI/KI and wild-type mouse brain sections. Scale bars, 1 mm. (c) Expression level of MOR in Vgat-Cre/Oprm1KI/KI mice compared to wild-type mice determined by quantification of signals of MOR by immunostaining. The expression level of MOR was normalized to the mean gray value of MOR signal in each brain region of wild-type mice. (d–f) Effects of morphine (10 mg/kg, s.c.) on pain tests with tail immersion (50°C), hot plate (52°C) and von Frey tests in Oprm1KI/KI mice and Vgat-Cre/Oprm1KI/KI mice. n = 5–8 mice. Two-way ANOVA (d), F10,143 = 63.70, p<0.0001; (e), F7,88 = 0.4163, p=0.8898; (f), F5,78 = 7.448, p<0.0001 with Bonferroni correction. (g) Time course of formalin-induced nocifensive behaviors in Vgat-Cre/Oprm1KI/KI mice compared to Oprm1KI/KI mice with subcutaneous morphine injection (10 mg/kg). n = 8 mice for each group. (h) Summary of the nocifensive behaviors in phase I (0–10 min) and phase II (10–60 min) of formalin test in Vgat-Cre/Oprm1KI/KI mice compared to Oprm1KI/KI mice with subcutaneous morphine injection (10 mg/kg). n = 8 mice for each group. Student’s unpaired t-test, t14 = 1.248, p=0.2324 (Phase I); t14 = 1.388, p=0.1868 (Phase II). (i and j) Time-course effects of morphine (10 mg/kg, s.c.) on thermal (i) and mechanical (j) sensitivities on CFA-induced pain responses in Oprm1KI/KI mice (n = 8) and Vgat-Cre/Oprm1KI/KI mice (n = 10) on d7 and d14, respectively. Two-way ANOVA (i), F8,144 = 1.515, p=0.1567; (j), F8,144 = 0.5818, p=0.7917 with Bonferroni correction. (k and l) Thermal and mechanical pain tests during CFA-induced inflammatory pain in Oprm1KI/KI and Vgat-Cre/Oprm1KI/KI mice. n = 8 mice for each group. Two-way ANOVA (k), F11,168 = 2.848, p=0.0019; (l), F9,140 = 6.034, p<0.0001 with Bonferroni correction. (m) Time-course effects of β-FNA (10 mg/kg, i.p.) on mechanical sensitivity on CFA-induced pain responses in Oprm1KI/KI and Vgat-Cre/Oprm1KI/KI mice on d42 when the pain response was mostly recovered (n = 8). RM one-way ANOVA (Oprm1KI/KI, F9,63 = 0.6393, p=0.7592; Vgat-Cre/Oprm1KI/KI, F9,63 = 5.992, p<0.0001) with Bonferroni correction. (n) Schematic diagram for conditional knockout MOR from GABAergic neurons. Vgat-Cre mice were crossed with Oprm1fl/fl mice to generate Vgat-Cre/Oprm1fl/fl mice. (o and p) Thermal and mechanical pain tests during CFA-induced inflammatory pain in Oprm1fl/fl (n = 6) and Vgat-Cre/Oprm1fl/fl mice (n = 7). Two-way ANOVA (o), F11,132 = 5.428, p<0.0001; (p), F11,132 = 4.943, p<0.0001 with Bonferroni correction. Data are presented as mean ± SEM, **p<0.01, ***p<0.001.
-
Figure 4—source data 1
Raw data of the behavioral tests and MOR expression level in Vgat-Cre/Oprm1-KI and Vgat-Cre/Oprm1-fl groups of mice.
- https://cdn.elifesciences.org/articles/55289/elife-55289-fig4-data1-v2.xlsx
Figure 4—figure supplement 1
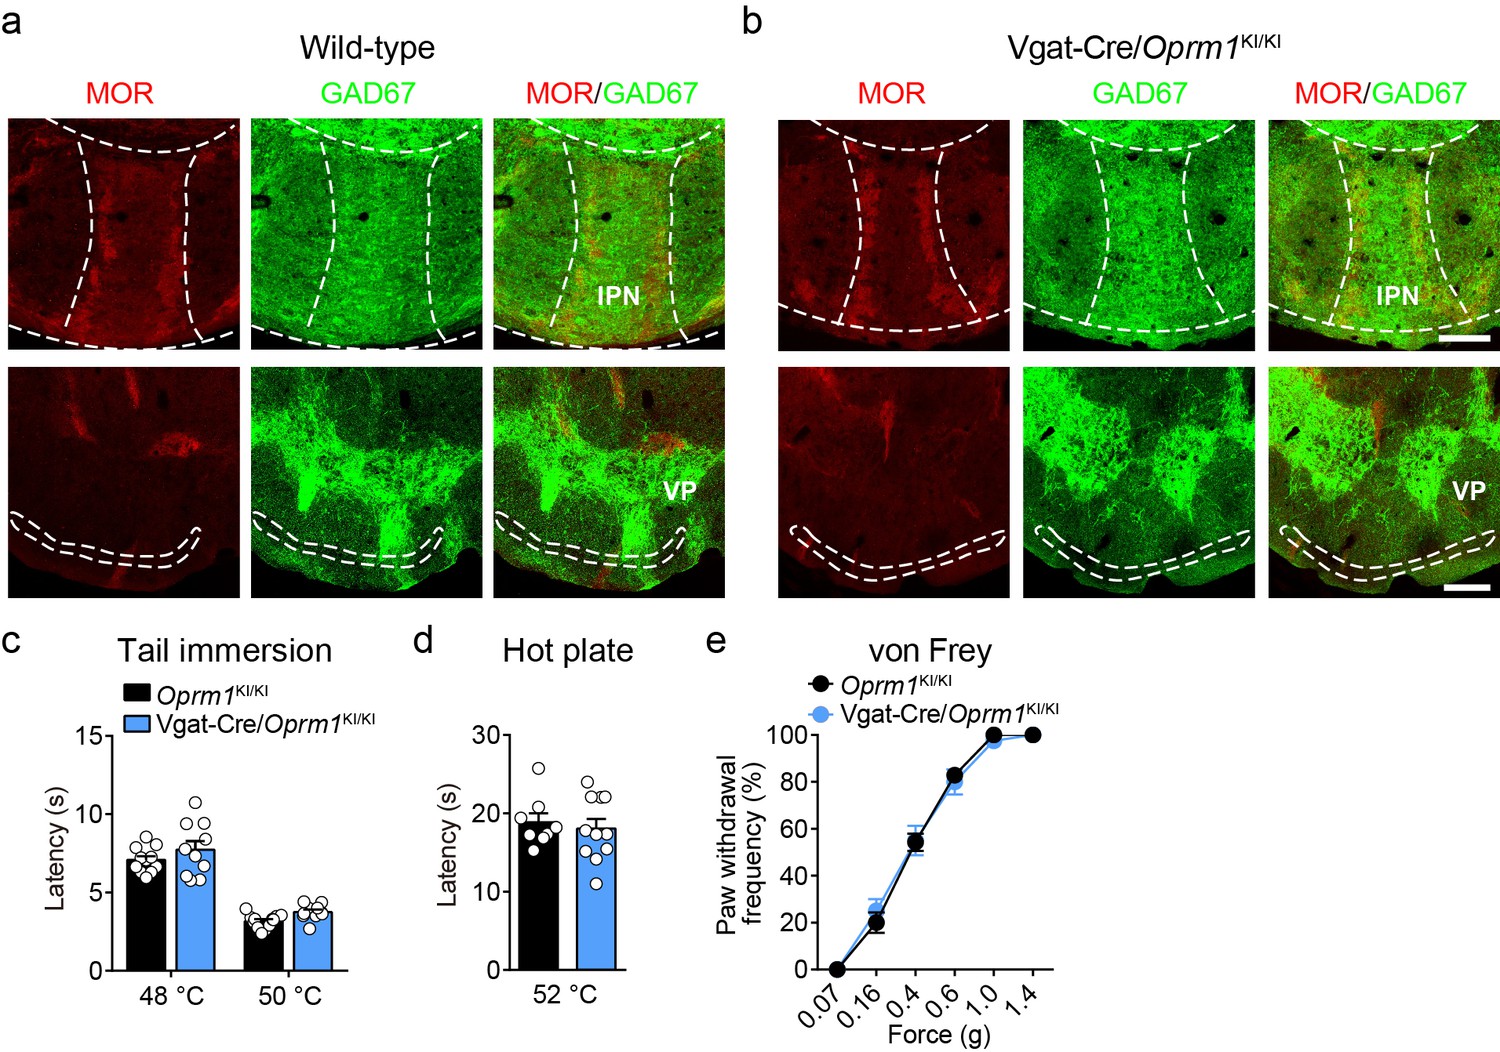
Expression pattern of the re-expressed MOR and functional role of MORs in GABAergic neurons in morphine analgesia.
(a and b) Immunofluorescent staining showing the expression of MOR and GAD67 expression in the interpeduncular nucleus (IPN) and ventral pallidum (VP) of wild-type and Vgat-Cre/Oprm1KI/KI mice. Scale bars, 100 μm (top), 200 μm (bottom). (c–e) Basal pain threshold tests with tail immersion, hot plate and von Frey tests in Oprm1KI/KI mice and Vgat-Cre/Oprm1KI/KI mice. n = 10–12 mice. Student’s unpaired t-test, tail immersion 48°C: t19 = 1.141, p=0.2682, 50°C: t20 = 0.8839, p=0.3873; hot plate: t17 = 0.4677, p=0.6460 and two-way ANOVA (e), F5,78 = 0.3199, p=0.8996 with Bonferroni correction. Data are presented as mean ± SEM.
Figure 4—figure supplement 2
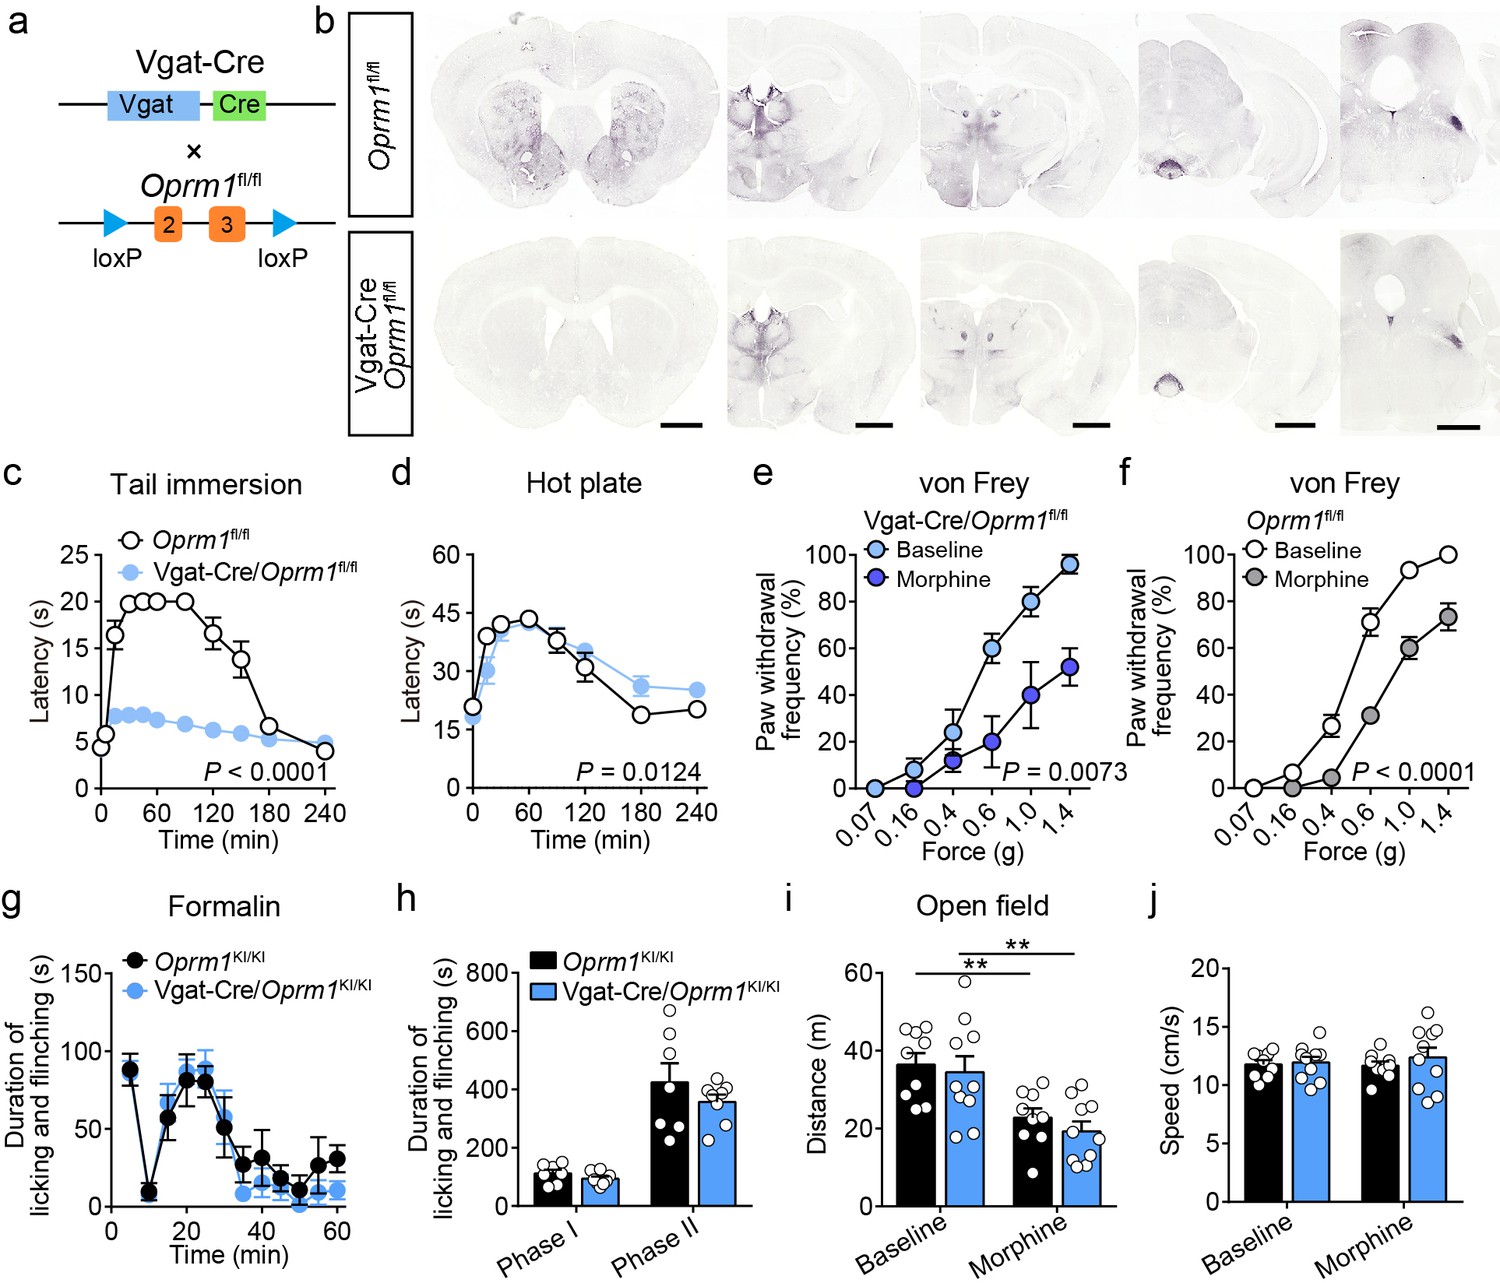
Functional role of MORs in GABAergic neurons in opioid analgesia.
(a) Schematic diagram for conditional knockout MORs from GABAergic neurons. Vgat-Cre mice were crossed with Oprm1fl/fl mice to generate Vgat-Cre/Oprm1fl/fl mice. (b) Immunostaining of MOR in Oprm1fl/fl and Vgat-Cre/Oprm1fl/fl mouse brain sections. Scale bars, 1 mm. (c and d) Pain tests with tail immersion (50°C) and hot plate (52°C) in Oprm1fl/fl mice (n = 13) and Vgat-Cre/Oprm1fl/fl mice (n = 15). Two-way ANOVA (c), F10, 187 = 25.21, p<0.0001; (d), F7,128 = 2.690, p=0.0124 with Bonferroni correction. (e and f) Effect of morphine (10 mg/kg, s.c.) on mechanical threshold in Oprm1fl/fl (n = 9) and Vgat-Cre/Oprm1fl/fl (n = 5) mice. Two-way ANOVA (e), F5,48 = 3.956, p=0.0073; (f), F5,96 = 9.194, p<0.0001) with Bonferroni correction. (g) Time course of formalin-induced nocifensive behaviors in Oprm1KI/KI (n = 7) and Vgat-Cre/Oprm1KI/KI (n = 8) mice. (h) Summary of the nocifensive behaviors in phase I (0–10 min) and phase II (10–60 min) of formalin test in Oprm1KI/KI (n = 7) and Vgat-Cre/Oprm1KI/KI (n = 8) mice. Student’s unpaired t-test, t13 = 1.258, p=0.2304 (Phase I); t13 = 1.002, p=0.3346 (Phase II). (i and j) Effects of morphine (10 mg/kg, s.c.) on moving distance and average speed with open field test in Oprm1KI/KI (n = 9) and Vgat-Cre/Oprm1KI/KI mice (n = 9). Two-way ANOVA (i), F1,34 = 0.05796, p=0.8112; (j), F1,34 = 0.2288, p=0.6355 with Bonferroni correction. Data are presented as mean ± SEM, **p<0.01.
Figure 5 with 1 supplement
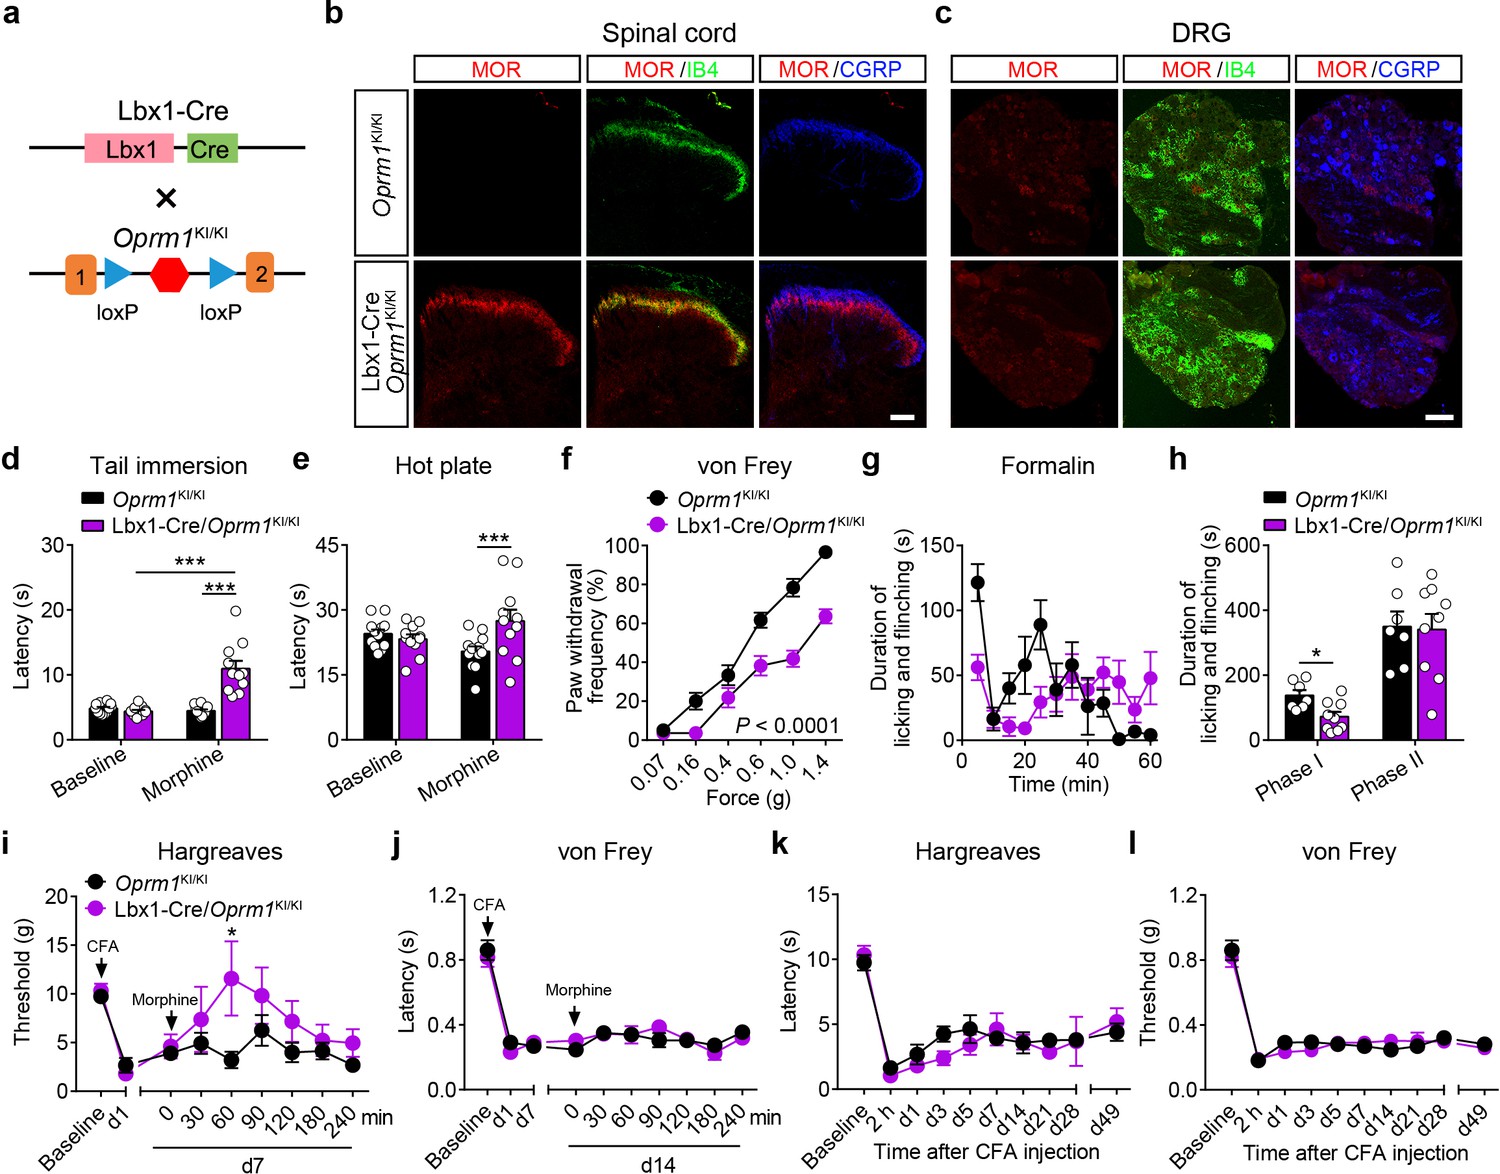
MORs in dorsal spinal cord mediate morphine analgesia.
(a) Schematic diagram for re-expression of MORs in dorsal spinal neurons. Lbx1-Cre mice were crossed with Oprm1KI/KI mice to generate Lbx1-Cre/Oprm1KI/KI mice. Red hexagon: Stop cassette. (b and c) Co-immunostaining of MOR with IB4 and CGRP in Oprm1KI/KI and Lbx1-Cre/Oprm1KI/KI spinal cord (left) and DRG (right). Scale bars, 100 μm. (d–f) Effects of morphine (10 mg/kg, s.c.) on pain tests with tail immersion (50°C), hot plate (52°C) and von Frey tests in Oprm1KI/KI (n = 12) and Lbx1-Cre/Oprm1KI/KI (n = 11) mice. Two-way ANOVA (d), F1,42 = 33.80, p<0.0001; (e), F1,42 = 7.038, p=0.0112; (f), F5,126 = 5.717, p<0.0001) with Bonferroni correction. (g) Time course of formalin-induced nocifensive behaviors in Lbx1-Cre/Oprm1KI/KI (n = 9) mice compared with Oprm1KI/KI (n = 7) littermates with subcutaneous morphine injection (10 mg/kg). (h) Summary of the nocifensive behaviors in phase I (0–10 min) and phase II (10–60 min) of formalin test in Lbx1-Cre/Oprm1KI/KI (n = 9) mice compared with Oprm1KI/KI (n = 7) littermates with subcutaneous morphine injection (10 mg/kg). Student’s unpaired t test, t14 = 2.924, p=0.0111 (Phase I); t14 = 0.1382, p=0.8921 (Phase II). (i and j) Time-course effects of morphine (10 mg/kg, s.c.) on thermal (i) and mechanical (j) sensitivities on CFA-induced pain responses in Oprm1KI/KI mice (n = 8) and Lbx1-Cre/Oprm1KI/KI mice (n = 5) on d7 and d14, respectively. Student’s unpaired t-test, t11 = 2.681, p=0.0214 (i), 60 min. (k and l) Thermal and mechanical pain tests during CFA-induced inflammatory pain in Oprm1KI/KI (n = 8) and Lbx1-Cre/Oprm1KI/KI (n = 5) mice. Two-way ANOVA (k), F9,110 = 0.6637, p=0.7400; (l), F9,110 = 0.6157, p=0.7814 with Bonferroni correction. Data are presented as mean ± SEM, *p<0.05, ***p<0.001.
-
Figure 5—source data 1
Raw data of the behavioral tests in Lbx1-Cre/Oprm1-KI and Lbx1-Cre/Oprm1-fl groups of mice.
- https://cdn.elifesciences.org/articles/55289/elife-55289-fig5-data1-v2.xlsx
Figure 5—figure supplement 1
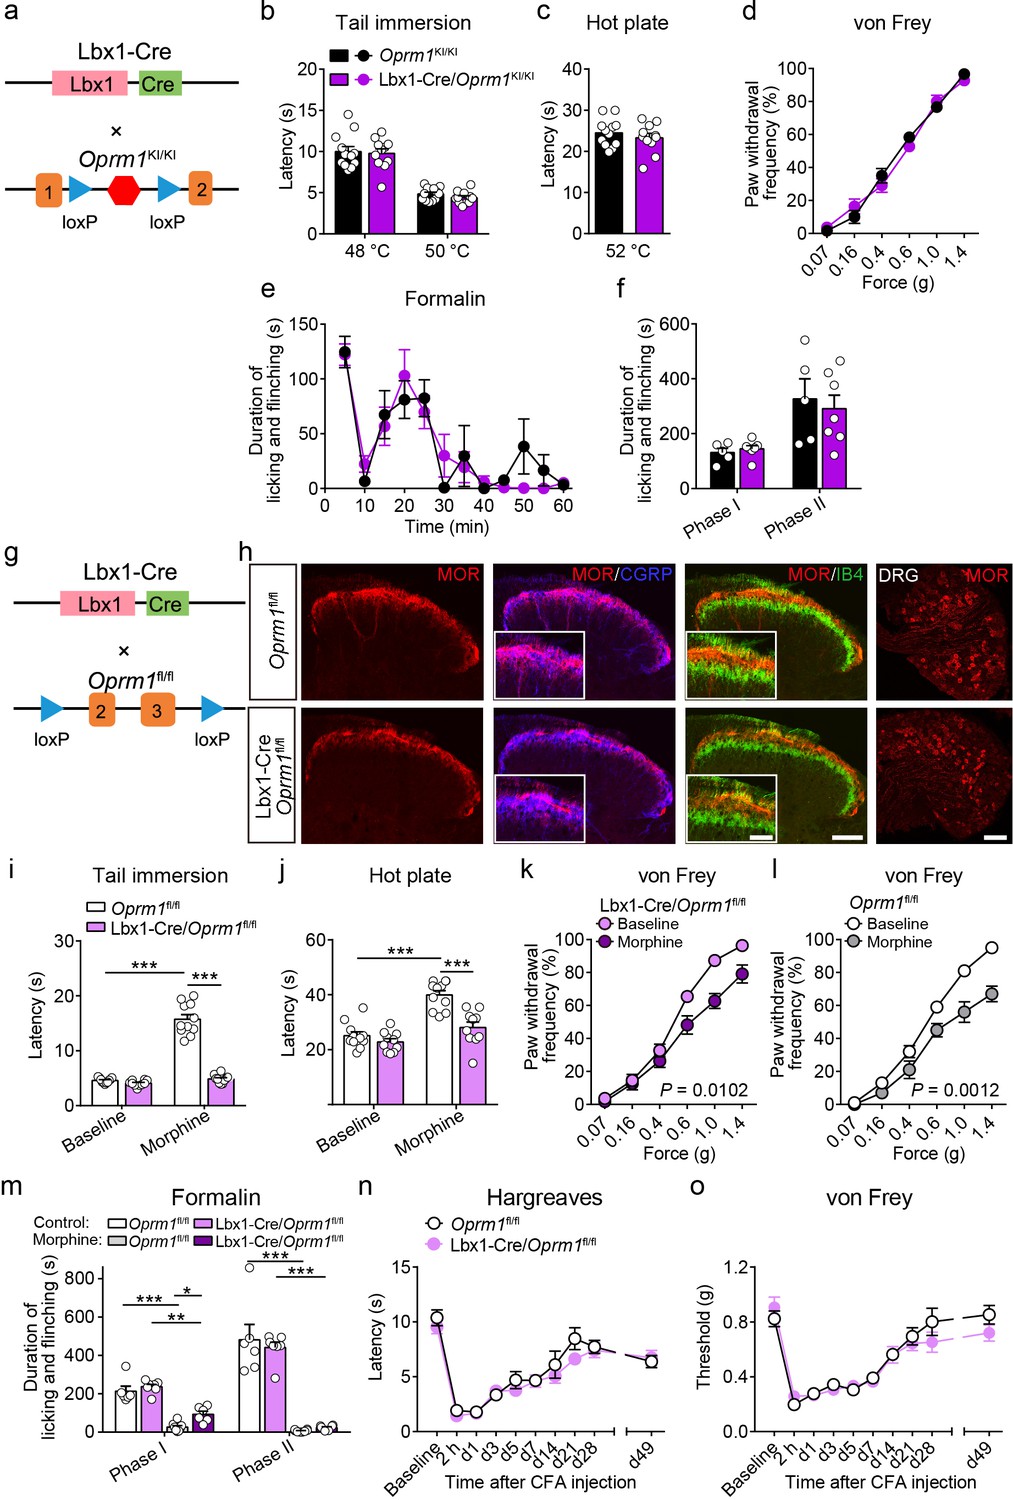
Functional role of MORs in dorsal spinal neurons in opioid analgesia.
(a) Schematic diagram for re-expression of MORs in dorsal spinal neurons. Lbx1-Cre mice were crossed with Oprm1KI/KI mice to generate Lbx1-Cre/Oprm1KI/KI mice. (b–d) Basal pain threshold tests with tail immersion, hot plate and von Frey tests in Oprm1KI/KI (n = 12) and Lbx1-Cre/Oprm1KI/KI (n = 11) mice. Student’s unpaired t-test, tail immersion 48°C: t21 = 0.2694, p=0.7902, 50°C: t21 = 1.405, p=0.1747; hot plate: t21 = 0.4677, p=0.4022 and two-way ANOVA (d), F5,126 = 1.235, p=0.2966 with Bonferroni correction. (e) Time course of formalin-induced nocifensive behaviors in Oprm1KI/KI (n = 5) and Lbx1-Cre/Oprm1KI/KI (n = 7) mice. (f) Summary of the nocifensive behaviors in phase I (0–10 min) and phase II (10–60 min) of formalin test in Oprm1KI/KI (n = 5) and Lbx1-Cre/Oprm1KI/KI (n = 7) mice. Student’s unpaired t-test, t10 = 0.6900, p=0.5023 (Phase I); t10 = 0.4243, p=0.6803 (Phase II). (g) Schematic diagram for conditional knockout MORs from dorsal spinal neurons. Lbx1-Cre mice were crossed with Oprm1fl/fl mice to generate Lbx1-Cre/Oprm1fl/fl mice. (h) Co-immunostaining of MOR with CGRP and IB4 in spinal cord and DRG of Oprm1fl/fl and Lbx1-Cre/Oprm1fl/fl mice. Scale bars, 100 μm, and 50 μm for insets. (i–l) Effects of morphine (10 mg/kg, s.c.) on pain tests with tail immersion, hot plate and von Frey tests in Oprm1fl/fl (n = 11) and Lbx1-Cre/Oprm1fl/fl (n = 10) mice. Two-way ANOVA (i), F1,38 = 117.6, p<0.0001; (j), F1,38 = 9.574, p=0.0037; (k), F5,120 = 3.164, p=0.0102; (l), F5,108 = 4.345, p=0.0012 with Bonferroni correction. (m) Summary of formalin-induced nocifensive behaviors during in phase I (0–10 min) and phase II (10–60 min) in Oprm1fl/fl and Lbx1-Cre/Oprm1fl/fl mice with saline or morphine treatment. n = 6–8 mice. One-way ANOVA (Phase I, F3,23 = 42.34, p<0.0001; Phase II, F3,23 = 45.86, p<0.0001) with Bonferroni correction. (n and o) Thermal and mechanical pain tests during CFA-induced inflammatory pain in Oprm1fl/fl and Lbx1-Cre/Oprm1fl/fl mice. n = 11 mice for each group. Two-way ANOVA (n), F9,200 = 0.6244, p=0.7755; (o), F9,200 = 1.104, p=0.3614 with Bonferroni correction. Data are presented as mean ± SEM, *p<0.05, **p<0.01, ***p<0.001.
Figure 6 with 1 supplement
Activation of MORs expressed in spinal GABAergic neurons induced hyperalgesia.
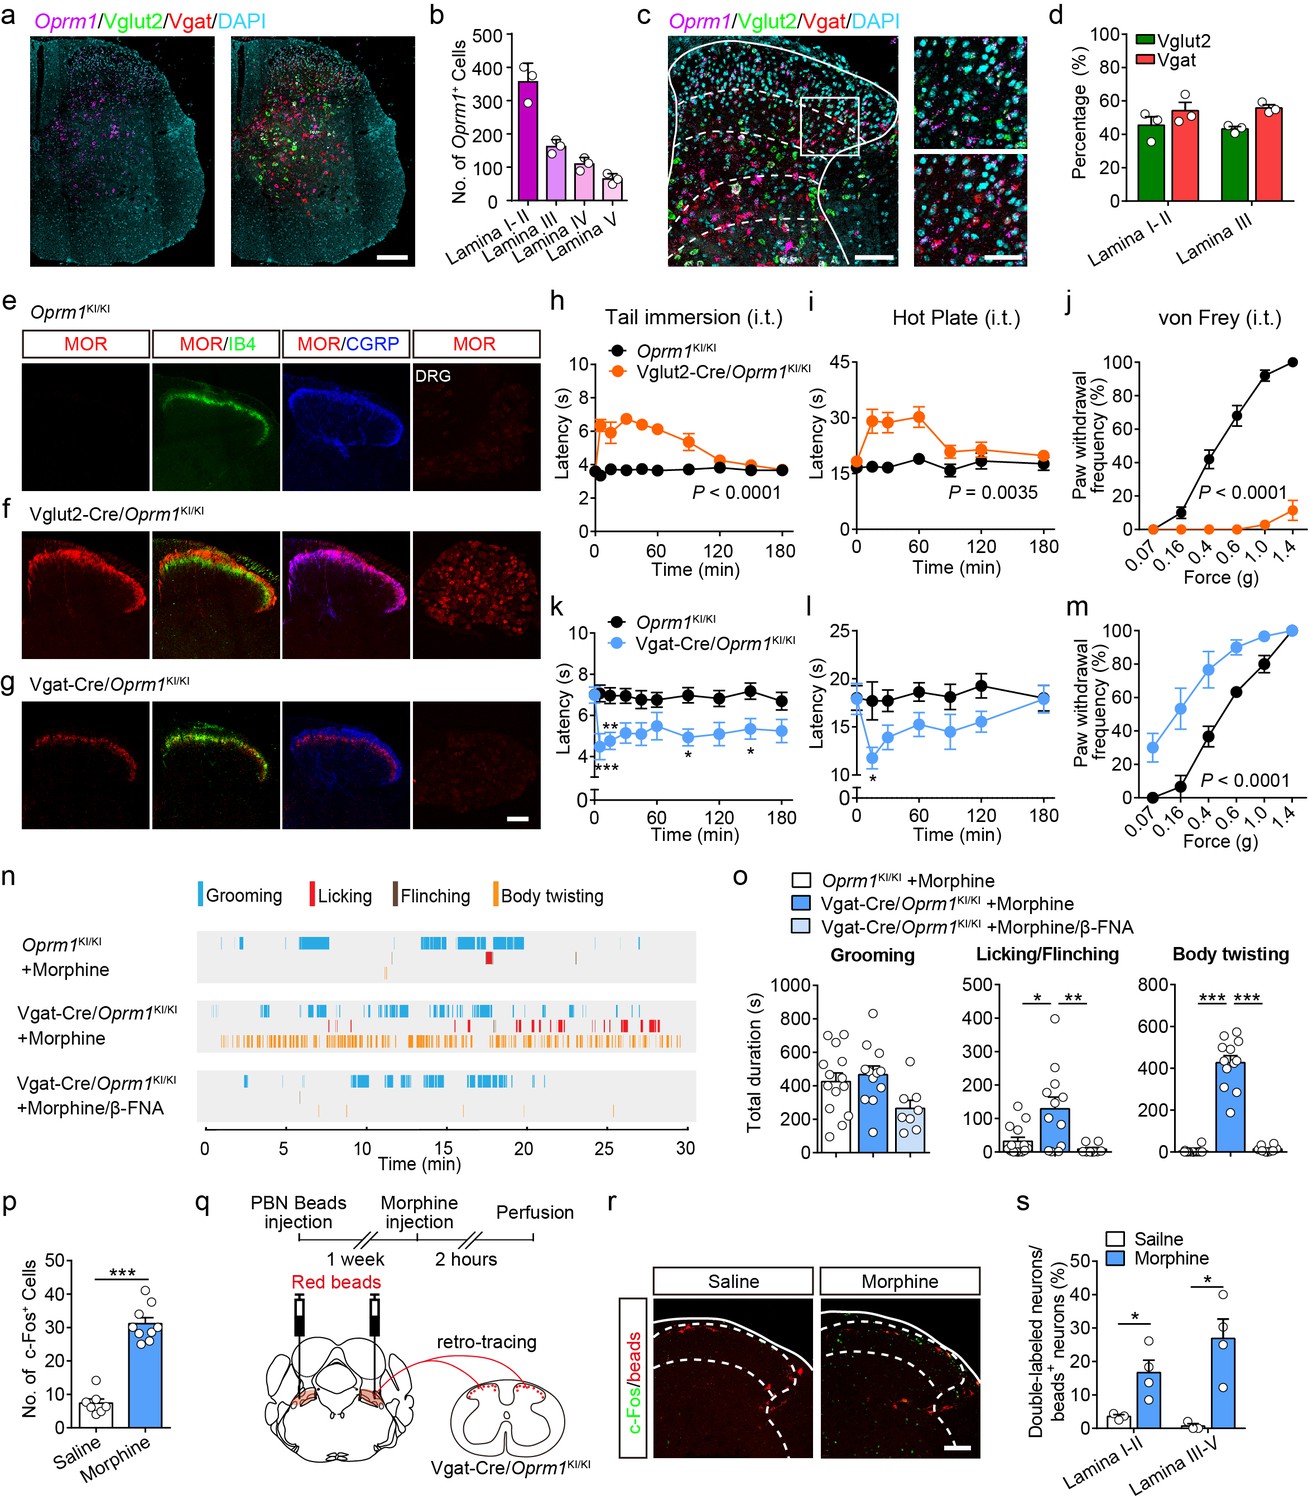
(a) Expression of Oprm1, Vglut2 and Vgat mRNA in the spinal cord of wild-type mice. Scale bar, 200 μm. (b) Quantification of Oprm1+ cells in the dorsal spinal cord. (c) Expression of Oprm1, Vglut2 and Vgat mRNA in the dorsal spinal cord of wild-type mice. Scale bars, 100 μm (left), 50 μm (right). (d) Percentage of Vglut2+ and Vgat+ neurons in Oprm1+ neurons in the dorsal spinal cord. n = 3 mice. (e–g) Co-immunostaining of MOR, IB4 and CGRP in dorsal spinal cord and immunostaining of MOR in DRG of Oprm1KI/KI, Vglut2-Cre/Oprm1KI/KI and Vgat-Cre/Oprm1KI/KI mice. Scale bar, 100 μm. (h–j) Effect of morphine (1.0 nmol/ 5 μl, intrathecal, i.t.) on pain tests with tail immersion (50°C), hot plate (52°C) and von Frey tests in Vglut2-Cre/Oprm1KI/KI mice compared to Oprm1KI/KI littermates. n = 7–10 mice. Two-way ANOVA (h), F9,130 = 12.47, p<0.0001; (i), F6,91 = 7.038, p=0.0035; (j), F5,90 = 56.15, p<0.0001 with Bonferroni correction. (k–m) Effect of morphine (1 nmol/ 5 μl, i.t.) on pain tests with tail immersion (48°C), hot plate (52°C) and von Frey tests in Vgat-Cre/Oprm1KI/KI mice compared to Oprm1KI/KI littermates. n = 6–9 mice. Two-way ANOVA (k), F9,150 = 1.162, p=0.3232; (l), F6,98 = 1.206, p=0.3097; (m), F5,60 = 3.405, p=0.0090 with Bonferroni correction. (n) Representative raster plots illustrating grooming, licking, flinching and body twisting behaviors in Oprm1KI/KI (top), Vgat-Cre/Oprm1KI/KI (middle) mice following morphine injection (1 nmol/ 5 μl, i.t.) and Vgat-Cre/Oprm1KI/KI (bottom) mice following intrathecal injection of mixture of morphine (1 nmol/ 5 μl) and β-FNA (10 nmol/ 5 μl). (o) Grooming and nocifensive behaviors induced by intrathecal morphine injection in Vgat-Cre/Oprm1KI/KI and Oprm1KI/KI mice. n = 8–14 mice. One-way ANOVA (left to right: F2,31 = 3.333, p=0.0488; F2,31 = 7.350, p=0.0024; F2,31 = 137.8, p<0.0001) with Bonferroni correction. (p) Number of morphine- (1 nmol/ 5 μl, i.t., n = 9) or saline-induced (n = 7) c-Fos+ neurons in dorsal spinal cord of Vgat-Cre/Oprm1KI/KI mice. Student’s unpaired t-test, t14 = 10.21, p<0.0001. (q) Schematic diagram for experimental timeline. (r) Representative images of c-Fos+ and beads+ neurons in dorsal spinal cord of Vgat-Cre/Oprm1KI/KI mice after saline or morphine (1 nmol/ 5 μl, i.t.) administration. Scale bar, 100 μm. (s) Percentage of beads+ neurons in c-Fos+ neurons in the dorsal spinal cord. n = 3–4 mice. Student’s unpaired t-test, t5 = 2.954, p=0.0317; t5 = 3.813, p=0.0125. Data are presented as mean ± SEM; *p<0.05, **p<0.01, ***p<0.001.
-
Figure 6—source data 1
Raw data of the behavioral tests in Vglut2-Cre/Oprm1-KI and Vgat-Cre/Oprm1-KI groups of mice with intrathecal morphine injection.
- https://cdn.elifesciences.org/articles/55289/elife-55289-fig6-data1-v2.xlsx
Figure 6—figure supplement 1
Functional role of MORs in primary neurons in opioid analgesia.
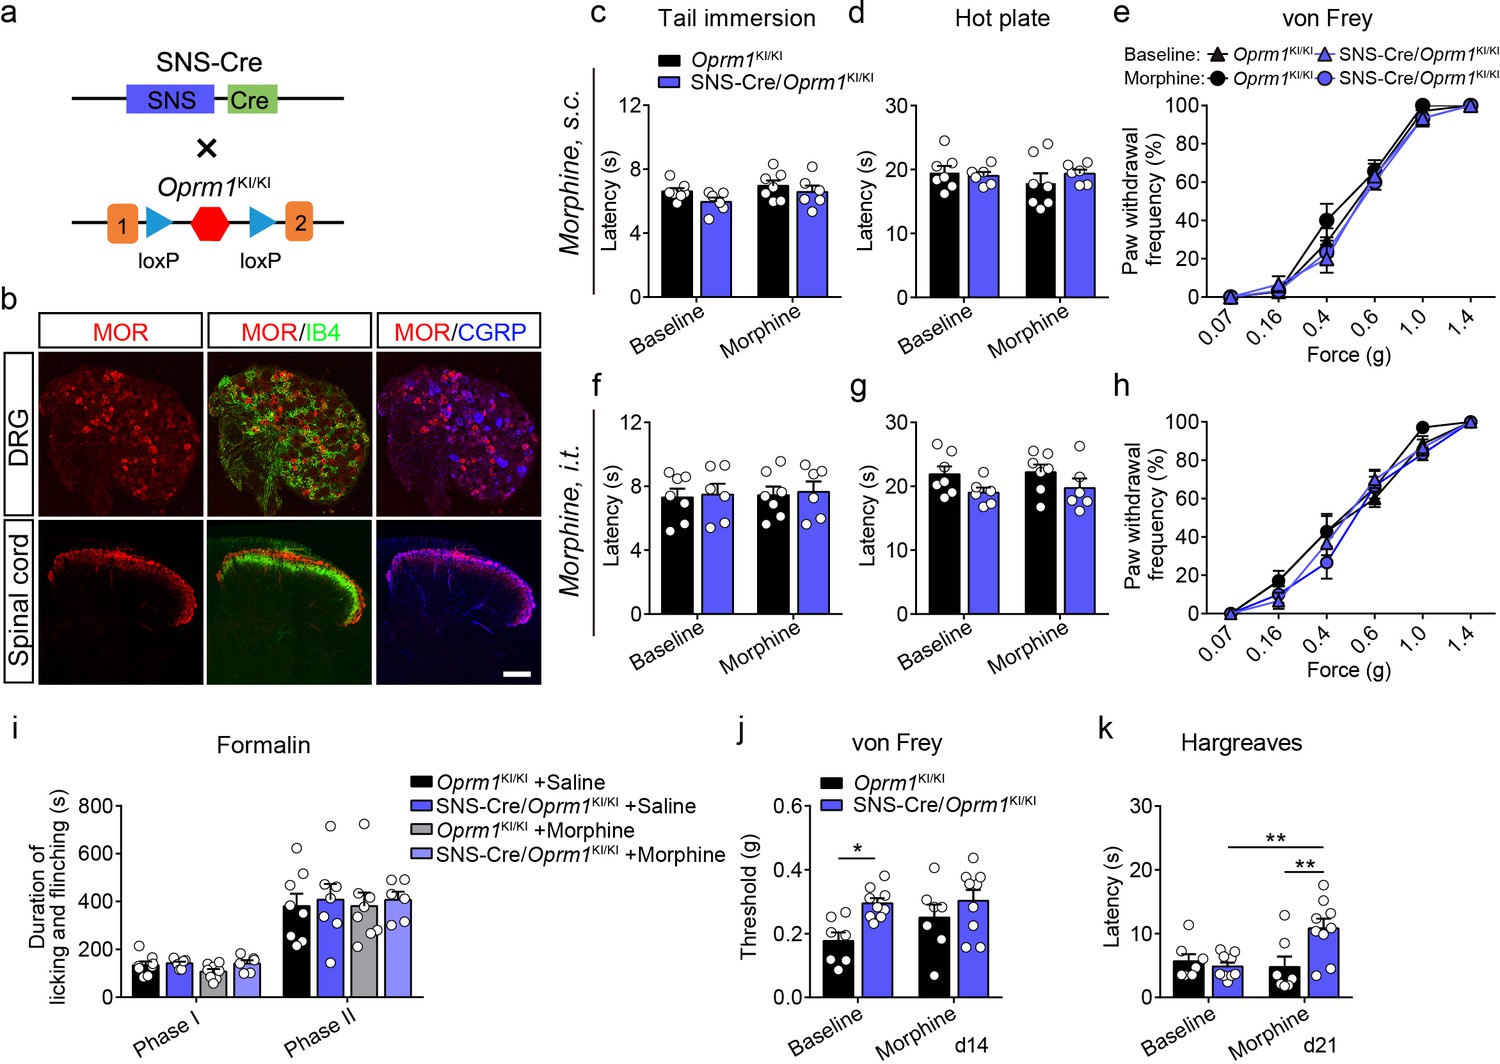
(a) Schematic diagram for re-expression of MORs in DRG neurons. SNS-Cre mice were crossed with Oprm1KI/KI mice to generate SNS-Cre/Oprm1KI/KI mice. (b) Co-immunostaining of MOR with IB4 and CGRP in the spinal cord and DRG of SNS-Cre/Oprm1KI/KI mice. Scale bar, 100 μm. (c–e) Effects of morphine (10 mg/kg, s.c.) on pain tests with tail immersion (48°C), hot plate (52°C) and von Frey tests in Oprm1KI/KI (n = 7) and SNS-Cre/Oprm1KI/KI (n = 6) mice. Two-way ANOVA (c), F1,22 = 0.2001, p=0.6590; (d), F1,22 = 0.8588, p=0.3641; (e), F15,132 = 0.8045, p=0.6710) with Bonferroni correction. (f–h) Effects of morphine (1 nmol/ 5 μl, i.t.) on pain tests with tail immersion (48°C), hot plate (52°C) and von Frey tests in Oprm1KI/KI (n = 7) and SNS-Cre/Oprm1KI/KI (n = 6) mice. Two-way ANOVA (f), F1,22 = 0.0006016, p=0.9807; (g), F1,22 = 0.02363, p=0.8792; (h), F15,132 = 0.8940, p=0.5723 with Bonferroni correction. (i) Summary of formalin-induced nocifensive behaviors during in phase I (0–10 min) and phase II (10–60 min) in Oprm1KI/KI and SNS-Cre/Oprm1KI/KI mice with saline or morphine treatment. n = 6–8 mice. One-way ANOVA (Phase I, F3,25 = 1.842, p=0.1653; Phase II, F3,25 = 0.07584, p=0.9724) with Bonferroni correction. (j and k) Effects of morphine (10 mg/kg, s.c.) on mechanical (j) and thermal (k) sensitivities on CFA-induced pain responses in Oprm1KI/KI (n = 7) and SNS-Cre/Oprm1KI/KI mice (n = 9) on d14 and d21, respectively. Two-way ANOVA (j), F1,28 = 1.177, p=0.2873; (k), F1,28 = 7.264, p=0.0118 with Bonferroni correction. Data are presented as mean ± SEM, *p<0.05, **p<0.01.
-
Figure 6—figure supplement 1—source data 1
Raw data of the behavioral tests in SNS-Cre/Oprm1-KI mice.
- https://cdn.elifesciences.org/articles/55289/elife-55289-fig6-figsupp1-data1-v2.xlsx
Figure 7 with 2 supplements

Functional role of MORs expressed in the PBN in opioid analgesia.
(a) Schematic diagram showing stereotaxic injection into PBN and representative expression of AAV-hSyn-DIO-GCaMP6s virus in MOR-iCreERT2 mice. Dashed line outlines the track of optical fiber. Scale bar, 200 μm. (b) Representative photometry traces (top) and averaged GCaMP6s fluorescence dynamics relative to the pinch onset (bottom) in response to tail (left) and hindpaw (right) pinch. Each red bar represents a pinch event. (c) Representative photometry traces (top) and averaged GCaMP6s fluorescence dynamics relative to the onset (bottom) in response to 40°C (left) and 52°C (right) tail immersion. Each red bar represents an event. (d) Comparison of the averaged fluorescence signal change between EYFP (n = 5) and GCaMP6s (n = 15) group during onset period (0–5 s) for each stimulation. Student’s unpaired t-test, tail pinch: t18 = 3.259, p=0.0044; hindpaw pinch: t18 = 2.435, p=0.0255; 40°C hot water: t18 = 0.1860, p=0.8545; 52°C hot water: t18 = 2.386, p=0.0293. (e) Diagram for experiments and individual response of MOR+ neurons in PBN during tail pinch in each test. (f) Time course of calcium activity in response to tail pinch in each session. (g) Comparison of the averaged fluorescence signal change during tail pinch onset period (0–5 s) in each session. n = 9 mice. One-way ANOVA (F2,16 = 11.46, p=0.0008) with Bonferroni correction. (h) Schematic diagram of bilateral PBN stereotaxic injection of AAV-hSyn-Cre-EGFP or AAV-hSyn-EGFP virus. (i) Representative MOR re-expression in Oprm1KI/KI mice with bilateral AAV-hSyn-Cre-EGFP virus in PBN. Scale bars, 1 mm (left), 200 μm (middle and right). (j) Time course of formalin-induced nocifensive behaviors in control mice (n = 13) and PBN-Cre/Oprm1KI/KI mice (n = 12) with subcutaneous morphine injection (10 mg/kg). (k) Summary of the nocifensive behaviors in phase I (0–10 min) and phase II (10–60 min) of formalin test in control mice (n = 13) and PBN-Cre/Oprm1KI/KI mice (n = 12) with subcutaneous morphine injection (10 mg/kg). Student’s unpaired t-test, t23 = 2.682, p=0.0133 (Phase I); t23 = 2.253, p=0.0341 (Phase II). (l and m) Effects of morphine (10 mg/kg, s.c.) on thermal sensitivity at d7 (l) and mechanical sensitivity at d14 (m) on CFA-induced pain in control mice (n = 11) and PBN-Cre/Oprm1KI/KI mice (n = 9). Two-way ANOVA (l), F1,36 = 2.222, p=0.1448; (m), F8,162 = 4.550, p<0.0001 with Bonferroni correction. (n and o) Pain tests for thermal and mechanical sensitivities during CFA-induced inflammatory pain in PBN-EGFP/Oprm1KI/KI and PBN-Cre/Oprm1KI/KI mice. n = 7 mice for each group. Two-way ANOVA (n), F7,96 = 0.3247, p=0.9411; (o), F7,96 = 0.8869, p=0.5200 with Bonferroni correction. Data are presented as mean ± SEM; *p<0.05, **p<0.01, ***p<0.001.
-
Figure 7—source data 1
Raw data of the fiberphotometry recording in Oprm1-GCaMP6s mice and behavioral tests in PBN-Cre/Oprm1-KI mice.
- https://cdn.elifesciences.org/articles/55289/elife-55289-fig7-data1-v2.xlsx
Figure 7—figure supplement 1
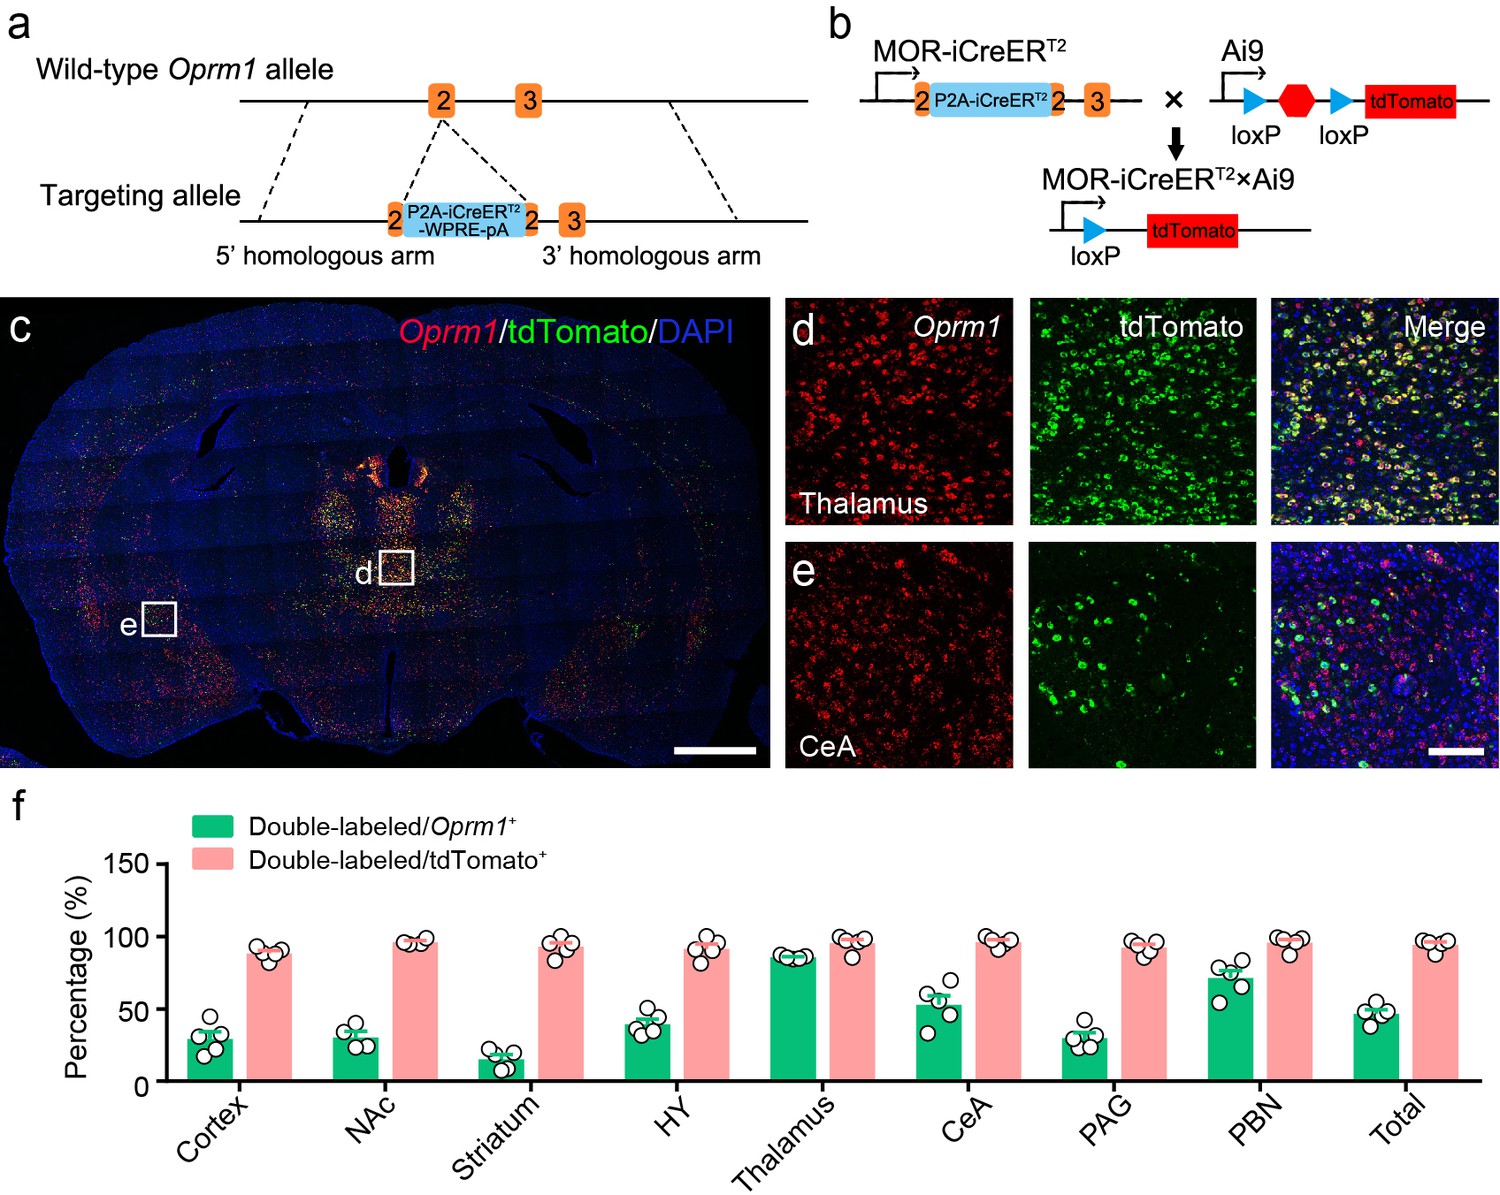
Generation and verification of MOR-iCreERT2 mice.
(a) Targeting strategy for generating MOR-iCreERT2 mice. (b) Schematic diagram for labeling MOR+ neurons. (c–e) Double in situ hybridization in MOR-iCreERT2×Ai9 mice shows the distribution of Oprm1 and tdTomato in brain regions. Scale bars, 1 mm (c), 100 μm (d and e). (f) Percentage of double-labeled neurons in Oprm1+ and tdTomato+ neurons in representative brain regions. n = 5 mice. NAc, nucleus accumbens; HY, hypothalamus; CeA, central amygdala; PAG, periaqueductal gray; PBN, parabrachial nucleus. Data are presented as mean ± SEM.
Figure 7—figure supplement 2
Functional role of MORs expressed in the PBN in morphine analgesia.
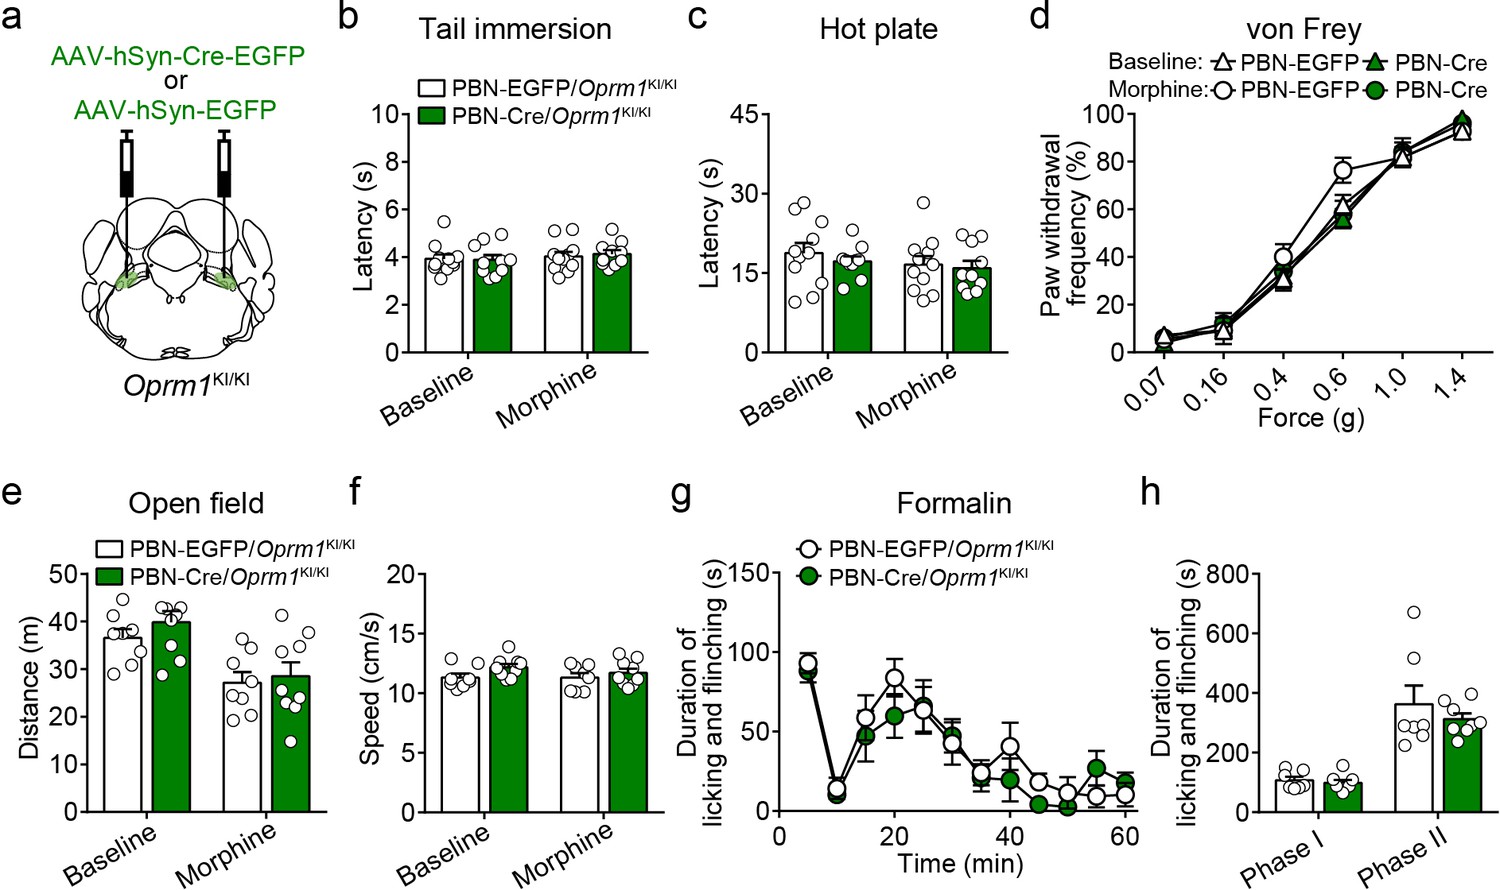
(a) Schematic diagram of bilateral PBN stereotaxic injection of AAV-hSyn-Cre-EGFP or AAV-hSyn-EGFP virus. (b–d) Effects of morphine (10 mg/kg, s.c.) on pain tests with tail immersion (50°C), hot plate (52°C) and von Frey tests in control mice (PBN-EGFP/Oprm1KI/KI, n = 11) and mice in which MOR has been re-expressed in PBN (PBN-Cre/Oprm1KI/KI, n = 10). Two-way ANOVA (b, F1,38 = 0.1441, p=0.7064; (c), F1,38 = 0.08594, p=0.7710; (d), F15,228 = 1.081, p=0.3746 with Bonferroni correction. (e and f) Effects of morphine (10 mg/kg, s.c.) on moving distance and average speed with open field test in PBN-EGFP/Oprm1KI/KI (n = 8) and PBN-Cre/Oprm1KI/KI (n = 9) mice. Two-way ANOVA (distance, F1,30 = 0.1535, p=0.6980; speed, F1,30 = 0.4858, p=0.4912) with Bonferroni correction. (g) Time course of formalin-induced nocifensive behaviors in PBN-EGFP/Oprm1KI/KI (n = 7) and PBN-Cre/Oprm1KI/KI (n = 8) mice. (h) Summary of the nocifensive behaviors in phase I (0–10 min) and phase II (10–60 min) of formalin test in PBN-EGFP/Oprm1KI/KI (n = 7) and PBN-Cre/Oprm1KI/KI (n = 8) mice. Student’s unpaired t-test, t13 = 0.5898, p=0.5654 (Phase I); t13 = 0.8114, p=0.4318 (Phase II). Data are presented as mean ± SEM.
Author response image 1
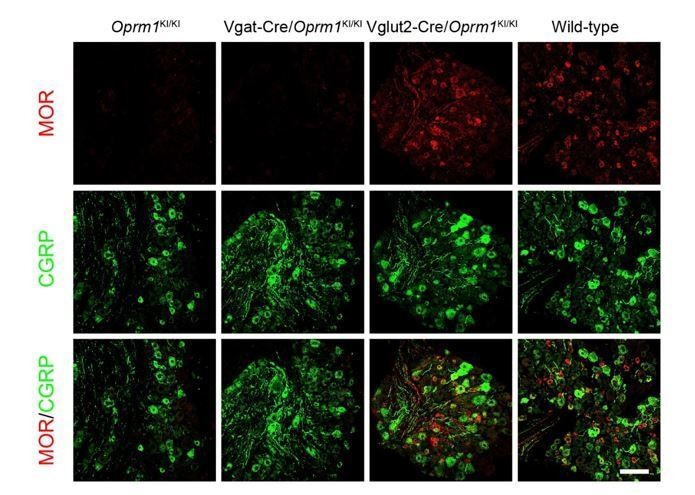
MOR and CGRP staining in DRG of several MOR-rescue mouse lines.
Scale bar, 100 μm.
Videos
Video 1
Intrathecal morphine-induced nocifensive behaviors in Vgat-Cre/Oprm1KI/KI mice.
Left, Oprm1KI/KI mice. Right, Vgat-Cre/Oprm1KI/KI mice. Morphine (1.0 nmol/ 5 μl) was intrathecally injected.
Tables
Key resources table
| Reagent type (species) or resource | Designation | Source or reference | Identifiers | Additional information |
|---|---|---|---|---|
| Genetic reagent (Mus. musculus) | Oprm1KI/KI | This paper | See Figure 2a | |
| Genetic reagent (Mus. musculus) | Oprm1fl/fl | This paper and Zhang et al., 2020 | See Figure 3—figure supplement 2a | |
| Genetic reagent (Mus. musculus) | MOR-iCreERT2 | This paper | See Figure 7—figure supplement 1a | |
| Genetic reagent (Mus. musculus) | B6.Cg-Tg(Nes-cre)1Kln/J (Nestin-Cre) | Jackson Laboratory | Stock#: 003771 RRID:MGI:2174506 | |
| Genetic reagent (Mus. musculus) | STOCK Slc17a6tm2(cre)Lowl/J (Vglut2-ires-Cre) | Jackson Laboratory | Stock#: 016963 RRID:MGI:5300532 | |
| Genetic reagent (Mus. musculus) | STOCK Slc32a1tm2(cre)Lowl/J (Vgat-ires-Cre) | Jackson Laboratory | Stock#: 016962 RRID:MGI:5300525 | |
| Genetic reagent (Mus. musculus) | B6.Cg-Gt(ROSA)26Sortm9(CAG-tdTomato)Hze/J (Ai9) | Jackson Laboratory | Stock#: 007909 RRID:MGI:3813511 | |
| Genetic reagent (Mus. musculus) | Lbx1-Cre | Sieber et al., 2007 | Dr. Yang Liu (Hangzhou Normal University) | |
| Genetic reagent (Mus. musculus) | SNS-Cre | Agarwal et al., 2004 | Dr. Rohini Kuner (University of Heidelberg) | |
| Genetic reagent (Mus. musculus) | C57BL/6J | SLAC Laboratory | ||
| Ggenetic reagent (Dependoparvovirus) | AAV2/9-hSyn-DIO-GCaMP6s-EYFP | Shanghai Taitool Inc | 4.60 × 10¹² v.g./ml | |
| Genetic reagent (Dependoparvovirus) | AAV2/9-Ef1α-DIO-EYFP | Shanghai Taitool Inc | 3.83 × 10¹² v.g./ml | |
| Genetic reagent (Dependoparvovirus) | AAV2/8-hSyn-Cre-EGFP | Shanghai Taitool Inc | 5.99 × 10¹² v.g./ml | |
| Genetic reagent (Dependoparvovirus) | AAV2/8-hSyn-EGFP | Shanghai Taitool Inc | 4.66 × 10¹² v.g./ml | |
| Antibody | Anti-Mu Opioid Receptor antibody (Rabbit Monoclonal) | Abcam | Cat#: ab134054 | 1:500 for brain and spinal cord, 1:1000 for DRG |
| Antibody | Anti-CGRP (Goat Polyclonal) | Abcam | Cat#: ab36001 RRID:AB_725807 | 1:500 |
| Antibody | anti-c-Fos (Rabbit Polyclonal) | Synaptic System | Cat#: 226003 RRID:AB_2231974 | 1:15000 |
| Antibody | FITC-IB4 | Sigma | Cat#: L2895 | 1:200 |
| Antibody | Anti-GAD67 (Mouse Monoclonal) | Millipore | Cat#: MAB5406 RRID:AB_2278725 | 1:2000 |
| Antibody | Anti-VGluT2 (Guinea pig Polyclonal) | Millipore | Cat#: AB2251-I RRID:AB_2665454 | 1:500 |
| Antibody | Cy5 AffiniPure Donkey Anti-Goat IgG (H+L) | Jackson ImmunoResearch Laboratories | Cat#: 705-175-147 RRID:AB_2340415 | 1:200 |
| Antibody | Cy3 AffiniPure Donkey Anti-Rabbit IgG (H+L) | Jackson ImmunoResearch Laboratories | Cat#: 711-165-152 RRID:AB_2307443 | 1:200 |
| Antibody | Alexa Fluor 488 AffiniPure Donkey Anti-Rabbit IgG (H+L) | Jackson ImmunoResearch Laboratories | Cat#: 711-545-152 RRID:AB_2313584 | 1:200 |
| Antibody | Biotin-SP AffiniPure Goat Anti-Rabbit Polyclonal IgG (H+L) | Jackson ImmunoResearch Laboratories | Cat#: 111-065-003 RRID:AB_2337959 | 1:200 |
| Antibody | Alexa Fluor 488 AffiniPure Donkey Anti-Mouse IgG (H+L) | Jackson ImmunoResearch Laboratories | Cat#: 715-545-150 RRID:AB_2340846 | 1:200 |
| Antibody | Alexa Fluor 647 AffiniPure Donkey Anti-Guinea Pig IgG (H+L) | Jackson ImmunoResearch Laboratories | Cat#: 706-605-148 RRID:AB_2340476 | 1:200 |
| Sequence-based reagent | RNAscope Probe- Oprm1-O3 | Advanced Cell Diagnostics | Cat#: 493251 | |
| Sequence-based reagent | RNAscope Probe-tdTomato-C3 | Advanced Cell Diagnostics | Cat#: 317041 | |
| Sequence-based reagent | RNAscope Probe- Slc32a1-C2 (Vgat) | Advanced Cell Diagnostics | Cat#: 319191 | |
| Sequence-based reagent | RNAscope Probe- Slc17a6-C3 (Vglut2) | Advanced Cell Diagnostics | Cat#: 319171 | |
| Sequence-based reagent | RNAscope Probe- Slc17a7-C3 (Vglut1) | Advanced Cell Diagnostics | Cat#: 416631 | |
| Sequence-based reagent | RNAscope Probe- 3-Plex Negative Control | Advanced Cell Diagnostics | Cat#: 320871 | |
| Commercial assay or kit | VECTASTAIN ABC-Peroxidase Kit | Vector | Cat#: PK-4000 RRID:AB_2336818 | 1:100 |
| Commercial assay or kit | RNAscope Multiplex Fluorescent Reagent Kit v2 | Advanced Cell Diagnostics | Cat#: 323100 | |
| Chemical compound, drug | CFA | Sigma | Cat#: F5881 | 50% (vol/vol) |
| Chemical compound, drug | Formaldehyde | Sigma | Cat#: F1635 | 5% (vol/vol) |
| Chemical compound, drug | Tamoxifen | Sigma | Cat#: T5648 | 150 mg/kg |
| Chemical compound, drug | β-FNA | Tocris | Cat#: 0926 | 10 mg/kg |
| Chemical compound, drug | Red beads | Lumaflour | Cat#: Retrobeads IX | 1:10 diluted in PBS |
| Software, algorithm | Image J | NIH | ||
| Software, algorithm | LabState | Anilab | ||
| Software, algorithm | Fscope | BiolinkOptics |
Additional files
-
Source code 1
Code for scorevideo.
- https://cdn.elifesciences.org/articles/55289/elife-55289-code1-v2.m
-
Source code 2
Code for fiber photometry.
- https://cdn.elifesciences.org/articles/55289/elife-55289-code2-v2.m
-
Transparent reporting form
- https://cdn.elifesciences.org/articles/55289/elife-55289-transrepform-v2.docx
Download links
A two-part list of links to download the article, or parts of the article, in various formats.
Downloads (link to download the article as PDF)
Open citations (links to open the citations from this article in various online reference manager services)
Cite this article (links to download the citations from this article in formats compatible with various reference manager tools)
Different neuronal populations mediate inflammatory pain analgesia by exogenous and endogenous opioids
eLife 9:e55289.
https://doi.org/10.7554/eLife.55289


