Deciphering the neural signature of human cardiovascular regulation
- Somatosensory and Autonomic Therapy Research, Institute for Neuroradiology, Hannover Medical School, Germany
- Institute of Aerospace Medicine, German Aerospace Center (DLR), Germany
- Chair of Aerospace Medicine, University of Cologne, Germany
Figures
Figure 1 with 2 supplements
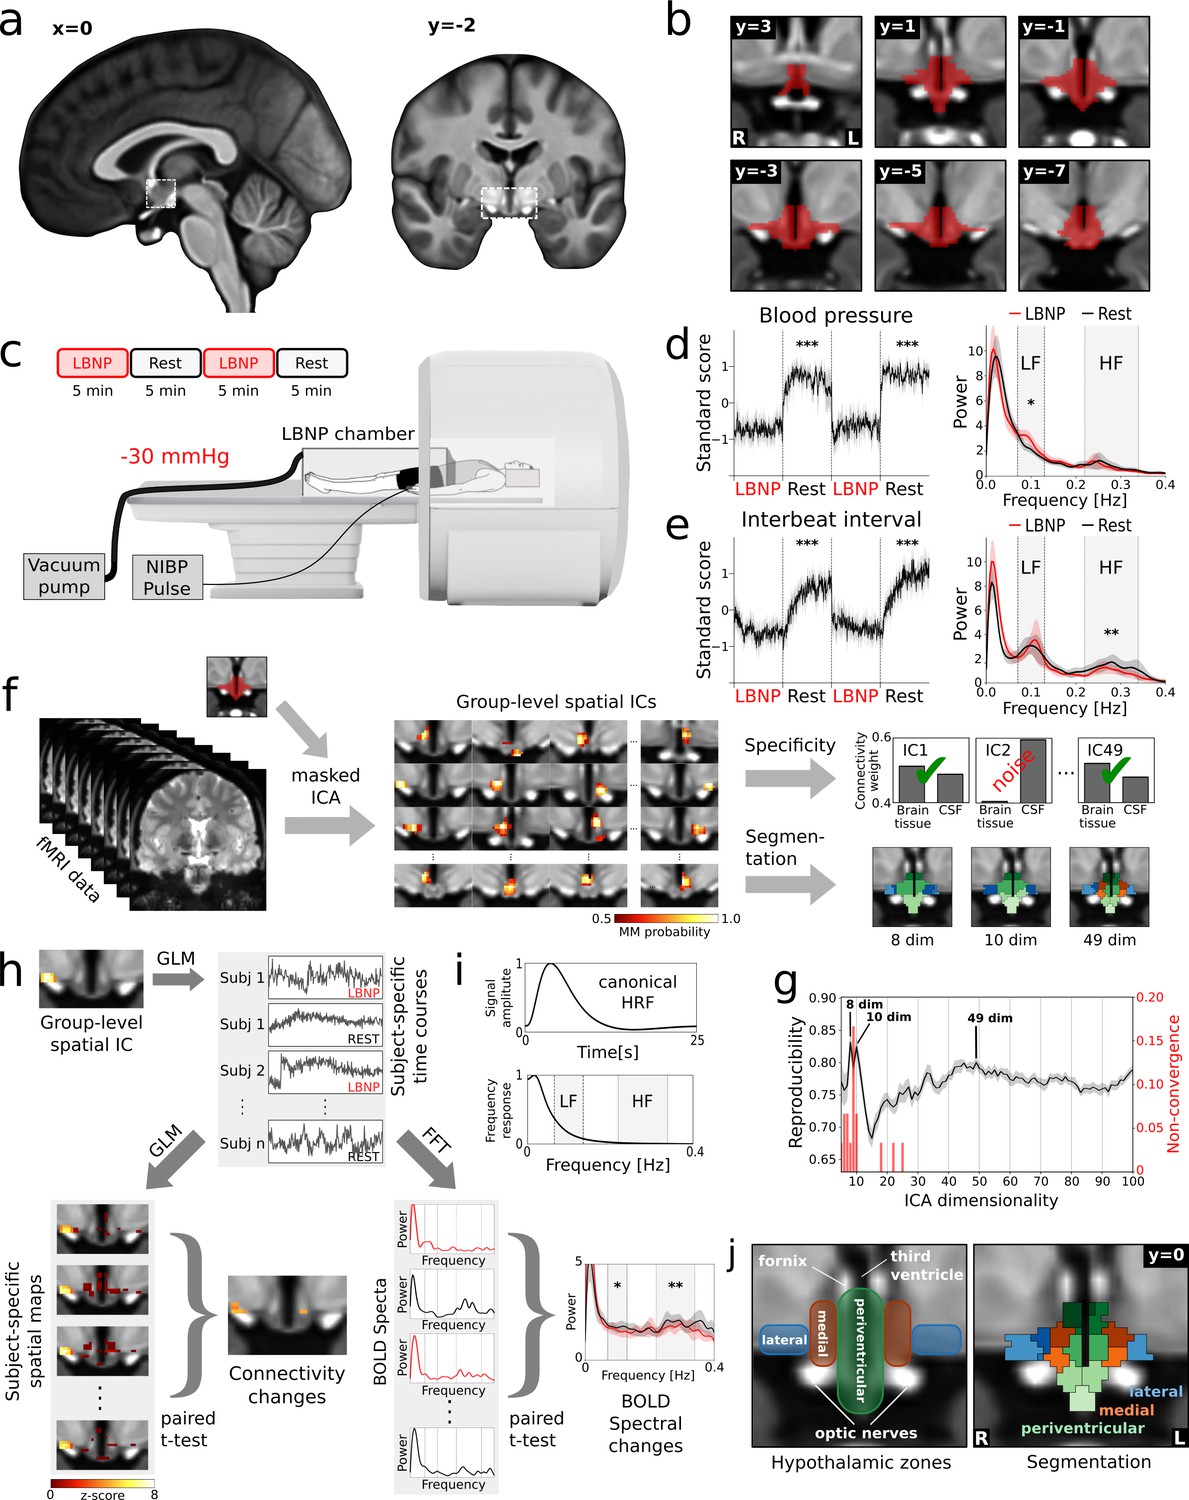
Identification of cardiovascular centres in the human hypothalamus.
(a) Whole-brain T1-weighted study template showing the anatomical localisation of the hypothalamus. (b) Anatomical mask of the hypothalamus. (c) Brain activity was recorded during alternating periods of lower body negative pressure (LBNP) and rest using functional magnetic resonance imaging (fMRI) with concurrent blood pressure and heart rate recordings. (d,e) Average beat-to-beat systolic blood pressure and interbeat interval decreased in response to LBNP (t = −11.4, p<0.001 and t = −4.9, p<0.001 resp.) with (d) blood pressure variability showing an increase of sympathetic low frequency (LF) oscillations (Mayer waves) (t = 2.49, p<0.05) and (e) heart rate variability showing a reduction of parasympathetic high frequency (HF) oscillations (respiratory sinus arrhythmia) (t = 2.92, p<0.01). (f) Spatially independent components (ICs), derived from masked ICA, were tested for specificity and used to segment the hypothalamus into functionally independent regions (see j). (g) The optimal number of ICs was 49 as evidenced by a bootstrap approach that maximised reproducibility (rmean = 0.80 ± 0.01), while penalising ICA non-convergence. (h) Spatial ICs were considered cardiovascular centres, when showing connectivity changes and spectral changes in the LF and/or HF range of the blood oxygenation level dependent (BOLD) signal during LBNP. Both measures were derived from subject-specific time courses either from a general linear model (GLM) or from a fast Fourier transform (FFT). (i) Both the LF and HF bands lie at the top or above the canonical frequency range of the BOLD signal as defined by the haemodynamic response function (HRF). (j) Final segmentation of the hypothalamus after removal of unspecific components showing three functionally distinct anatomical zones as expected from post-mortem anatomical studies (Dudás, 2013). Data in d-e and g-h are presented as mean with 95% confidence interval. All coordinates are in Montreal Neurological Institute (MNI) standard space. *p≤0.05, **p≤0.01, ***p≤0.001.
Figure 1—figure supplement 1

Spatial independent components.
Complete set of specific spatially independent components as used for connectivity-based analyses in this study. Not shown are six components that were identified as noise.
Figure 1—figure supplement 2
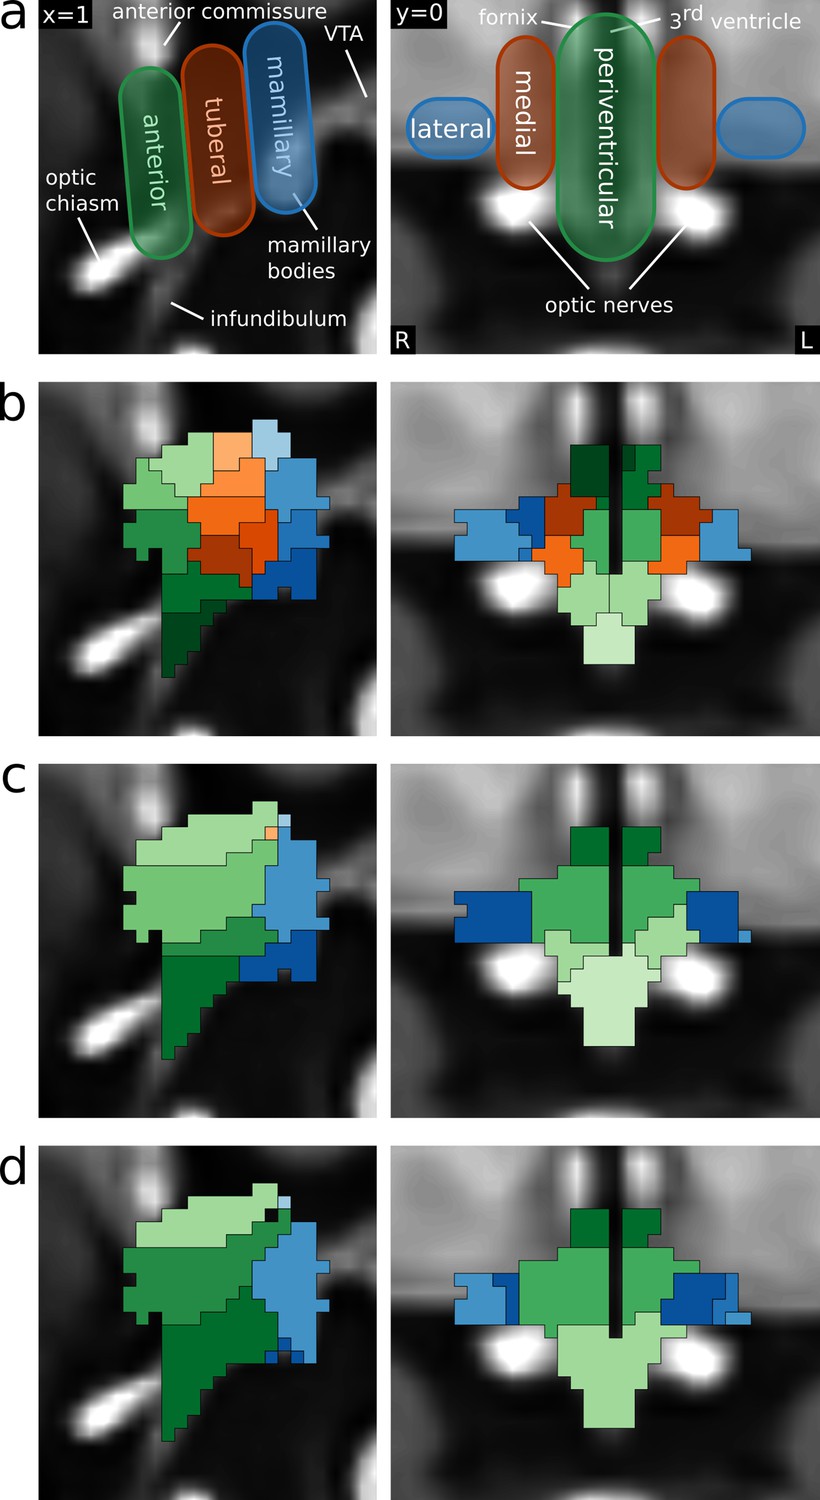
Functional segmentation of the human hypothalamus.
(a) Anatomical subdivisions of the human hypothalamus as based on post-mortem anatomical studies (Dudás, 2013). Left: Hypothalamic regions in ventro-caudal direction. Right: Hypothalamic zones in the medio-lateral direction. (b–d) Segmentations based on independent component analysis of functional MRI data for different dimensionalities. (b) 43-dimensional (49-6) segmentation showing all three regions and zones with further subdivisions in superior-inferior direction. (c) 9-dimensional (10-1) segmentation showing the three regions and two of the three zones. (d) 6-dimensional (8-2) segmentation showing two regions and two zones.
Figure 2 with 5 supplements

Neural signature of cardiovascular control.
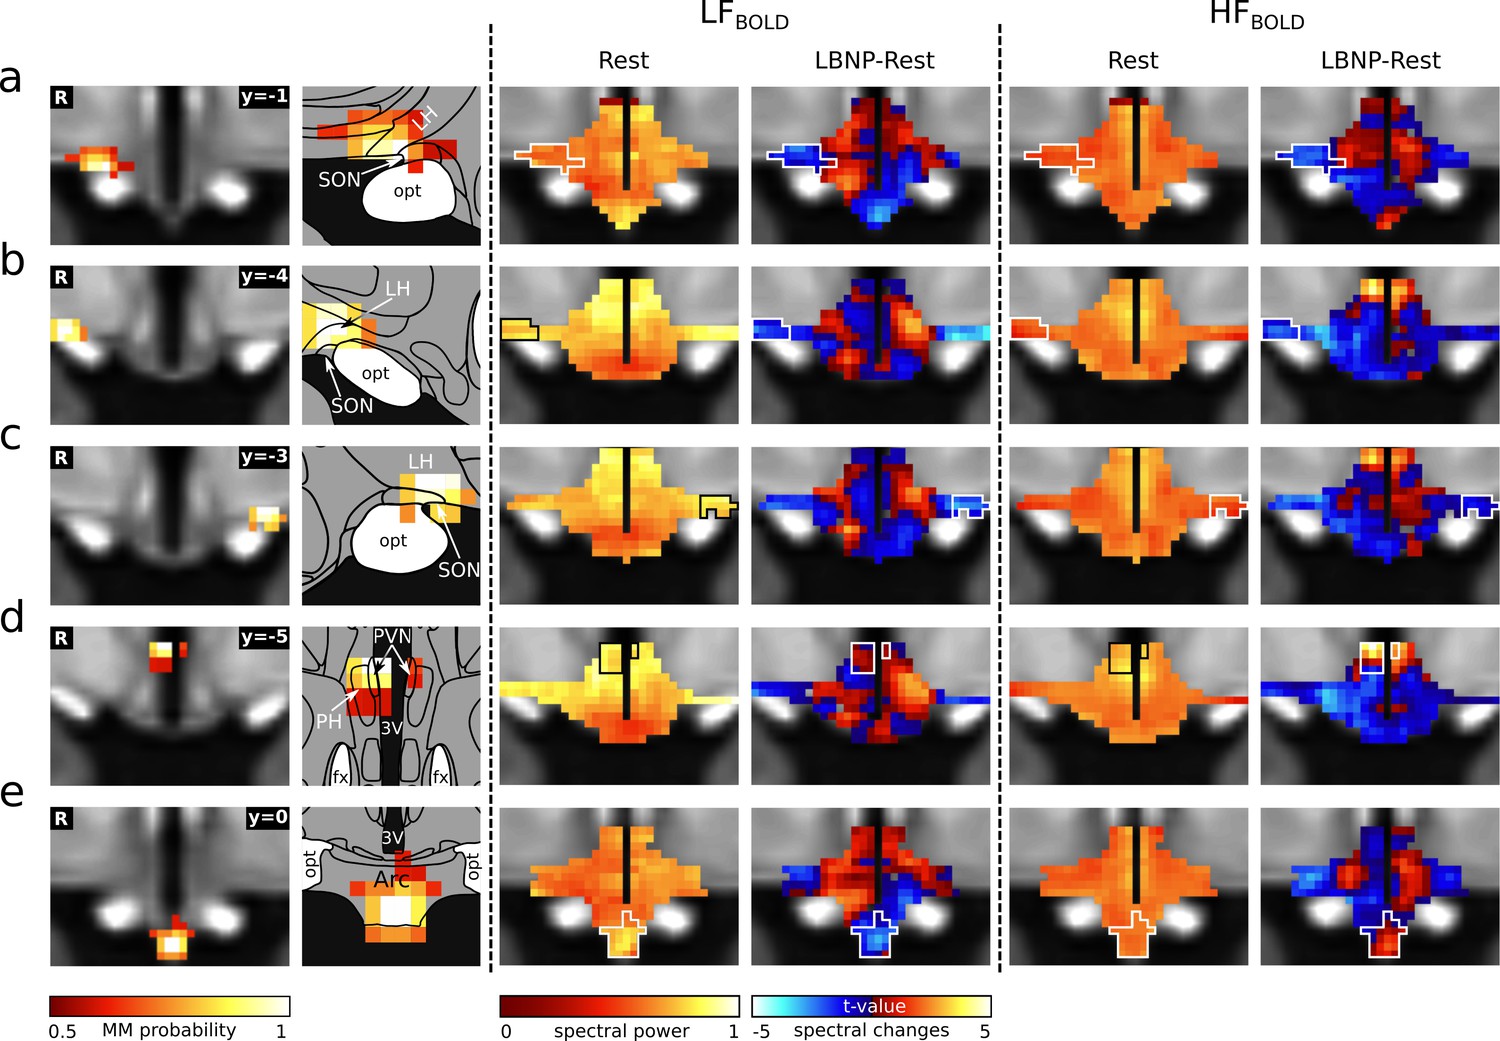
(a–e) Left: Individual hypothalamic centres derived from functional connectivity presented as mixture model thresholded probability maps. Centre: Normalised spectral BOLD signal changes (n = 22, paired t-test, p≤0.05). Right: Functional connectivity (fc) changes to the hypothalamus and lower brainstem (thresholded statistical maps, n = 22, paired t-test, p≤0.05 family-wise error corrected). Warm/cold colours indicate an increase/decrease in fc during LBNP. A hypothalamic system of five regions showed both spectral BOLD and fc changes during LBNP. These cardiovascular centres included (a) the anterior part of the right lateral hypothalamic region (LH)/supraoptic nucleus (SON) showing reduced HF power (t = −2.2, p≤0.05) and increased fc with the dorsal lower brainstem including the nucleus of the solitary tract (NTS); (b–c) the bilateral tuberal part of the LH/SON showing reduced HF (tright = −2.93 pright ≤0.01, tleft = −2.28 pleft ≤0.05) and LF power (tright = −2.24 pright ≤0.05) and increased within-nucleus fc (both sides) as well as reduced fc with the arcuate nucleus (Arc, left side only); (d) the tuberal part of the paraventricular nucleus (PVN) showing increased HF power (t = 2.69, p≤0.05) and reduced within-nucleus fc as well as increased fc with the right lateral lower brainstem including nucleus ambiguus (Amb) and rostral ventrolateral medulla (RVLM); and (e) the Arc showing reduced LF power (t = −2.05, p≤0.05) and increased fc with the dorsal and midline lower brainstem including the NTS, dorsal motor nucleus of the vagal nerve (DMN) and nucleus raphe obscurus (ROb). (f) T1-weighted study template showing slice localisation in the hypothalamus and brainstem. Spectral data in a-e are presented as mean with 95% confidence interval. All coordinates are in Montreal Neurological Institute (MNI) standard space. Atlas slices modified after Mai et al., 2016 and Paxinos et al., 2012 (with permission from the authors). *p≤0.05, **p≤0.01. Abbreviations: 3V, third ventricle; 4V, fourth ventricle; DPGi, Dorsal paragigantocellular nucleus; DMN, dorsal motor nucleus; fc, functional connectivity; fx, fornix; Hyp, hypoglossal nucleus; IO, inferior olivary nucleus; IRt, intermediate reticular nucleus; MdRt, medullary reticular nucleus; opt, optic tract; PCRt, parvicellular reticular nucleus; PH, posterior hypothalamic area; Sp5, spinal trigeminal nucleus.
© 2016 Academic Press. All rights reserved. Atlas slices modified from Mai et al., 2016. They are not covered by the CC-BY 4.0 licence and further reproduction of this panel would need permission from the copyright holder.
© 2012 Academic Press. All rights reserved. Atlas slices modified from Paxinos et al., 2012. They are not covered by the CC-BY 4.0 licence and further reproduction of this panel would need permission from the copyright holder.
Figure 2—figure supplement 1
Cardiovascular rhythms in the hypothalamus.
Left: Cardiovascular centres in the hypothalamus defined by functional connectivity (Figure 2). (a) right anterior right LH/SON; (b–c) bilateral tuberal LH/SON; (d) tuberal PVN; (e) arcuate nucleus. Centre: Spatial maps of BOLD power spectral density in the low frequency band (LFBOLD) at rest (group median, normalised to total power) and its change during cardiovascular challenge (t-values from paired t-test). Right: Respective maps for high frequency (HFBOLD). With the exception of the arcuate nucleus, LFBOLD showed a superior-inferior gradient with higher spectral powers occurring in the superior part. In contrast, HFBOLD showed a medio-lateral gradient with higher spectral powers occurring in the periventricular region. As expected, many connectivity-derived centres coincided with local foci of BOLD spectral changes. Atlas slices modified from Mai et al., 2016 (with permission from the authors). Abbreviations: 3V, third ventricle; Arc, arcuate nucleus; LBNP, lower body negative pressure; LH, lateral hypothalamic area; fx, fornix; opt, optic tract; PH, posterior hypothalamic area; PVN, paraventricular nucleus; SON, supraoptic nucleus.
© 2016 Academic Press. All rights reserved. Atlas slices modified from Mai et al., 2016. They are not covered by the CC-BY 4.0 licence and further reproduction of this panel would need permission from the copyright holder.
Figure 2—figure supplement 2
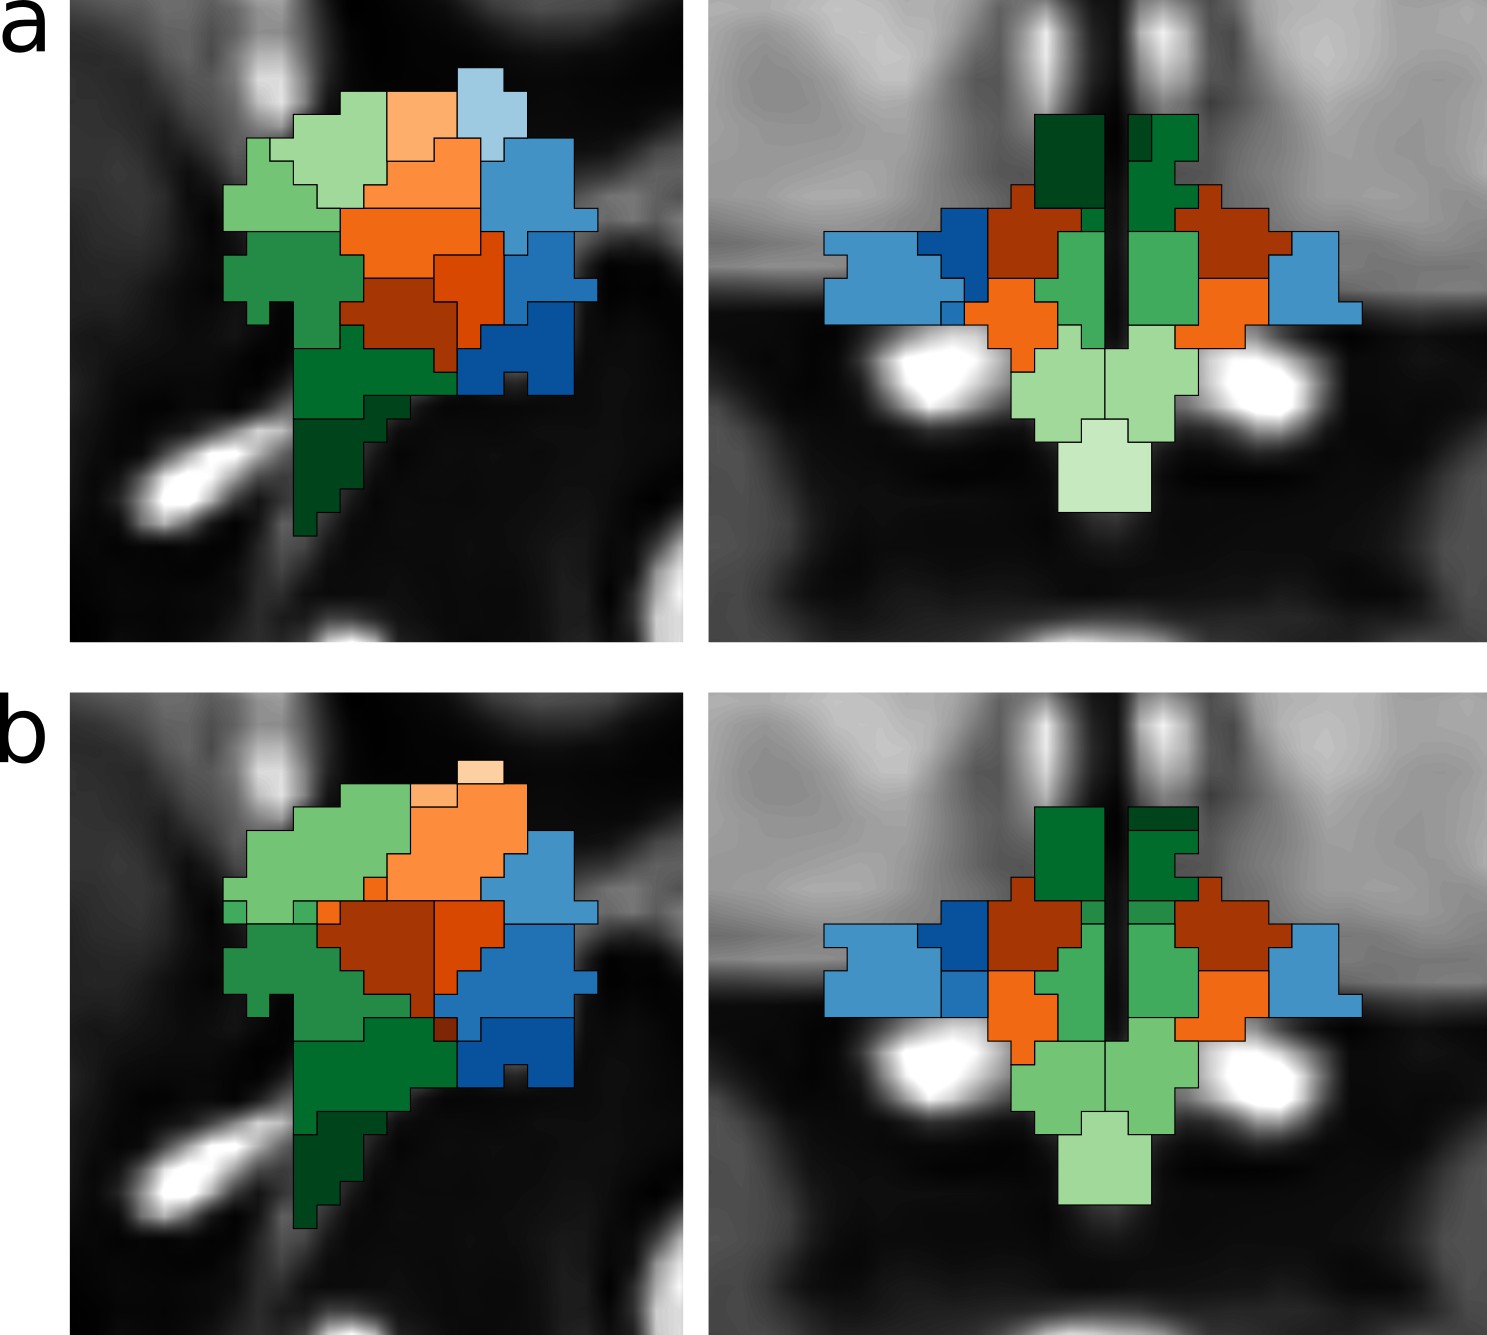
Functional segmentation of the human hypothalamus without and with physiological noise regression.
Segmentation is based on a masked independent component analysis of functional MRI data. The components were coloured to highlight the anatomical subdivisions of the human hypothalamus (Figure 1—figure supplement 2), (a) 43-dimensional segmentation (49-6) without physiological noise modeling (PNM). (b) 41-dimensional (49-8) segmentation after PNM.
Figure 2—figure supplement 3
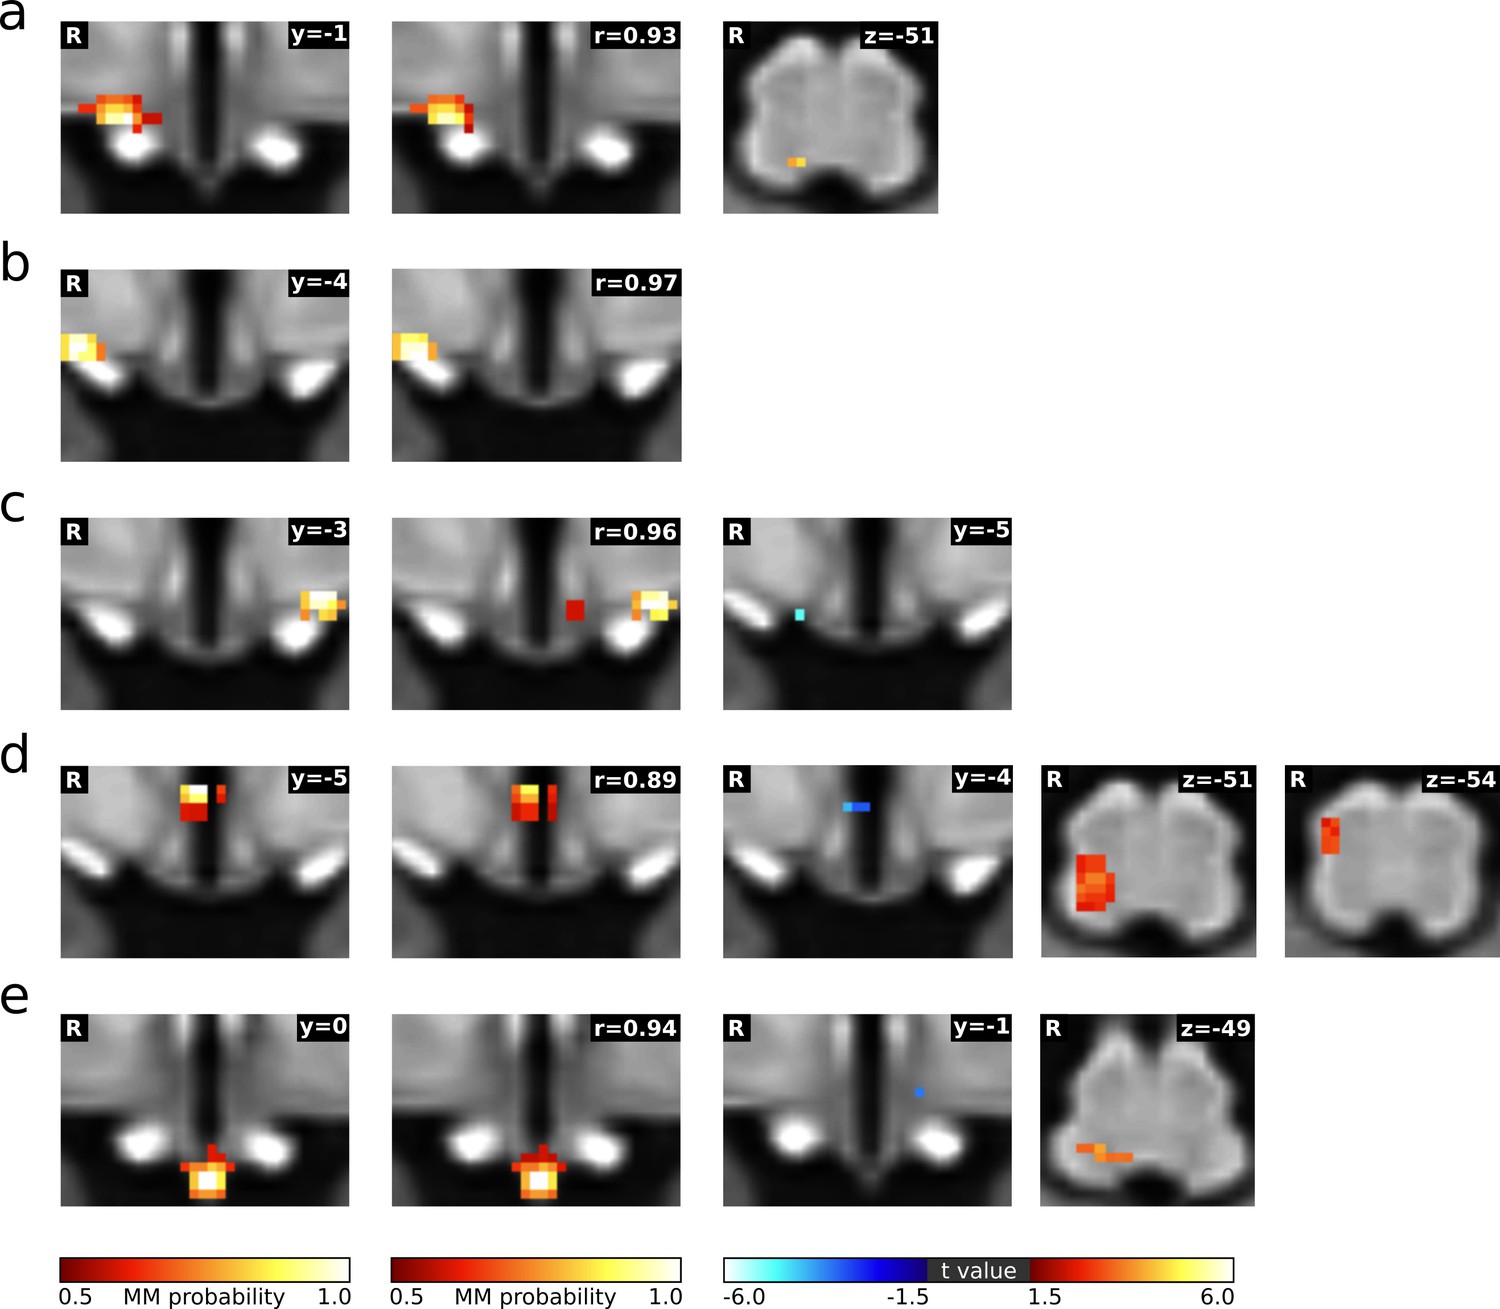
Functional connectivity changes during LBNP after physiological noise regression.
(a–e) First column: Individual cardiovascular hypothalamic regions presented as mixture model thresholded probability maps as derived from the main analysis (Figure 2). Second column: matched independent components after physiological noise modelling (PNM). The spatial correlation value is depicted on the top right corner. Third to fifth column: Functional connectivity changes to the hypothalamus and lower brainstem (thresholded statistical maps, n = 22, paired t-test, p≤0.05 family-wise error corrected with TFCE). Warm/cold colours indicate an increase/decrease in functional connectivity during LBNP.
Figure 2—figure supplement 4
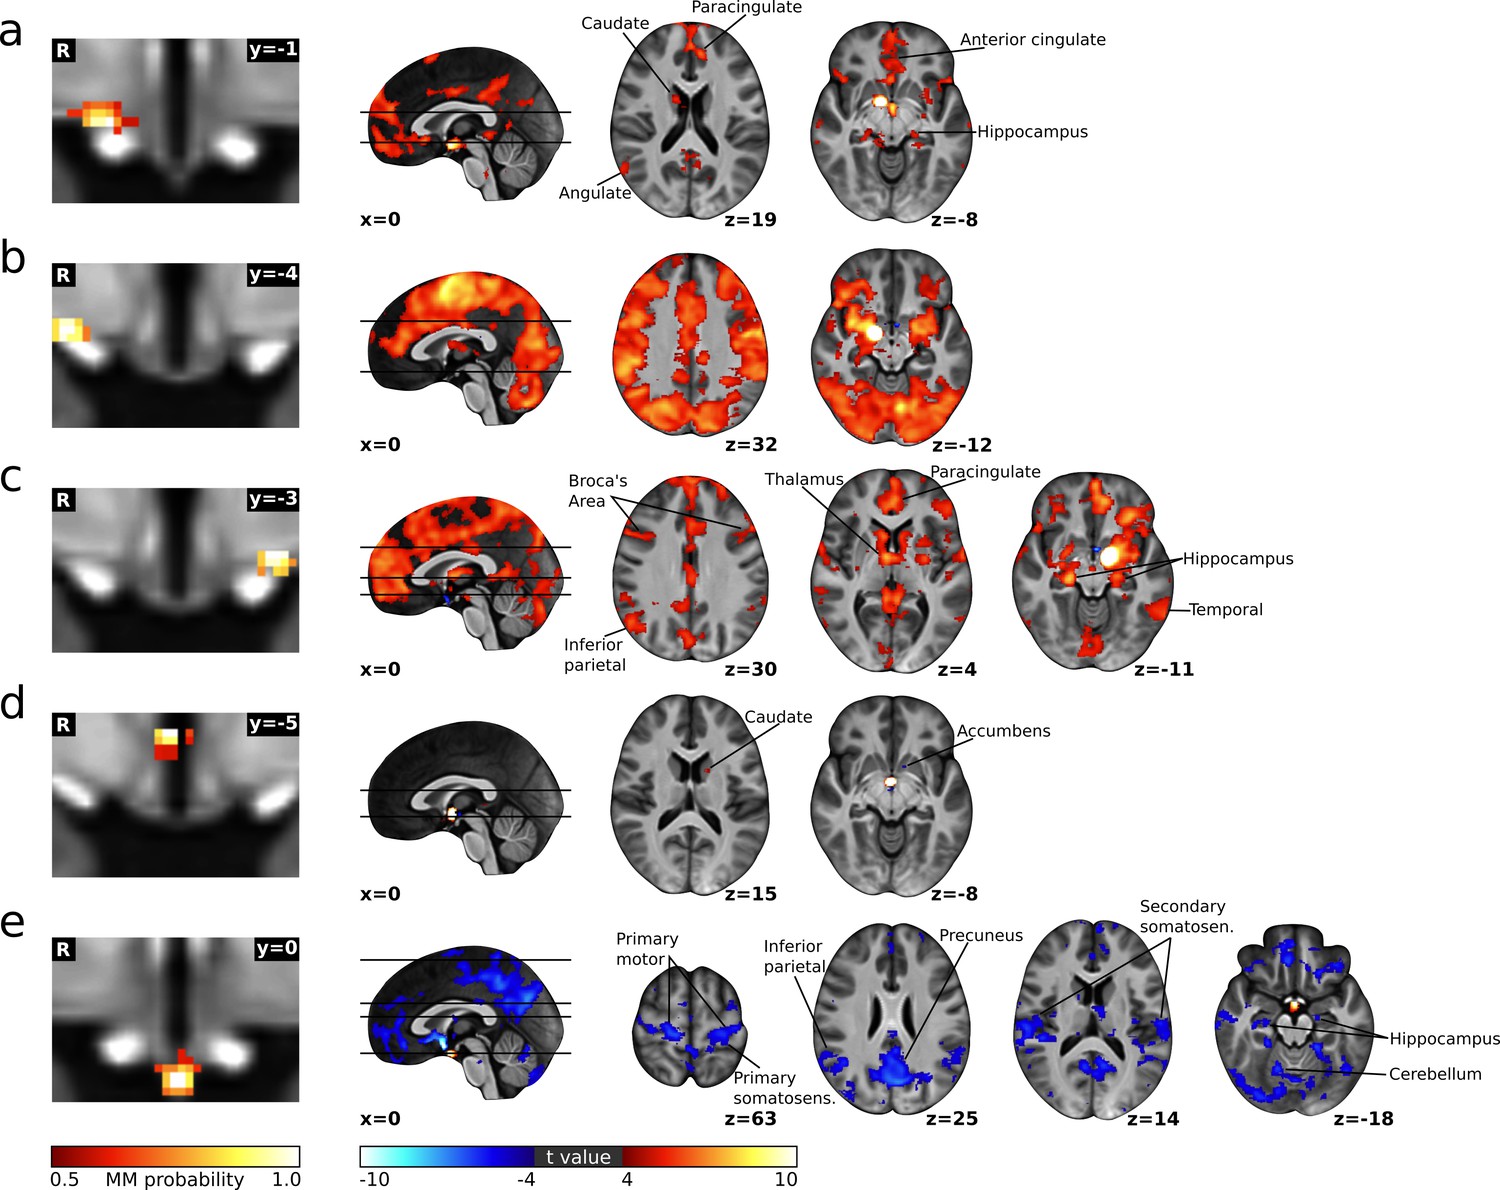
Cortical connectivity of the cardiovascular hypothalamic regions.
(a–e) Left: Individual cardiovascular hypothalamic regions presented as mixture model thresholded probability maps. Right: functional connectivity maps of the respective region, calculated using dual regression and a non-parametric one sample t-test thresholded at p<0.05 with voxel-wise family wise error (FWE) correction.
Figure 2—figure supplement 5
Comparison of the hypothalamic cardiovascular regions identified in this study and by Li and Dampney, 1994.
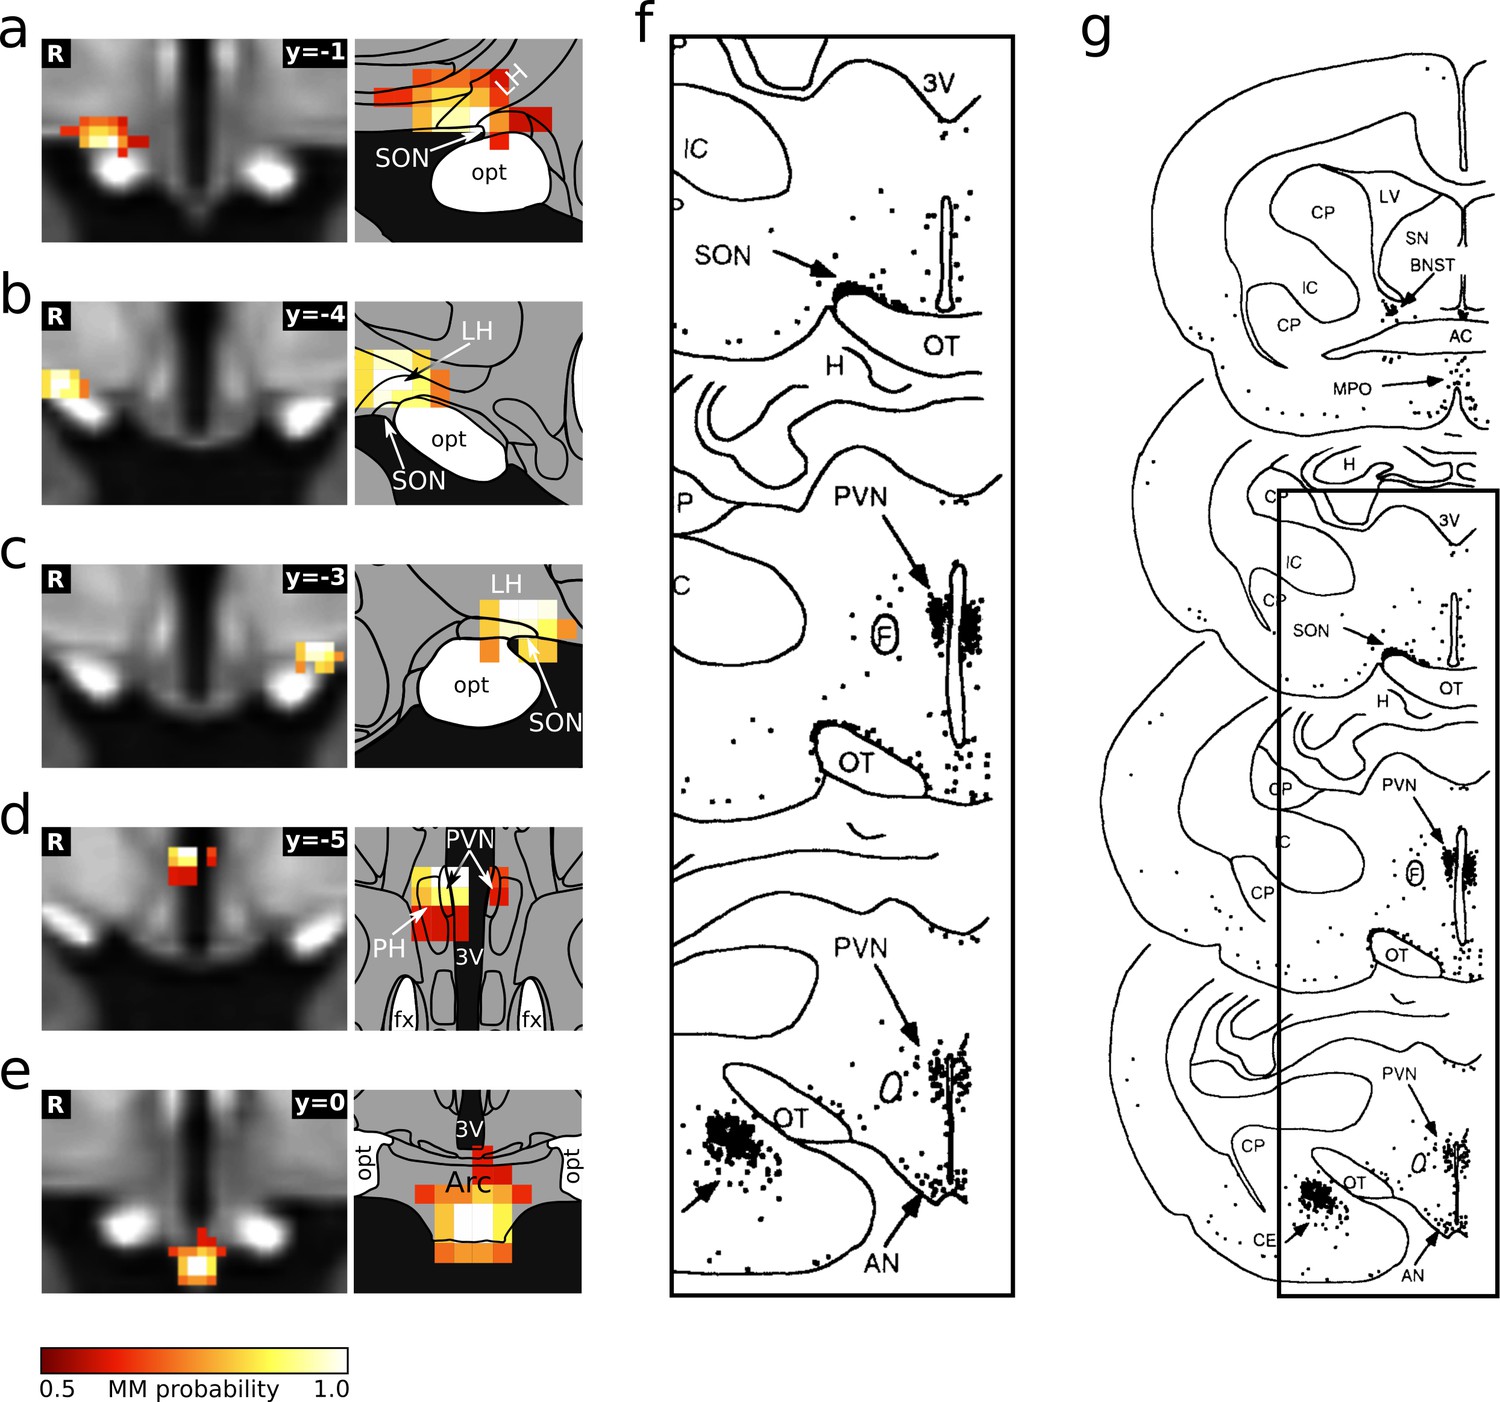
(a–e) Individual hypothalamic centres derived from functional connectivity presented as mixture model thresholded probability maps. These five centres fulfilled both criteria for cardiovascular involvement. Atlas slices modified from Mai et al., 2016. (f) Distribution of Fos-positive neurones after prolonged hypotension in conscious rabbits. (g) Originial figure with marked cut out region (reprinted from Li and Dampney, 1994).
© 1994 Elsevier. All rights reserved. Panel G reprinted from Li and Dampney, 1994. They are not covered by the CC-BY 4.0 licence and further reproduction of this panel would need permission from the copyright holder.
© 2016 Academic Press, Elsevier. All rights reserved. Atlas slices modified from Mai et al., 2016. They are not covered by the CC-BY 4.0 licence and further reproduction of this panel would need permission from the copyright holder.
Figure 3 with 1 supplement

PVN/PH as a hub in cardiovascular regulation.
(a) Three of the five hypothalamic cardiovascular centres derived from functional connectivity (Figure 2), namely PVN/PH (top), anterior LH/SON (middle), and arcuate nucleus (bottom) were also detected by low-dimensional independent component analysis (ICA) (b). Here, both LH/SON and arcuate components included portions of the PVN/PH and adjacent nuclei, such as the dorsomedial hypothalamic nucleus (DMH), indicating an important role of this region in cardiovascular regulation. For comparison, white lines in the coronal (b) and sagittal slices (d) indicate the outline of the high-dimensional PVN/PH component. In addition, the anterior LH/SON (middle) showed a bilateral symmetric shape in contrast to its strictly unilateral appearance in the original analysis. (c,e) T1-weighted study template showing slice localisation in the hypothalamus. All independent components are presented as mixture model thresholded probability maps. All coordinates are in Montreal Neurological Institute (MNI) standard space. Atlas slices modified after Mai et al., 2016 (with permission from the authors). Abbreviations: 3V, third ventricle; Arc, arcuate nucleus; DMH, dorsomedial hypothalamic nucleus; fx, fornix; PVN, paraventricular nucleus; PH, posterior hypothalamic area; VMH, ventromedial hypothalamic nucleus.
© 2016 Academic Press, Elsevier. All rights reserved. Atlas slices modified from Mai et al., 2016. They are not covered by the CC-BY 4.0 licence and further reproduction of this panel would need permission from the copyright holder.
Figure 3—figure supplement 1

RVLM/Amb cluster increases functional connectivity to NTS during LBNP.
(a) Hypothalamic component encompassing the paraventricular nucleus and the posterior hypothalamic area. (b) Detail of the connectivity changes of (a) during LBNP that includes the rostral ventrolateral medulla (RVLM) and the nucleus ambiguus (Amb). (c) Component of a 60-dimensional independent component analysis (mICA) in the medulla that best matches the cluster in (b). The mICA dimensionality was derived by test-retest reproducibility analysis using repetitive split-half samplings. Overlap between the ICs and the RVLM cluster was assessed with the help of the correlation coefficient. (d) Functional connectivity increase of (c) in the medulla during LBNP. Atlas slice modified from Paxinos et al., 2012 (with permission from the authors). Abbreviations: 4V, fourth ventricle; NTS, nucleus of the solitary tract.
© 2012 Academic Press, Elsevier. All rights reserved. Atlas slices modified from Paxinos et al., 2012. They are not covered by the CC-BY 4.0 licence and further reproduction of this panel would need permission from the copyright holder.
Figure 4

Central cardiovascular network.
Summary of the network nodes and links in the hypothalamus (a) and lower medulla oblongata (up until the level of the vagal nerve root) (b) as defined by functional connectivity. The central cardiovascular network in humans comprises at least five hypothalamic and five medullary centres. Intra-hypothalamic connectivity emphasised the central role of the PVN/PH in cardiovascular regulation thus confirming results obtained in animals. Functional connectivity to the medulla oblongata was observed for three hypothalamic nuclei (c–e). Of these, the PVN/PH was connected to the ‘textbook’ baroreflex system (c) comprising the RVLM, Amb, and NTS (emphasised in red font). This system is known to be driven by baroreceptor input and regulate blood pressure by vascular and cardiac sympathetic, cardiovagal, and endocrine mechanisms (vasopressin and oxytocin release). In our experiment, it was strictly lateralised to the right medulla. (d) The second functional network connected the right anterior LH/SON with an ipsilateral medullary centre compatible with the NTS extending into DMN and PCRt. Projections of the LH to the NTS and DMN are well-established and mostly orexinergic, while likewise well-established projections from the NTS to the SON could trigger the release of vasoactive hormones from the pituitary gland. (e) The third and most widespread network emerged from the arcuate nucleus and comprised three distinct medullary regions: the left NTS and DMN, the midline ROb, and a large region in the right dorsal medulla comprising the NTS, DMN and several reticular nuclei. Although this system has received relatively little attention in comparison to the ‘textbook’ baroreflex system, there is clear evidence that the Arc plays an important role in integrating neural and hormonal signals from key cardiovascular organs and controlling sympathetic outflow. Abbreviations: Amb, nucleus ambiguus; Arc, arcuate nucleus; AVP, arginine vasopressin; DPGi, Dorsal paragigantocellular nucleus; DMN, dorsal motor nucleus of the vagal nerve; fx, fornix; Hyp, hypoglossal nucleus; IO, inferior olivary nucleus; IRt, intermediate reticular nucleus; LH, lateral hypothalamic area; MdRt, medullary reticular nucleus; NTS, nucleus of the solitary tract; OXT, oxytocin; PCRt, parvicellular reticular nucleus; PH, posterior hypothalamic area; PVN, paraventricular nucleus; ROb, nucleus raphe obscurus; RVLM, rostral ventrolateral medulla; SON, supraoptic nucleus; Sp5, spinal trigeminal nucleus.
Additional files
-
Supplementary file 1
Hypothalamic regions essential for cardiovascular control.
- https://cdn.elifesciences.org/articles/55316/elife-55316-supp1-v1.docx
-
Supplementary file 2
Medullary regions essential for cardiovascular control.
- https://cdn.elifesciences.org/articles/55316/elife-55316-supp2-v1.docx
-
Supplementary file 3
Coordinates and anatomical identification of spatial independent components.
- https://cdn.elifesciences.org/articles/55316/elife-55316-supp3-v1.docx
-
Supplementary file 4
Coordinates and anatomical identification of dual regression clusters of Figure 2.
- https://cdn.elifesciences.org/articles/55316/elife-55316-supp4-v1.docx
-
Supplementary file 5
Detailed MRI scan protocols.
Note that the reference scans for unwarping (Reference SE (no SMS; AP and PA)) are the same sequence but with inverted phase encoding direction. Hence, they are summarised in one table here. However, both sequences need to be acquired for estimating the susceptibility induced field.
- https://cdn.elifesciences.org/articles/55316/elife-55316-supp5-v1.docx
-
Transparent reporting form
- https://cdn.elifesciences.org/articles/55316/elife-55316-transrepform-v1.docx
Download links
A two-part list of links to download the article, or parts of the article, in various formats.
Downloads (link to download the article as PDF)
Open citations (links to open the citations from this article in various online reference manager services)
Cite this article (links to download the citations from this article in formats compatible with various reference manager tools)
Deciphering the neural signature of human cardiovascular regulation
eLife 9:e55316.
https://doi.org/10.7554/eLife.55316


