Human Fcγ-receptor IIb modulates pathogen-specific versus self-reactive antibody responses in lyme arthritis
- Institute of Genetics, Department of Biology, University of Erlangen-Nuremberg, Germany
- Institute of Medical Microbiology and Hygiene, University Regensburg, Germany
- Laboratory for Cancer Immunotherapy, University Hospital Basel, Switzerland
- Department of Dermatology, Laboratory of Dendritic Cell Biology, University Hospital Erlangen, Germany
- Medical Immunology Campus Erlangen, University of Erlangen-Nuremberg, Germany
- Medical Department 3, University Hospital Erlangen, Germany
Figures
Figure 1
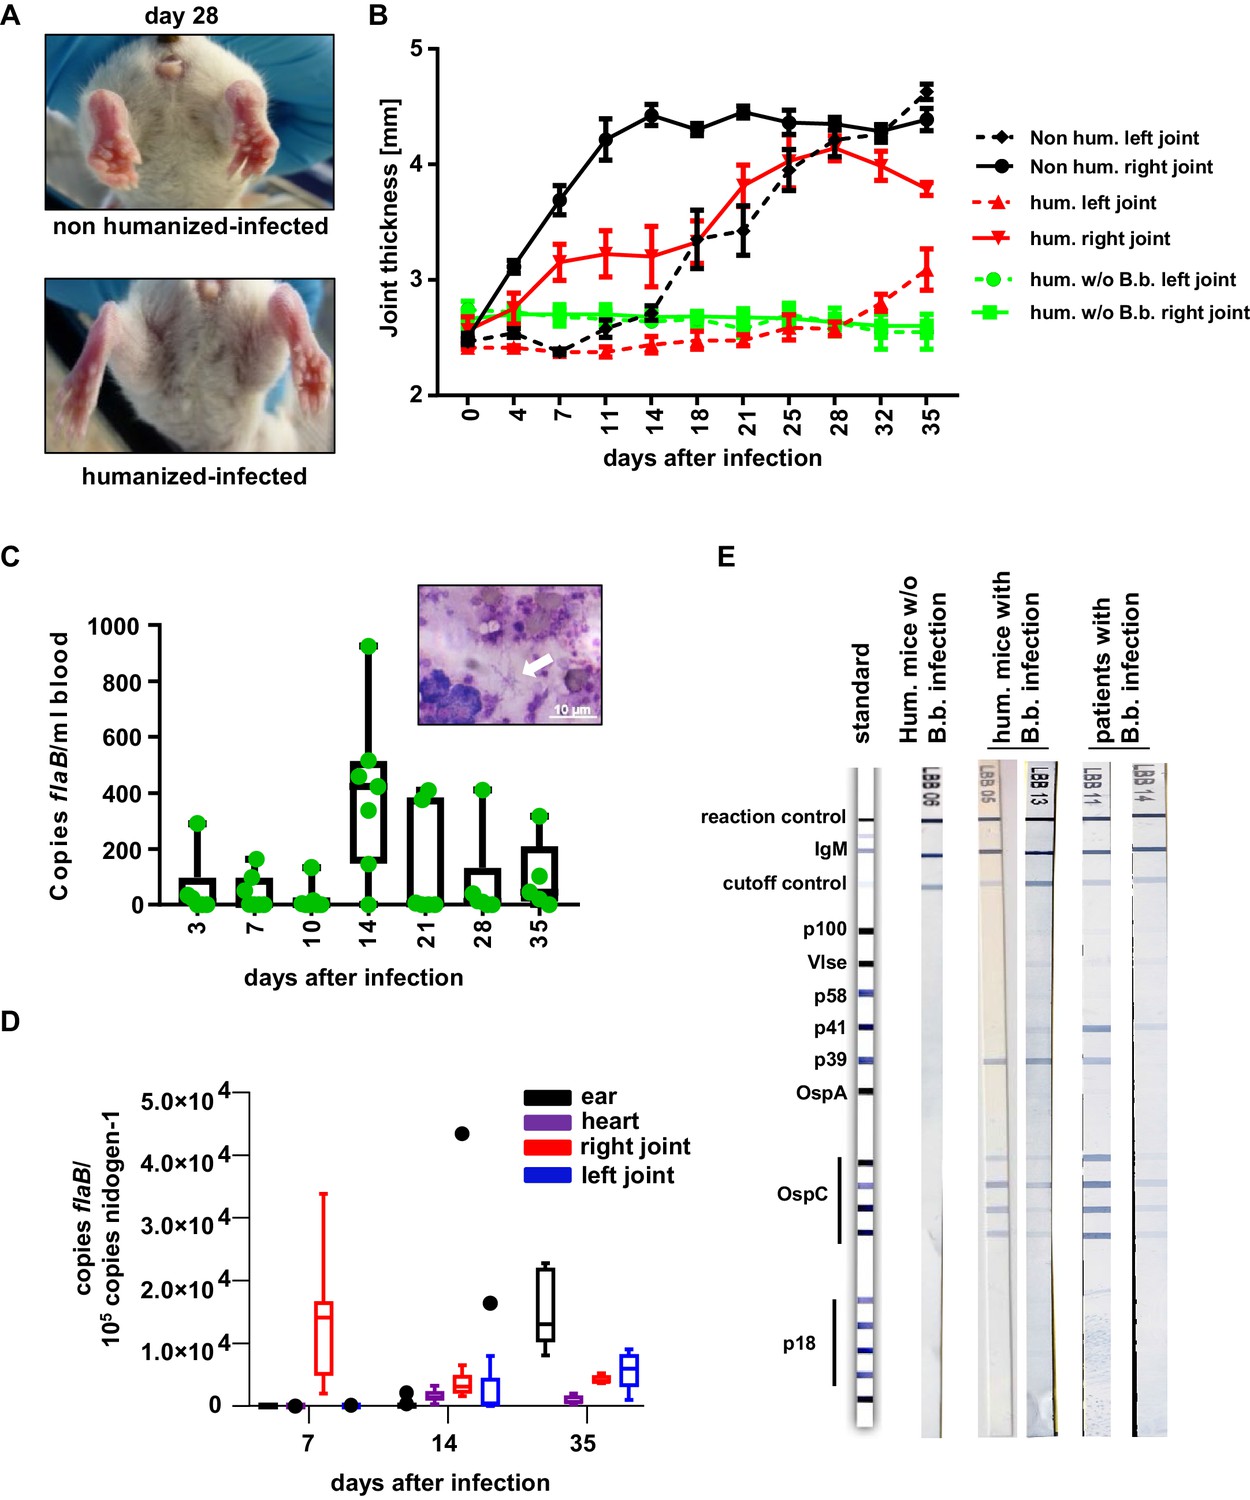
The human immune system controls B. burgdorferi infection.
(A, B) Humanized and non-humanized mice were infected with B. burgdorferi and followed for signs of joint inflammation and pathogen spread. In (A) representative pictures of the hind limbs of non-humanized and humanized mice 28 days after infection are shown. (B) Time course of joint swelling (shown as joint thickness in mm) of the directly infected right (solid lines) and the left ankle joints of non-infected (w/o B.b.) and infected humanized (hum.) and non-humanized (non hum.) mice. Shown is the mean +/- SEM of 6–8 mice per group. Depicted is one representative out of three independent experiments. (C) Quantification of the pathogen load (flaB copy numbers per ml blood) by quantitative PCR in humanized mouse blood at the indicated time points after infection. The graph shows box and whisker plots, with whiskers indicating the minimum and maximum data points. The line in the box indicates the median, the upper and lower border of the box indicates the 25th and 75th percentile of the data points. In addition, the individual data points are depicted. Inset picture shows B. burgdorferi spirochetes (marked with a white arrow) in a blood smear; the white scale bar represents 10 µm. (D) Quantification of B. burgdorferi load in ears, heart, and joints at the indicated time points after infection of humanized mice by quantitative PCR (copies flaB/105 copies nidogen-1). The data is depicted as box and whisker plots (Tukey), with whiskers indicating the minimum and maximum data points. The line in the box indicates the median, the upper and lower border of the box indicates the 25th and 75th percentile of the data points. (E) Shown are representative western blots (detecting IgM) with immobilized B. burgdorferi antigens incubated with serum from humanized mice 35 days post-infection (hum. mice with B.b. infection) or of humanized mice not infected (hum. mice w/o B.b.) with B. burgdorferi. As a comparison serum samples from human patients with confirmed B. burgdorferi infection are depicted.
Figure 2 with 2 supplements
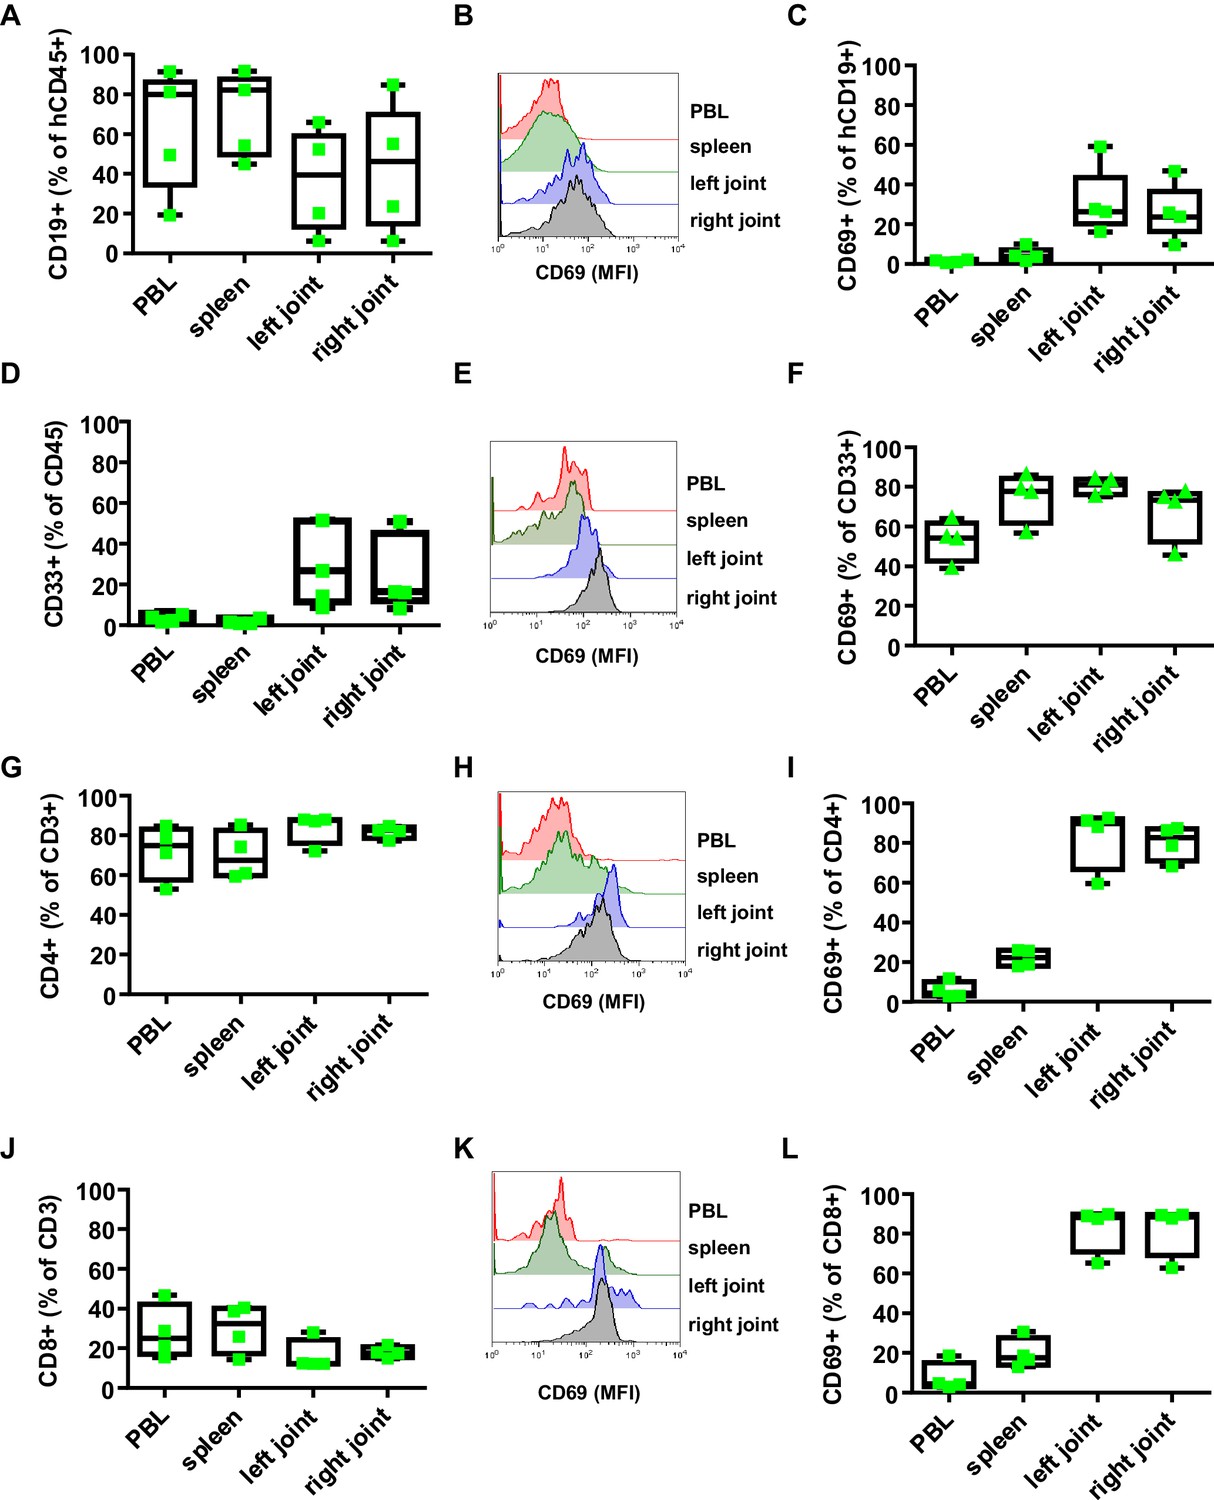
Effect of B. burgdorferi infection on the human immune system in humanized mice.
Shown is the effect of B. burgdorferi infection on the abundance (percentage of all human CD45+ cells) and activation status (CD69 expression) of human CD19+ B cells (A-C), CD33+ myeloid cells (D-F), CD4+ T cells (G-I), and CD8+ T cells (J-L) in the peripheral blood (PBL), spleen, and left and right joints 38 days after infection. Representative FACS plots showing the mean fluorescence intensity (MFI) of CD69 expression on B cells (B), myeloid cells (E), CD4 T cells (H) and CD8 T cells (K) are presented. Depicted are box and whisker plots including all data points. The line in the box indicates the median, the upper and lower border of the box indicates the 25th and 75th percentile of the data points. Whiskers extend to minimum and maximum data points. One representative out of three independent experiments with four mice per group is shown.
Figure 2—figure supplement 1
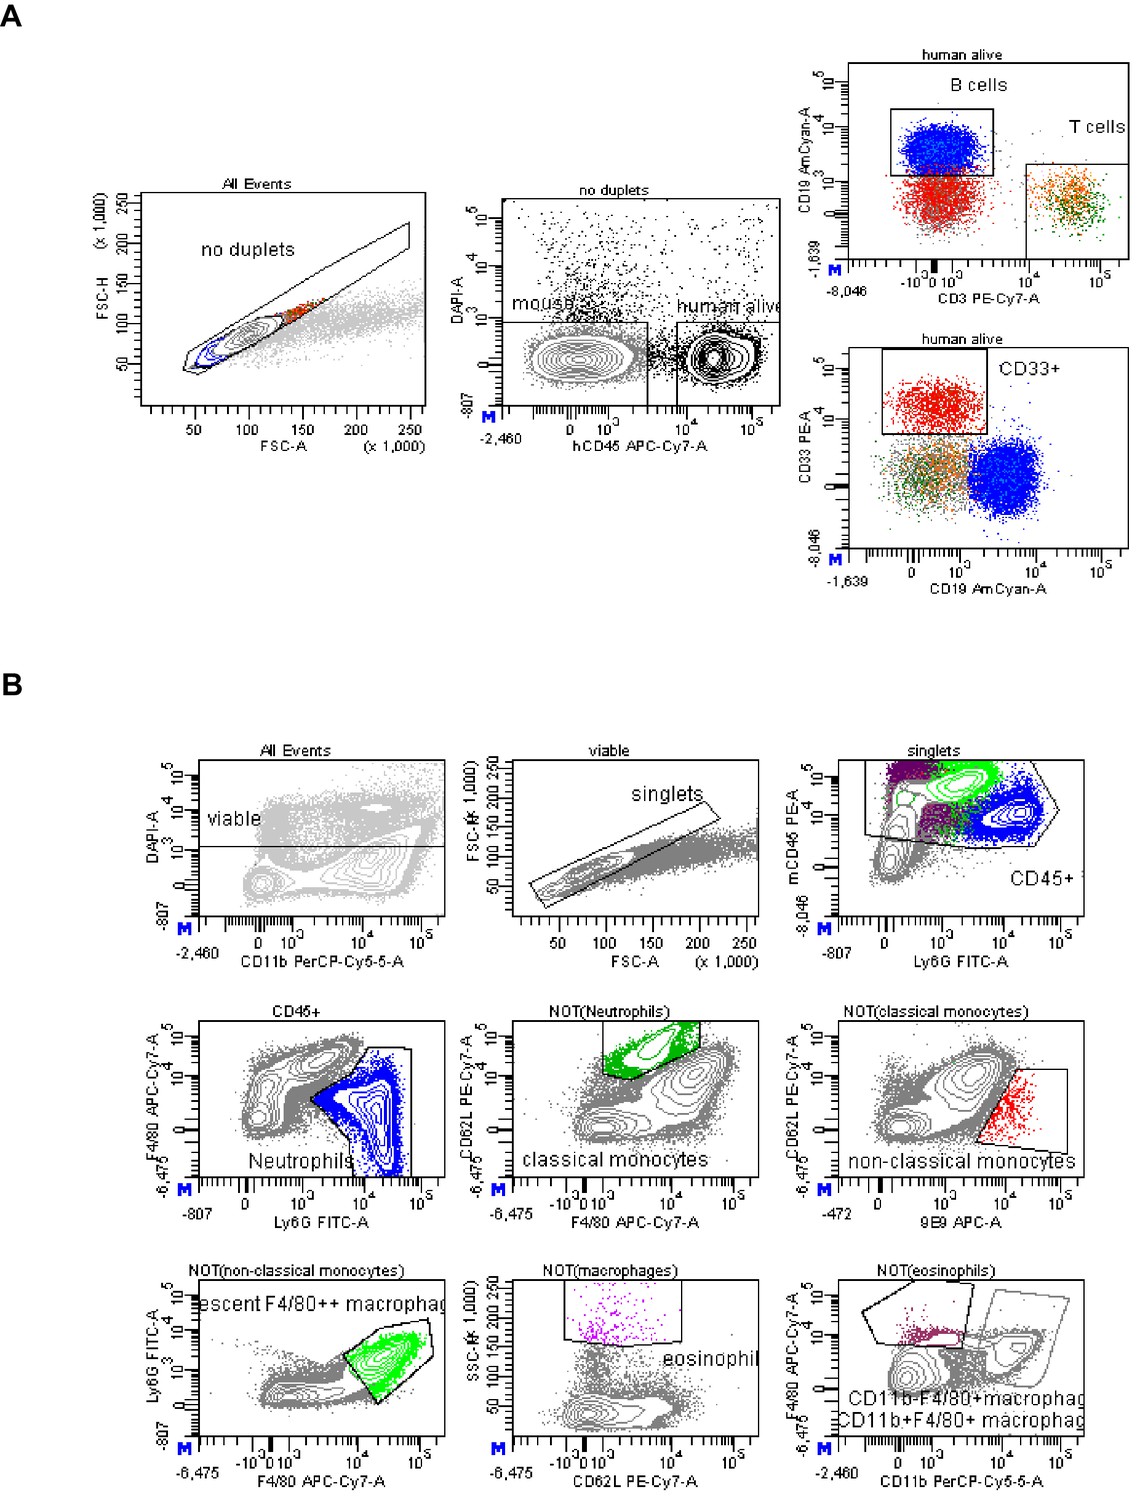
Gating strategy to identify mouse and human immune cells in humanized mice.
(A) Shown is a representative gating strategy used to identify human immune cells in the peripheral blood of humanized mice. After excluding cell duplets, hCD45+ DAPI negative cells were pre-gated for subsequent analysis of T cells (CD3+), myeloid cells (CD33+) and B cells (CD19+). A similar gating strategy was used for human immune cell analysis in all other organs. (B) Depicted is a representative gating strategy used to analyze mouse immune cells in the spleen of humanized mice. After excluding cell duplets and dead cells, mouse immune cells were identified as mouse CD45+ cells. Neutrophils were identified via Ly6G expression, classical monocytes by high levels of CD62L expression and lack of FcγRIV expression (antibody clone 9E9), non-classical monocytes by lack of CD62L expression and high levels of FcγRIV expression, macrophages by high levels of F4/80 expression and eosinophils by a high sideward scatter (SSC) and intermediate to low levels of mouse CD45 expression.
Figure 2—figure supplement 2
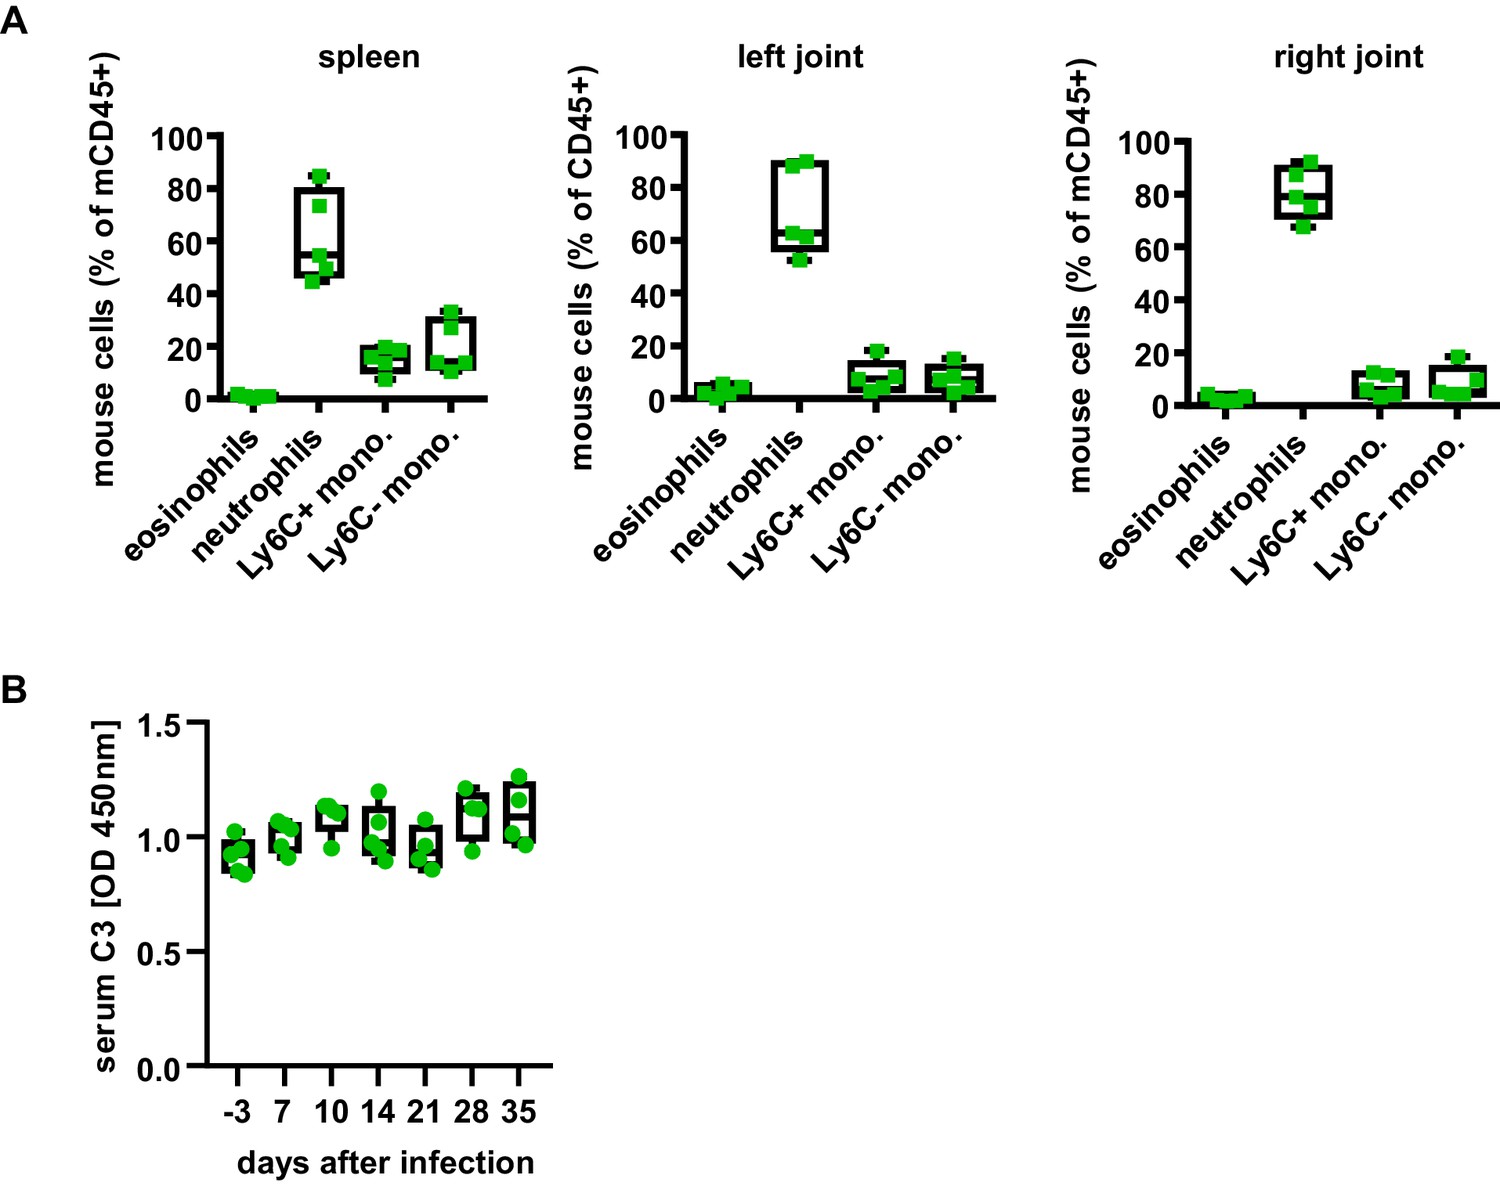
Infiltration of mouse immune cells in B. burgdorferi infected humanized mice.
(A) Shown are box and whisker plots including individual data points representing the relative abundance of mouse eosinophils, neutrophils (Ly6G+), Ly6C+ monocytes (Ly6C+ mono.), and Ly6C-negative monocytes (Ly6C- mono.) in the spleen and joints of humanized mice 38 days after infection with B. burgdorferi. (B) Depicted is the serum complement C3 level as box and whisker plots including individual data points in humanized mice at the indicated timepoints before and after infection with B. burgdorferi.
Figure 3 with 2 supplements
The role of B cells in B. burgdorferi control.
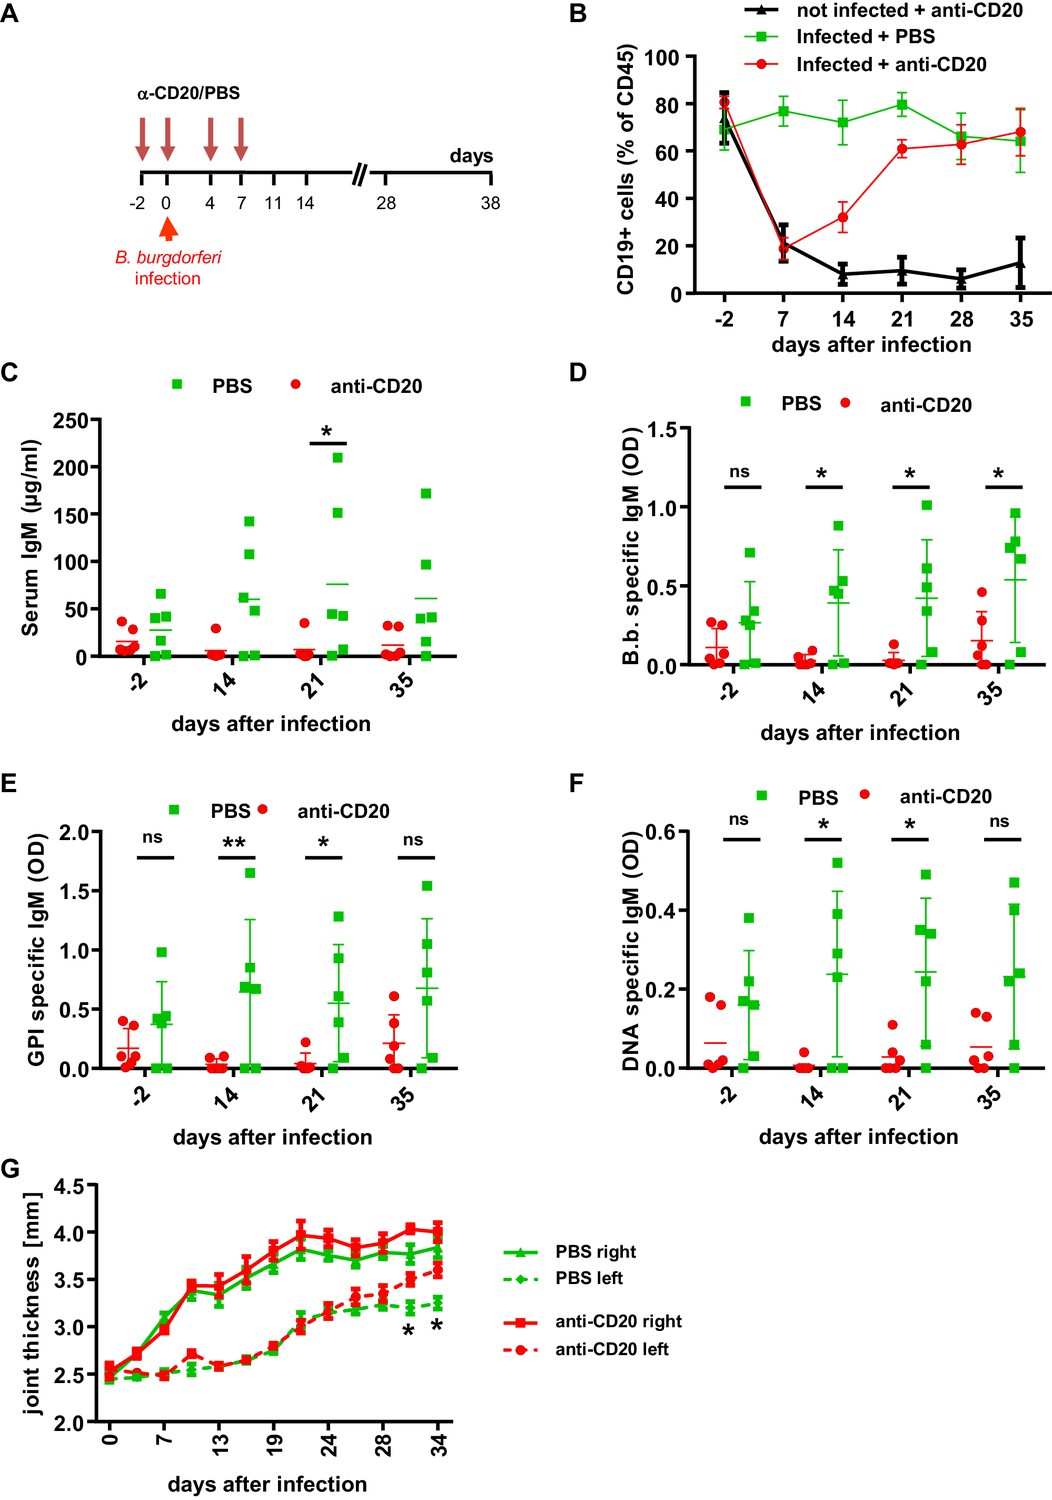
(A) Schematic representation of the experimental strategy. B cells were depleted with a human CD20-specific antibody (α-CD20) injected 2 days before (d-2), at the day of infection (d0) and 4 and 7 days after infection with B. burgdorferi. PBS injection served as a control. (B) Shown is the percentage (mean +/- SEM) of human B cells (CD19+) among human leukocytes (CD45+) in the peripheral blood of humanized mice injected with PBS or a CD20-specific antibody in the absence (not infected) or presence (infected) of an infection with B. burgdorferi. Shown is one representative out of two independent experiments with six mice per group. (C–F) Depicted are the serum IgM levels (C), the B. burgdorferi- (D), glucose 6-phosphate isomerase (GPI)- (E), and double-stranded DNA (dsDNA)-specific (F) IgM responses (mean+/-SEM) in infected humanized mice treated with PBS or a CD20-specific antibody as determined by ELISA. Shown is one out of two independent experiments with n = 6 mice per group. A two-way Anova with Tukey’s or Sidak’s multiple comparison test was used for statistical evaluation. *p<0.05, **p<0.01, ns = not significant. (G) Shown is the joint thickness (mean+/-SEM) of the right and left hind ankle joint of humanized mice infected with B. burgdorferi and treated with PBS or a CD20-specific antibody (anti-CD20) during the first 7 days. A two-way Anova with Tukey’s multiple comparison test was used for statistical evaluation. n = 6–10 mice per group. *p<0.05. Shown is one representative out of three independent experiments.
Figure 3—figure supplement 1

Effect of human FcγRIIb alleles, T cells and B cells on B. burgdorferi load and on pathogen-specific immune responses.
(A) Shown is an ethidium bromide stained agarose gel electrophoresis of a B. burgdorferi flagellin-specific nested PCR performed on ear tissue of humanized mice carrying the functional (232I, lanes 29–41) or non-functional (232T, lanes 1–7)) FcγRIIb alleles 2 weeks after infection with B. burgdorferi. Where indicated, humanized, infected mice were injected with B cell (α-CD20, lanes 19–28) and CD4 T cell (α-CD4, lanes 8–18) specific antibodies to deplete the respective immune cell subsets. In the first and last lanes, a size standard (std; 100 base pair ladder) was loaded. In lanes 42–43, a sample of a previous positively tested non-humanized infected mouse sample (NSG), a positive control (PK) (B. burgdorferi positive tick lysate) and a negative control (NK) were loaded as controls. (B) Presented is a table summarizing the effect of FcγRIIb alleles and B cell or CD4 T cell depletion on B. burgdorferi infection in humanized mice, including the number of positively tested animals and the calculated percentage values (in brackets). (C, D) Shown are box and whisker plots depicting the pathogen load (B. burgdorferi flaB copy numbers normalized to mouse nidogen-1 copy numbers) in ears (C) and hearts (D) of infected humanized mice treated with an isotype control (Iso) or CD20-specific antibody (α-CD20) (as described in Figure 3A) at the indicated timepoints after infection with B. burgdorferi. n = 5–7 mice per group. An unpaired Student’s t-test was used to evaluate statistical significance. *p<0.05.
Figure 3—figure supplement 2
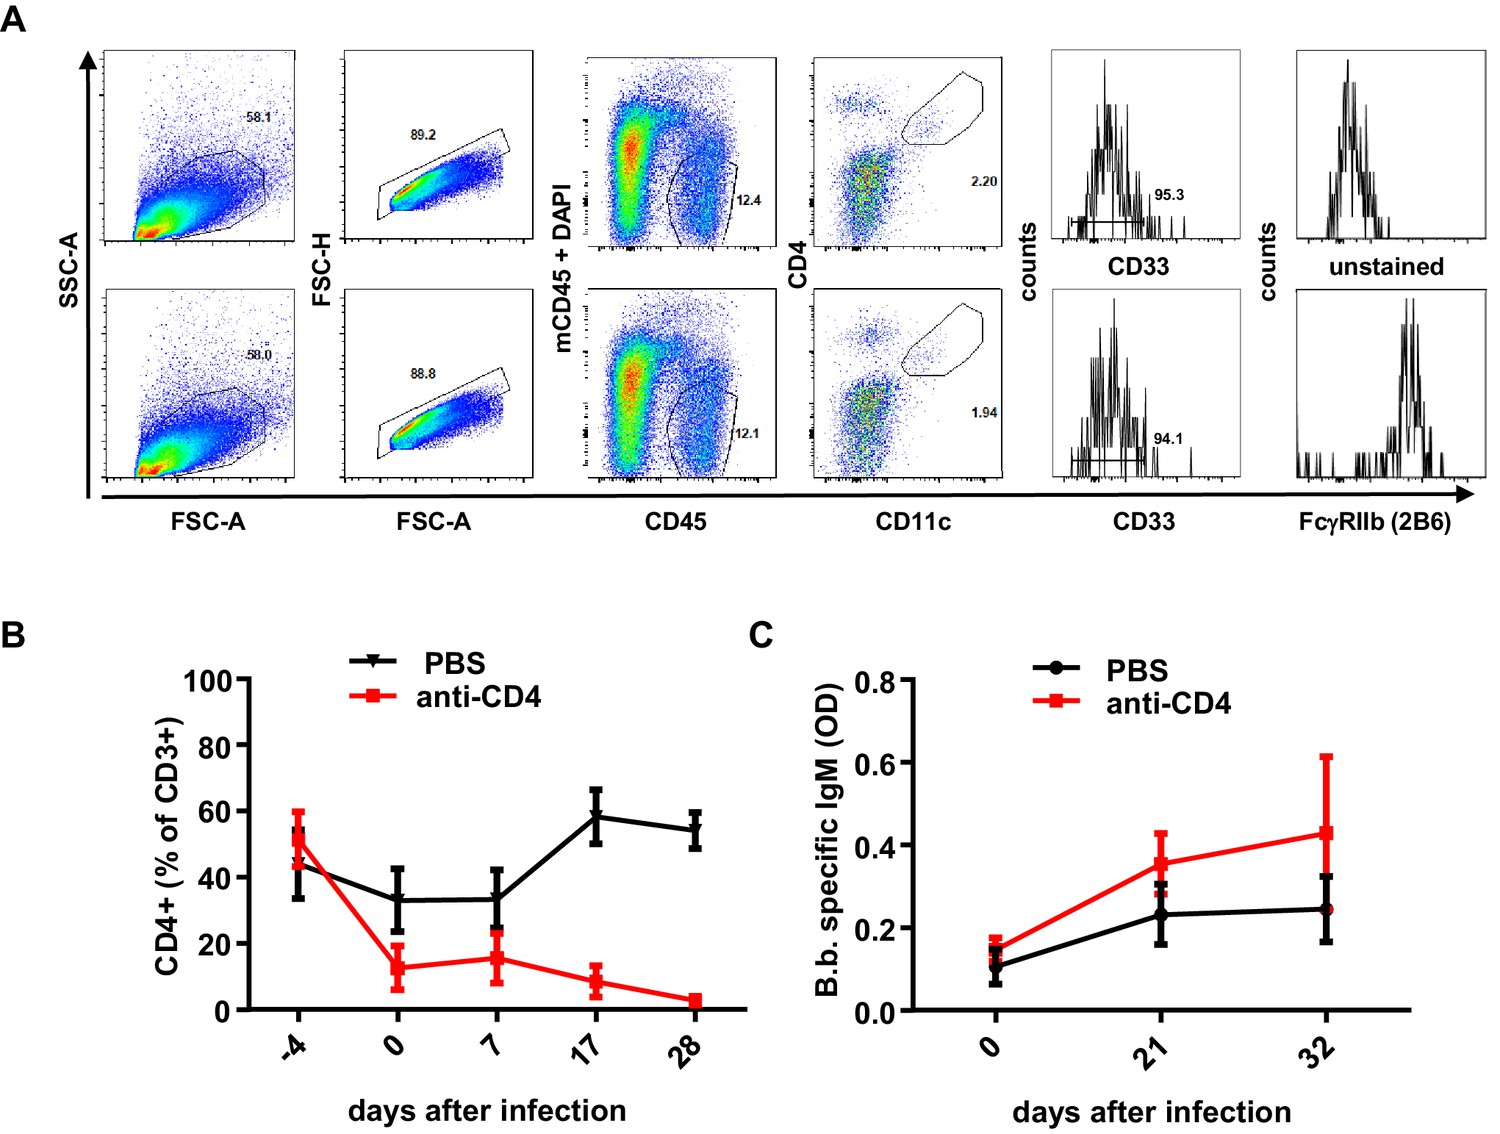
FcγRIIb expression on dendritic cells and effect of human T cells on B. burgdorferi specific immune responses.
(A) Shown is a representative example of a FACS analysis detecting FcγRIIb expression on human dendritic cells in the spleen of humanized mice using CD45, CD33, CD11c, CD4, and FcγRIIb (using the 2B6 antibody clone) as markers. To distinguish FcγRIIb staining from background fluorescence the sample was split and stained with all the indicated markers with the exception of FcγRIIb staining (marked as unstained in the upper panel). (B) Depicted is the percentage (mean+/-SEM) of human CD4+ T cells within human CD3+ cells in the peripheral blood of humanized mice continuously treated with a CD4-specific antibody. n = 6 mice per group. (C) Shown is the B. burgdorferi-specific antibody IgM response (mean+/-SEM) in humanized mice treated with PBS or a CD4-specific antibody as determined by ELISA. n = 6 mice per group.
Figure 4
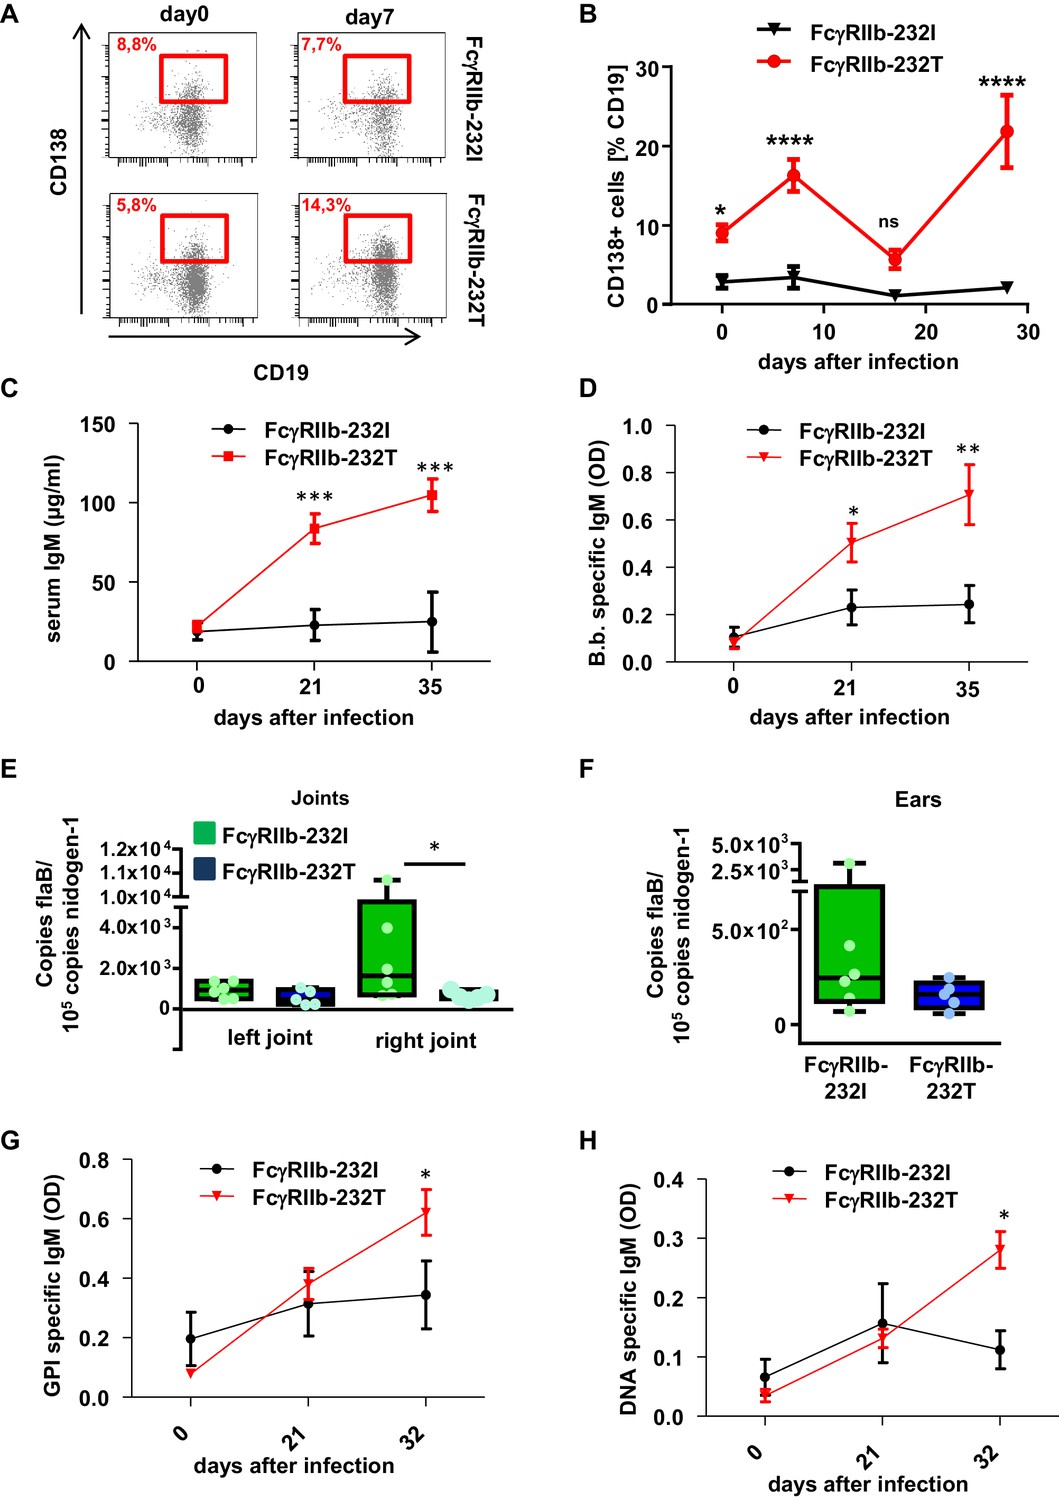
Impact of human FcγRIIb alleles on the humoral immune response and pathogen load during B. burgdorferi infection.
(A) Shown are representative dot plots of CD19+CD138+ plasma blasts (marked by red squares including the respective percentage of CD19+CD138+ cells within the population of CD19+ B cells) in the peripheral blood of humanized mice homozygous for the non-functional (FcγRIIb-232T) or functional (FcγRIIb-232I) FcγRIIb allele before and 7 days after infection with B. burgdorferi as detected by flow cytometry. (B) Quantification of the abundance of CD19+CD138+ plasma blasts in the peripheral blood of humanized mice homozygous for the non-functional (FcγRIIb-232T) or functional (FcγRIIb-232I) FcγRIIb allele by FACS analysis at the indicated time points after infection. Shown are mean values +/- SEM of one representative out of two independent experiments with n = 7–12 mice per group. For statistical evaluation, a two-way Anova with a Bonferroni’s multiple comparisons test was used. *p<0.05, ****p<0.0001; ns indicates no significant difference. (C) Quantification of human IgM levels in sera of humanized mice homozygous for functional (FcγRIIb-232I) and non-functional (FcγRIIb-232T) FcγRIIb alleles at the indicated timepoints after B. burgdorferi infection. Shown are mean values +/- SEM of one representative out of two independent experiments with n = 7–12 mice per group. For statistical evaluation, a two-way Anova with a Bonferroni’s multiple comparisons test was used. ***p<0.0005; (D) Shown is the B. burgdorferi specific IgM response (OD) at the indicated time points after infection of humanized mice homozygous for functional (FcγRIIb-232I) and non-functional (FcγRIIb-232T) FcγRIIb alleles. Shown are mean values +/- SEM of one representative out of two independent experiments with n = 7–12 mice per group. For statistical evaluation, a two-way Anova with a Bonferroni’s multiple comparisons test was used. *p<0.05; **p<0.005. (E, F) Quantification of the pathogen load (B. burgdorferi flaB copy numbers normalized to mouse nidogen-1 copy numbers) in ankle joints (left joint, L; right joint, (R) (E) and ears (F) of infected humanized mice homozygous for the functional FcγRIIb-232I (232I) or non-functional FcγRIIb-232T (232T) allele by quantitative PCR 35 days after infection with B. burgdorferi. n = 5–6 mice per group. A two-way Anova test was used to evaluate statistical significance. *p<0.05. (G, H) Detection of glucose 6-phosphate isomerase (GPI) (G) and DNA-specific (H) human IgM responses during the course of B. burgdorferi infection in humanized mice homozygous for the functional (FcγRIIb-232I) or non-functional (FcγRIIb-232T) FcγRIIb alleles. Shown are mean values +/- SEM of one representative out of two independent experiments with n = 7–12 mice per group. For statistical evaluation a two way Anova with a Bonferroni’s multiple comparisons test was used. *p<0.05.
Figure 5
Correlation of human autoreactive and pathogen-specific antibody responses in humanized mice.
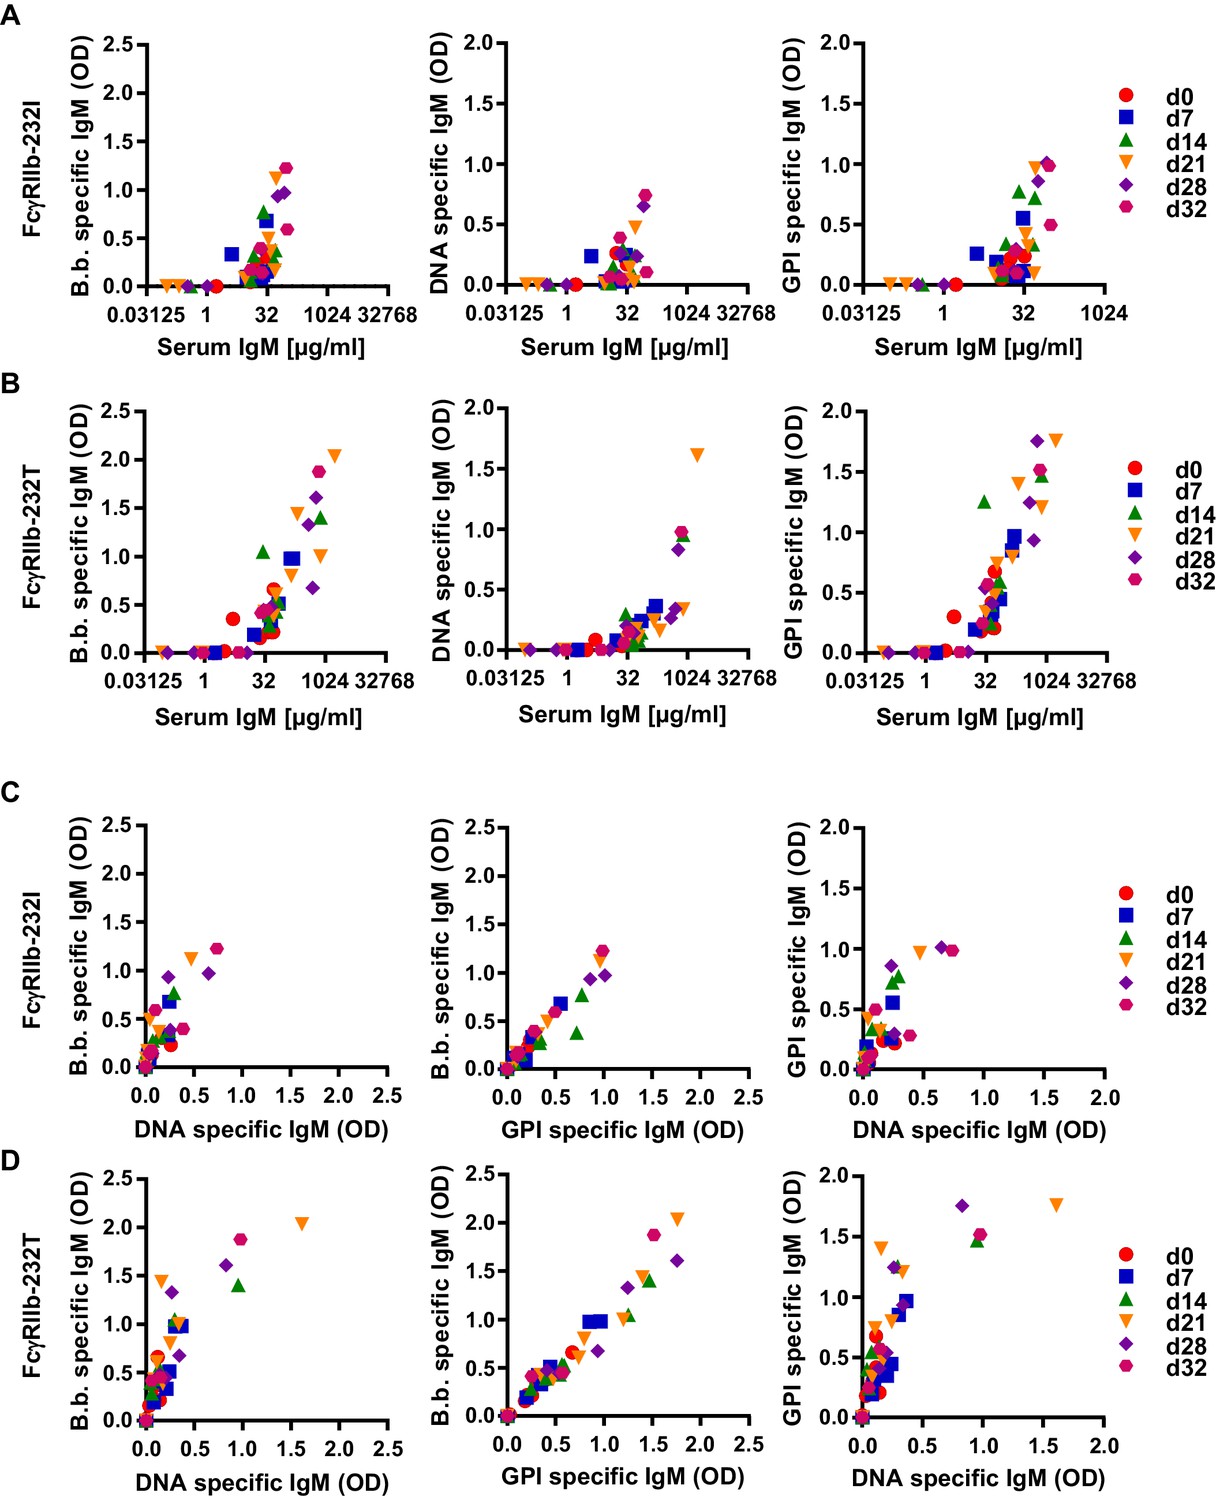
Humanized mice homozygous for the functional (FcγRIIb-232I; n = 9) (A) and non-functional (FcγRIIb-232T; n = 12) (B) FcγRIIb alleles were infected with B. burgdorferi and serum samples were collected before (d0) and 7, 14, 21, 28, and 32 days after infection. Data points from the same timepoint are depicted with the same symbol as indicated in the Figure legend at the right side of the graph. (A, B) Depicted is the correlation between total serum IgM (µg/ml) with B. burgdorferi specific, DNA specific and GPI specific IgM responses (OD) in individual humanized mice homozygous for the functional (FcγRIIb-232I) (A) and non-functional (FcγRIIb-232T) (B) FcγRIIb alleles at different time-points of infection as determined by ELISA. (C, D) Shown is the correlation between the induction of B. burgdorferi specific IgM responses with concomitant DNA- or GPI-specific IgM responses in individual humanized mice homozygous for the functional (FcγRIIb-232I) (C) or non-functional (FcγRIIb-232T) (D) FcγRIIb alleles at different time-points after infection.
Figure 6
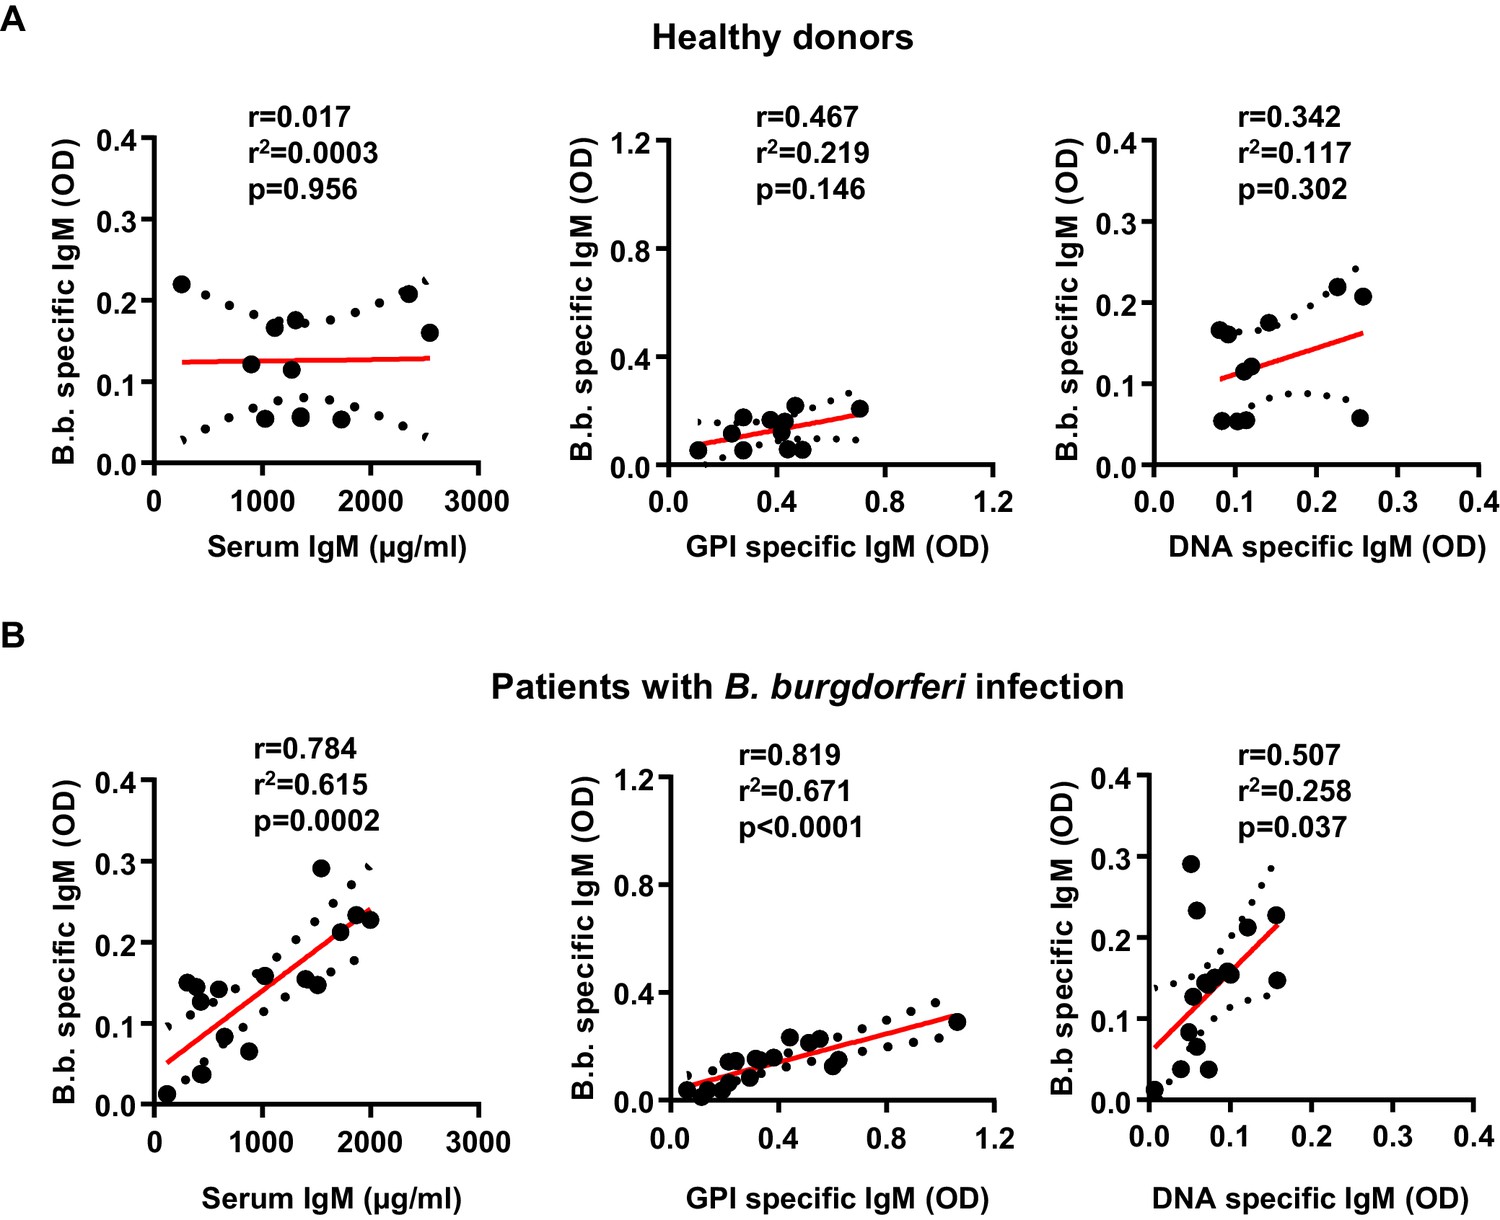
Induction of B. burgdorferi-specific and autoreactive antibody responses in humans.
Shown is the correlation of serum IgM (µg/ml), glucose 6-phosphate (OD), and DNA specific (OD) IgM responses with B. burgdorferi specific IgM responses in healthy donors (n = 11) (A) and a cohort of patients with confirmed B. burgdorferi (n = 17) (B) infections. Graphs include all datapoints and the linear regression curve (red line) and error bar lines (depicting the SEM as black dotted lines). After testing for normal distribution of the individual data sets with a D’Agostino and Pearson normality test, the statistical evaluation for a correlation between the two parameters was performed with a Pearson’s correlation test. Pearson’s r, r2 and p values are indicated within each graph.
Tables
Key resources table
| Reagent type (species) or resource | Designation | Source or reference | Identifiers | Additional information |
|---|---|---|---|---|
| Antibody | anti-human CD3 PE/Cy7 (mouse monoclonal) | BioLegend | Cat.#:300316 | FACS (1:2000) |
| Antibody | anti-human CD4 APC (rat monoclonal) | BioLegend | Cat.#:357408 | FACS (1:200) |
| Antibody | anti-human CD8a FITC (mouse monoclonal) | BioLegend | Cat.#:301050 | FACS (1:100) |
| Antibody | Anti-human CD11c FITC (mouse monoclonal) | BioLegend | Cat.#:301604 | FACS (1:50) |
| Antibody | Anti-human FcγRIIb PE (recombinant human IgG1-N297A) | in house | Clone 2B6 | FACS (1:50) |
| Antibody | anti-human CD19 Brilliant Violet 510 (mouse monoclonal) | BioLegend | Cat.#:302242 | FACS (1:100) |
| Antibody | anti-human CD20 FITC (mouse monoclonal) | BioLegend | Cat.#:302304 | FACS (1:200) |
| Antibody | anti-human CD33 PE (mouse monoclonal) | BioLegend | Cat.#:303404 | FACS (1:200) |
| Antibody | anti-human CD33 BV510 (mouse monoclonal) | BioLegend | Cat.#:303422 | FACS (1:100) |
| Antibody | anti-human CD45 APC/Fire750 (mouse monoclonal) | BioLegend | Cat.#:304062 | FACS (1:400) |
| Antibody | anti-human CD69 PerCP/Cy5.5 (mouse monoclonal) | BioLegend | Cat.#:310926 | FACS (1:100) |
| Antibody | anti-human CD138 PE/Cy7 (mouse monoclonal) | BioLegend | Cat.#:356514 | FACS (1:200) |
| Antibody | anti-mouse/human CD11b PerCP/Cy5.5 (rat monoclonal) | BioLegend | Cat.#:101228 | FACS (1:1000) |
| Antibody | anti-mouse CD45.1 PE (mouse monoclonal) | BioLegend | Cat.#:110707 | FACS (1:600) |
| Antibody | anti-mouse CD45.1 Brilliant Violet 421 (mouse monoclonal) | BioLegend | Cat.#:110732 | FACS (1:400) |
| Antibody | anti-mouse CD62L PE/Cy7 (rat monoclonal) | BioLegend | Cat.#:104418 | FACS (1:1000) |
| Antibody | anti-mouse F4/80 APC/Fire 750 (rat monoclonal) | BioLegend | Cat.#:123152 | FACS (1:200) |
| Antibody | anti-mouse Gr-1 Brilliant Violet 510 (rat monoclonal) | BioLegend | Cat.#:108437 | FACS (1:300) |
| Antibody | anti-mouse Ly-6G FITC (rat monoclonal) | BioLegend | Cat.#:127606 | FACS (1:300) |
| Antibody | 9E9 Alexa647 (rabbit monoclonal) | Nimmerjahn et al., 2005 | n/a | FACS (1:200) |
| Antibody | Anti-human CD4 (for depletion) (mouse monoclonal) | BioXCell | Cat.#:BE0003-2 | 100 µg per injection |
| Antibody | Anti-human CD20 (for depletion) (recombinant mouse monoclonal) | Kao et al., 2015 | In house | 25 µg per injection |
| Strain, strain background Mus musculus | NOD.Cg-Prkdc<scid > Il2rgtm1Wjl/Szj | The Jackson Laboratory | Cat.#:005557 | n/a |
| Software, algorithm | Graph Pad Prism 7.03 | GraphPad Software Inc, San Diego, CA, USA |
Additional files
-
Source data 1
Summarized source data for all figures.
- https://cdn.elifesciences.org/articles/55319/elife-55319-data1-v2.xlsx
-
Transparent reporting form
- https://cdn.elifesciences.org/articles/55319/elife-55319-transrepform-v2.docx
Download links
A two-part list of links to download the article, or parts of the article, in various formats.
Downloads (link to download the article as PDF)
Open citations (links to open the citations from this article in various online reference manager services)
Cite this article (links to download the citations from this article in formats compatible with various reference manager tools)
Human Fcγ-receptor IIb modulates pathogen-specific versus self-reactive antibody responses in lyme arthritis
eLife 9:e55319.
https://doi.org/10.7554/eLife.55319


