MeCP2 in cholinergic interneurons of nucleus accumbens regulates fear learning
- Center for Neuroscience and Department of Neurology of Second Affiliated Hospital, Zhejiang University School of Medicine, China
- Sir Run Run Shaw Hospital, Zhejiang University School of Medicine, China
- NHC and CAMS Key Laboratory of Medical Neurobiology, Center for Brain Science and Brain-Inspired Intelligence, Guangdong-Hong Kong-Macao Greater Bay Area, Joint Institute for Genetics and Genome Medicine between Zhejiang University and University of Toronto, Canada
Figures
Figure 1 with 1 supplement
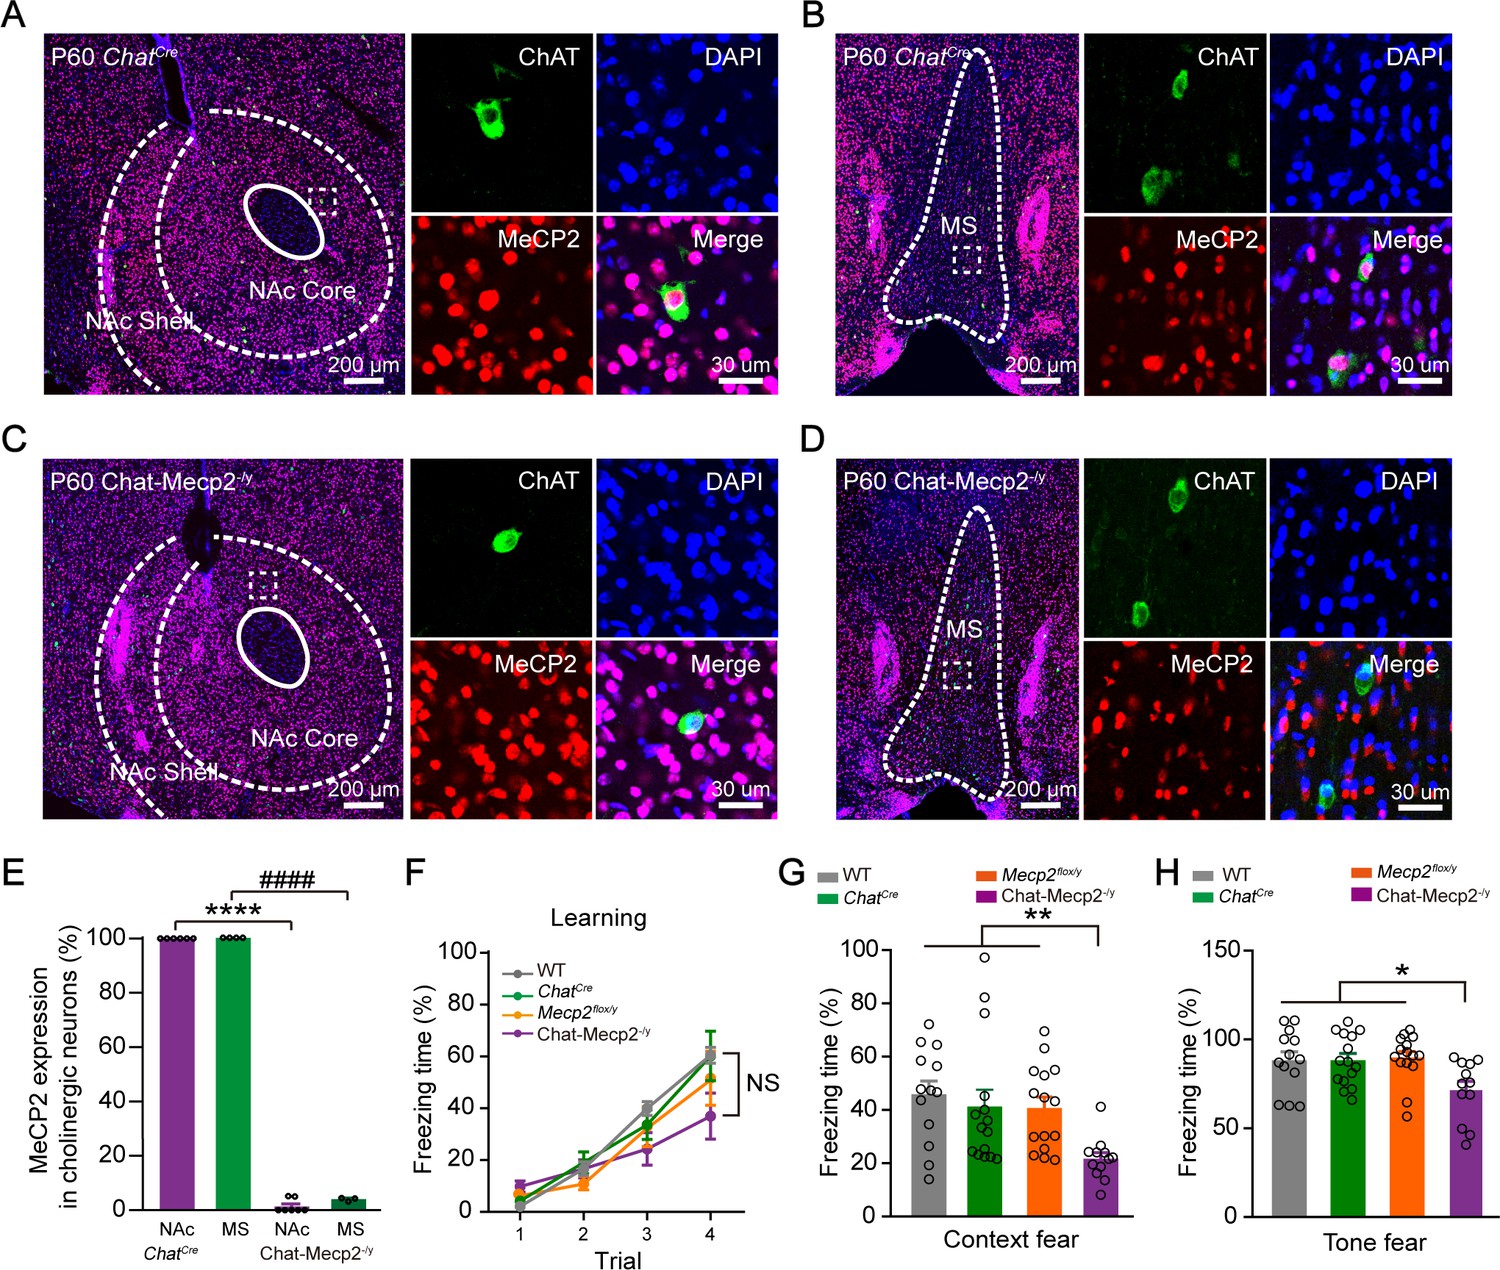
Depletion of MeCP2 in Cholinergic Neurons Resulted in Impaired Fear Regulation.
(A, B) Fluorescence images showing NAc (A) and MS sections (B) in ChatCre mice stained for ChAT, MeCP2, and DAPI. (C, D) Fluorescence images showing NAc (C) and MS sections (D) in Chat-Mecp2-/y mice stained for ChAT, MeCP2, and DAPI. (E) Percentage of MeCP2 expression in NAc or MS of ChatCre or Chat-Mecp2-/y mice. P-values were calculated by two-tailed unpaired t-test. t = 95.73, df = 11, p<0.0001 for NAc. t = 281.8, df = 5, p<0.0001 for MS. n = 6 sections from four mice (NAc in ChatCre mice), 4 sections from four mice (MS in ChatCre mice), 7 sections from three mice (NAc in Chat-Mecp2-/y mice), 3 sections from three mice (MS in Chat-Mecp2-/y mice). (F) No significant change was detected in fear learning. P-values were calculated by two-way analysis of variance (ANOVA) with Tukey’s multiple comparisons test. F (9, 153)=1.895, p=0.0565. (G, H) Chat-Mecp2-/y mice showed decreased percentage of time freezing in context retrieval (G) and tone retrieval (H). P-values were calculated by one-way ANOVA with Bonferroni’s multiple comparisons test. F (3, 51)=4.445, p=0.0075 for (G). F (3, 51)=3.941, p=0.0132 for (H). n = 13 (WT), 15 (ChatCre), 15 (Mecp2flox/y), 12 (Chat-Mecp2-/y) mice. NAc: nucleus accumbens. MS: medial septum. WT: wild type mice. ChAT: Choline acetyltransferase, as a marker for cholinergic neurons. Data are means ± SEM. *p<0.05, **p<0.01, ***p<0.001, ****p<0.0001, ####p<0.0001. NS means no significance.
-
Figure 1—source data 1
Statistical reporting of Figure 1.
- https://cdn.elifesciences.org/articles/55342/elife-55342-fig1-data1-v2.xlsx
Figure 1—figure supplement 1
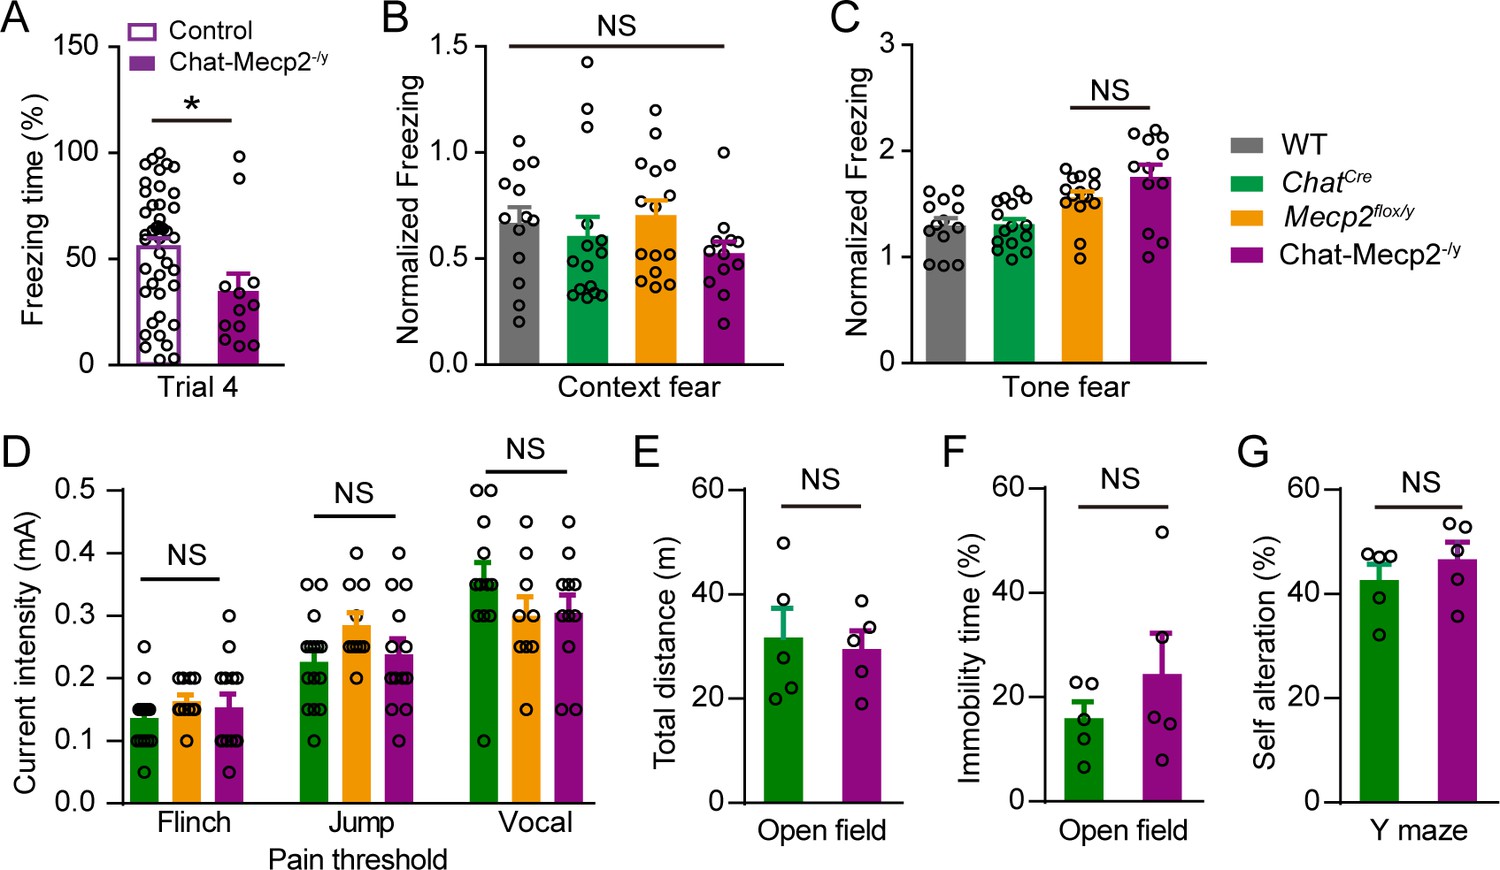
Chat-Mecp2-/y Mice Showed Normal Ability in Pain Perception, Movement Ability, and Working Memory, Related to Figure 1.
(A) Chat-Mecp2-/y mice showed decreased freezing time compared to combination of other three control groups on Trial four during fear learning. P-values were calculated by two-tailed unpaired t-test. t = 2.228, df = 53, p=0.0302. n = 43 for control group, n = 12 neurons for Chat-Mecp2-/y group. (B, C) Freezing was measured against trial four during learning. P-values were calculated by one-way analysis of variance (ANOVA) with Bonferroni’s multiple comparison test. F (3, 51)=1.007, p=0.3975 for context fear. F (3, 51)=7.729, p=0.0002 for tone fear. n = 13 (WT), 15 (ChatCre), 15 (Mecp2flox/y), 12 (Chat-Mecp2-/y) mice. (D) Chat-Mecp2-/y mice showed normal response to increasing footshock intensity. P-values were calculated by one-way analysis of variance (ANOVA) with Bonferroni’s multiple comparisons test. F (2, 36)=0.8018, p=0.4563 for flinch. F (2, 35)=1.837, p=0.1743 for jump. F (2, 29)=1.044, p=0.3650 for vocal. n = 15 (ChatCre), 11 (Mecp2flox/y), 13 (Chat-Mecp2-/y) in flinch. n = 15 (ChatCre), 10 (Mecp2flox/y), 13 (Chat-Mecp2-/y) in jump. n = 12 (ChatCre), 9 (Mecp2flox/y), 11 (Chat-Mecp2-/y) in vocal. (E) Chat-Mecp2-/y mice showed normal movement ability in open field arena (15 min). P-values were calculated by two-tailed unpaired t-test. t = 0.3300, df = 8, p=0.7499. n = 5 (ChatCre), 5(Chat-Mecp2-/y). (F) Chat-Mecp2-/y mice showed normal immobility time in open field test. P-values were calculated by two-tailed unpaired t-test. t = 1.007, df = 8, p=0.3436. n = 5 (ChatCre), 5 (Chat-Mecp2-/y). (G) Chat-Mecp2-/y mice showed normal working memory in Y maze test. P-values were calculated by two-tailed unpaired t-test. t = 0.8772, df = 8, p=0.4059. n = 5 (ChatCre), 5(Chat-Mecp2-/y). Data are means ± SEM. *p<0.05, NS means no significance.
Figure 2 with 2 supplements

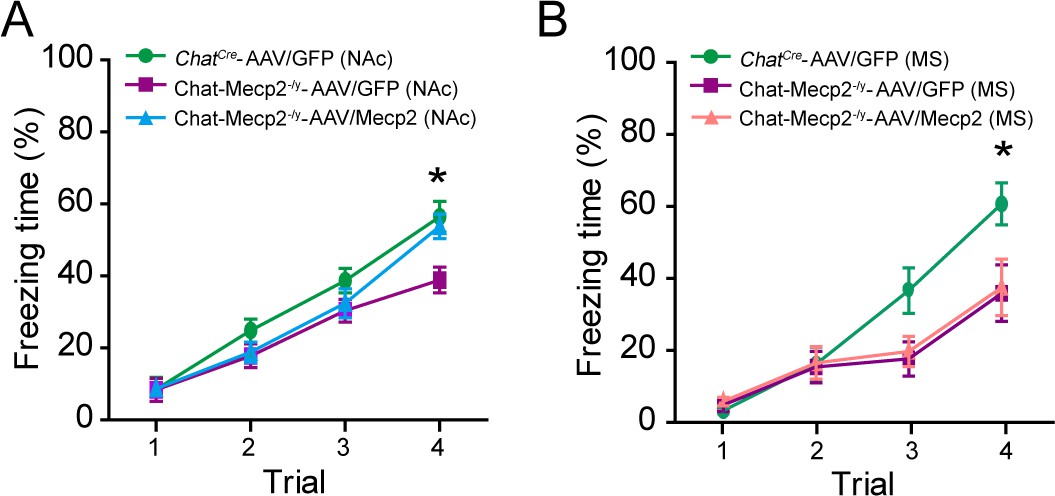
Restoration of MeCP2 in NAc rather than Cholinergic Neurons of Medial Septum Rescued Fear Deficits in Chat-Mecp2-/y Mice.
(A) Representative fluorescence images showing NAc sections of Chat-Mecp2-/y-AAV/GFP and Chat-Mecp2-/y-AAV/Mecp2 stained for DAPI, MeCP2, and ChAT. (B) Percentage of ChAT-positive cells in NAc co-expressing overexpression virus (left) and efficiency of MeCP2 restoration in GFP-positive neurons (right) in Chat-Mecp2-/y-AAV/Mecp2 mice. n = 10 mice. (C–F) Fear conditioning test was conducted three weeks after microinjection in NAc (C, D) or MS (E, F). P-values were calculated by one-way analysis of variance (ANOVA) with Bonferroni’s multiple comparisons test. F (2, 27)=7.304, p=0.0029 for (C). F (2, 27)=8.469, p=0.0014 for (D). F (2, 31)=14.52, p<0.0001 for (E). F (2, 31)=8.261, p=0.0013 for (F). n = 11 (ChatCre-AAV/GFP in NAc), 9 (Chat-Mecp2-/y-AAV/GFP in NAc), 10 (Chat-Mecp2-/y-AAV/Mecp2 in NAc); 15 (ChatCre-AAV/GFP in MS), 8 (Chat-Mecp2-/y-AAV/GFP in MS), 11 (Chat-Mecp2-/y-AAV/Mecp2 in MS). Data are means ± SEM. *p<0.05, **p<0.01, ***p<0.001, NS means no significance.
-
Figure 2—source data 1
Statistical reporting of Figure 2.
- https://cdn.elifesciences.org/articles/55342/elife-55342-fig2-data1-v2.xlsx
Figure 2—figure supplement 1
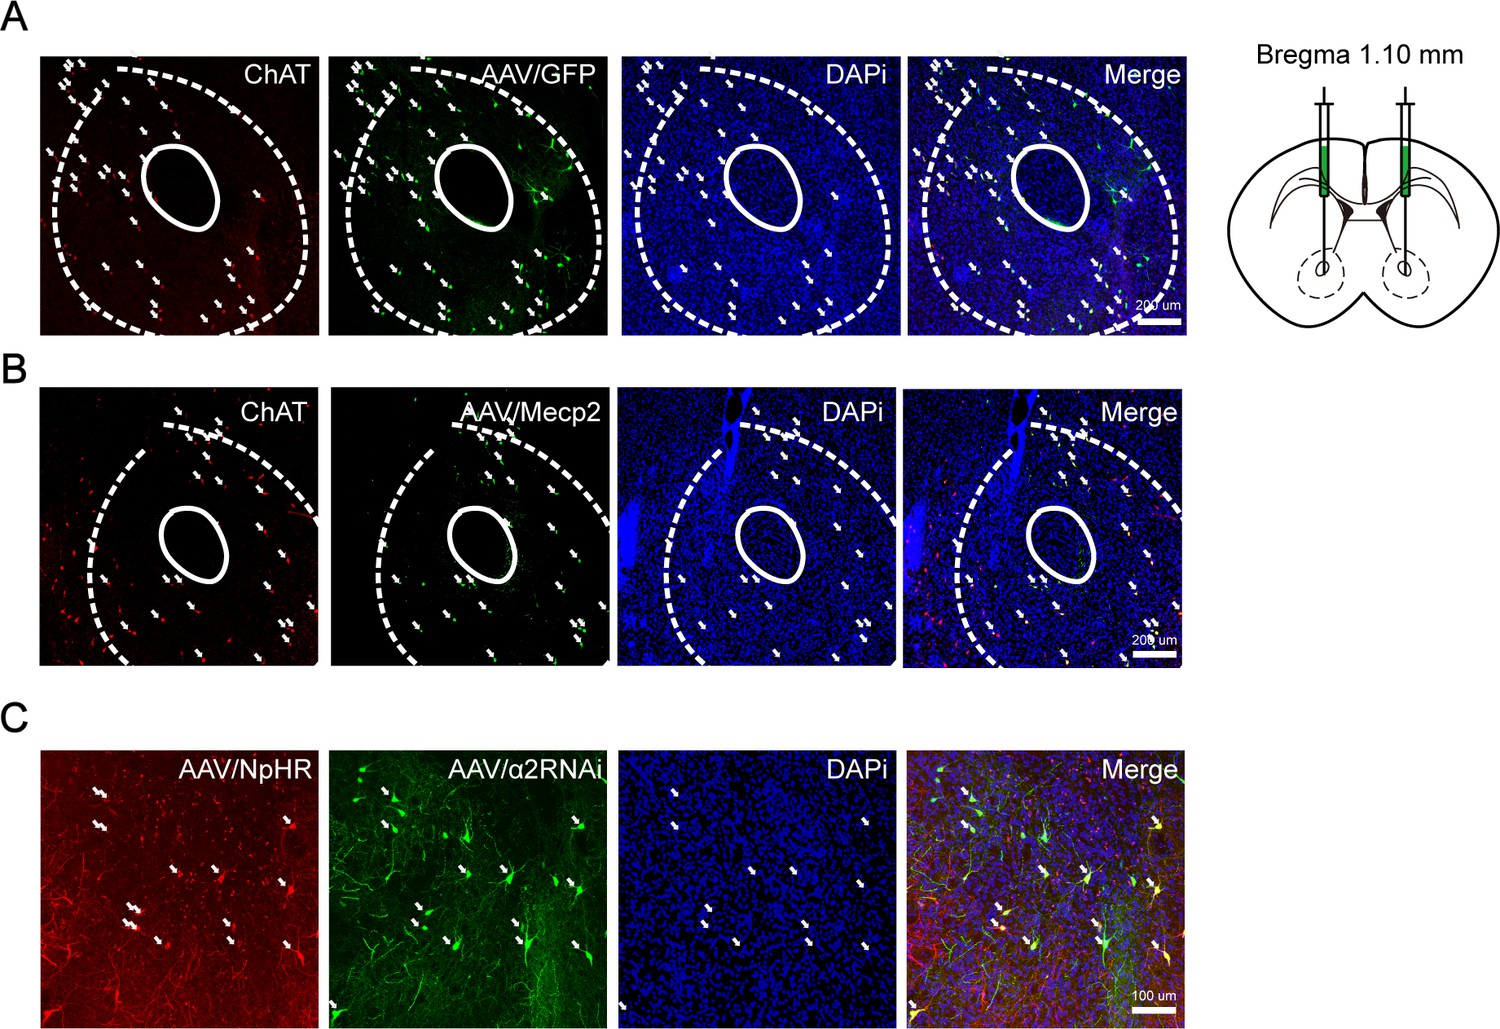
Systemic Delivery of Various AAV Vectors into NAc, Related to Figures 2, 4, 5.
(A) Diagram of virus injection into NAc (right) of ChatCre mice and confocal image of AAV/GFP vector-injected NAc slice demonstrating colocalization of GFP expression with ChAT antibody, co-stained with DAPI (left). (B) Confocal image of AAV/Mecp2 vector-injected NAc slice demonstrating colocalization of GFP expression with ChAT antibody, co-stained with DAPI. (C) Confocal image of AAV/NpHR and AAV/α2 RNAi vector-injected NAc slices demonstrating colocalization of mCherry expression with GFP expression, co-stained with DAPI.
Figure 2—figure supplement 2
Restoration of MeCP2 in NAc rather than Cholinergic neurons of MS Rescued Fear deficit at the last trial of learning, Related to Figure 2.
(A, B) Fear conditioning test was conducted three weeks after microinjection in NAc (A) or MS (B). P-values were calculated by one-way analysis of variance (ANOVA) with Bonferroni’s multiple comparisons test. F (2, 27)=5.929, p=0.0073 for Trial four during fear learning in (A). Bonferroni’s multiple comparisons test: P (ChatCre-AAV/GFP in NAc vs. Chat-Mecp2-/y-AAV/GFP in NAc)=0.0060, P (Chat-Mecp2-/y-AAV/GFP in NAc vs. Chat-Mecp2-/y-AAV/Mecp2 in NAc)=0.0241. F (2, 31)=4.258, p=0.0232 for Trial four during fear learning in (B). Bonferroni’s multiple comparisons test: P (ChatCre-AAV/GFP in MS vs. Chat-Mecp2-/y-AAV/GFP in MS)=0.0461, P (Chat-Mecp2-/y-AAV/GFP in MS vs. Chat-Mecp2-/y-AAV/Mecp2 in MS)>0.9999. n = 11 (ChatCre-AAV/GFP in NAc), 9 (Chat-Mecp2-/y-AAV/GFP in NAc), 10 (Chat-Mecp2-/y-AAV/Mecp2 in NAc); 15 (ChatCre-AAV/GFP in MS), 8 (Chat-Mecp2-/y-AAV/GFP in MS), 11 (Chat-Mecp2-/y-AAV/Mecp2 in MS). Data are means ± SEM. *p<0.05, NS means no significance.
Figure 3 with 2 supplements
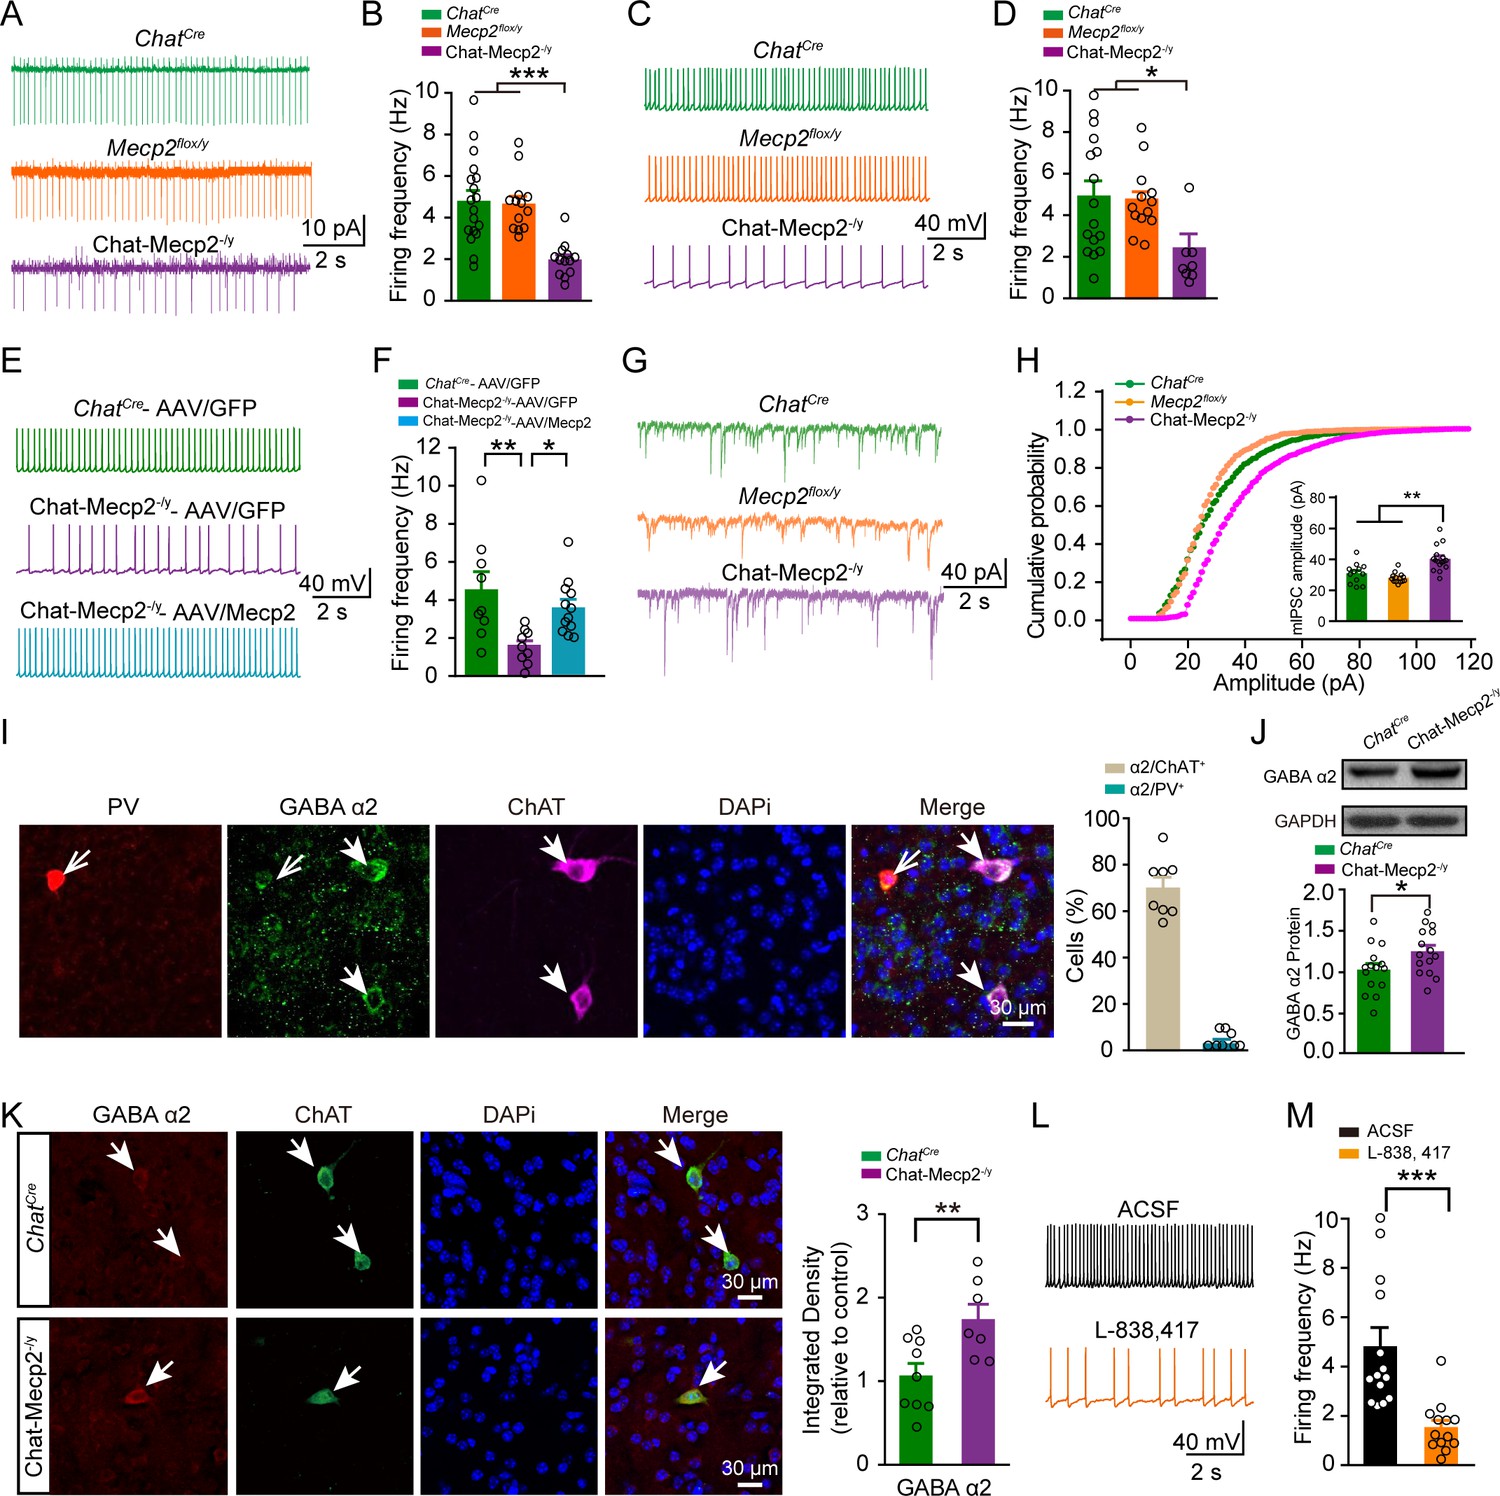
Spontaneous Firing of Cholinergic Interneurons Decreased via Elevated Expression of GABAA α2 Receptors in Chat-Mecp2-/y Mice.
(A, B) Example traces of spontaneous spiking (A) or averaged frequency (B) measured in a cell-attached configuration from NAc cholinergic interneurons. P-values were calculated by one-way analysis of variance (ANOVA) with Bonferroni’s multiple comparisons test. F (2, 41)=13.93, p<0.0001. n = 18 neurons from three mice (ChatCre), 13 neurons from three mice (Mecp2flox/y), 13 neurons from five mice (Chat-Mecp2-/y). (C, D) Example traces of spontaneous spiking (C) or averaged frequency (D) measured in a whole-cell configuration from NAc cholinergic interneurons. P-values were calculated by one-way ANOVA with Bonferroni’s multiple comparisons test. F (2, 34)=5.336, p=0.0096. n = 16 neurons from three mice (ChatCre), 13 neurons from four mice (Mecp2flox/y), 8 neurons from five mice (Chat-Mecp2-/y). (E, F) Example traces of spontaneous spiking (E) or averaged frequency (F) measured in a whole-cell configuration from NAc neurons infected by AAV-GFP or AAV/Mecp2 for indicated genotype. Data are means ± SEM. P-values were calculated by one-way ANOVA with Tukey’s multiple comparisons test. F (2, 27)=6.201, p=0.0061. n = 9 neurons from three mice (ChatCre-AAV/GFP), 9 neurons from three mice (Chat-Mecp2-/y-AAV/GFP), 12 neurons from three mice (Chat-Mecp2-/y-AAV/Mecp2). (G, H) Example mIPSC traces (G) measured in whole-cell configuration from NAc cholinergic interneurons. (H) Cumulative distribution of mIPSC amplitude of NAc cholinergic interneurons. P-values were calculated by one-way ANOVA with Bonferroni's multiple comparisons test. F (2, 39)=15.46, p<0.0001. n = 12 neurons from four mice (ChatCre), 14 neurons from four mice (Mecp2flox/y), 16 neurons from four mice (Chat-Mecp2-/y). (I) Confocal images showing NAc sections stained for PV, ChAT, GABAA α2 receptor, and DAPI. Bar graph showing percentage of ChAT or PV-positive cells co-expressing GABAA α2 receptor in wild-type (WT) mice. n = 8 sections from two mice. (J) Immunoblotting of GABAA α2 receptor in NAc extracts prepared from ChatCre and Chat-Mecp2-/y mice. Each lane was loaded with 40 μg of protein, with GAPDH as loading control, and normalized to ChatCre levels. P-values were calculated by two-tailed unpaired t-test. t = 2.153, df = 28, p=0.0401. n = 15 mice per group. (K) Representative images of NAc slices from ChatCre and ChAT-Mecp2-/y mice. Statistically integrated immunofluorescence data normalized to ChatCre levels. P-values were calculated by two-tailed unpaired t-test. t = 2.986, df = 14, p=0.0098. n = 7–9 sections from two mice per group. (L, M) Example traces (L) and statistical results (M) of spontaneous spiking recorded from cholinergic interneurons in NAc of different groups. P-values were calculated by two-tailed unpaired t-test. t = 3.977, df = 25, p=0.0005. n = 14 neurons from four mice for ACSF, n = 13 neurons from four mice for L-838,417. L-838,417: an α2-subunit-selecive selective positive allosteric modulator of GABAA receptors. Data are means ± SEM. *p<0.05, **p<0.01, ***p<0.001, NS means no significance.
-
Figure 3—source data 1
Statistical reporting of Figure 3.
- https://cdn.elifesciences.org/articles/55342/elife-55342-fig3-data1-v2.xlsx
Figure 3—figure supplement 1
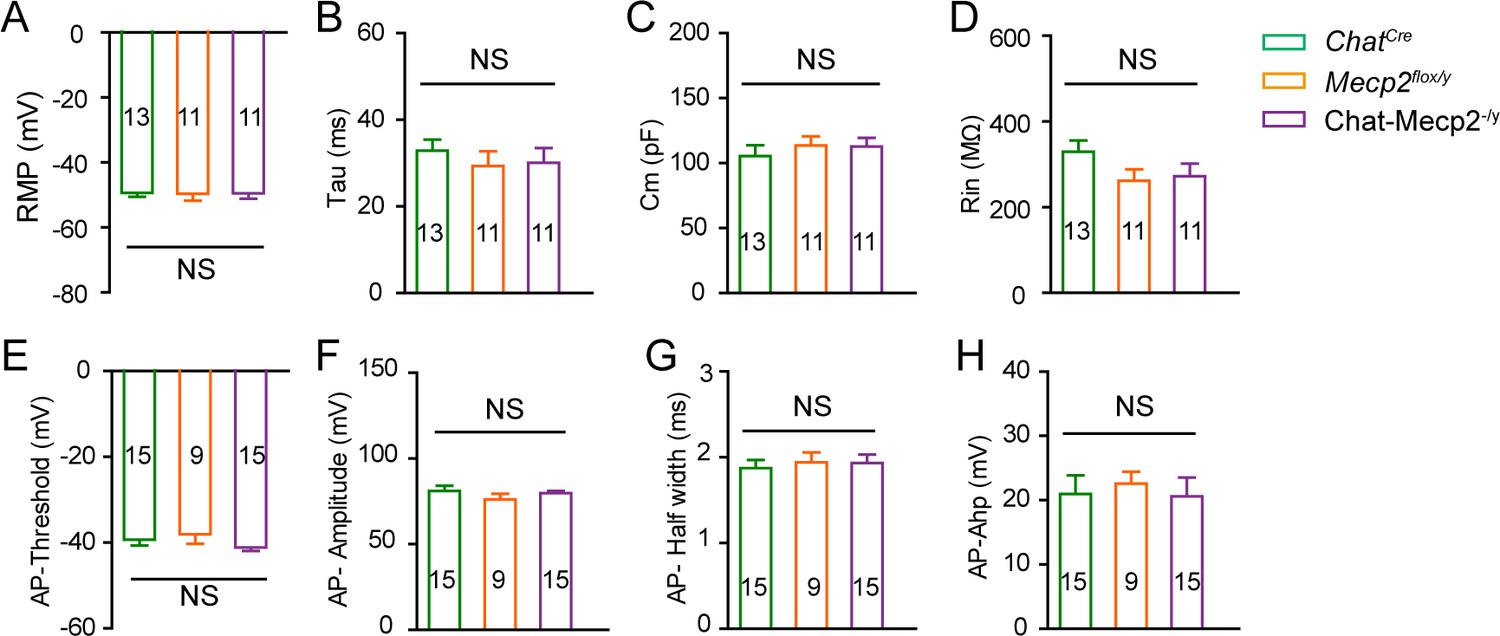
Chat-Mecp2-/y Mice Exhibited No Statistical Difference in Intrinsic Properties in NAc Cholinergic Interneurons, Related to Figure 3.
(A–D) Quantitative analysis of resting membrane potential (RMP), membrane time constant (Tau), input resistance (Rin), and membrane capacitance (Cm) of cholinergic interneurons from NAc slices. P-values were calculated by one-way analysis of variance (ANOVA) with Bonferroni’s multiple comparisons test. F (2, 32)=0.005866, p=0.9942 for RMP. F (2, 32)=0.3762, p=0.6894 for Tau. F (2, 32)=0.3748, p=0.6904 for Cm. F (2, 32)=1.809, p=0.1801 for Rin. n = 13 neurons from four mice (ChatCre), 11 neurons from three mice (Mecp2flox/y), 11 neurons from three mice (Chat-Mecp2-/y). (E–H) Quantitative analysis of threshold, amplitude, half width, and after-hyperpolarization potential (ahp) for a single spike of cholinergic interneurons from NAc slices. P-values were calculated by one-way ANOVA with Bonferroni’s multiple comparisons test. F (2, 36)=1.222, p=0.3066 for threshold. F (2, 36)=0.7935, p=0.4600 for amplitude. F (2, 36)=0.1402, p=0.8697 for half width. F (2, 36)=0.1137, p=0.8929 for ahp. n = 15 neurons from four mice (ChatCre), 9 neurons from three mice (Mecp2flox/y), 15 neurons from five mice (Chat-Mecp2-/y). Data are means ± SEM. NS means no significance.
Figure 3—figure supplement 2

Depletion of MeCP2 Did Not Affect mIPSC Frequency of Cholinergic Interneurons, with Limited Expression of GABAA Receptor α1 Subunits in Cholinergic Interneurons within NAc, Related to Figure 3.
(A) Cumulative distribution of mIPSC inter-event interval and average frequency of NAc cholinergic interneurons. P-values were calculated by one-way analysis of variance (ANOVA) with Bonferroni’s multiple comparisons test. F (2, 39)=1.535, p=0.2282. n = 12 neurons from four mice (ChatCre), 14 neurons from four mice (Mecp2flox/y), 16 neurons from four mice (Chat-Mecp2-/y). (B) Fluorescence images showing NAc sections stained for the PV, ChAT, GABAA receptor α1, and DAPI. (C) Immunoblotting of GABAA receptor α1 in NAc extracts prepared from ChatCre and Chat-Mecp2-/y mice. Each lane was loaded with 40 μg of protein, with GAPDH as loading control, and normalized to ChatCre levels. Data are means ± SEM. P-values were calculated by two-tailed unpaired t-test. t = 0.3411, df = 12, p=0.7390. n = 7 for ChatCre mice, seven for Chat-Mecp2-/y mice. (D Example traces and statistical results of spontaneous spiking recorded from cholinergic interneurons in NAc of Chat-Mecp2-/y mice. P-values were calculated by two-tailed unpaired t-test. t = 2.496, df = 19, p=0.0219. n = 11 neurons from three mice for ACSF, n = 10 neurons from three mice for L-838,417. (E) Example sIPSC traces and statistical results of amplitude and frequency recorded from cholinergic interneurons in NAc of ChatCre mice. P-values were calculated by two-tailed unpaired t-test. t = 2.688, df = 20, p=0.0141 for amplitude. t = 2.099, df = 20, p=0.0488 for frequency. n = 11 neurons from three mice for each group. (F) Example sIPSC traces and statistical results of amplitude and frequency recorded from cholinergic interneurons in NAc of Chat-Mecp2-/y mice. P-values were calculated by two-tailed unpaired t-test. t = 2.108, df = 18, p=0.0493 for amplitude. t = 3.536, df = 18, p=0.0024 for frequency. n = 10 neurons from three mice for each group. Data are means ± SEM. NS means no significance.
Figure 4 with 1 supplement

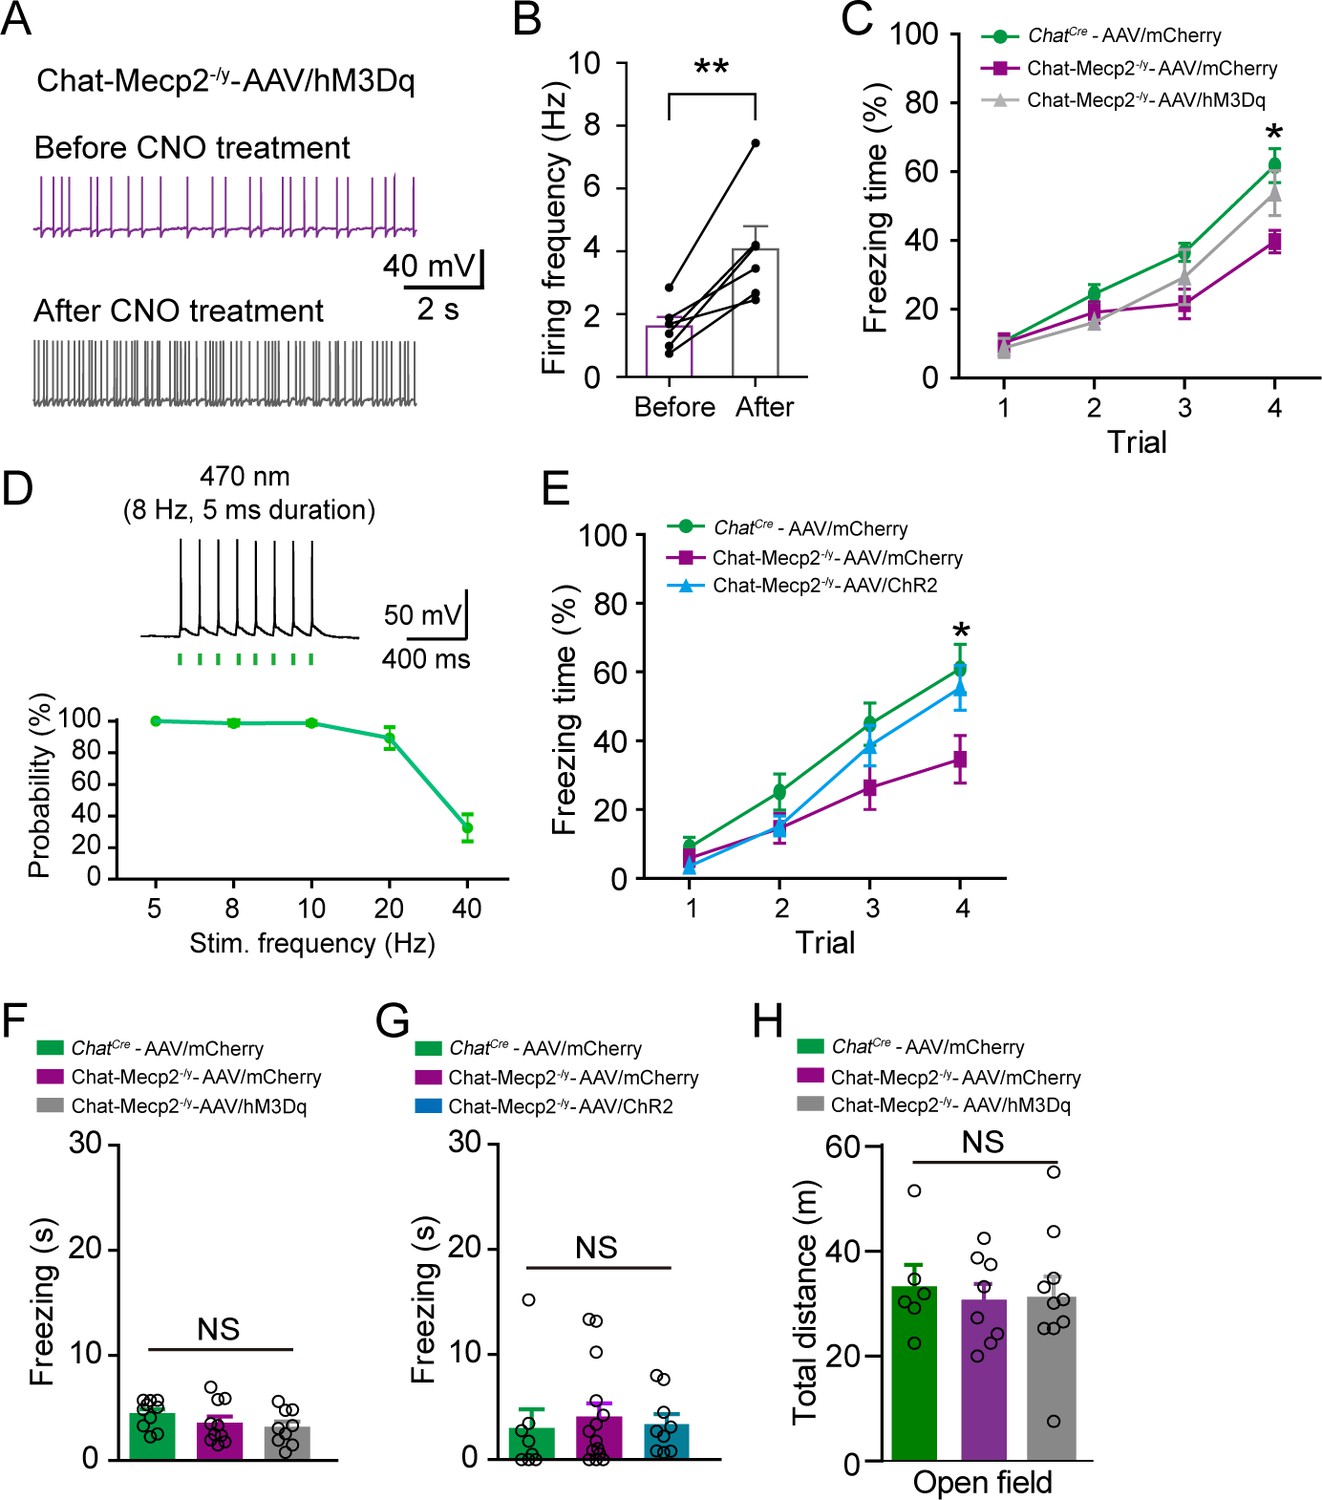
Activation of NAc Cholinergic Interneurons Rescued Fear Deficits in Chat-Mecp2-/y Mice.
(A) Up: Schematic of AAV/hM3Dq viral construct. Down: Confocal image of injected NAc slice demonstrating colocalization of mCherry expression with ChAT antibody, co-stained with DAPI. (B, C) Fear retrieval was measured by retrieval process in fear conditioning test. P-values were calculated by one-way analysis of variance (ANOVA) with Bonferroni’s multiple comparisons test. F (2, 26)=7.801, p=0.0022 for (B). F (2, 26)=7.583, p=0.0025 for (C). n = 10 (ChatCre-AAV/mCherry), 10 (Chat-Mecp2-/y-AAV/mCherry), 9 (Chat-Mecp2-/y-AAV/hM3Dq). (D) Up: Schematic of AAV/ChR2 viral construct. Down: Confocal image of AAV/ChR2 vector-injected NAc slice demonstrating colocalization of GFP expression with ChAT antibody, co-stained with DAPI. (E, F) Fear was measured by retrieval process in fear conditioning test. P-values were calculated by one-way ANOVA with Bonferroni’s multiple comparisons test. F (2, 28)=10.50, p=0.0004 for (E). F (2, 28)=6.356, p=0.0053 for (F). n = 8 (ChatCre-AAV/mCherry), 14 (Chat-Mecp2-/y-AAV/mCherry), 9 (Chat-Mecp2-/y-AAV/ChR2). Data are means ± SEM. *p<0.05, **p<0.01, ***p<0.001. (See also Figure 2—figure supplement 1).
-
Figure 4—source data 1
Statistical reporting of Figure 4.
- https://cdn.elifesciences.org/articles/55342/elife-55342-fig4-data1-v2.xlsx
Figure 4—figure supplement 1
Activation of NAc Cholinergic Interneurons Rescued Fear Deficits in Chat-Mecp2-/y Mice, Related to Figure 4.
(A, B) Representative spontaneous firing (A) and summary histogram (B) of hM3Dq-mCherry expressing ChAT neurons in Chat-Mecp2-/y mice before (red) and after (gray) CNO treatment. P-values were calculated by two-tailed paired t-test. t = 4.442, df = 5, p=0.0067. n = 6 neurons from three mice. (C) Fear conditioning test was conducted 30 min after CNO injection. P-values were calculated by one-way analysis of variance (ANOVA) with Bonferroni’s multiple comparisons test. F (2, 26)=5.245, p=0.0122 for Trial four during fear learning. Bonferroni’s multiple comparisons test: P (ChatCre-AAV/mCherry vs. Chat-Mecp2-/y-AAV/mCherry)=0.0072, P (Chat-Mecp2-/y-AAV/mCherry vs. Chat-Mecp2-/y-AAV/hM3Dq)=0.1148. n = 10 (ChatCre-AAV/mCherry), 10 (Chat-Mecp2-/y-AAV/mCherry), 9 (Chat-Mecp2-/y-AAV/hM3Dq). (D) Up: Consecutive action potentials in AAV/ChR2-affected cholinergic interneurons evoked by a 470 nm pulse train (5 ms pulse width; 8 Hz). Down: Average success probability for generating action potentials in AAV/ChR2-affected cholinergic interneurons at different stimulation frequencies. n = 8 neurons from three mice. (E) Fear conditioning test was conducted with 8 Hz blue light during the training. P-values were calculated by one-way analysis of variance (ANOVA) with Bonferroni’s multiple comparisons test. F (2, 28)=4.160, p=0.0262 for Trial four during fear learning. Bonferroni’s multiple comparisons test: P (ChatCre-AAV/mCherry vs. Chat-Mecp2-/y-AAV/mCherry)=0.0290, P (Chat-Mecp2-/y-AAV/mCherry vs. Chat-Mecp2-/y-AAV/ChR2)=0.0846. n = 8 (ChatCre-AAV/mCherry), 14 (Chat-Mecp2-/y-AAV/mCherry), 9 (Chat-Mecp2-/y-AAV/ChR2). (F, G) Freezing time was measured in chamber for 2 min without shock. P-values were calculated by one-way analysis of variance (ANOVA) with Bonferroni’s multiple comparisons test. F (2, 26)=1.541, p=0.2332, n = 10 (ChatCre-AAV/mCherry), 10 (Chat-Mecp2-/y-AAV/mCherry), 9 (Chat-Mecp2-/y-AAV/hM3Dq) for F; F (2, 28)=0.1714, p=0.8434, n = 8 (ChatCre-AAV/mCherry), 14 (Chat-Mecp2-/y-AAV/mCherry), 9 (Chat-Mecp2-/y-AAV/ChR2) for G. (H) Locomotor activity was measured in open field test after injection of CNO. P-values were calculated by one-way analysis of variance (ANOVA) with Bonferroni’s multiple comparisons test. F (2, 21)=0.1139, p=0.8929. n = 6 (ChatCre-AAV/mCherry), 8 (Chat-Mecp2-/y-AAV/mCherry), 9 (Chat-Mecp2-/y-AAV/hM3Dq). Data are means ± SEM. *p<0.05, **p<0.01, NS means no significance.
Figure 5 with 1 supplement
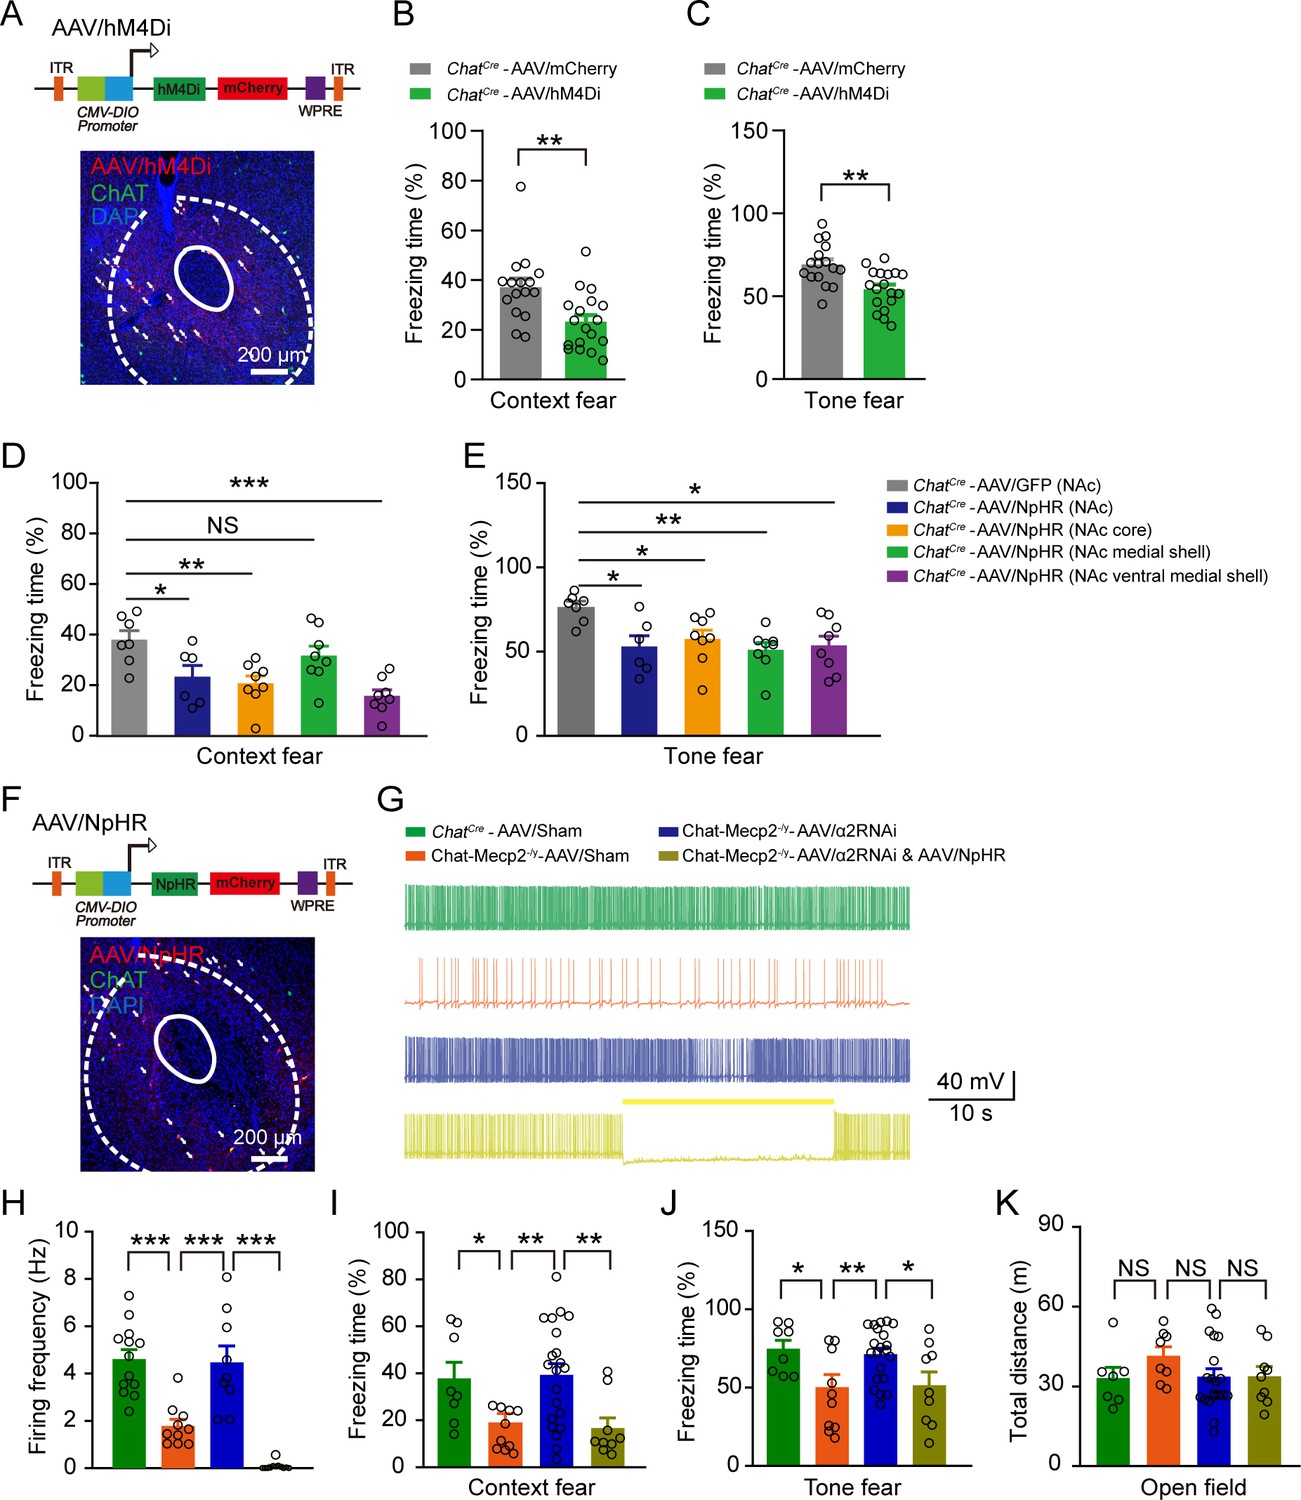
Inhibition of NAc Cholinergic Interneurons in ChatCre Mice Mimicked Fear Deficits in Chat-Mecp2-/y Mice.
(A) Schematic of AAV/hM4Di viral construct. Confocal image of injected NAc slice demonstrating colocalization of mCherry expression with ChAT antibody, co-stained with DAPI. (B, C) Fear retrieval was measured by retrieval process in fear conditioning test. P-values were calculated by two-tailed unpaired t-test. t = 3.204, df = 32, p=0.0031 for (B). t = 3.572, df = 32, p=0.0011 for (C). n = 16 (ChatCre-AAV/mCherry), 18 (ChatCre-AAV/hM4Di). (D, E) Fear retrieval was measured by retrieval process in fear conditioning test with opto-inhibition of cholinergic neurons in different NAc subregions. P-values were calculated by two-tailed unpaired t-test. t = 2.530, df = 11, p=0.0280 comparison of NpHR (NAc) effect in context fear. t = 3.662, df = 13, p=0.0029 comparison of NpHR (NAc core) effect in context fear. t = 1.179, df = 13, p=0.2593 comparison of NpHR (NAc medial shell) effect in context fear. t = 5.140, df = 13, p=0.0002 comparison of NpHR (NAc ventral medial shell) effect in context fear. t = 3.308, df = 11, p=0.0113 comparison of NpHR (NAc) effect in tone fear. t = 2.600, df = 13, p=0.0220 comparison of NpHR (NAc core) effect in tone fear. t = 4.181, df = 13, p=0.0011 comparison of NpHR (NAc medial shell) effect in tone fear. t = 3.026, df = 13, p=0.0097 comparison of NpHR (NAc ventral medial shell) effect in tone fear. n = 7 (ChatCre-AAV/GFP in NAc), 6 (ChatCre-AAV/NpHR in NAc), 8 (ChatCre-AAV/NpHR in NAc core), 8 (ChatCre-AAV/NpHR in NAc medial shell), 8 (ChatCre-AAV/NpHR in NAc ventral medial shell). (F) Schematic of AAV/NpHR viral construct. Confocal image of injected NAc slice demonstrating colocalization of mCherry expression with ChAT antibody, co-stained with DAPI. (G, H) Example traces (G) and statistical results (H) of spontaneous spiking recorded from cholinergic interneurons in NAc of different groups. P-values were calculated by one-way ANOVA with Newman-keuls multiple comparison test. F (3, 40)=33.06, p<0.0001. n = 13 neurons from three mice (ChatCre-AAV/Sham), 10 neurons from three mice (Chat-Mecp2-/y-AAV/Sham), 9 neurons from three mice (Chat-Mecp2-/y-AAV/α2RNAi), 12 neurons from four mice (Chat-Mecp2-/y-AAV/α2RNAi and AAV/NpHR). (I, J) Fear retrieval was measured by retrieval process in fear conditioning test. P-values were calculated by one-way ANOVA with Newman-keuls multiple comparisons test. F (3, 44)=6.066, p=0.0015 in (I). F (3, 44)=5.426, p=0.0029 in (J). n = 8 mice (ChatCre-AAV/Sham), 10 mice (Chat-Mecp2-/y-AAV/Sham), 21 mice (Chat-Mecp2-/y-AAV/α2RNAi), nine mice (Chat-Mecp2-/y-AAV/α2RNAi and AAV/NpHR). (K) Locomotor activity (15 min) was measured in open field test. P-values were calculated by one-way ANOVA with Newman-keuls multiple comparisons test. F (3, 40)=0.9904, p=0.4071. n = 7 (ChatCre-AAV/Sham), 8 (Chat-Mecp2-/y-AAV/Sham), 20 (Chat-Mecp2-/y-AAV/α2RNAi), nine mice (Chat-Mecp2-/y-AAV/α2RNAi and AAV/NpHR). Data are means ± SEM. *p<0.05, **p<0.01, ***p<0.001, NS means no significance. (See also Figure 2—figure supplement 1).
-
Figure 5—source data 1
Statistical reporting of Figure 5.
- https://cdn.elifesciences.org/articles/55342/elife-55342-fig5-data1-v2.xlsx
Figure 5—figure supplement 1
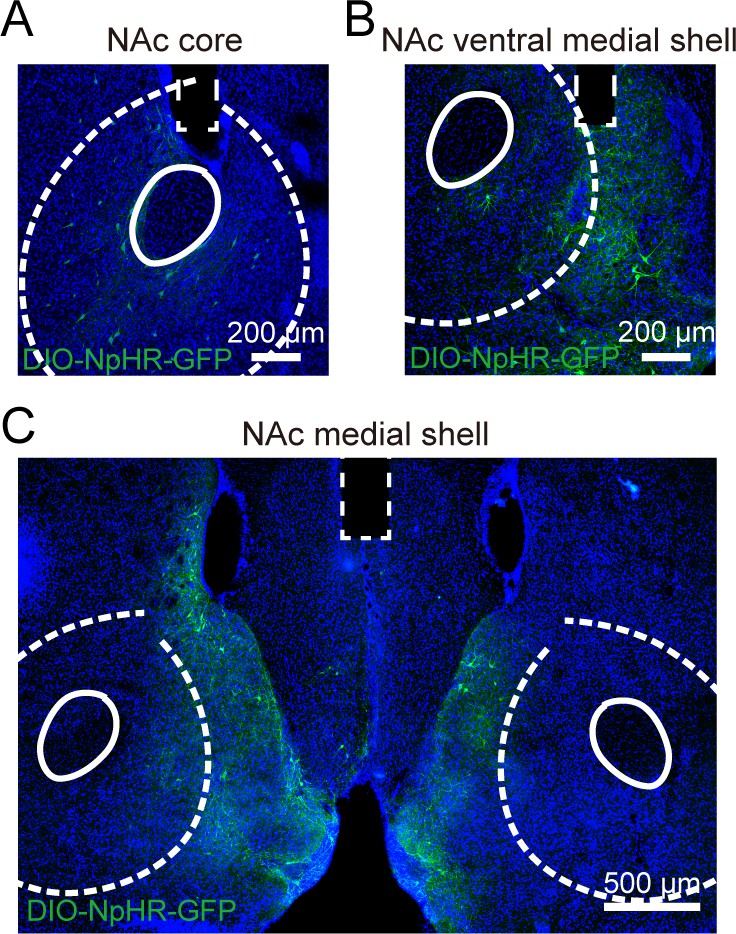
Inhibition of NAc Cholinergic Interneurons in ChatCre Mice, Related to Figure 5.
Confocal image of injected NAc slice demonstrating localization of NpHR expression and fiber position in NAc core (A), NAc ventral medial shell (B), and NAc medial shell (C).
Figure 6 with 2 supplements
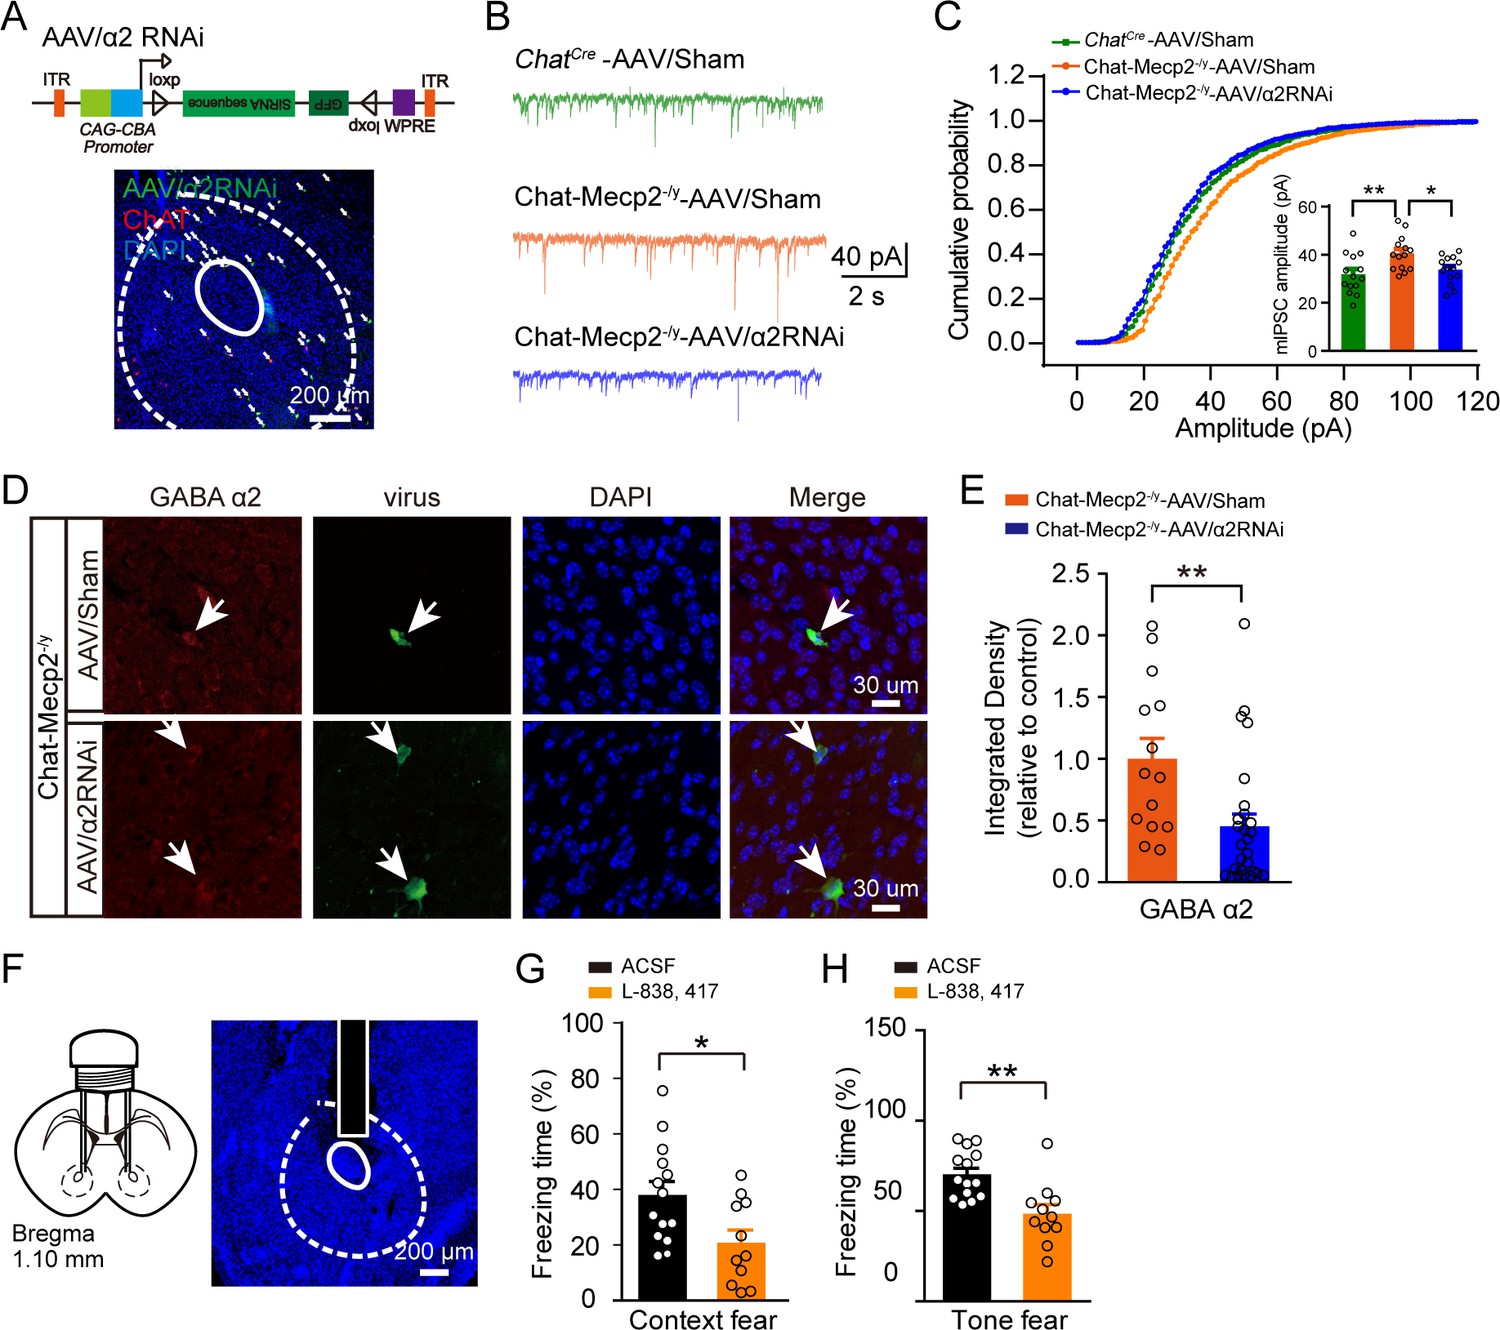
Manipulation of α2-GABAA Receptors in NAc Mimicked Fear Deficits in Chat-Mecp2-/y Mice.
(A) Schematic of AAV/RNAi viral construct. Confocal image of injected NAc slice demonstrating colocalization of GFP expression with ChAT antibody, co-stained with DAPI. (B, C) mIPSCs of AAV/RNAi-infected NAc neurons from Chat-Mecp2-/y mice were rescued. (B) Examples of mIPSC traces. (C) Cumulative distribution of mIPSC amplitude of NAc neurons infected by AAV-Sham or AAV/RNAi. P-values were calculated by one-way analysis of variance (ANOVA) with Bonferroni’s multiple comparisons test. F (2, 39)=5.816, p=0.0062. n = 14 neurons from four mice for each group. (D) Representative images of NAc slices from Chat-Mecp2-/y mice injected with AAV/GFP or AAV/RNAi. (E) Statistically integrated immunofluorescence data of α2-GABAA receptors normalized to AAV/GFP levels. P-values were calculated by two-tailed unpaired t-test. t = 2.985, df = 39, p=0.0049. n = 27 neurons from three mice (AAV/RNAi), 14 neurons from three mice (AAV/Sham). (F) Left: Schematic of cannula implantation. Right: Infusion sites of drugs, stained with DAPI. (G, H) Fear deficit was measured by retrieval process in fear conditioning test 20 min after drug application. P-values were calculated by two-tailed unpaired t-test. t = 2.542, df = 23, p=0.0182 for (E). t = 3.609, df = 23, p=0.0015 for (F). n = 14 mice for ACSF, n = 11 mice for L-838,417. Data are means ± SEM. *p<0.05, **p<0.01.
-
Figure 6—source data 1
Statistical reporting of Figure 6.
- https://cdn.elifesciences.org/articles/55342/elife-55342-fig6-data1-v2.xlsx
Figure 6—figure supplement 1
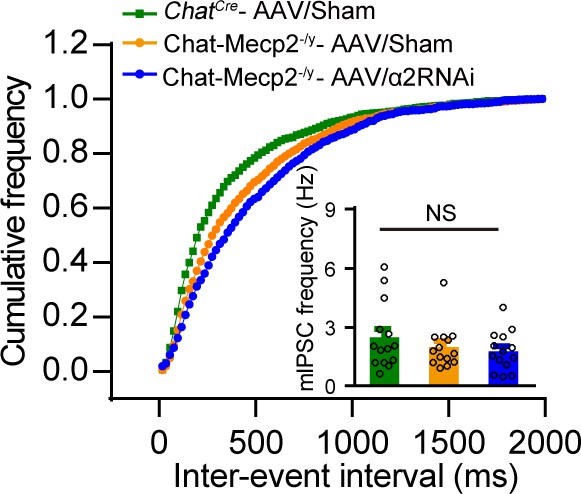
Knockdown of α2-GABAA Receptors in Cholinergic Interneurons Did Not Affect mIPSC Frequency in Cholinergic Interneurons, Related to Figure 6.
Cumulative distribution of mIPSC amplitude in NAc neurons infected by AAV-Sham or AAV/RNAi. P-values were calculated by one-way analysis of variance (ANOVA) with Bonferroni’s multiple comparisons test. F (2, 39)=1.066, p=0.3541. n = 14 neurons from four mice for each group. NS means no significance.
Figure 6—figure supplement 2
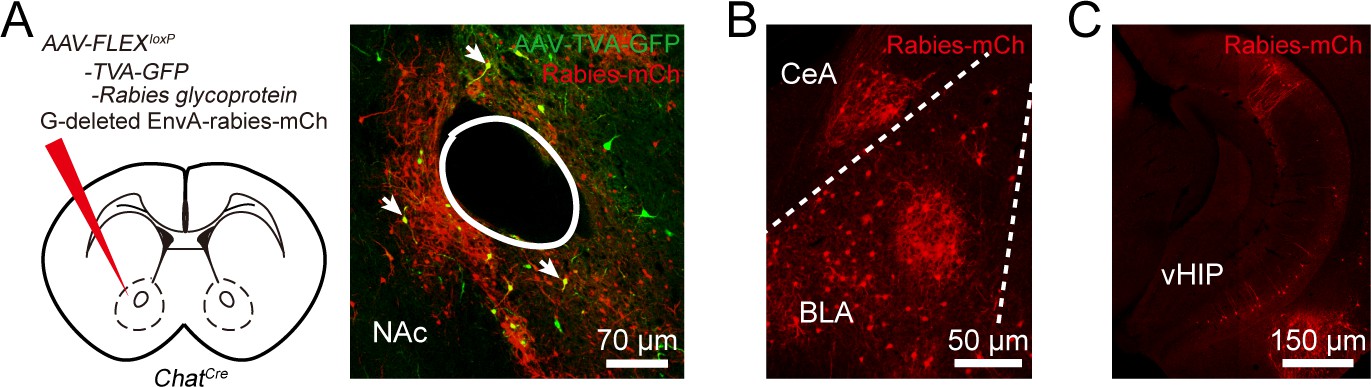
Retrograde tracing from NAc cholinergic neurons.
(A) Sequential injections of AAV-FLEX-TVA-GFP, AAV-FLEX-Rabies-glycoprotein and G-deleted EnA-rabies-mCh into NAc of a ChatCre mouse labeled starter cells (yellow). (B, C) Transsynaptic retrograde labeling neurons in the BLA (B) and (vHPC). BLA: basolateral amygdala. CeA: central nucleus of the amygdala. vHIP: ventral hippocampus.
Tables
Key resources table
| Reagent type (species) or resource | Designation | Source or reference | Identifiers | Additional information |
|---|---|---|---|---|
| Genetic reagent (M. musculus) | ChatCre | Jackson Laboratory | Jax No.006410 | |
| Genetic reagent (M. musculus) | MeCP2 Flox/- | Jackson Laboratory | Jax No.006847 | |
| Antibody | Goat polyclonal anti-ChAT | Millipore | Cat# AB144P | IHC: 1:100 |
| Antibody | Rabbit monoclonal anti-MeCP2 | Cell Signaling Technology | Cat#3456 s | IHC: 1:200 |
| Antibody | Mouse monoclonal anti-PV | Swant | Cat#PV235 | IHC: 1:1 000 |
| Antibody | Rabbit polyclonal GABAA receptor α1 | Millipore | Cat#06–868 | IHC: 1:1 000 WB: 1:500 |
| Antibody | Rabbit polyclonal GABAA receptor α2 | Synaptic System | Cat#224 103 | IHC: 1:1 000 |
| Antibody | Rabbit polyclonal GABAA receptor α2 | Abcam | Cat#ab72445 | WB: 1:500 |
| Antibody | Rabbit monoclonal anti-GAPDH | Cell Signaling Technology | Cat#5014S | WB: 1:5000 |
Additional files
Download links
A two-part list of links to download the article, or parts of the article, in various formats.
Downloads (link to download the article as PDF)
Open citations (links to open the citations from this article in various online reference manager services)
Cite this article (links to download the citations from this article in formats compatible with various reference manager tools)
MeCP2 in cholinergic interneurons of nucleus accumbens regulates fear learning
eLife 9:e55342.
https://doi.org/10.7554/eLife.55342


