CNGA3 acts as a cold sensor in hypothalamic neurons
- Department of Cellular and Molecular Physiology, Yale University School of Medicine, United States
- Department of Neuroscience, Yale University School of Medicine, United States
- Program in Cellular Neuroscience, Neurodegeneration and Repair, Yale University School of Medicine, United States
- Department of Biology, University of Wisconsin-Oshkosh, United States
Figures
Figure 1
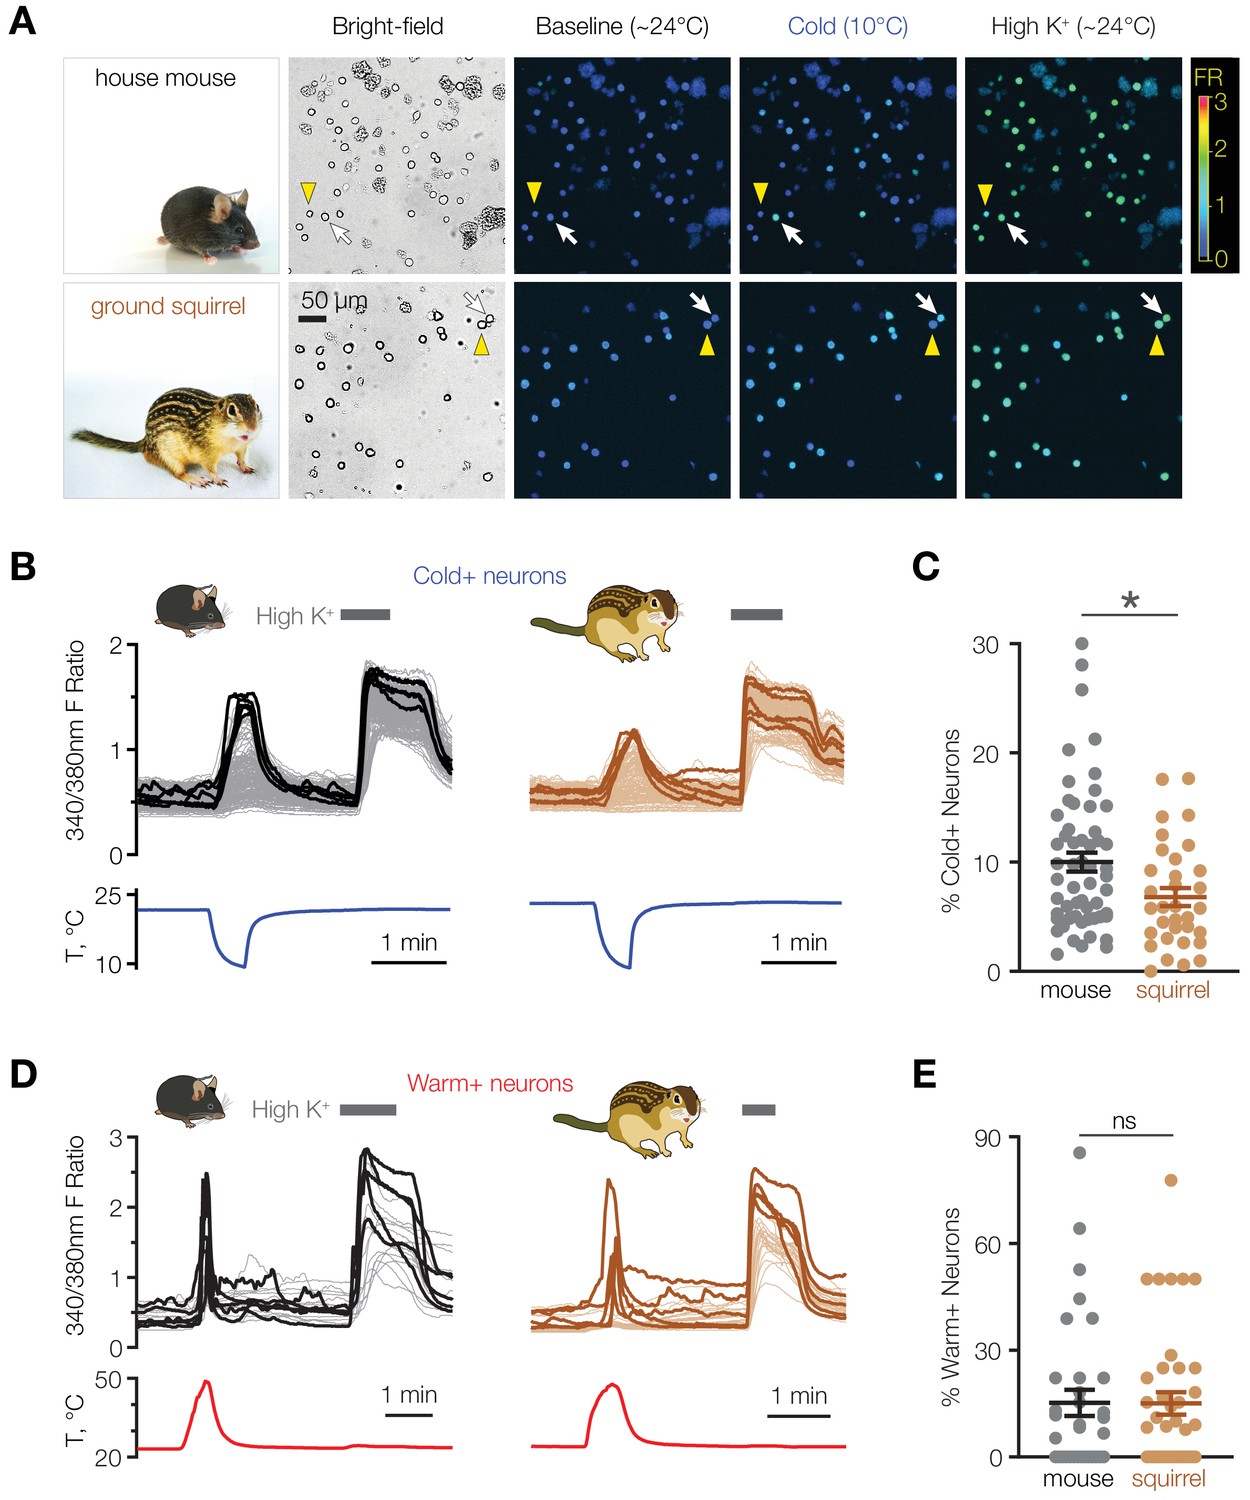
Mice have a higher proportion of cold-sensitive POA neurons than ground squirrels.
(A) Representative bright-field and ratiometric calcium images of POA neurons from house mouse and thirteen-lined ground squirrel at baseline (~24°C), after cooling to 10°C, and after perfusion with 116 mM [K+] (“High K+”) demonstrate cold-sensitive (white arrows) and cold-insensitive (yellow arrowheads) POA neurons. Ratiometric images are pseudocolored according to the fluorescence ratio (FR) scale bar. Photos courtesy of the Gracheva laboratory. (B) Fluorescent ratio traces in response to a cooling ramp for individual POA neurons from a representative coverslip from mouse (left panel, N = 182 neurons) and ground squirrel (right panel, N = 129 neurons). POA neurons were harvested and plated on multiple coverslips per animal as shown in Figure 2A. Five neurons with the highest cold response amplitude are highlighted with thick lines. (C) Percentage of cold-sensitive (“Cold+”) POA neurons in mice and ground squirrels. *p<0.05, Mann-Whitney test. Each data point represents one coverslip. The horizontal line and error bars denote mean and SEM. N = 56 coverslips from 13 mice vs 33 coverslips from nine ground squirrels. (D) Fluorescent ratio traces in response to a warming ramp for individual POA neurons from a representative coverslip from mouse (left panel, N = 18 neurons) and ground squirrel (right panel, N = 28 neurons). Five neurons with the highest warm response amplitude are highlighted with thick lines. (E) Percentage of warm-sensitive (“Warm+”) POA neurons in mice and ground squirrels. p>0.05 (‘ns’), Mann-Whitney test. Each data point represents one coverslip. N = 33 coverslips from 6 mice vs 39 coverslips from 7 ground squirrels.
-
Figure 1—source data 1
Percentage of cold-sensitive and warm-sensitive POA neurons in mice and ground squirrels.
- https://cdn.elifesciences.org/articles/55370/elife-55370-fig1-data1-v2.xlsx
Figure 2
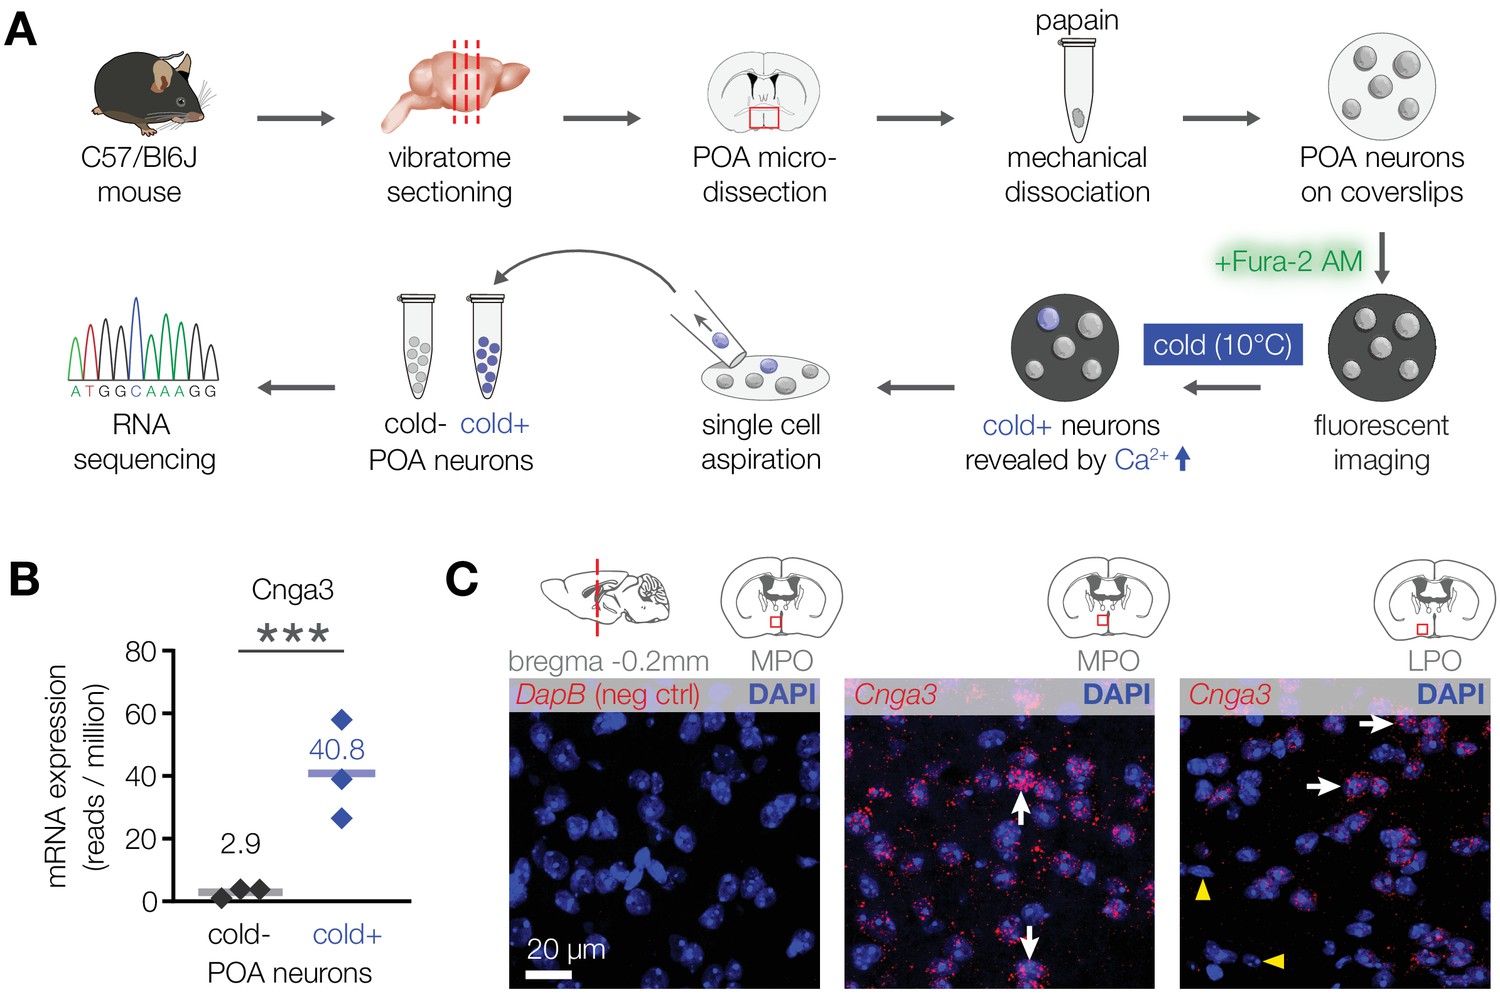
CNGA3 is enriched in cold-sensitive POA neurons in mice.
(A) A schematic diagram of the imaging-guided collection and separation of cold-sensitive and cold-insensitive mouse POA neurons for differential transcriptomics. (B) Quantification of Cnga3 transcript in cold-sensitive (“cold+”) and cold-insensitive (“cold−“) mouse POA neurons determined by RNA sequencing. ***p<0.001, GLM quasi-likelihood F-test (EdgeR). N = 3 independent biological replicates containing ~ 100–200 POA neurons each collected over 2–5 mice/independent neuron isolations. (C) RNA in situ hybridization images (maximal intensity projections of confocal Z-stacks) of the POA probed for Cnga3 (middle and right panels) and DapB (negative control; left panel) reveal neurons with abundant Cnga3 expression (white arrows) and neurons with no Cnga3 expression (yellow arrowheads) in the medial preoptic area (MPO) and lateral preoptic area (LPO). Brain sections correspond to AP coordinate of bregma −0.2 mm. Images are representative of 8 fields-of-view from 4 sections from two independent procedures.
-
Figure 2—source data 1
Cnga3 expression in cold-sensitive and cold-insensitive mouse POA neurons.
- https://cdn.elifesciences.org/articles/55370/elife-55370-fig2-data1-v2.xlsx
Figure 3
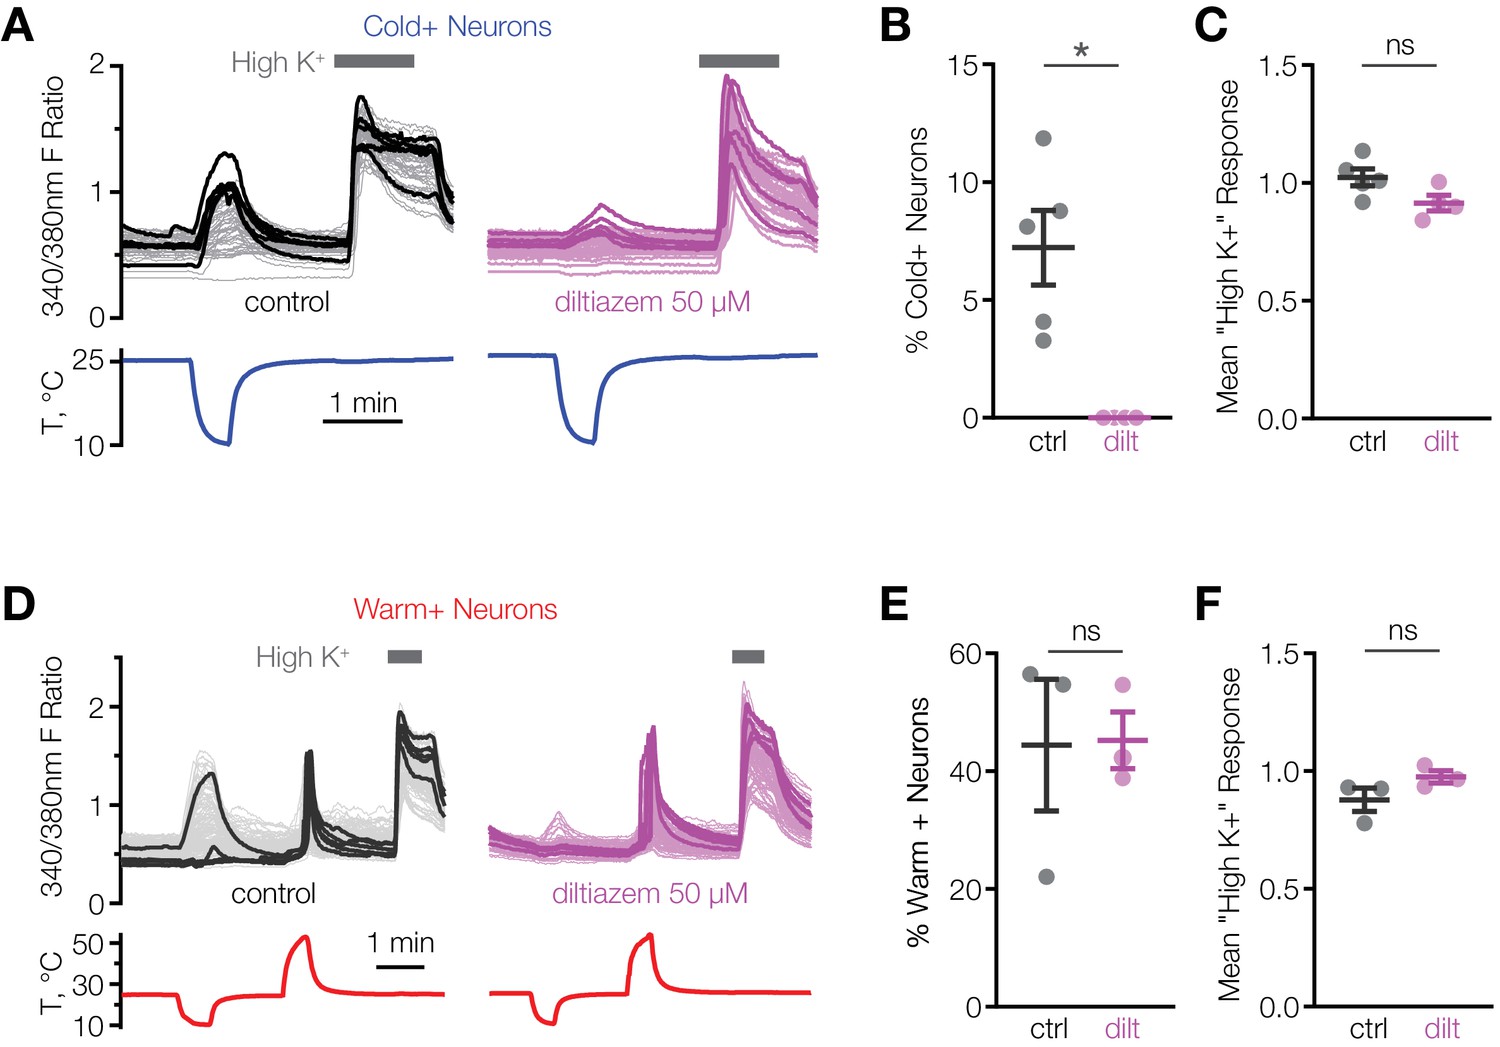
L-cis-diltiazem inhibits cold-activated neurons in mouse POA.
(A and D) Fluorescent ratio traces in response to a cooling (A) or warming (D) ramp for individual POA neurons from a representative coverslip in the absence (left panels, A: N = 49 neurons, D: N = 145 neurons) or in the presence (right panels, A: N = 39 neurons, D: N = 103 neurons) of 50 µM l-cis-diltiazem. Five neurons with the highest cold or warm response amplitude are highlighted with thicker lines. (B and E) Percentage of cold-sensitive (“Cold+”) or warm-sensitive (“Warm+”) POA neurons in the absence (‘ctrl’) or in the presence of 50 µM l-cis-diltiazem (‘dilt’). B: *p<0.05, E: p>0.05 (‘ns’), Welch’s t-test. Each data point represents one coverslip. The horizontal line and error bars denote mean and SEM. N = 4–5 coverslips from two mice in (B), 3 coverslips from one mouse in (E). (C and F) Per-coverslip average of the maximal response of all POA neurons recorded in the experiments in (B) and (E) to 116 mM [K+] solution. p>0.05 (‘ns’), Welch’s t-test.
-
Figure 3—source data 1
Percentage of cold-sensitive and warm-sensitive POA neurons and their "High K" response amplitudes with and without l-cis-diltiazem.
- https://cdn.elifesciences.org/articles/55370/elife-55370-fig3-data1-v2.xlsx
Figure 4
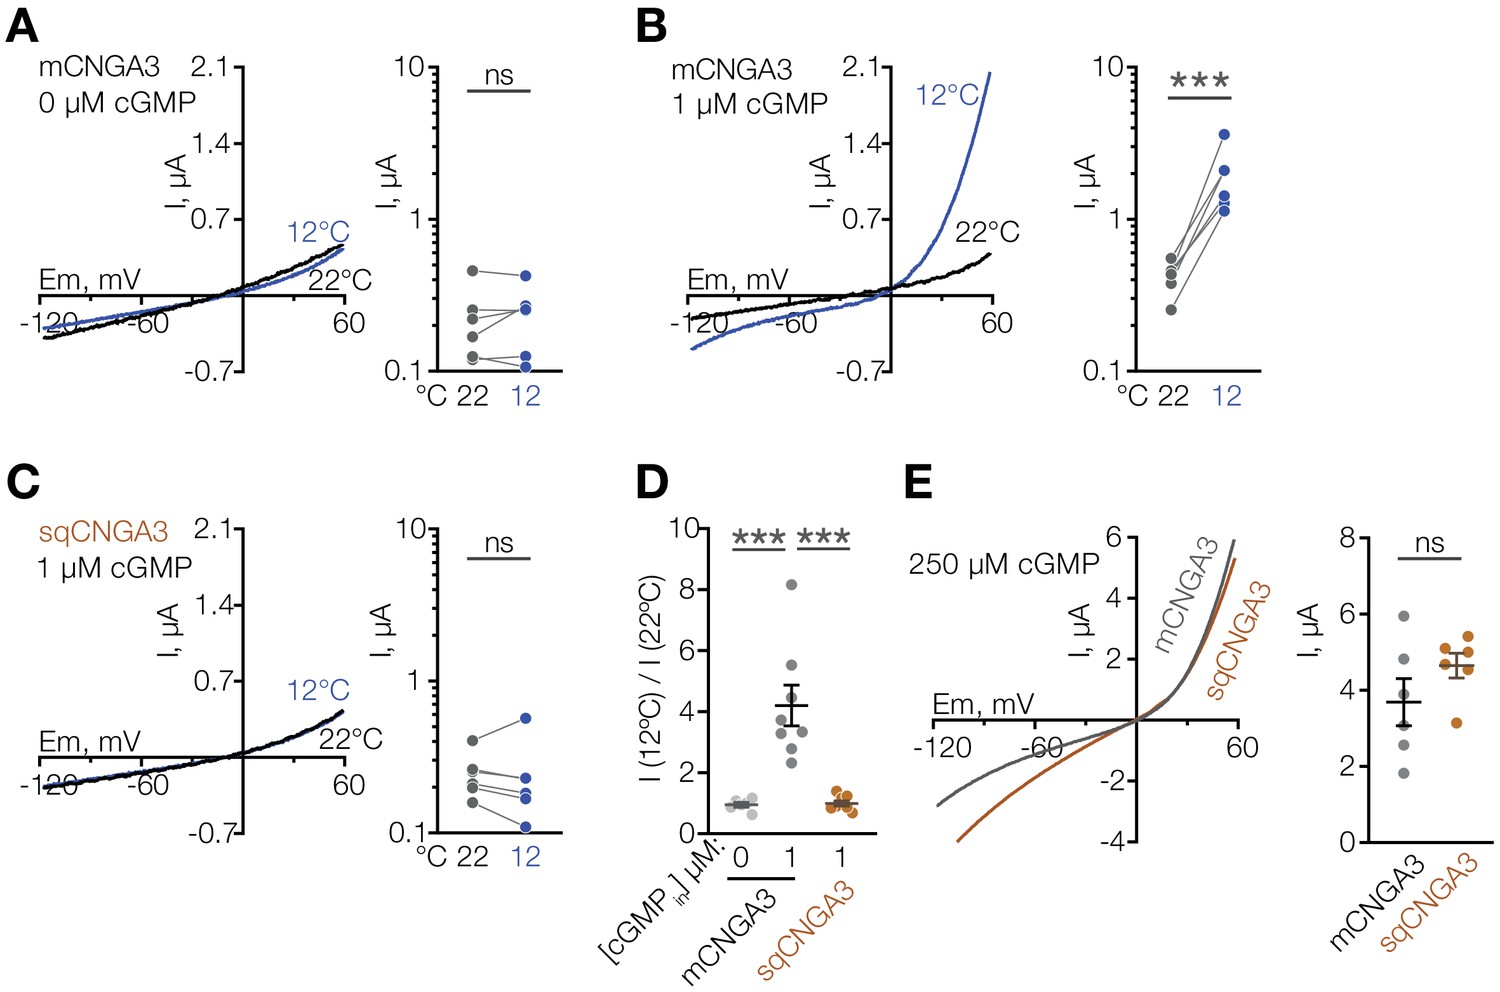
Cooling potentiates mouse but not squirrel CNGA3 in oocytes.
(A–C) Exemplar whole-cell currents (left) and quantification of current amplitude at 60 mV (right) recorded in Xenopus oocytes expressing mouse or squirrel CNGA3 in response to a voltage ramp in the presence or absence of 1 µM intracellular cGMP. (D) Quantification of the magnitude of cold activation of CNGA3 current in oocytes at 60 mV in the presence of 1 µM intracellular cGMP. (E) Exemplar whole-cell current traces (left) and quantification of current amplitude at 60 mV (right) recorded from mouse or squirrel CNGA3 in response to a voltage ramp in the presence of saturating 250 µM intracellular cGMP. Data are mean ± SEM. NS, not significant, p>0.05; ***p<0.001, paired t-test (A–C), Dunnett’s test (D), t-test (F). Each dot represents an individual cell.
-
Figure 4—source data 1
Cooling potentiates mouse but not squirrel CNGA3 in oocytes.
- https://cdn.elifesciences.org/articles/55370/elife-55370-fig4-data1-v2.xlsx
Figure 5
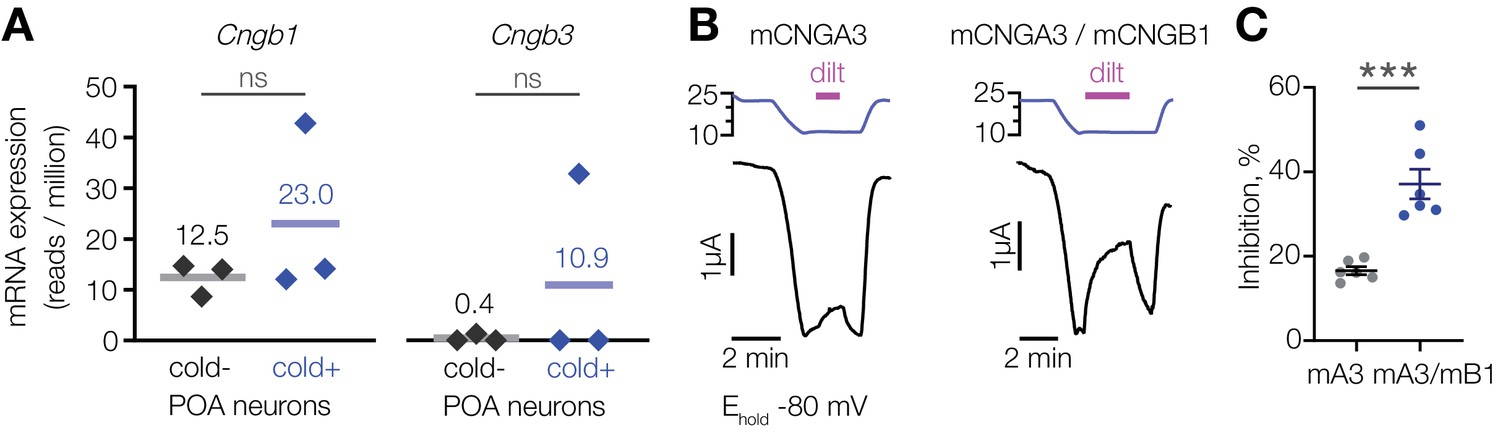
L-cis-diltiazem inhibits cold-activated current produced by CNGA3-CNGB1 heteromers.
(A) Quantification of Cngb1 and Cngb3 transcripts in cold-sensitive (“cold+”) and cold-insensitive (“cold−”) mouse POA neurons determined by RNA sequencing. ‘ns’, not significant, p>0.05, GLM quasi-likelihood F-test (EdgeR). N = 3 independent biological replicates containing ~ 100–200 POA neurons each collected over 2–5 mice/independent neuron isolations. (B) Exemplar whole-cell currents obtained from Xenopus oocytes expressing mouse CNGA3 alone or with mouse CNGB1, recorded at −80 mV at different temperatures in the presence of 1 µM intracellular cGMP and 100 µM extracellular l-cis-diltiazem (‘dilt’). (C) Quantification of maximum inhibition of cold-activated current by l-cis-diltiazem. Data are mean ± SEM. ***p<0.001, t-test. Each dot represents an individual cell.
-
Figure 5—source data 1
L-cis-diltiazem inhibits cold-activated current produced by CNGA3-CNGB1 heteromers.
- https://cdn.elifesciences.org/articles/55370/elife-55370-fig5-data1-v2.xlsx
Figure 6
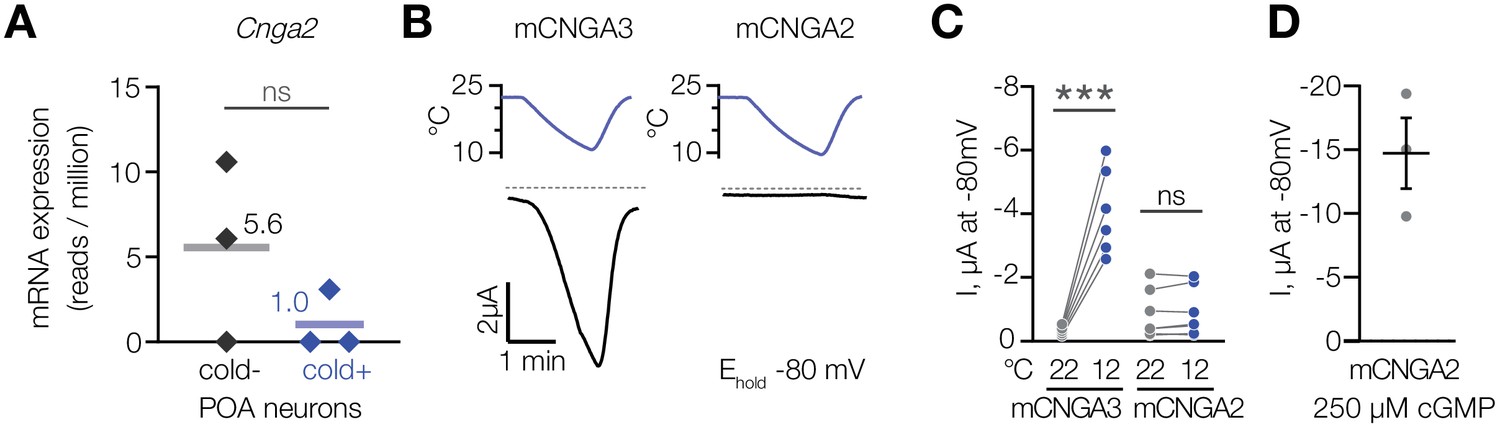
Cooling does not affect CNGA2 current.
(A) Quantification of Cnga2 transcript in cold-sensitive (“cold+”) and cold-insensitive (“cold−”) mouse POA neurons determined by RNA sequencing. ‘ns’, not significant, p>0.05, GLM quasi-likelihood F-test (EdgeR). N = 3 independent biological replicates containing ~ 100–200 POA neurons each collected over 2–5 mice/independent neuron isolations. (B) Exemplar whole-cell currents obtained from Xenopus oocytes expressing mouse CNGA3 and CNGA2, recorded at −80 mV at different temperatures in the presence of 1 µM intracellular cGMP. (C) Quantification of the effect of cooling on CNGA3 and CNGA2 current in the presence of 1 µM intracellular cGMP. (D) Quantification of mCNGA2 activity in the presence of 250 µM intracellular cGMP measured at −80 mV at 22°C. Data are mean ± SEM. ‘ns’, not significant, p>0.05; ***p<0.001, paired t-test. Each dot represents an individual cell.
-
Figure 6—source data 1
Cooling does not affect CNGA2 current.
- https://cdn.elifesciences.org/articles/55370/elife-55370-fig6-data1-v2.xlsx
Figure 7 with 1 supplement
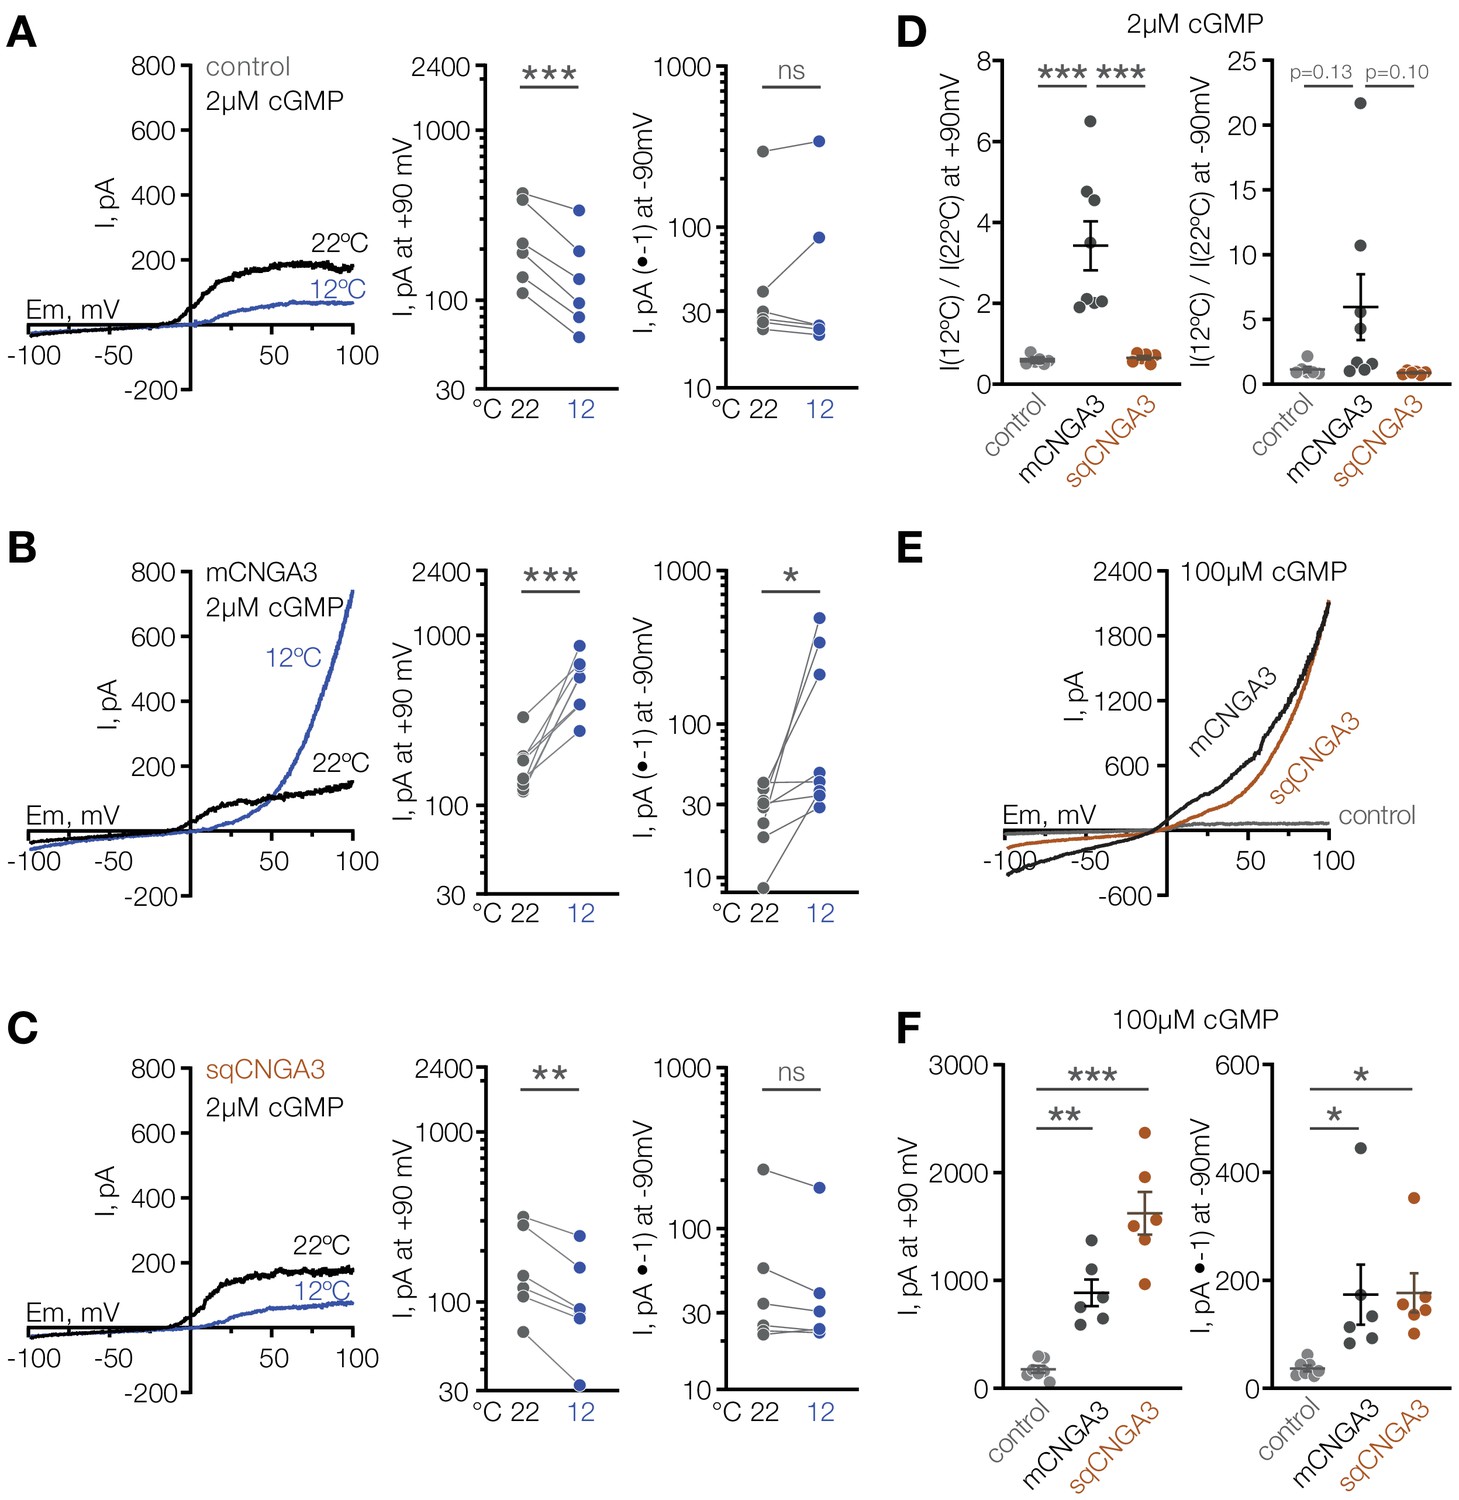
Cooling activates mouse but not squirrel CNGA3 in HEK293T cells.
(A–C) Exemplar whole-cell currents (left) and quantification of current amplitude at 90 mV (middle) and −90 mV (right) recorded in HEK293T cells expressing empty vector (control) or CNGA3 in response to a voltage ramp in the presence of 2 µM intracellular cGMP, at indicated temperatures. Currents were elicited by voltage ramps from −100 mV to 100 mV from a holding potential of −60 mV. (D) Quantification of the magnitude of cold activation of CNGA3 current in HEK293T cells in the presence of 2 µM intracellular cGMP at 90 mV (left) and −90 mV (right). (E) Exemplar whole-cell current traces evoked in HEK293T cells expressing mCNGA3, sqCNGA3 or empty vector (control) by voltage ramps from −100 mV to 100 mV from a holding potential of −60 mV in the presence of saturating 100 µM intracellular cGMP at 22°C. (F) Quantification of current amplitude at 90 mV (left) and −90 mV (right) in the presence of saturating 100 µM intracellular cGMP at 22°C. Data are mean ± SEM. **p<0.01; ***p<0.001, paired t-test (A–C) or Dunnett’s test (D, F). Each dot represents individual cell.
-
Figure 7—source data 1
Reversible activation of mouse CNGA3 in HEK293T cells.
- https://cdn.elifesciences.org/articles/55370/elife-55370-fig7-data1-v2.xlsx
Figure 7—figure supplement 1

Reversible activation of mouse CNGA3 in HEK293T cells.
Exemplar whole-cell current traces obtained from mCNGA3 in the presence of 2 µM intracellular cGMP in response to temperature ramps. Currents were elicited by voltage ramps from −100 mV to 100 mV from a holding potential of −60 mV.
Figure 8
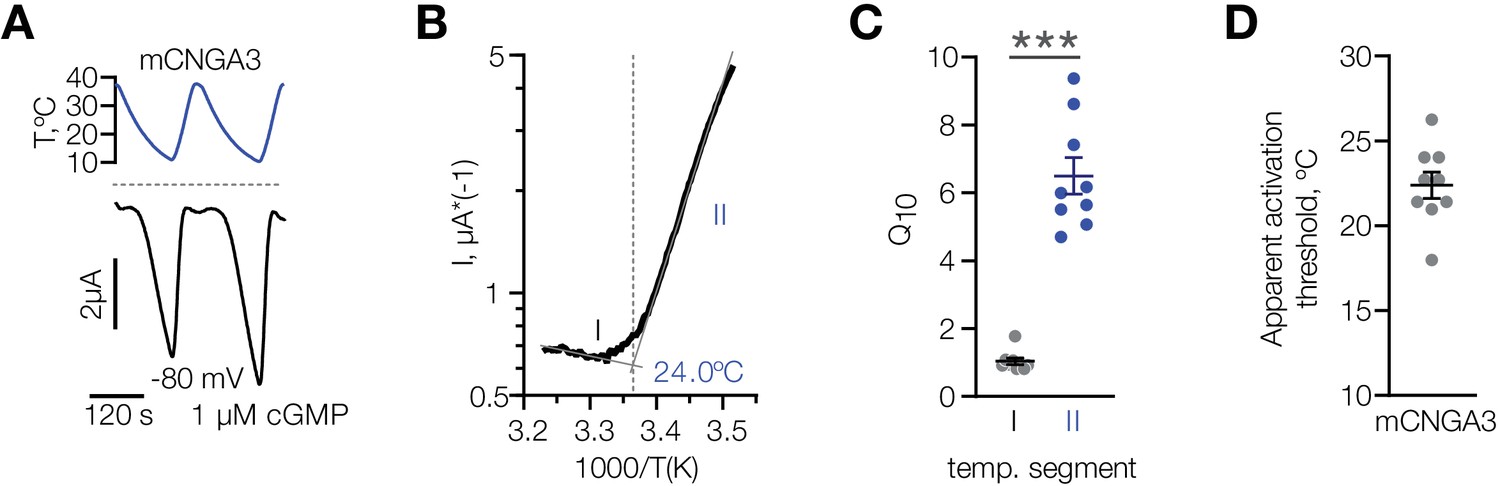
Characterization of cold sensitivity of mouse CNGA3.
(A) Exemplar whole-cell currents obtained from Xenopus oocytes expressing mouse CNGA3 at −80 mV and 1 µM intracellular cGMP in response to temperature ramps from 37°C to 10°C. (B) Exemplar Arrhenius plot obtained from a recording as in (A) showing a bi-phasic temperature dependence of mCNGA3 current and apparent temperature activation threshold for this cell (24°C). (C) Quantification of the effect of cold on mCNGA3 current over 10°C (activation coefficient, [Q10]). (D) Quantification of the apparent threshold of thermal activation of mCNGA3 from Arrhenius plots. Data are mean ± SEM; ***p<0.001, t-test.
-
Figure 8—source data 1
Characterization of cold sensitivity of mouse CNGA3.
- https://cdn.elifesciences.org/articles/55370/elife-55370-fig8-data1-v2.xlsx
Figure 9
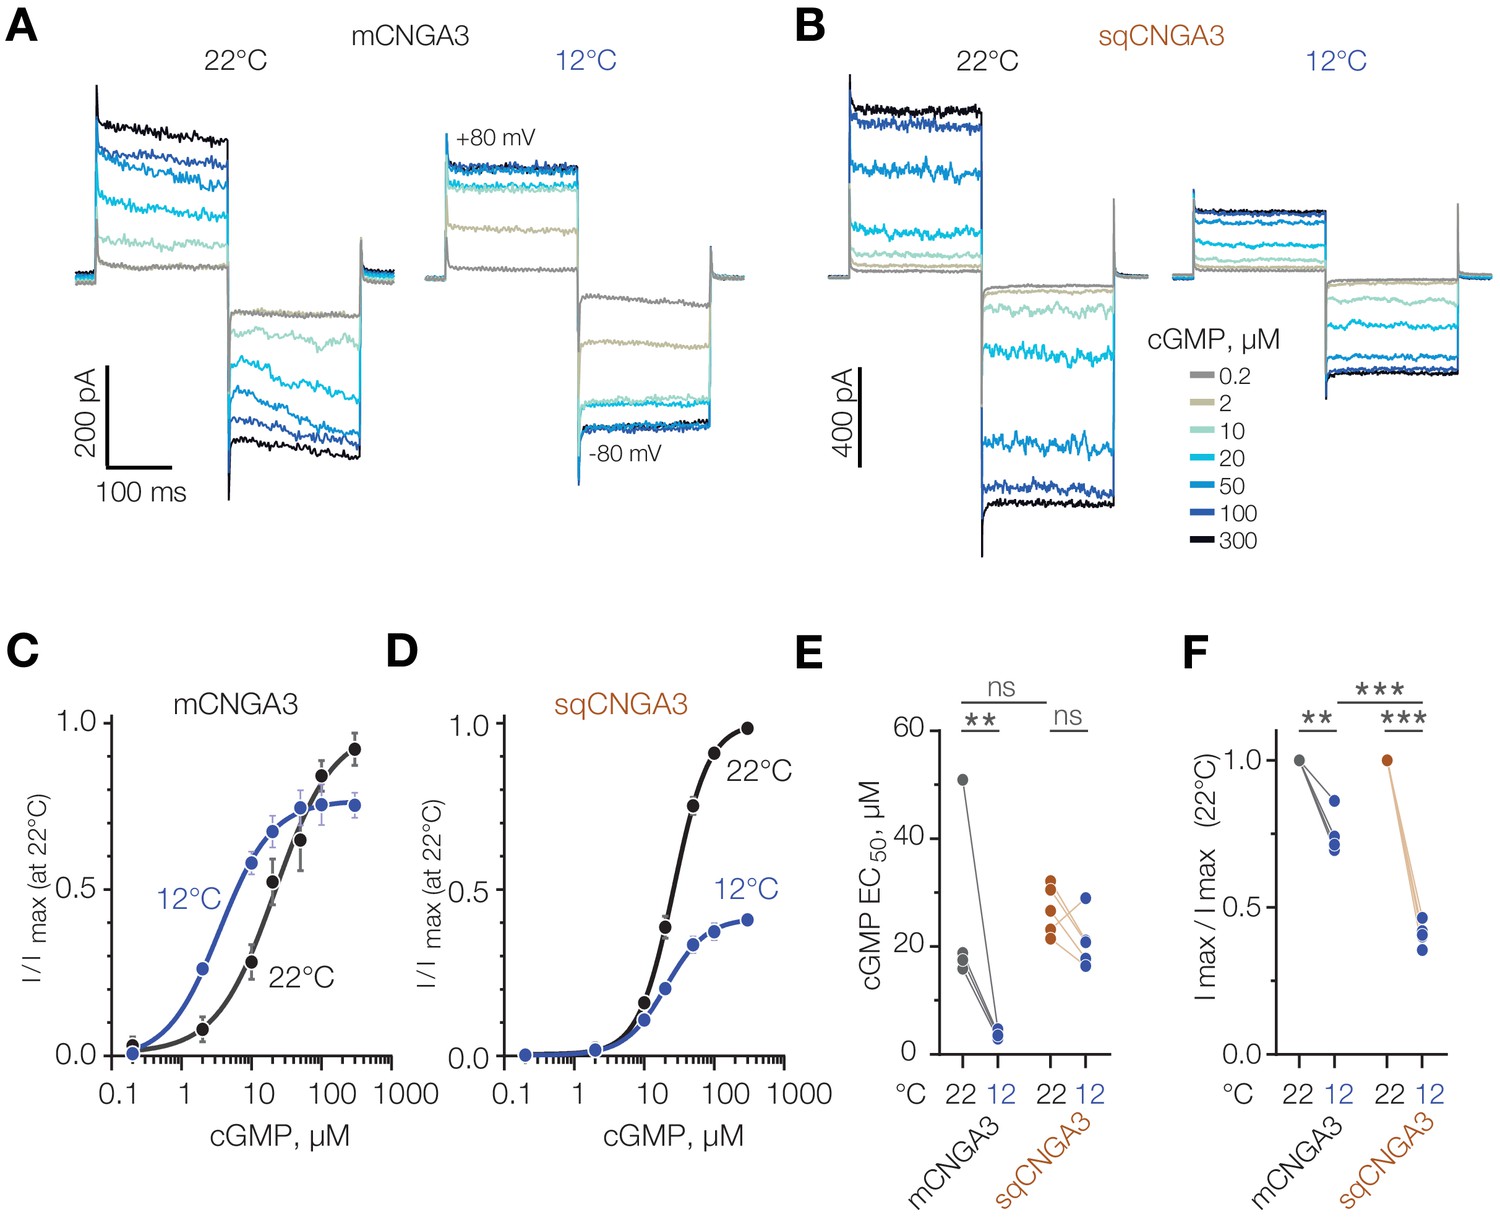
Cold decreases half-maximal effective concentration of cGMP for mouse CNGA3.
(A, B) Exemplar current traces obtained in response to square voltage steps from inside-out patches of HEK293T cells expressing CNGA3. Each patch was tested at 22°C and 12°C at indicated ‘intracellular’ cGMP concentrations. (C, D) Concentration-dependence of CNGA3 on cGMP measured at 22°C and 12°C at −80 mV and normalized to maximal response at 22°C. Maximal responses were obtained by fitting the experimental data to a modified Hill equation (solid line). Data shown as mean ± SEM from 4 and 5 patches for mouse and squirrel CNGA3 respectively. (E) Quantification of half-maximal effective cGMP concentration (EC50) for mouse and squirrel CNGA3 at different temperatures obtained from Hill fits in (C). Lines connect data points from individual patches measured at 22°C and 12°C. Statistical analysis: non-paired t-test (between 22°C data for different species), paired t-test (between 22°C and 12°C data pairs). (F) Quantification of maximal activity for mouse and squirrel CNGA3 at different temperatures obtained from Hill fits in (D). Lines connect data points from individual patches measured at 22°C and 12°C. Statistical analysis: non-paired t-test (between 12°C data for different species), paired t-test (between 22°C and 12o C data pairs). Error bars: mean ± SEM. ‘ns’, not significant, p>0.05; **p<0.01; ***p<0.001.
-
Figure 9—source data 1
Cold decreases half-maximal effective concentration of cGMP for mouse CNGA3.
- https://cdn.elifesciences.org/articles/55370/elife-55370-fig9-data1-v2.xlsx
Tables
Key resources table
| Reagent type (species) or resource | Designation | Source or reference | Identifiers | Additional information |
|---|---|---|---|---|
| Gene (Mus musculus) | Cnga3 | This paper | GenBank MN381859 | Materials and methods |
| Gene (Ictidomys tridecemlineatus) | Cnga3 | This paper | GenBank MN381860 | Materials and methods |
| Strain, strain background (Mus musculus) | C57Bl/6J | The Jackson Laboratory, Bar Harbor, ME | RRID:IMSR_JAX:000664 | Materials and methods |
| Strain, strain background (Ictidomys tridecemlineatus) | Thirteen-lined Ground Squirrel | Gracheva laboratory’s colony | N/A | Materials and methods |
| Cell line (H. sapiens) | HEK293TΔPIEZO1 | Dr. Ardem Patapoutian (Scripps Research Institute) (Lukacs et al., 2015) | N/A | Materials and methods |
| Sequence-based reagent | mouse CNGA3 cloning primer forward | his paper | N/A | 5’- GAGATGGCAAAGGTGAACAC −3’ |
| Sequence-based reagent | mouse CNGA3 cloning primer reverse | this paper | N/A | 5’- GAGGCAGAGCCACCTGCATT −3’ |
| Sequence-based reagent | ground squirrel CNGA3 cloning primer forward | this paper | N/A | 5’- GGACTGAATGCAACAAGCAAG −3’ |
| Sequence-based reagent | ground squirrel CNGA3 cloning primer reverse | this paper | N/A | 5’- CCACGGAGCAGCTCATTTTC −3’ |
| Commercial assay or kit | Quick-RNA Microprep Kit | Zymo, Irvine, Ca | Cat#: R1050 | Materials and methods |
| Commercial assay or kit | SMARTer Stranded Total RNA-Seq Kit - Pico Input Mammalian | Clontech/Takara Bio, Mountain View, CA | Cat#: 635005 | Materials and methods |
| Commercial assay or kit | RNAscope Multiplex Fluorescent Reagent Kit v2 Assay | Advanced Cell Diagnostics, Hayward, CA | Cat#: 323100 | Materials and methods |
| Commercial assay or kit | RNAScope mmCnga3 probe | Advanced Cell Diagnostics, Hayward, CA | Cat#: 406131 | Materials and methods |
| Chemical compound, drug | cGMP-Na salt | Sigma | Cat#: G6129 | Materials and methods |
| Chemical compound, drug | L-cis-Diltiazem hydrochloride | Santa Cruz Biotechnology, Dallas, TX | Cat#: sc-221802 | Materials and methods |
| Software, algorithm | MetaFluor v7.8.2.0 | Molecular Devices, San Jose, CA | RRID:SCR_014294 | Materials and methods |
| Software, algorithm | ImageJ v1.51p | http://imagej.nih.gov/ij/; (Schneider et al., 2012) | RRID:SCR_003070 | Materials and methods |
| Software, algorithm | nd Stack Builder (ImageJ plugin) | https://imagej.nih.gov/ij/plugins/track/builder.html | N/A | Materials and methods |
| Software, algorithm | Trimmomatic v0.36 | (Bolger et al., 2014) | RRID:SCR_011848 | Materials and methods |
| Software, algorithm | STAR v2.5.4b | (Dobin et al., 2013) | RRID:SCR_015899 | Materials and methods |
| Software, algorithm | featureCounts v1.6.2 | (Liao et al., 2014) | RRID:SCR_012919 | Materials and methods |
| Software, algorithm | R v3.5.1 | https://www.r-project.org | RRID:SCR_001905 | Materials and methods |
| Software, algorithm | edgeR (package for R) v3.22.3 | (Robinson et al., 2010) | RRID:SCR_012802 | Materials and methods |
| Software, algorithm | pCLAMP v10 | Molecular Devices (https://www.moleculardevices.com/) | RRID:SCR_011323 | Materials and methods |
| Software, algorithm | GraphPad Prism v8.2.0 | GraphPad Software, San Diego, CA | RRID:SCR_002798 | Materials and methods |
Additional files
Download links
A two-part list of links to download the article, or parts of the article, in various formats.
Downloads (link to download the article as PDF)
Open citations (links to open the citations from this article in various online reference manager services)
Cite this article (links to download the citations from this article in formats compatible with various reference manager tools)
CNGA3 acts as a cold sensor in hypothalamic neurons
eLife 9:e55370.
https://doi.org/10.7554/eLife.55370


