Viral-induced alternative splicing of host genes promotes influenza replication
- Biochemistry and Molecular Biophysics Graduate Group, University of Pennsylvania, United States
- Department of Biochemistry and Biophysics, University of Pennsylvania, United States
- Department of Pathology, Perelman School of Medicine, University of Pennsylvania, United States
- Department of Cell Biology, UT Southwestern Medical Center, United States
Figures
Figure 1 with 1 supplement
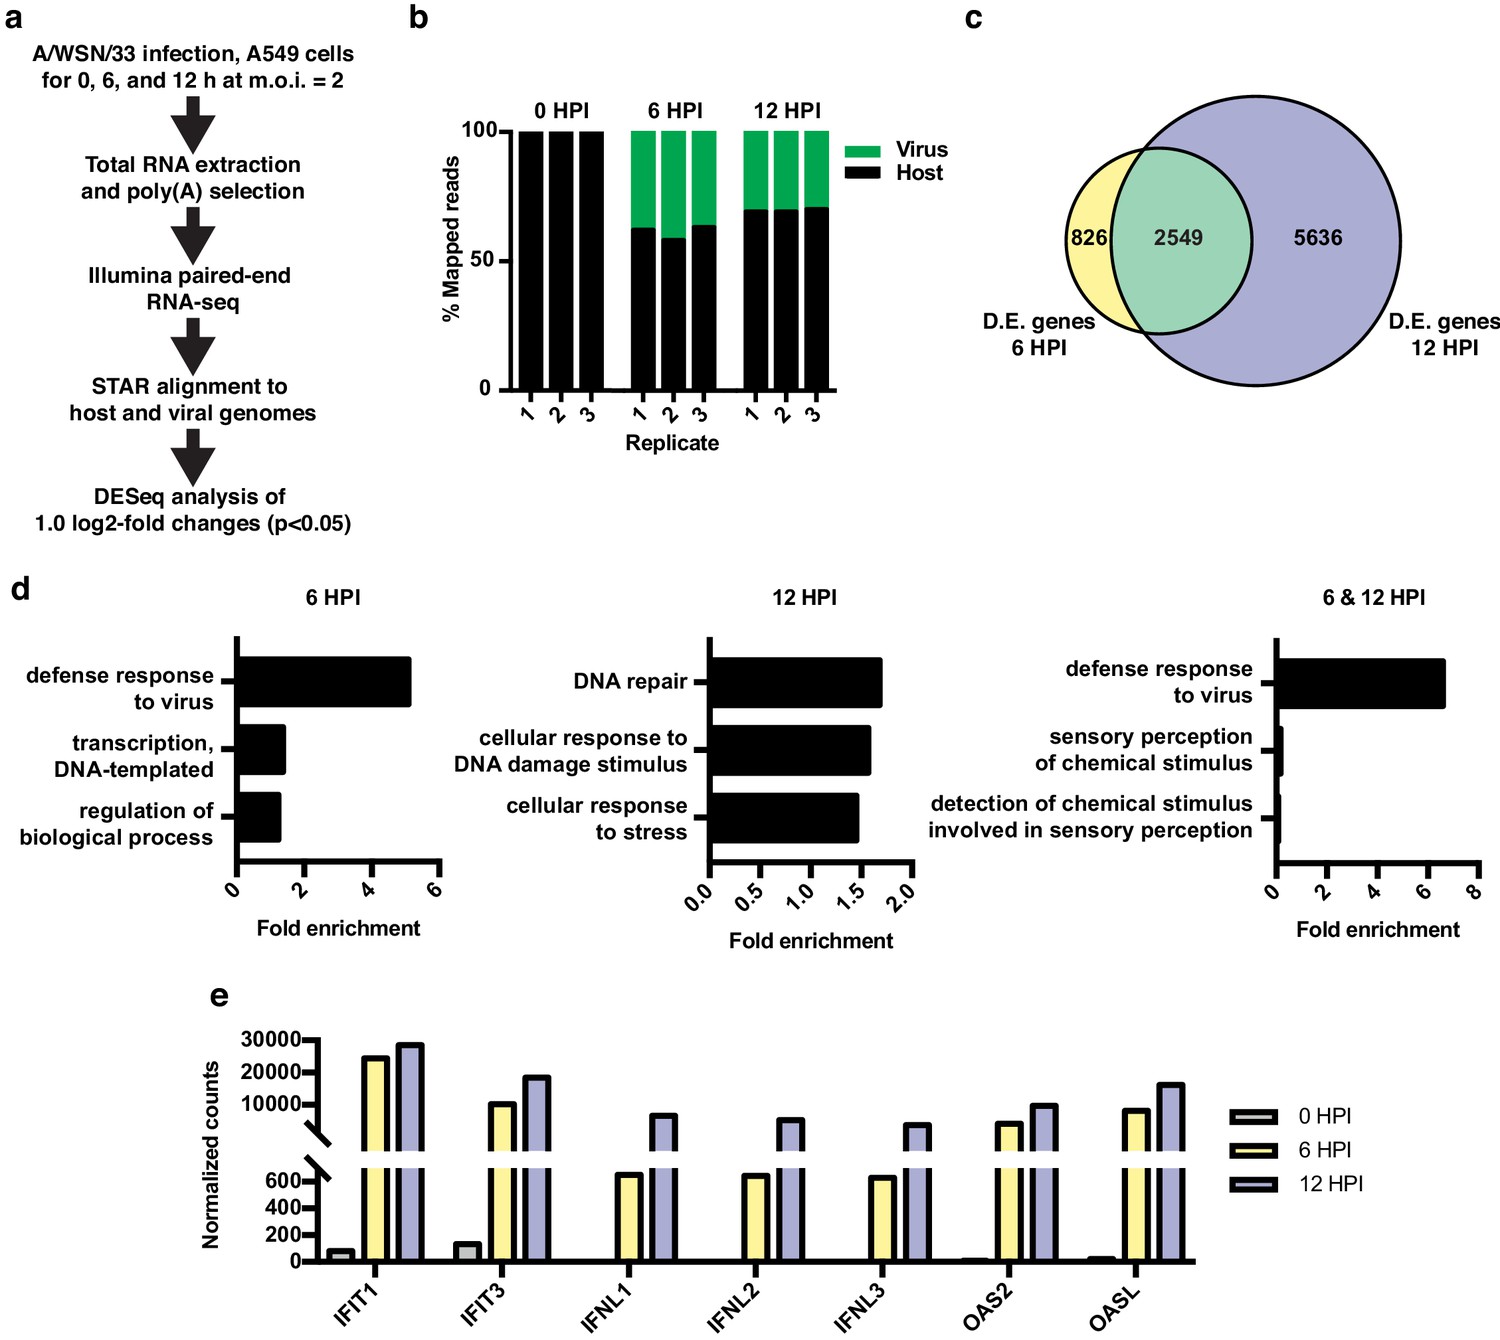
RNA-seq and differential expression analyses of IAV infected A549 cells.
(a) Schematic of infections, RNA-seq, and data processing work-flow. (b) Proportion of aligned, mapped reads corresponding to host (hg19) and virus (A/WSN/33) in each of the indicated samples. (c) Overlap of differentially expressed genes with a log2 fold change >1.0 at 6 and 12 hr PI. (d) Top gene ontology categories for differentially expressed genes enriched at 6 hr PI (left), 12 hr PI (middle), and overlap of 6 and 12 hr PI (right). p-Values were <0.05 in all categories. (e) Normalized counts of known viral-responsive genes.
Figure 1—figure supplement 1
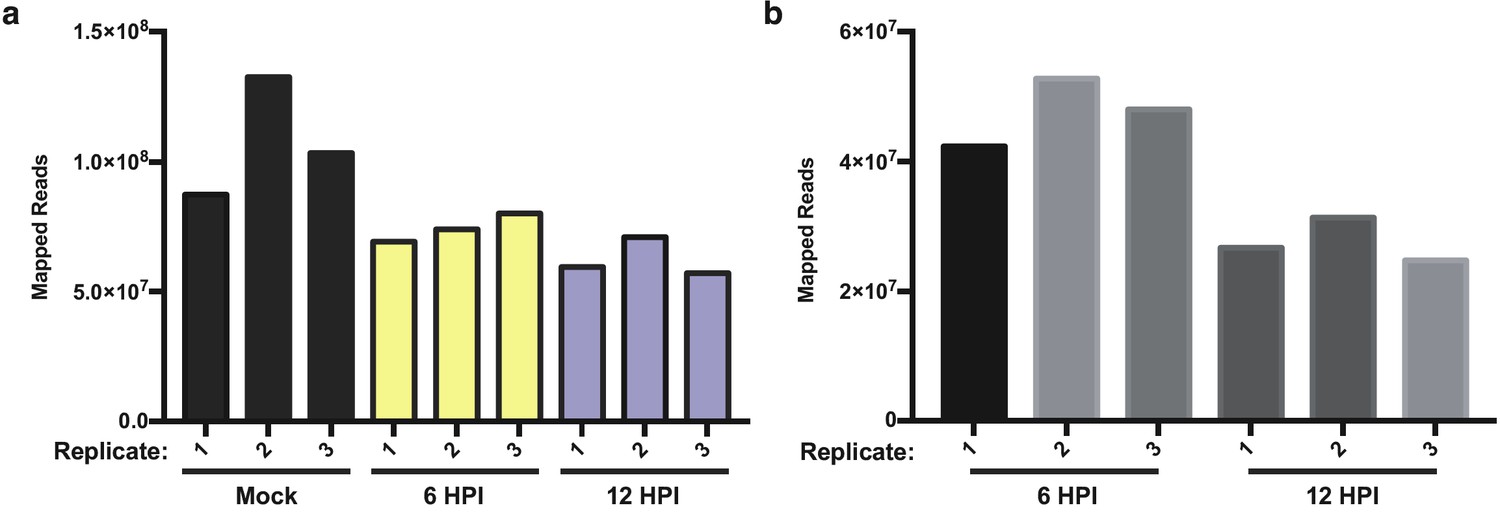
Read mapping to the human and viral genomes.
(a) Unique RNA-seq reads mapped to human genome in mock, 6 hr, and 12 hr IAV infections in A549 cells across three replicates. (b) Unique RNA-seq reads mapped to A/WSN/133 reference genome at 6 and 12 HPI in A549 cells across three replicates.
Figure 2 with 1 supplement
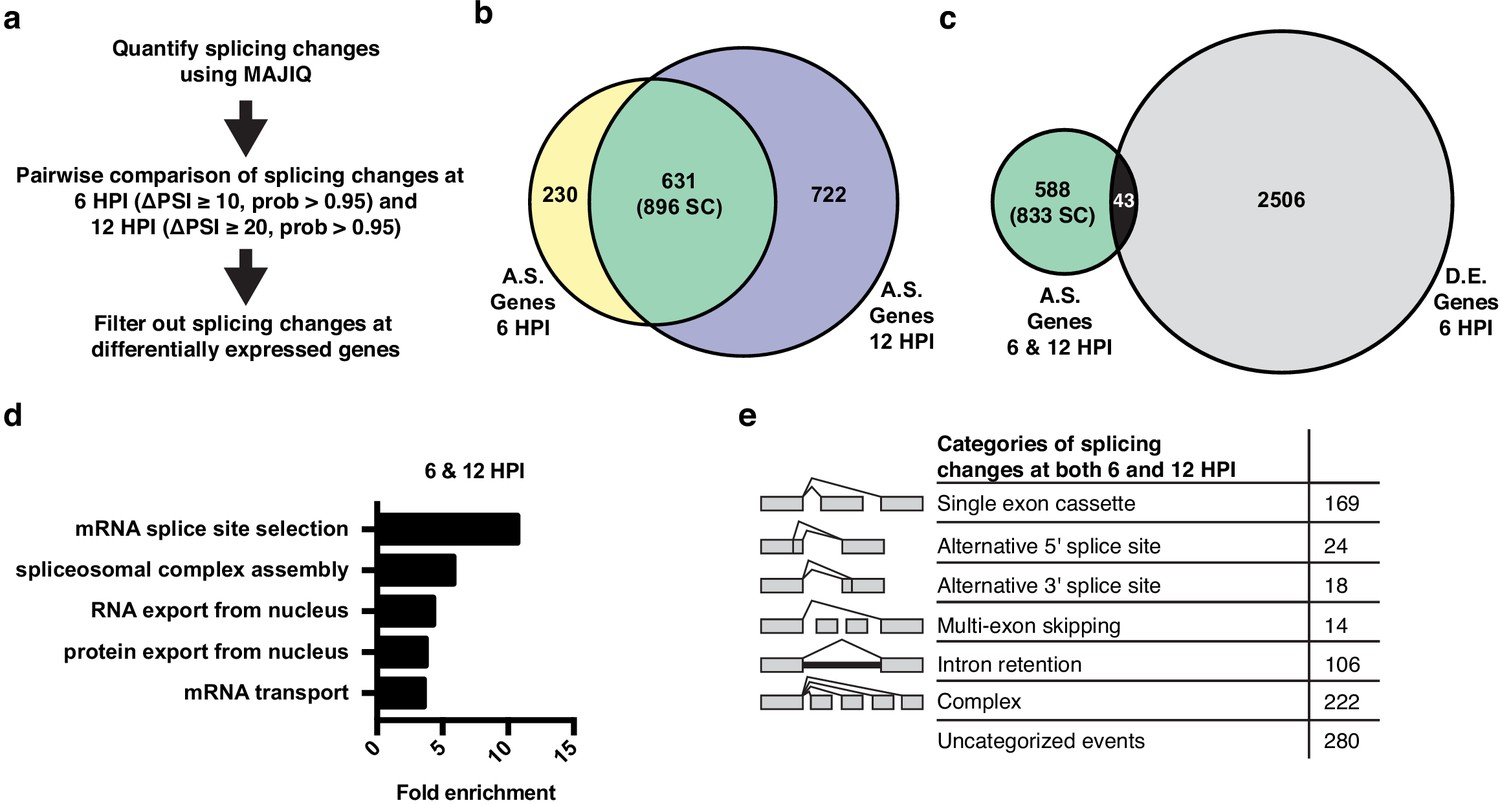
Alternative splicing analyses of host genes during IAV infection.
(a) Schematic of splicing analyses and downstream processing pipeline. (b) Overlap of alternatively spliced genes (ΔPSI ≥ 10 at 6 HPI (hours post-infection), ΔPSI ≥ 20 at 12 HPI) at 6 and 12 HPI (number of unique splicing changes (SC) shown in parentheses). (c) Overlap of alternatively spliced and differentially expressed genes at 6 and 12 HPI (number of unique splicing changes (SC) shown in parentheses, log2 fold change >1.0). (d) Top gene ontology categories enriched within 588 exclusively alternatively spliced genes at 6 and 12 HPI. p-Values were <0.05 in all categories. (e) Categorization of 833 exclusively alternative splicing events (588 genes) at 6 and 12 HPI.
Figure 2—figure supplement 1
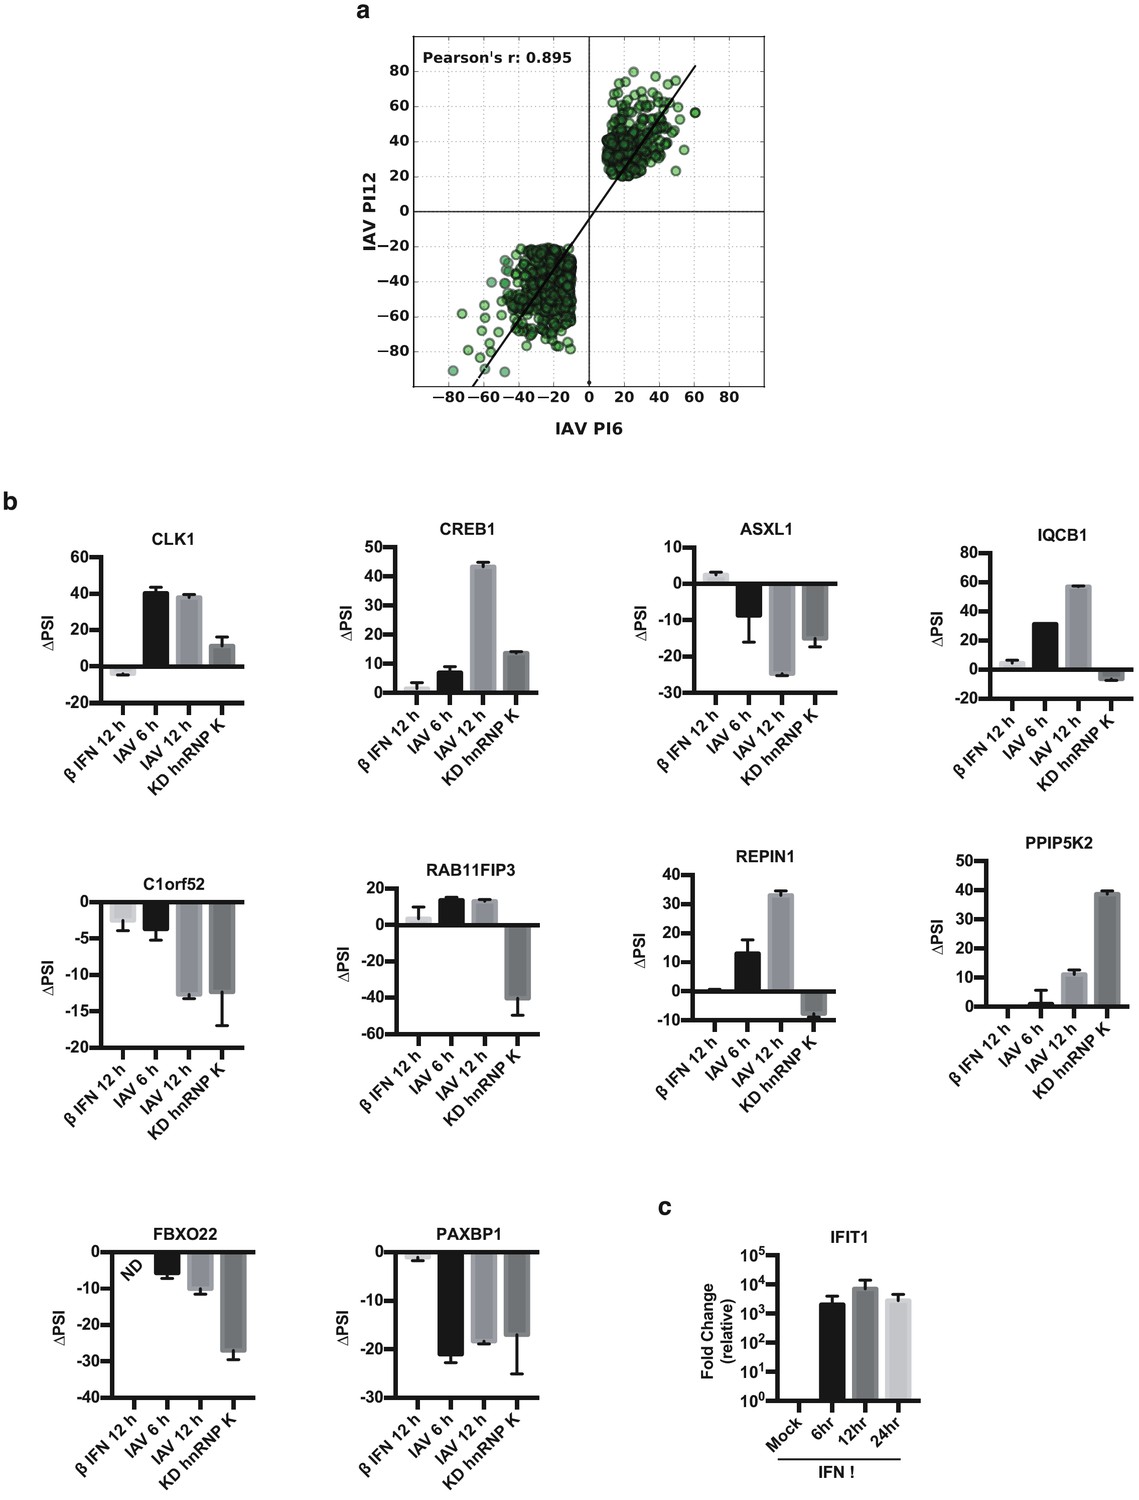
Details of splicing and gene expression changes in IAV-infected cells.
(a) Percent change in splicing values at 6 and 12 HPI vs. mock, for the 896 splicing events that are persistently changed upon viral infection (see Figure 2b). (b) A549 cells were treated with interferon beta (IFNβ), infected with virus (WSN), or treated with shRNA against hnRNP K. Splicing was quantified using radioactive RT-PCR. ΔPSI (change of % exon spliced in) values were determined by subtracting percent-exon-included in mock conditions from experimental conditions. Values are means ± s.d. from two to three biologically independent experiments. (c) Quantification of interferon inducible gene IFIT1 relative to Actin, by qPCR, in mock or IFNβ treated samples.
Figure 3 with 1 supplement
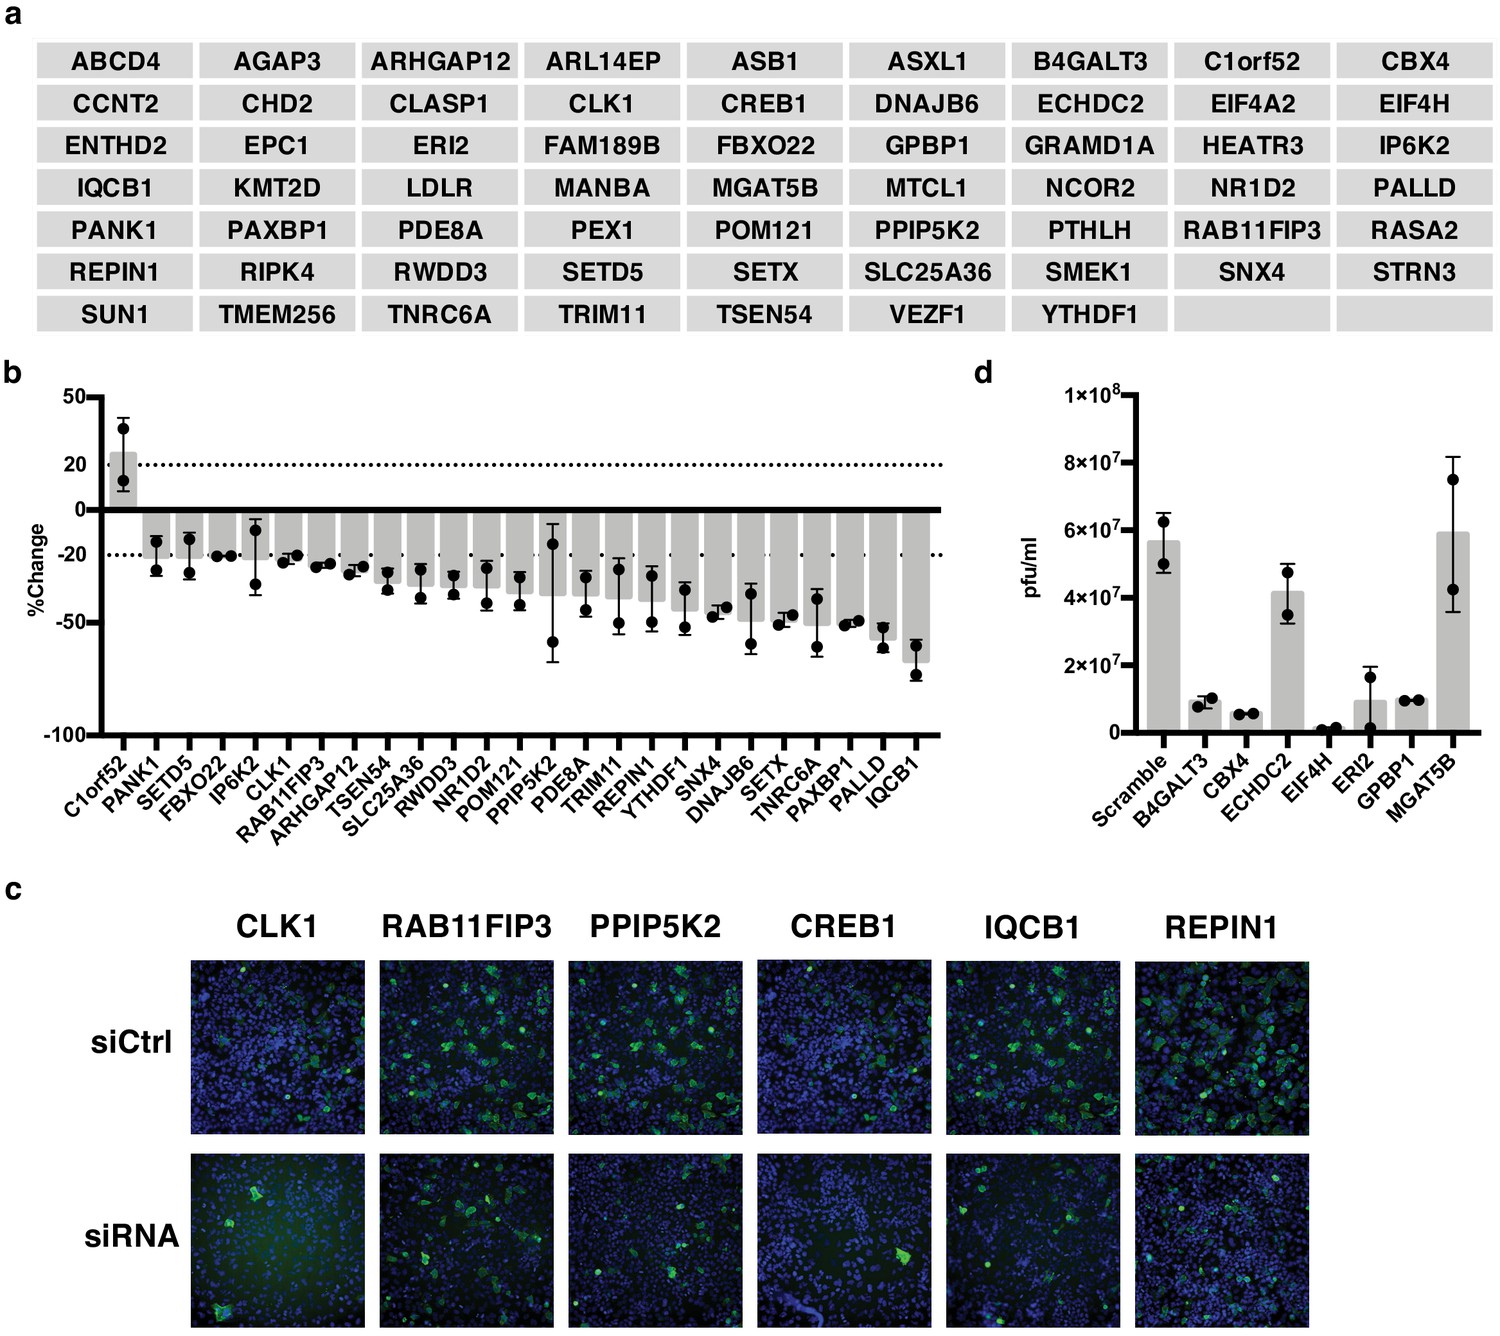
IAV-sensitive splicing events encode genes that modulate IAV replication.
(a) List of 61 alternatively spliced genes sensitive to IAV infection chosen for siRNA screening. (b) Percent change of IAV-positive scoring cells in the context of siRNA knockdown. Bar indicates the average of two siRNAs in two independent screens, dots and error bars represent individual screen averages (across two siRNAs) and standard deviation respectively. Genes with an average change of ≥20% are plotted. Quantification of knock-down of representative genes and average results from individual siRNAs are shown in Figure 3—figure supplement 1b. (c) Representative images of immunofluorescence imaging of IAV-infected cells in the context of control or gene targeting siRNA treatments. Blue staining denotes individual nuclei (DAPI) and green staining denotes IAV-positive cells (NP). (d) A549 cells were treated with 20 nM siRNA for 72 hr and infected with IAV at moi = 0.01 for 48 hr. Shown is the measurement of plaque forming units in media via plaque assay. Bar indicates the average of two independent screens, dots and error bars represent individual data points.
Figure 3—figure supplement 1
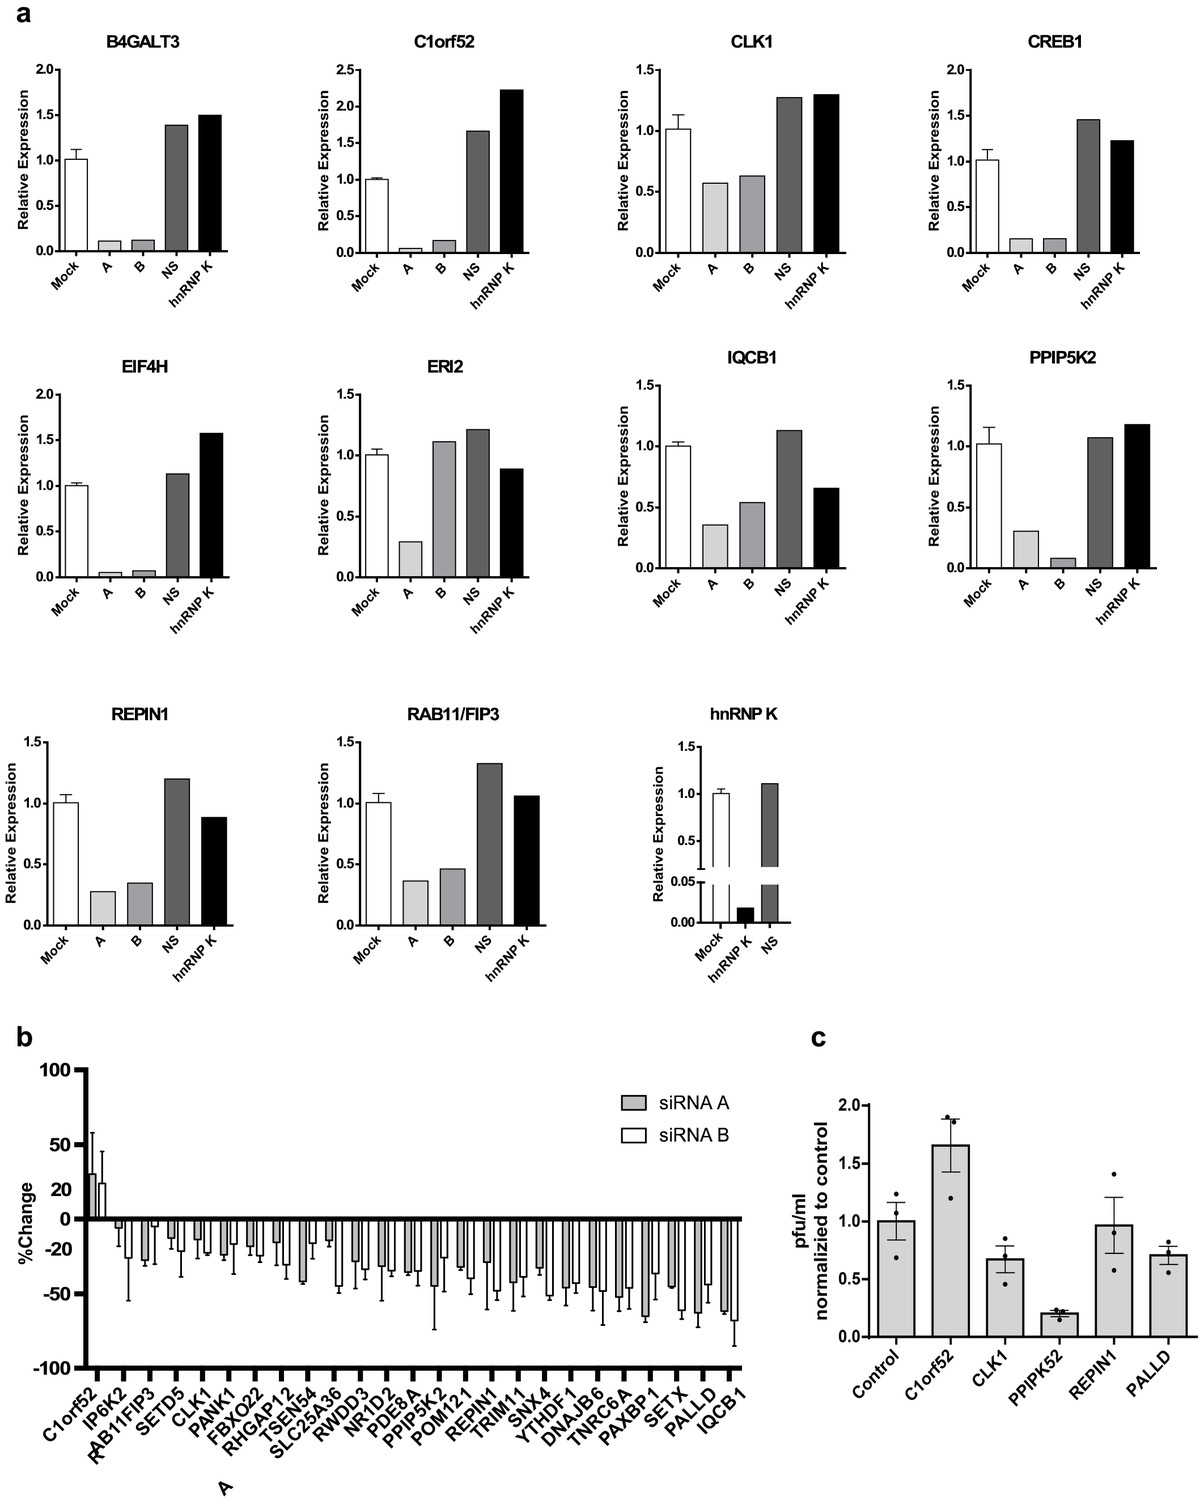
Further data and controls for siRNA screen.
(a) Expression of siRNA target genes, as measured by qPCR, in cells transfected with a non-specific siRNA (NS), or the two independent siRNAs for each gene used in the screen (A, B), relative to Mock (untransfected) control. The impact of siRNAs targeting hnRNP K are also shown as a control. (b) Results of the siRNA screen as in Figure 3b, but showing results for the individual siRNAs averaged over duplicate experiments. (c) Impact of siRNAs on viral titer as measured by plaque assay.
Figure 4 with 1 supplement
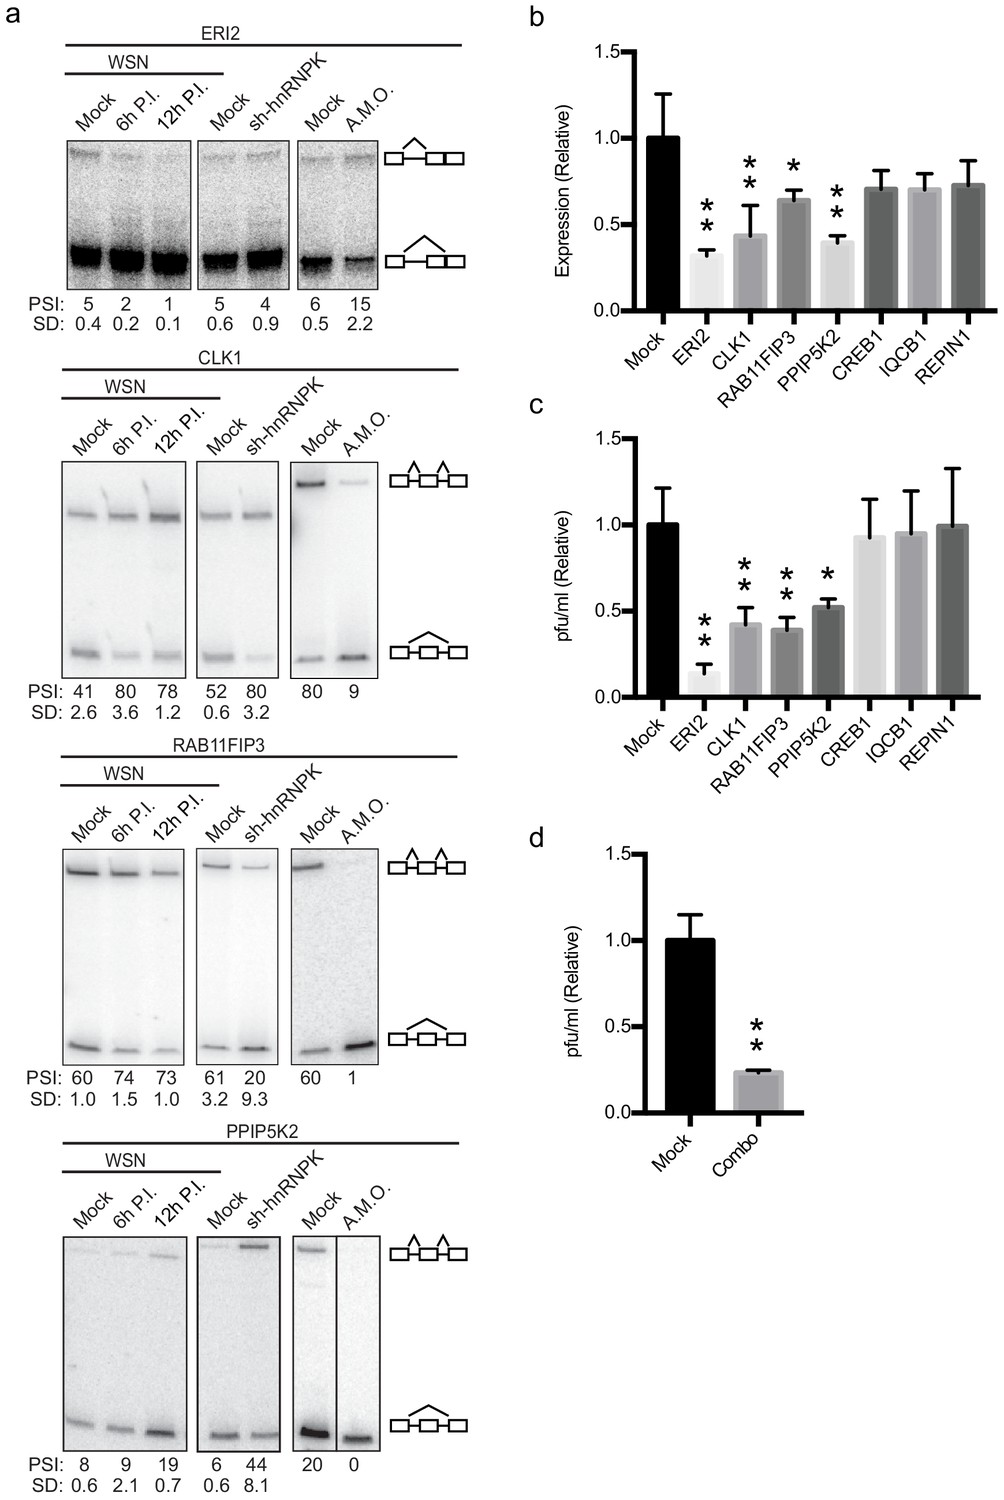
Altering splicing of host genes results in IAV replication changes.
(a) A549 cells were infected (WSN), treated with shRNA against hnRNP K, or treated with splice-blocking antisense morpholino oligonucleotides (AMOs). Splicing was analyzed using RT-PCR analyses (b) RT-qPCR analyses (values normalized to mock AMO treatment) of PA segment vRNA 48 HPI with IAV (moi = 0.01) in the context of AMO treatment (targeted genes indicated on x-axis). Values are means ± s.d. from three independent experiments. (c) Measurement of plaque-forming units (values normalized to mock AMO treatment) in media 48 HPI with IAV WSN (moi = 0.01) in the context of AMO treatment (targeted genes are indicated on x-axis). Values are means ± s.d. from three independent experiments. (d) Measurement of plaque-forming units (values normalized to mock AMO treatment) in media 48 HPI with IAV WSN (moi = 0.01) in the context of AMO treatment. In combo-treated cells CLK1, RAB11FIP3, and PPIP5K2 were simultaneously targeted with AMO’s. Values are means ± s.d. from three independent experiments. Statistical significance in (b) and (c) was determined via one-way ANOVA with multiple comparisons to mock corrected via Dunnett’s test and in (d) via two-tailed student’s t-test. p<0.05 = * and p<0.005 = ** when comparing mock AMO treatments vs AMO treated samples.
Figure 4—figure supplement 1
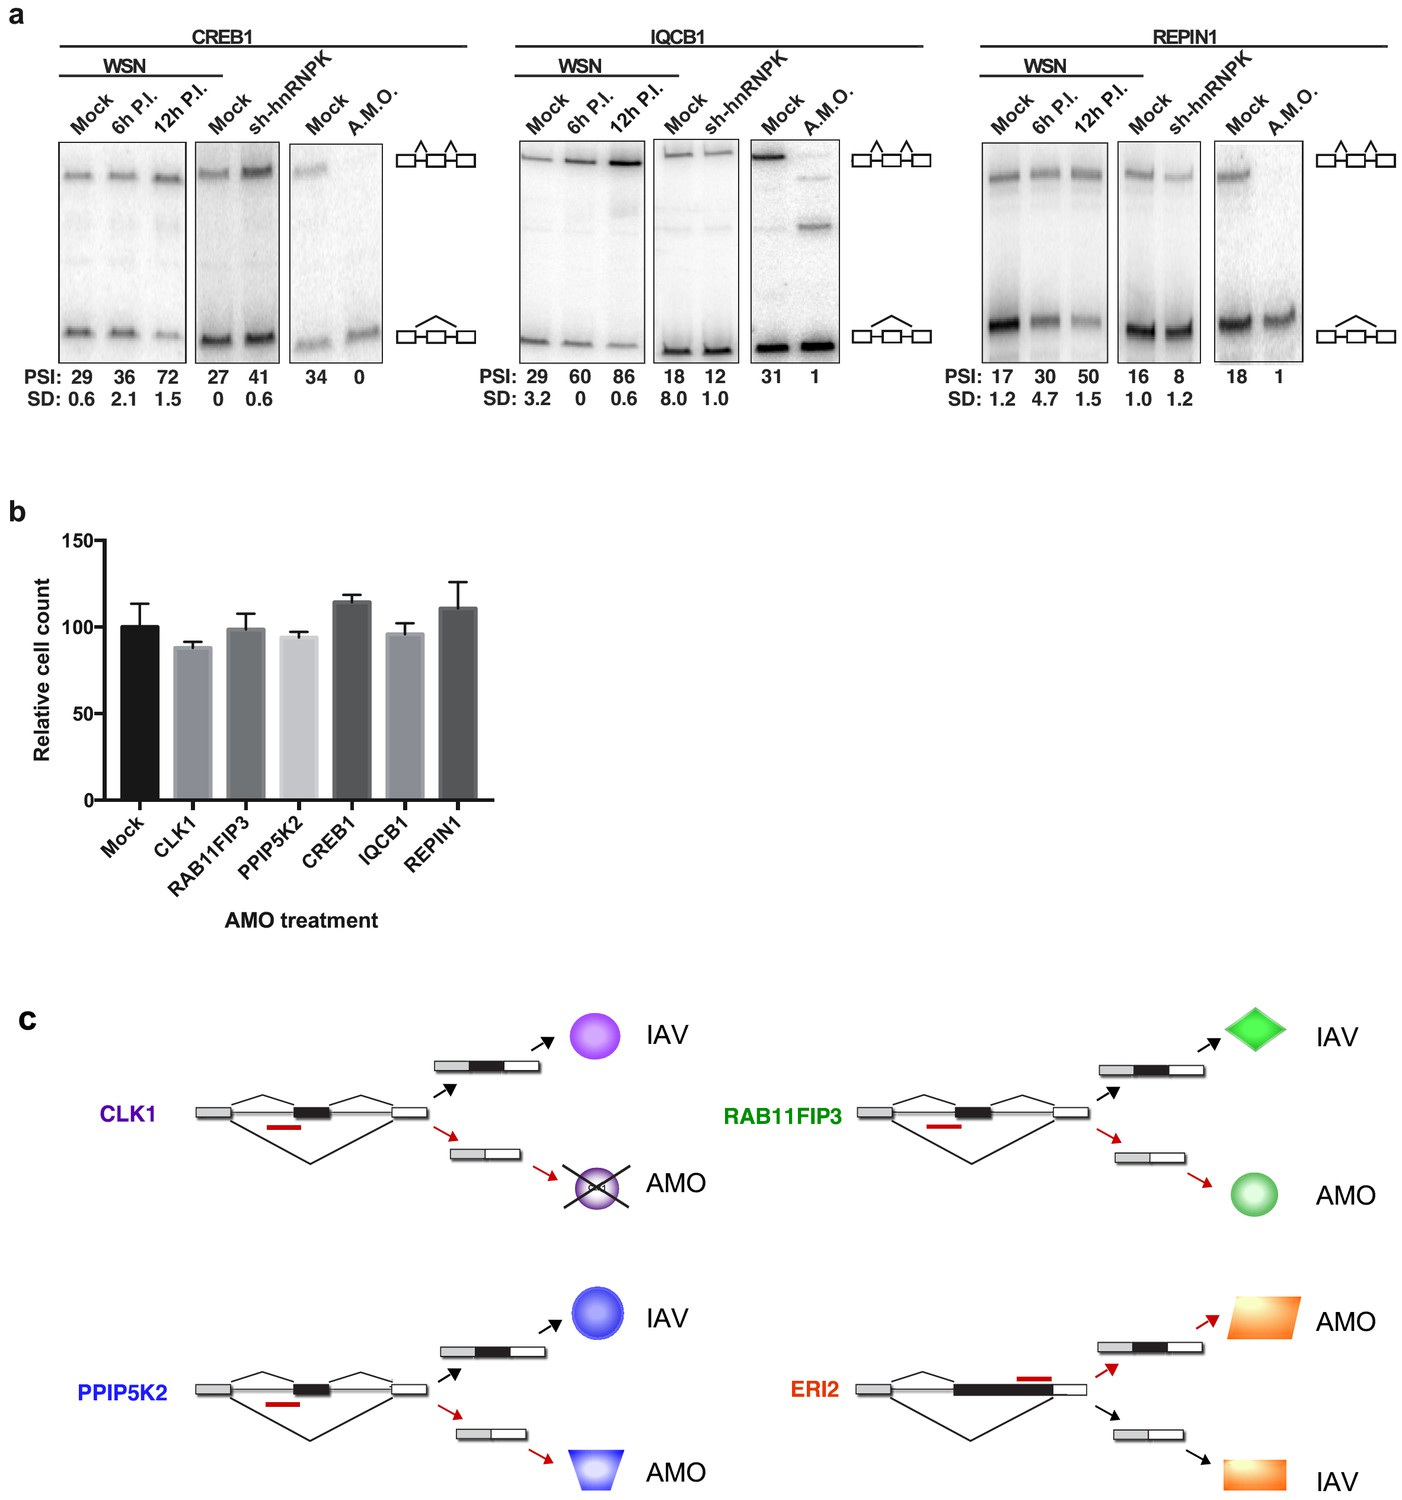
AMO-induced alternative splicing of selected genes.
(a) A549 cells were infected (WSN), treated with shRNA against hnRNP K, or treated with splice-blocking antisense morpholino oligonucleotides (AMOs). Splicing was analyzed using RT-PCR analyses (b) Normalized cell counts of mock or AMO treated A549 cells (values normalized to mock AMO-treated cells). (c) Schematic of the IAV and AMO-induced alternative splicing patterns for the four genes for which we observe functional impact on infection. Colored shapes represent distinct isoforms of encoded proteins. The X over one of the isoforms of CLK1 indicates predicted targeting of message to decay by NMD.
Figure 5 with 2 supplements

hnRNP K regulates a subset of IAV-induced splicing events during infection.
(a) A549 cells were infected with WT and ΔK-mut IAV in the context of scrambled or hnRNP K targeting siRNA. Plaque-forming units in media were assayed at 48 HPI. Values are means ± s.d. from three independent experiments. p<0.005 = **. Statistical significance was determined via two-tailed student’s t-test where p<0.05 = * and p<0.005 = ** when comparing scramble vs siRNA-treated samples. (b) Western blot of shRNA-treated cells. Tubulin is shown as a loading control. (c) Proportion of IAV-sensitive splicing events (observed at 6 and 12 HPI) that are also sensitive to hnRNP K knockdown. (d) ΔPSI value comparison of 179 splicing events at 6 HPI or after hnRNP K knockdown. Percentage values denotes proportion of 179 splicing events residing in each quadrant.
Figure 5—figure supplement 1
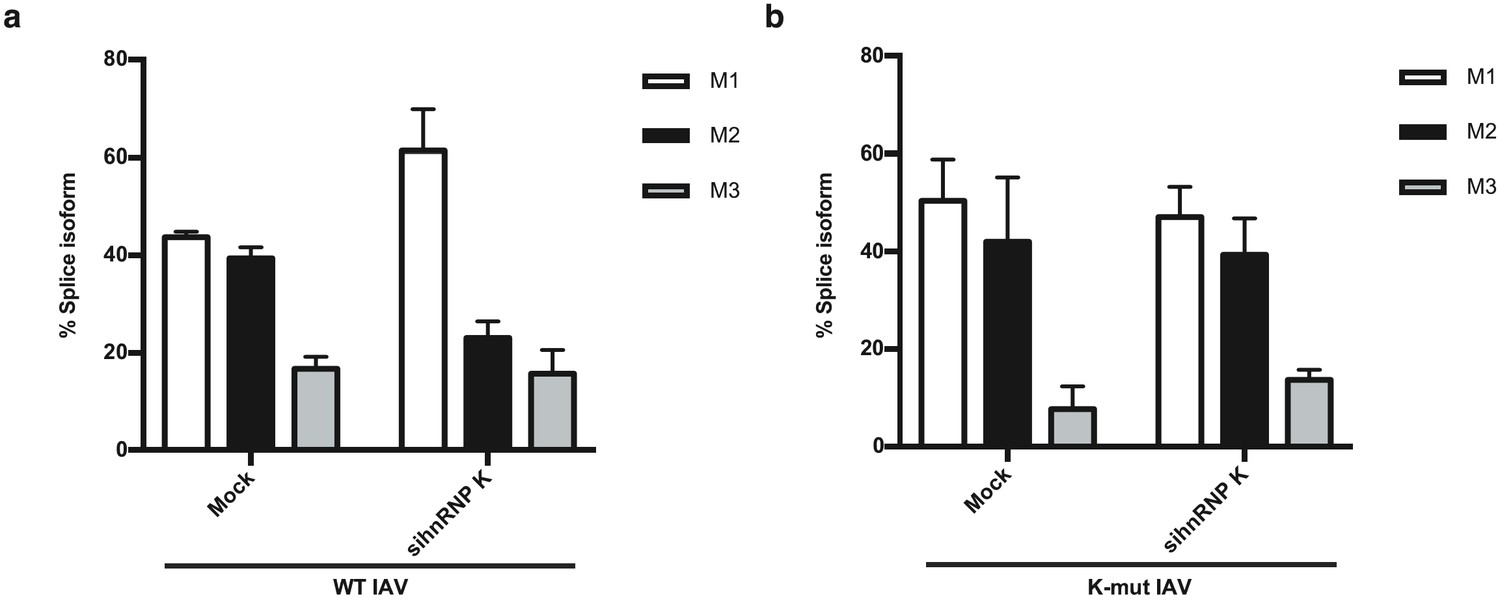
IAV M segment splicing in hnRNP K-depleted cells.
(a) Quantification of M segment isoform levels in A549 cells infected with WT IAV in the context of scrambled or hnRNP K targeting siRNA using radioactive primer extension and densitometry. (b) Quantification of M segment isoform levels in A549 cells infected with ΔK-mut IAV in the context of scrambled or hnRNP K targeting siRNA using radioactive primer extension and densitometry. Values are means ± s.d. from three biologically independent experiments.
Figure 5—figure supplement 2
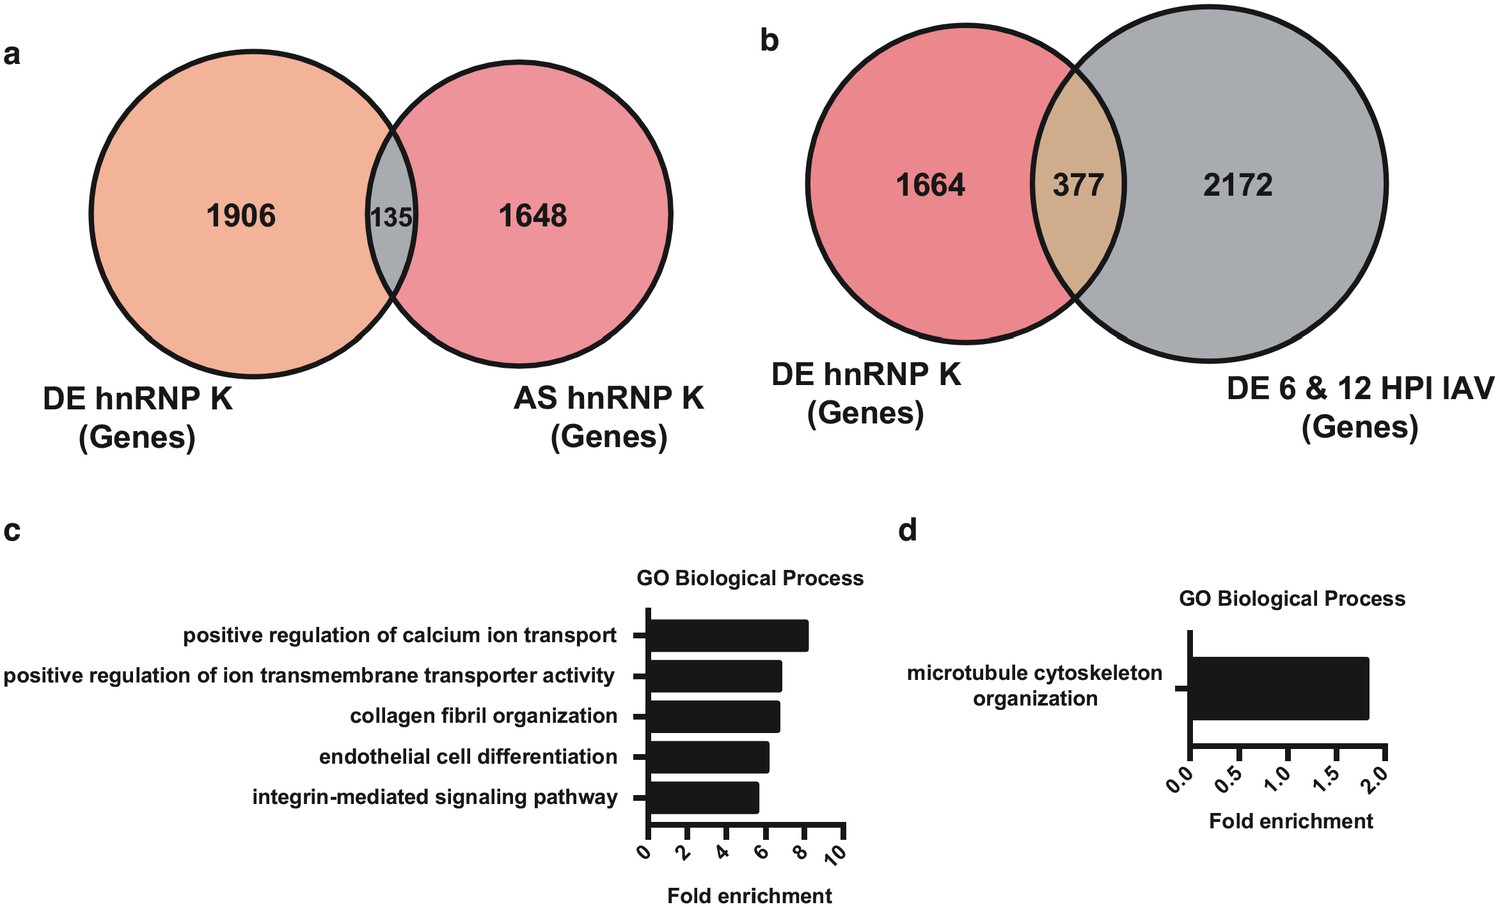
General analysis of gene expression in hnRNP K-depleted A549 cells.
(a) Overlap of differentially expressed and alternatively spliced genes in the context of hnRNP K shRNA knockdown (as in Figure 5b). (b) Overlap of differentially expressed genes in the context of hnRNP K shRNA knockdown (as in Figure 5b) and IAV infection (as in overlap between 6 and 12 HPI shown in Figure 1c). (c) Top gene ontology categories for differentially expressed genes enriched in the context of hnRNP K shRNA knockdown. p-Values were <0.05 in all categories. (d) Top gene ontology category for alternatively spliced genes enriched in the context of hnRNP K shRNA knockdown. pValues were <0.05 for enrichment.
Figure 6 with 1 supplement
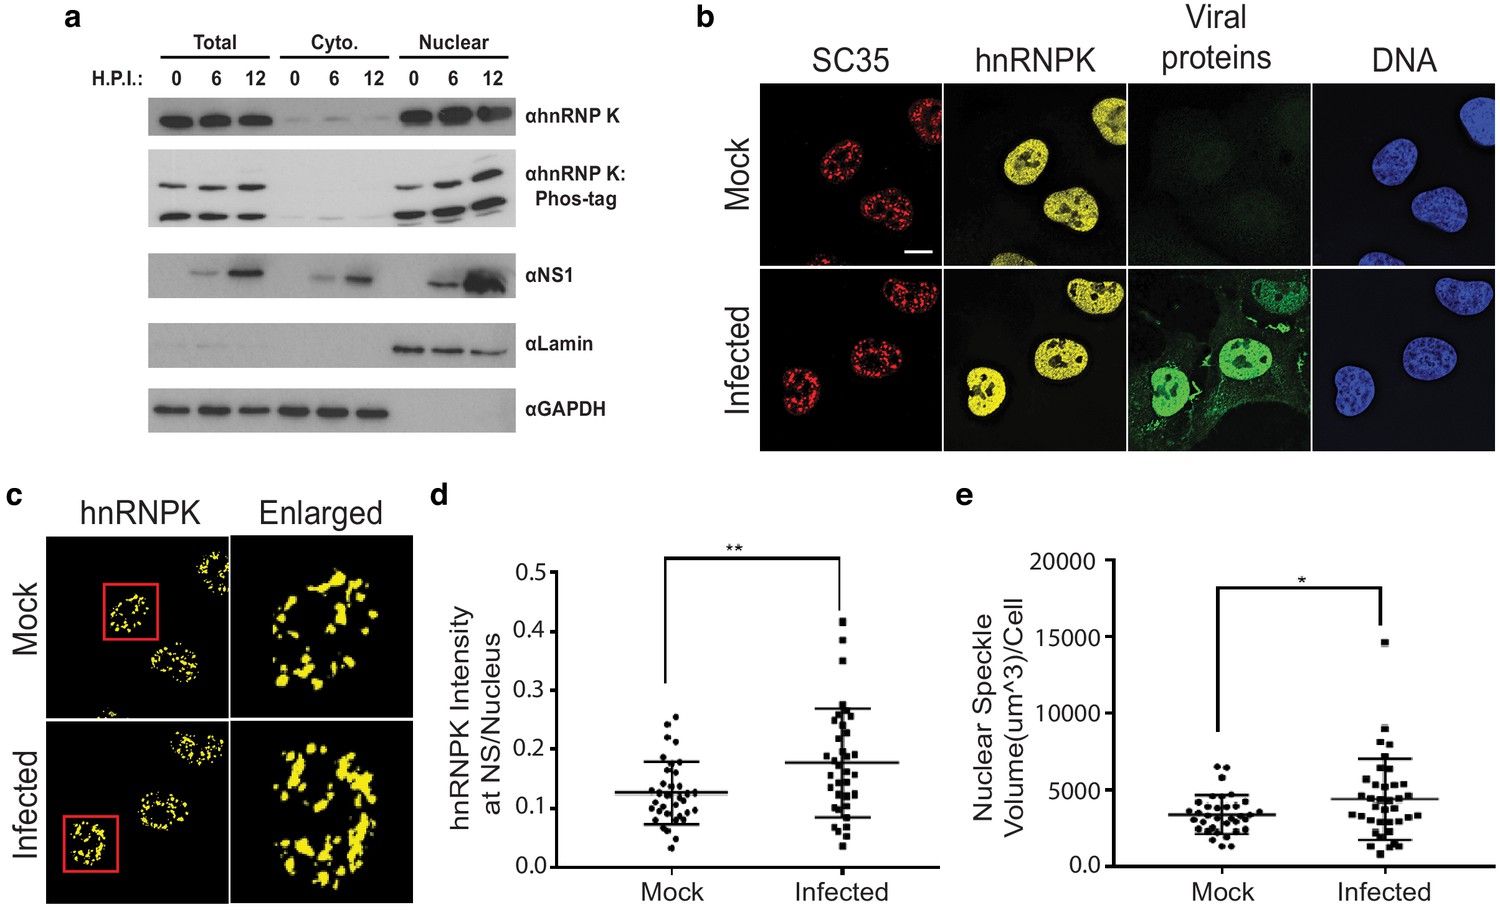
hnRNP K levels increase at nuclear speckles during influenza A virus infection.
(a) Western blot analyses of total, cytoplasmic, or nuclear A549 cell extracts 0, 6, and 12 hr post infection (HPI). hnRNP K was analysed via traditional SDS-PAGE or Phos-tag to separate phosphorylated isoforms of hnRNP K. (b) Approximately 100% of A549 cells were infected with influenza virus (WSN) for 5 hr and then subjected to immunofluorescence microscopy to detect SC35, hnRNP K, and viral proteins. Nuclear speckles were marked with anti-SC35 antibody. Scale bar = 10 µm. (c) Voxel outside surface generated for nuclear speckles was set to 0 for hnRNP K channel to visualize hnRNP K at nuclear speckles. The marked region is enlarged. (d) Quantification of hnRNP K at nuclear speckles (NS) was performed using the Imaris software. hnRNP K intensity sum at nuclear speckles was normalized to the intensity sum in the nucleus. Values are means ± s.d. measured in 35 mock and 35 WSN infected cells from biological triplicates. ** unpaired, two-tailed t-test p<0.01. (e) Quantification of nuclear speckle volume was performed using the Imaris software. Surface was generated using fluoresce signal from immunostained SC35 proteins to measure nuclear speckle volume. Values are means ± s.d. measured in ≥35 mock and WSN infected cells from biological triplicates. * unpaired, two-tailed t-test p≤0.05.
Figure 6—figure supplement 1
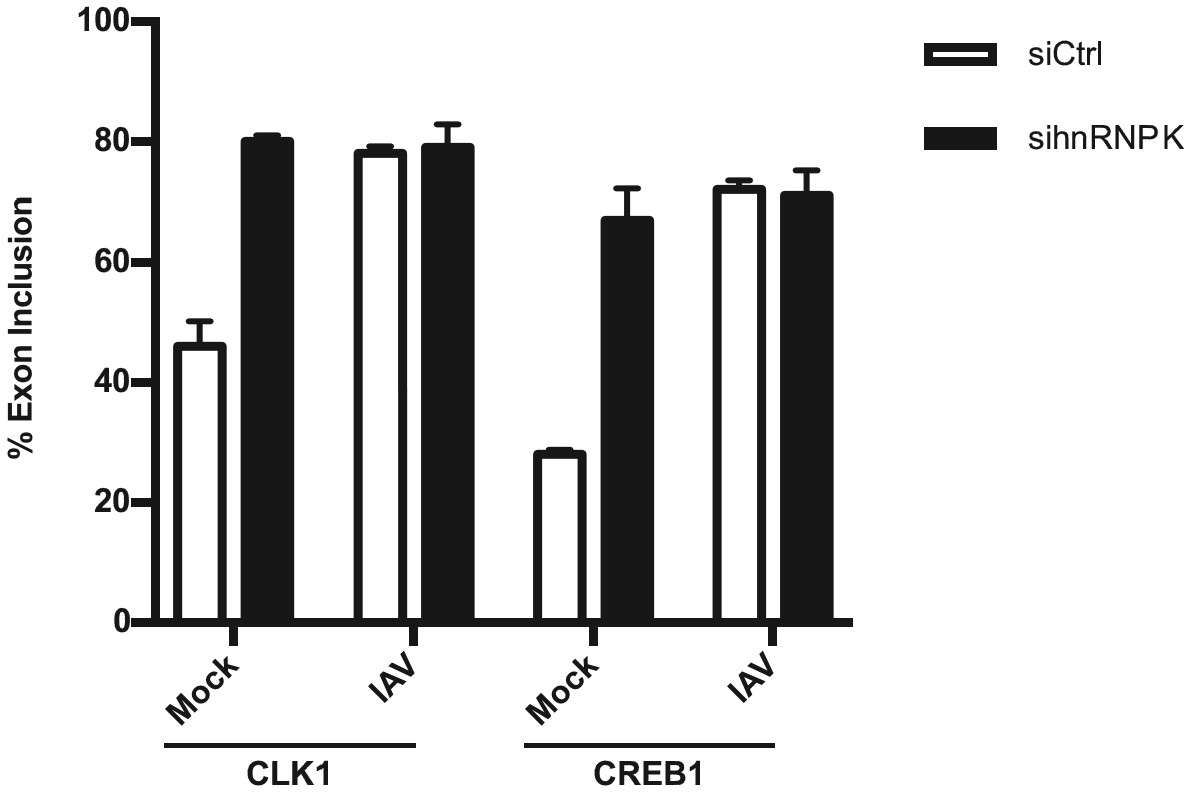
RT-PCR analyses of CLK1 or CREB1 alternative splicing in Mock or IAV infected cells pretreated with siCtrl or sihnRNP K siRNA.
Values are means ± s.d. from three biologically independent experiments.
Additional files
-
Supplementary file 1
Differential Expression of host genes in A549 cells infected with influenza A virus or depleted of hnRNP K.
Fold change (log2) and p-values for genes are given at 6 and 12 hr post infection with IAV (page 1 and 2, DE_6HPI and DE_12HPI), or after depletion of hnRNP K by shRNA (page 3, DE_shHNRNPK).
- https://cdn.elifesciences.org/articles/55500/elife-55500-supp1-v2.xlsx
-
Supplementary file 2
Splicing changes of host genes in A549 cells infected with influenza A virus A or depleted of hnRNP K.
Change in splicing (delta percent spliced isoform or dPSI) for specific spliced junctions are given at 6 and 12 hr post infection with IAV (page 1 and 2, WSN_6HPI and WNS_12HPI), or after depletion of hnRNP K by shRNA (page 3, shHNRNPK).
- https://cdn.elifesciences.org/articles/55500/elife-55500-supp2-v2.xlsx
-
Supplementary file 3
Primers used in this study.
Sequences are given for siRNAs for screen (page 1), primers for RT-PCR (page 2), splice-blocking AMOs (page 3), primers for qPCR (page 4), and primers for primer extension analysis of IAV (page 5).
- https://cdn.elifesciences.org/articles/55500/elife-55500-supp3-v2.xlsx
-
Transparent reporting form
- https://cdn.elifesciences.org/articles/55500/elife-55500-transrepform-v2.docx
Download links
A two-part list of links to download the article, or parts of the article, in various formats.
Downloads (link to download the article as PDF)
Open citations (links to open the citations from this article in various online reference manager services)
Cite this article (links to download the citations from this article in formats compatible with various reference manager tools)
Viral-induced alternative splicing of host genes promotes influenza replication
eLife 9:e55500.
https://doi.org/10.7554/eLife.55500


