A single-cell transcriptomic and anatomic atlas of mouse dorsal raphe Pet1 neurons
- Department of Genetics, Harvard Medical School, United States
Figures
Figure 1 with 4 supplements
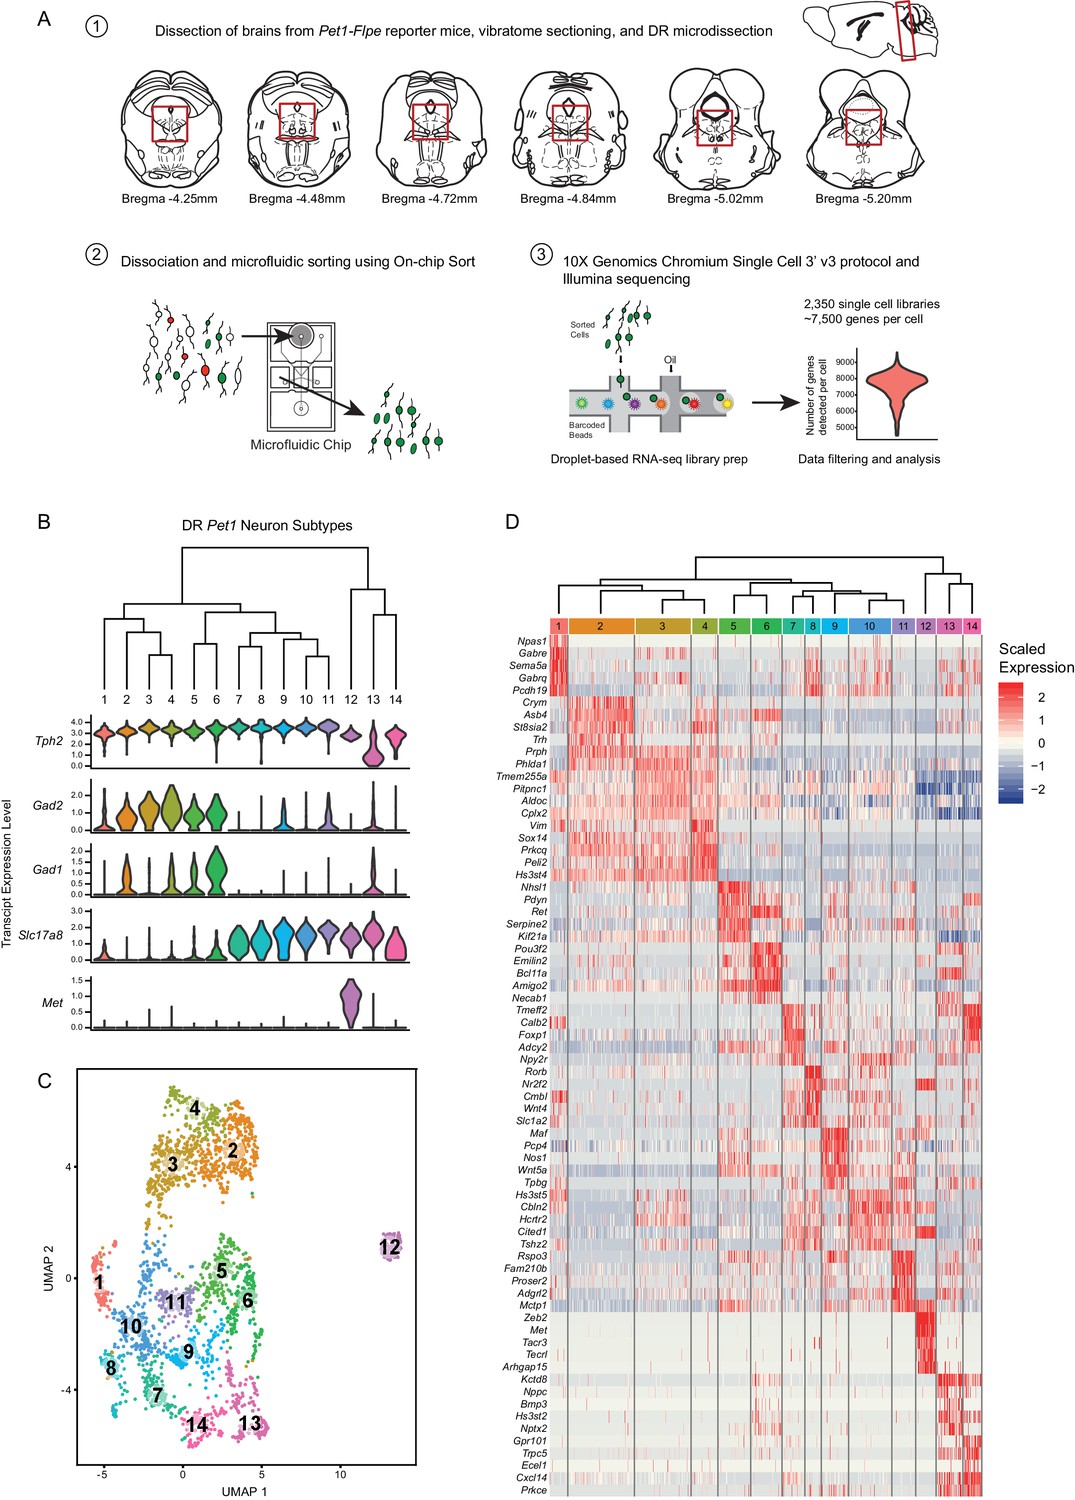
High throughput scRNA-seq and clustering analyses reveal as many as fourteen distinct molecularly-defined subtypes (clusters) of Pet1 neurons in the mouse DR.
(A) Schematic depicting the experimental and analytical workflow, specifically: (1) brain dissection and DR microdissection, (2) cellular dissociation and microfluidic fluorescence-based cell sorting using the On-chip Sort, and (3) library preparation, sequencing, and analysis using 10X genomics, Illumina sequencing, and the R package Seurat, respectively. (B) Hierarchical clustering of Pet1 neuron subtypes identified by Louvain clustering (using the top two thousand genes with the highest variance, PCs = 1:5, 8:50, and resolution = 0.9), with violin plots depicting the log-normalized expression of a common set of genes (Tph2, Gad2, Gad1, Slc17a8, and Met) found useful for characterizing cluster structure across multiple resolutions (see Figure 1—figure supplement 2). (C) UMAP visualization of single-neuron transcriptome community/similarity structure, with colors and numbers indicating discrete clusters (same clustering parameters as (B)). (D) Heatmap depicting the scaled expression of the top five marker genes for each cluster (ranked by p-value, or in some cases fold enrichment).
Figure 1—figure supplement 1
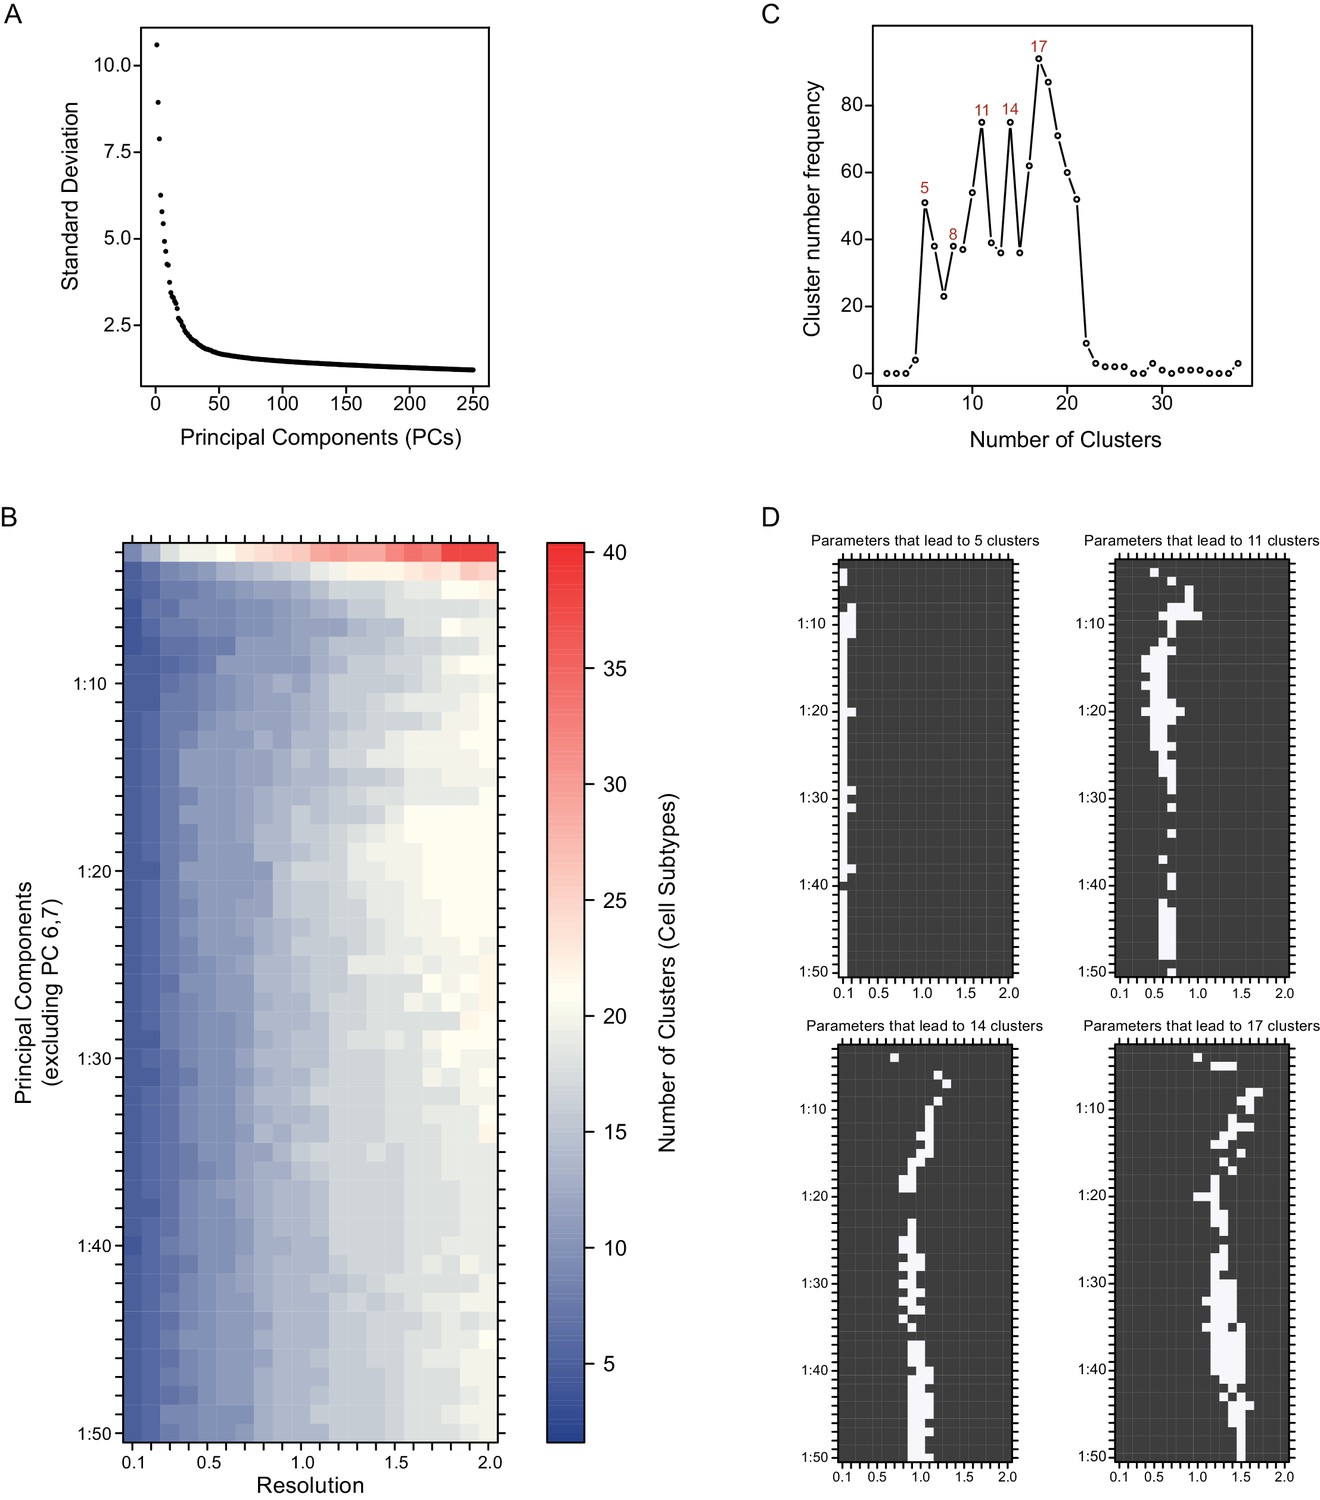
Systematic variation of key clustering parameters allows for exploration of the community structure of DR Pet1 single neuron transcriptomes at variable resolutions.
(A) Scatterplot of the variance (standard deviation, Y-axis) explained by the first 250 principal components (X-axis). (B) Heat map depicting the number of clusters (DR Pet1 neuron subtypes) resulting from variation of the number of included principle components (Y-axis) and the resolution parameter to the Seurat function FindClusters (X-axis). (C) Line graph of the frequency (Y-axis) that a given number of clusters (X-axis) arises from the analysis performed in B. (D) Plots showing the parameters (white) that lead to cluster numbers found to have the highest frequency (5, 11, 14, and 17 clusters, top left to bottom right respectively).
Figure 1—figure supplement 2
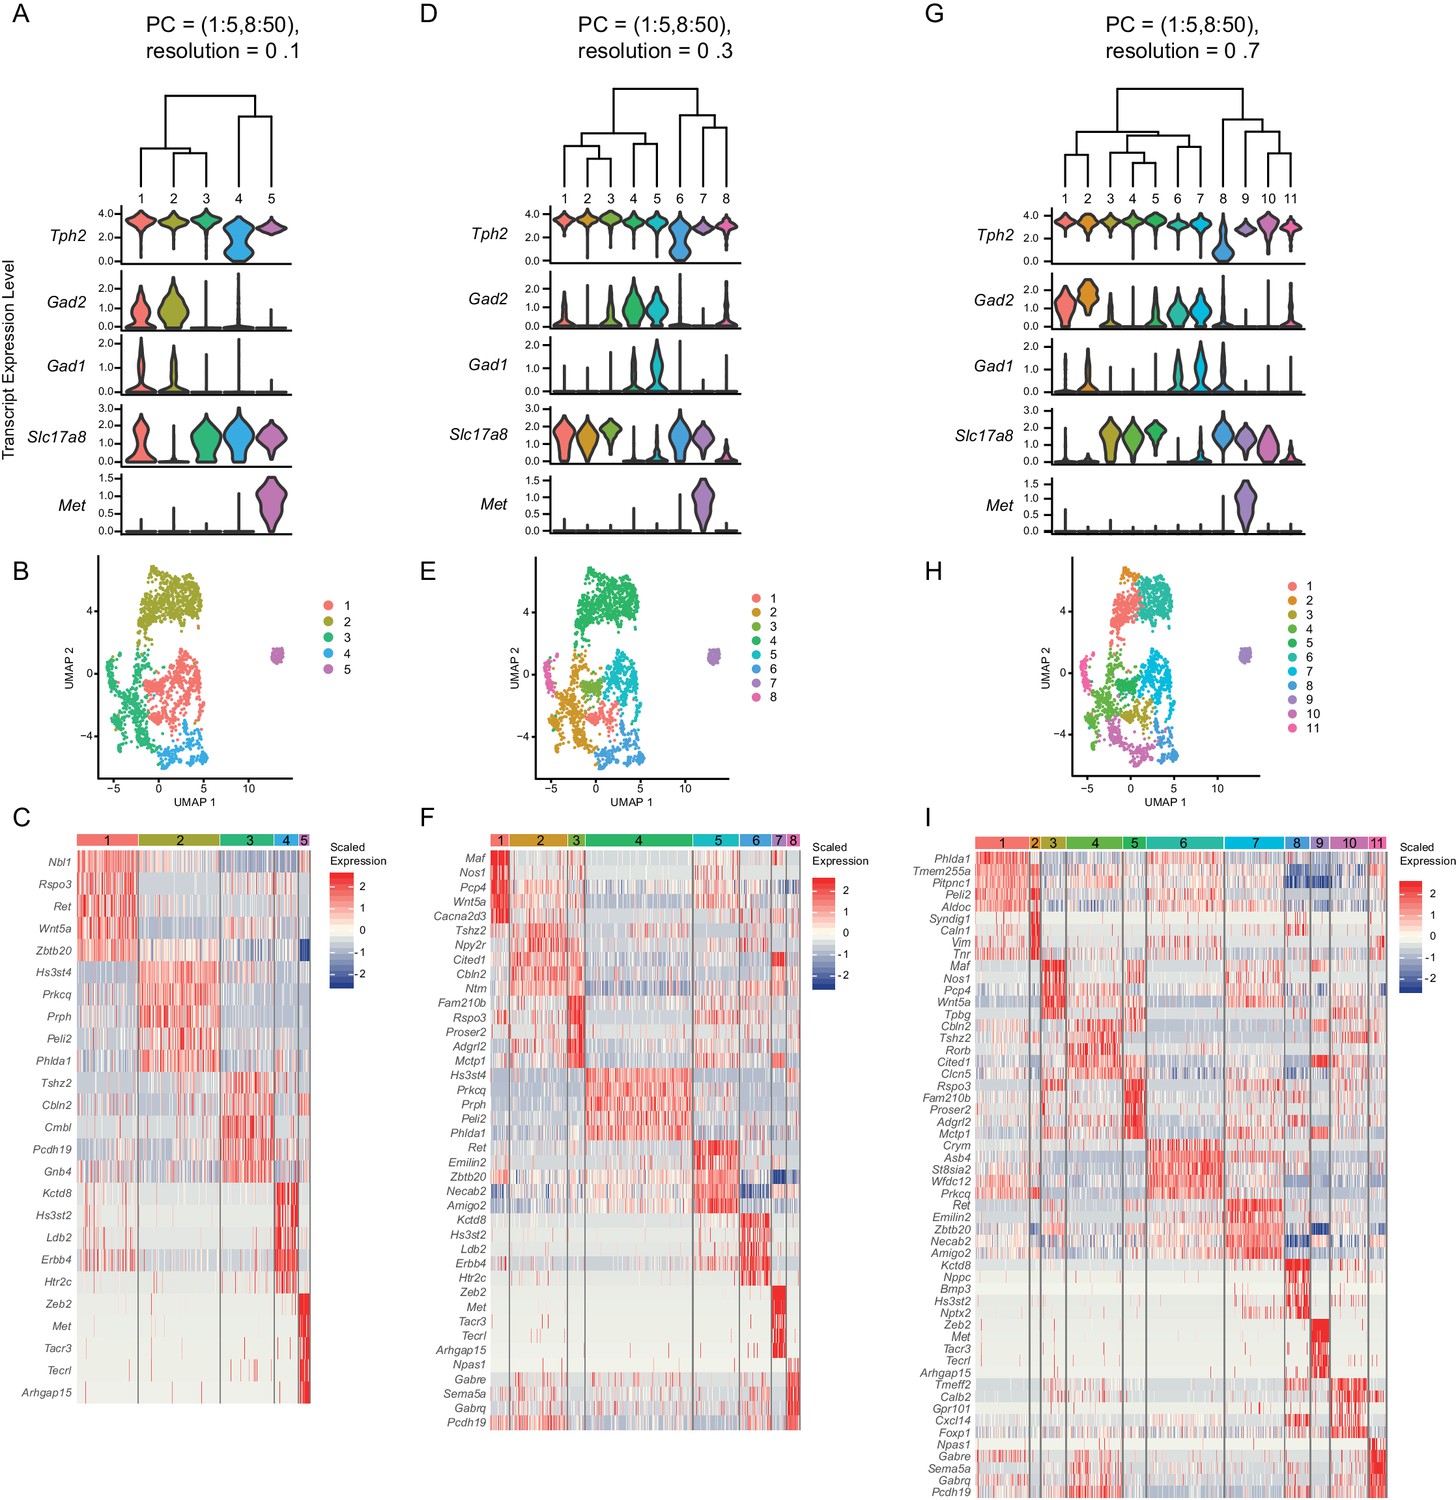
Analysis of clusters at successively increasing resolution values.
(A, D, G) Hierarchical clustering of Pet1 neuron subtypes identified by Louvain clustering at varying resolutions (specifically, the resolution value passed to the Seurat function FindClusters A = 0.1, D = 0.3, G = 0.7), and violin plots depicting the normalized expression of Tph2, Gad2, Gad1, Slc17a8, and Met. (B, E, H) UMAP visualization of community structure at a given resolution (B = 0.1, E = 0.3, H = 0.7). (C, F, I) Heatmap depicting the scaled expression of the top five marker genes for each cluster (ranked by p-value).
Figure 1—figure supplement 3
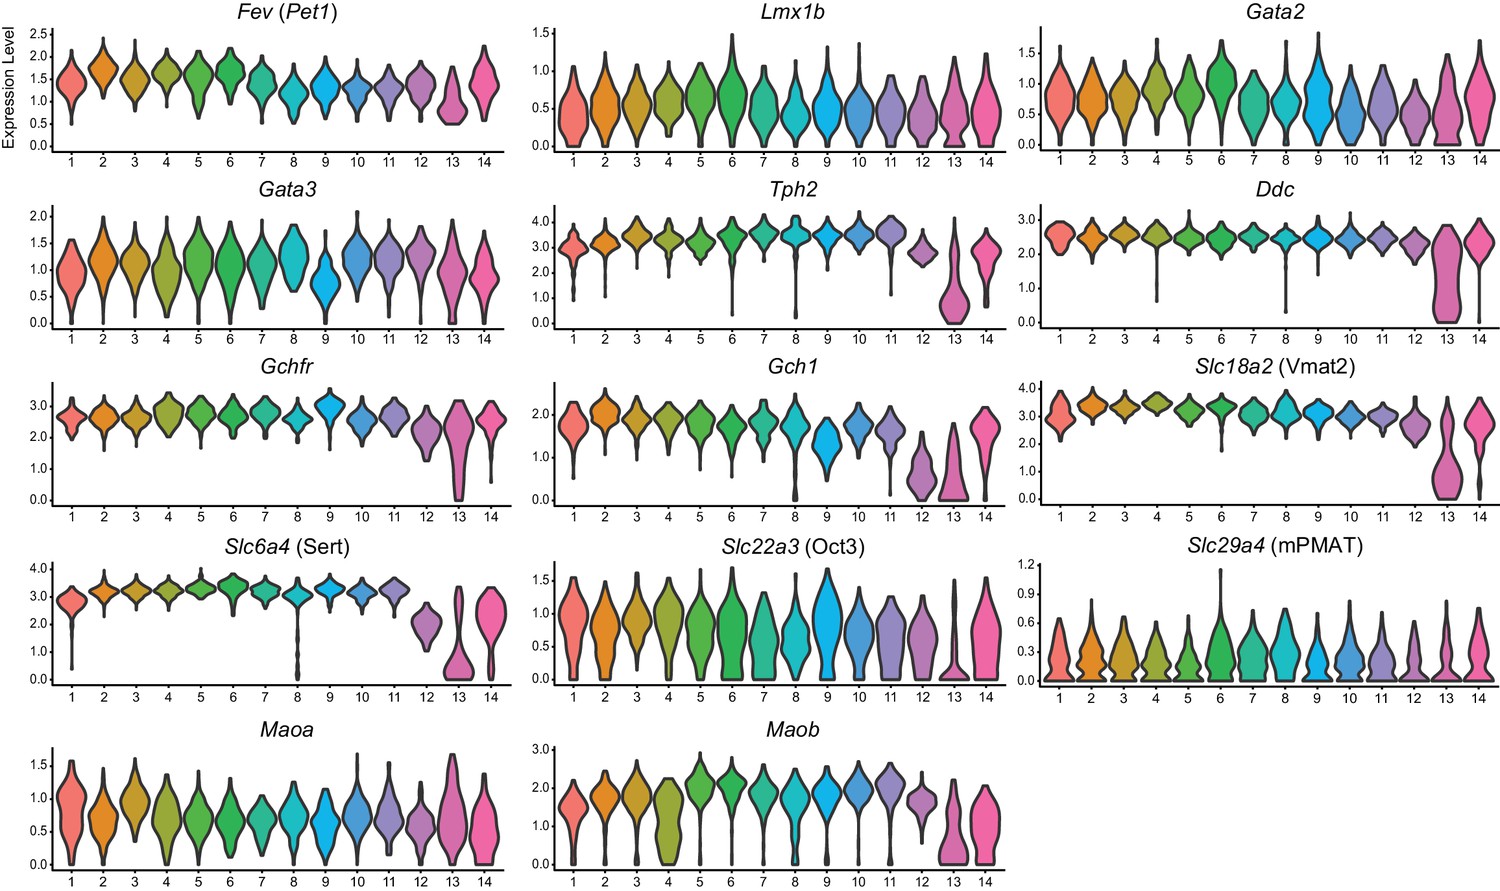
Expression of serotonin-related genes across DR Pet1 neuron subtypes.
Violin plots depicting the log-normalized expression of serotonin neuron marker genes across the fourteen Pet1 neuron clusters.
Figure 1—figure supplement 4
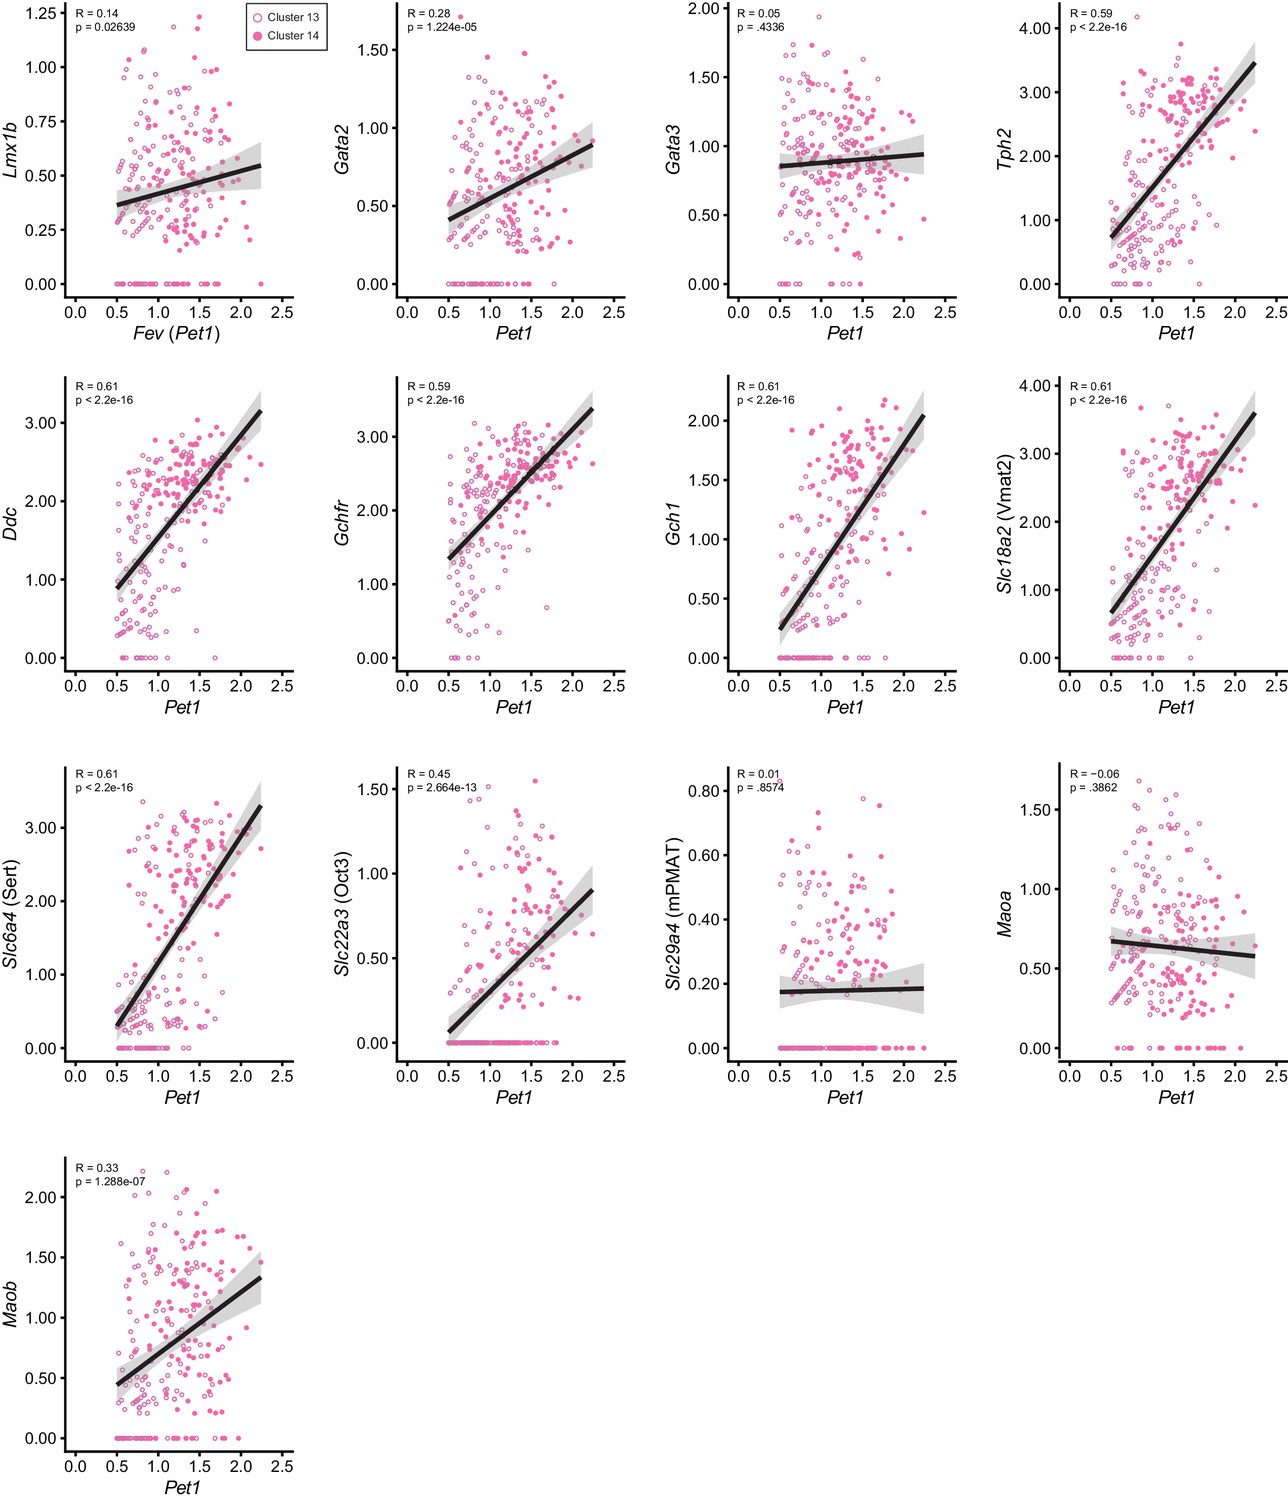
Correlation of 5-HT marker gene expression levels with Fev (Pet1) gene expression levels for clusters 13 and 14.
Scatter plots showing the correlation between the normalized expression level of Pet1 (X-axis) and other 5-HT marker genes (Y-axis) for clusters thirteen (light pink open circles) and fourteen (dark pink closed circles). Linear line of best fit for each plot shown in black with corresponding 95% confidence interval in grey. Pearson correlation coefficient and p value displayed in the top left corner of each graph.
Figure 2
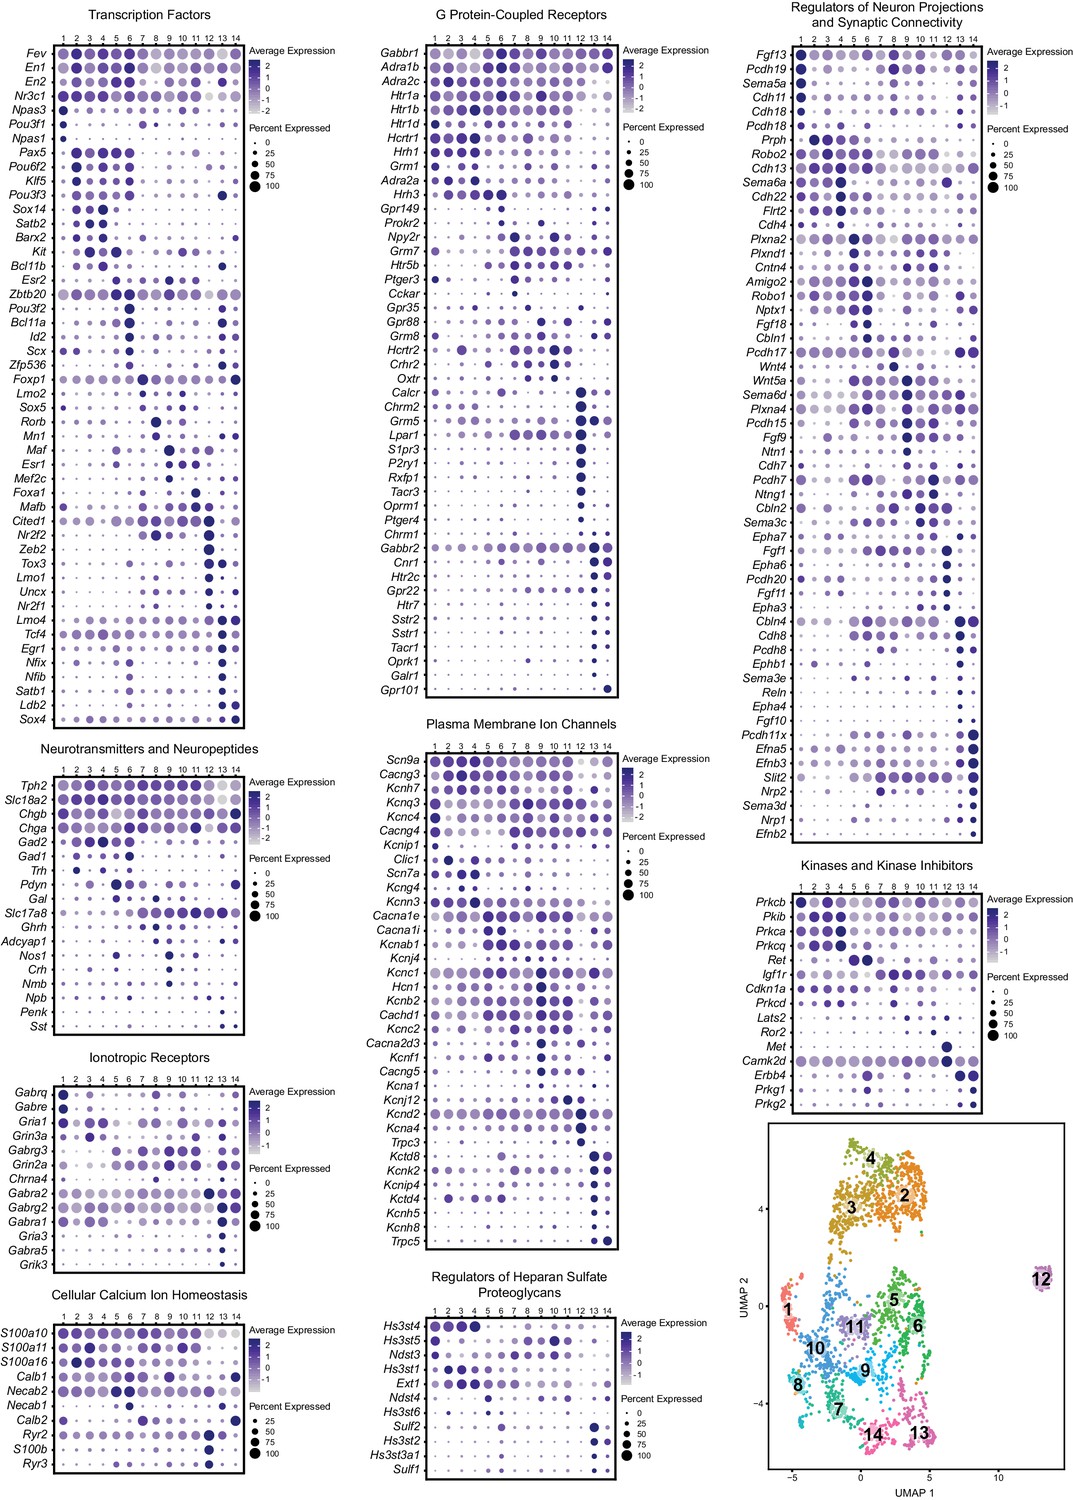
Expression patterns of a subset of highly variable genes classified by biological function.
Dot plots show the expression of a gene (Y-axis) in each cluster (X-axis), separated by biological function. The size of the dot represents the percentage of cells expressing the gene and saturation of color represents average normalized expression level (scaled and centered). For convenience, the UMAP plot from Figure 1C is re-displayed at the bottom right to help link gene expression patterns to overall cluster structure. Minimum inclusion criteria for genes was that they were among the top 2000 highest variance genes and/or they were found to be significantly enriched or ‘de-enriched’ in at least one subtype cluster (see Materials and methods).
Figure 3 with 2 supplements
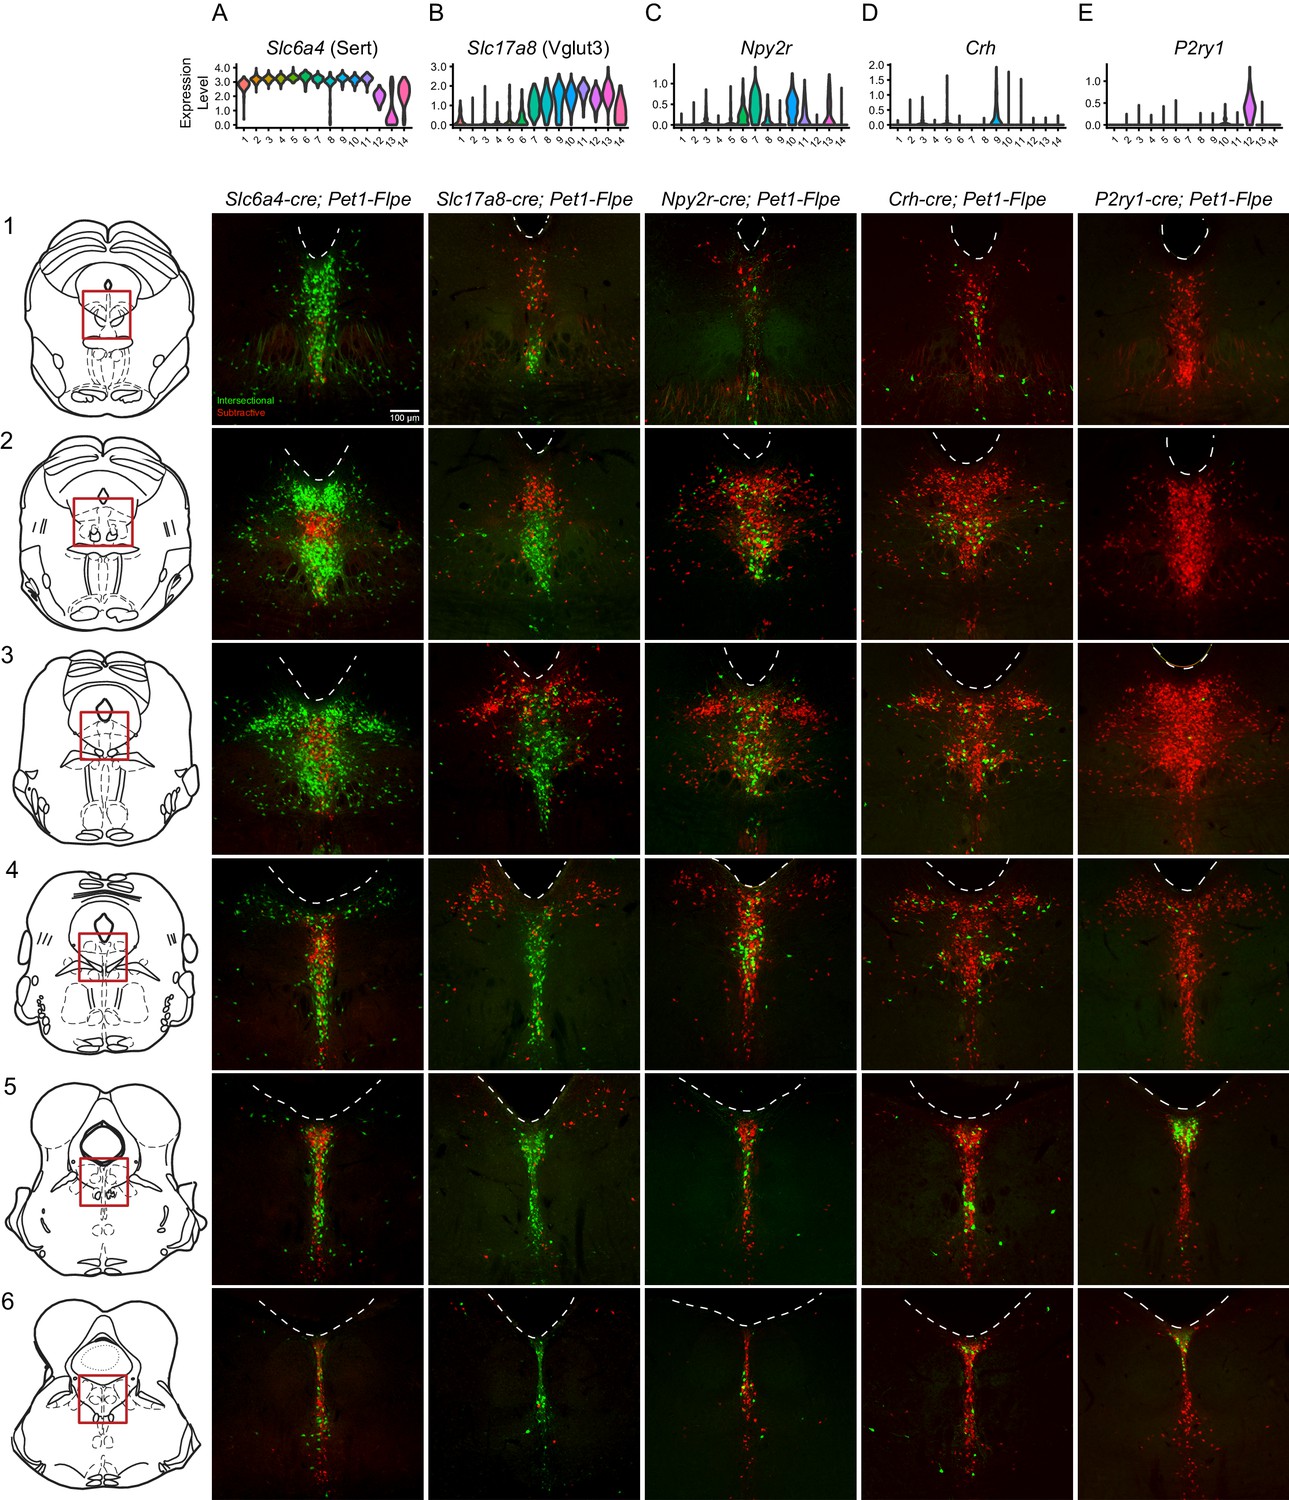
Intersectionally targeted Pet1 neuron subtypes have different anatomical distributions in subregions of the DR.
(A–E) Low magnification view of 40 µm coronal sections showing the DR from rostral to caudal (1-6) in triple transgenic animals. Cell bodies are labeled by the intersectional expression of a Cre driver of interest, Pet1-Flpe, and the intersectional allele RC-FrePe (green EGFP marked cells expressing both Cre and Flpe and red mCherry expressing Pet1-Flpe subtractive population) unless otherwise noted. (A) Slc6a4-cre; Pet1-Flpe; RC-FrePe, (B) Slc17a8-cre; Pet1-Flpe; RC-FL-hM3Dq (green mCherry-hM3Dq marked cells expressing Cre and Flpe and red EGFP expressing Pet1-Flpe subtractive population), (C) Npy2r-cre; Pet1-Flpe; RC-FrePe, (D) P2ry1-cre; Pet1-Flpe; RC-FrePe. Top row shows violin plots depicting transcript expression (10X scRNA-seq data) of the respective gene corresponding with each Cre driver. Scale bar (A1) equals 100 µm. The expression of TPH2 and VGLUT3 was further investigated in Figure 3—figure supplements 1 and 2, respectively.
Figure 3—figure supplement 1
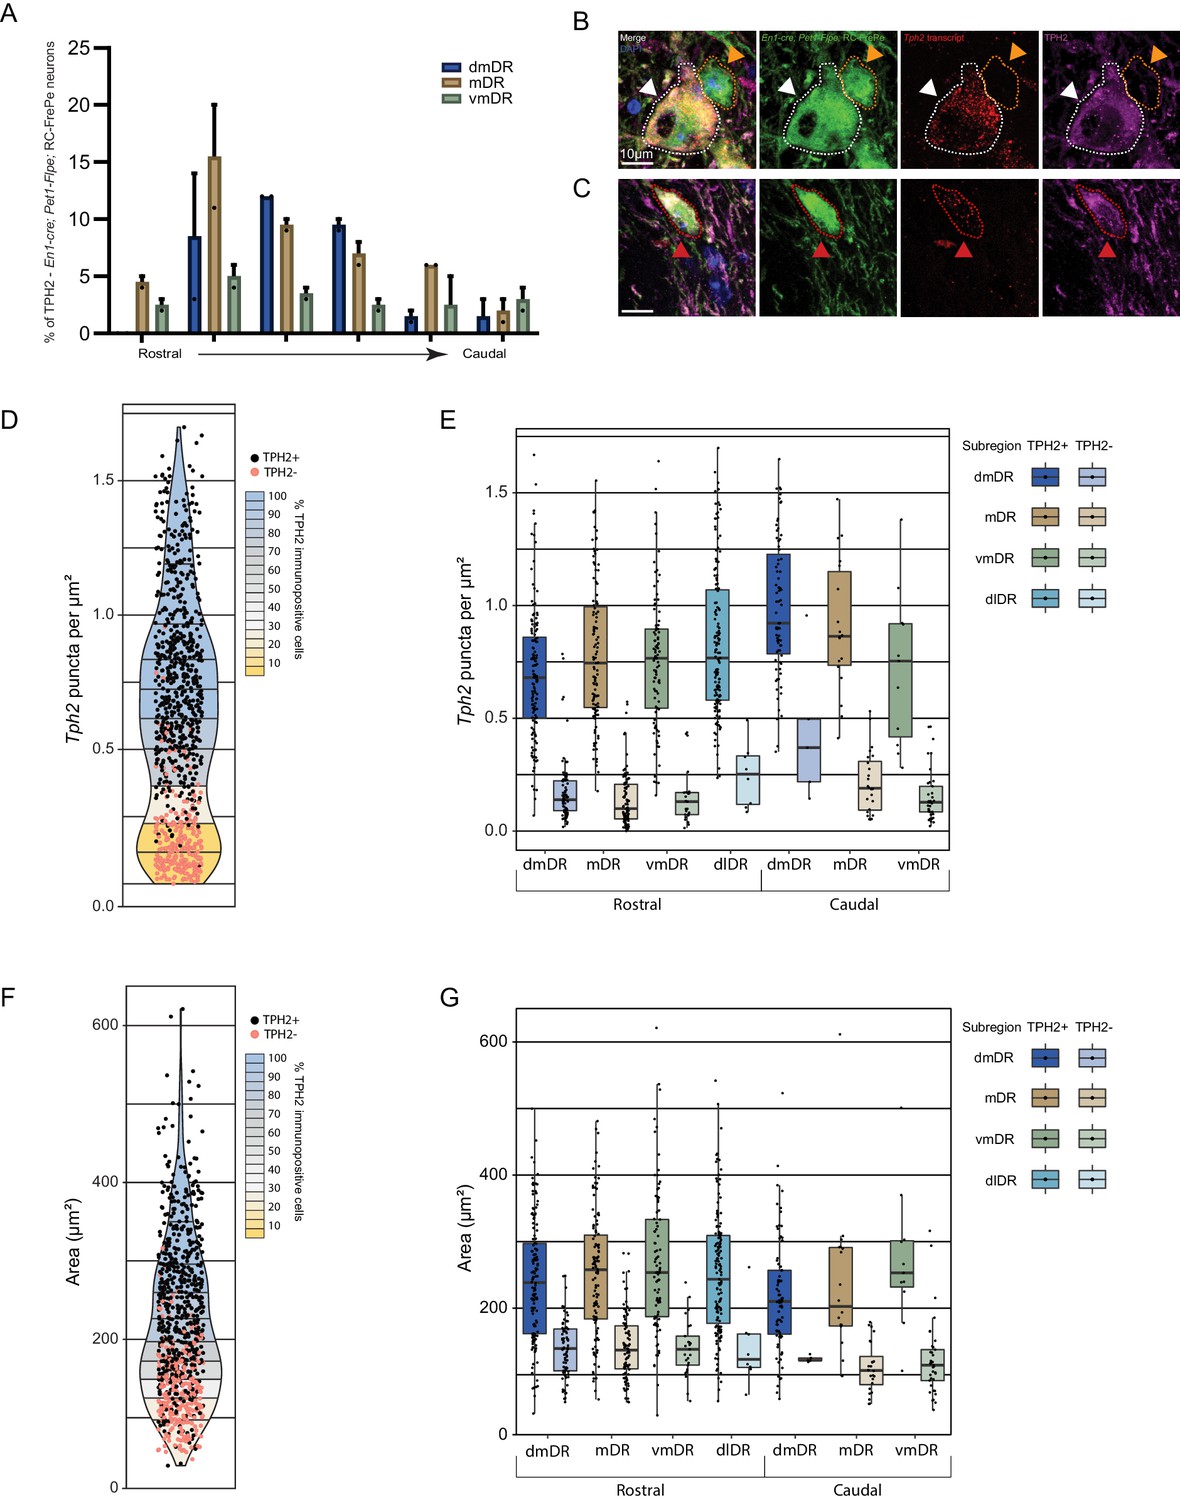
Diversity of Tph2 RNA transcripts and protein expression in dorsal raphe Pet1 neurons.
(A) Bar graph showing the percentage of the total population of EGFP-positive TPH2-negative cells counted in a specific anatomical subdivision of the DR in En1-cre; Pet1-Flpe; RC-FrePe animals (Green labeled neurons with intersectional expression of En1-cre and Pet1-Flpe). n = 2, bar graph depicting the mean with SEM. (B, C) Images showing co-visualization of EGFP (green) and TPH2 (magenta) by immunofluorescence and Tph2 transcripts (red) by RNAscope in En1-cre; Pet1-Flpe; RC-FrePe neurons. Examples for a TPH2 immunopositive cell with high Tph2 transcripts (white arrow in B), a TPH2 immunonegative cell with low Tph2 transcripts (orange arrow in B), and a TPH2 immunopositive cell with medium levels of Tph2 transcript (red arrow in C) are shown. Scale bars are 10 µm. (D) Violin plot depicting the number of Tph2 puncta per um2 of each counted EGFP+ cell (from an En1-cre; Pet1-Flpe; RC-FrePe animal) that was TPH2 immunopositive (black) or TPH2 immunonegative (pink). The violin plot is split into deciles, with fill color representing the percent of TPH2 immunopositive cells within a given decile. (E) Box plots depicting the number of Tph2 puncta for each counted EGFP+ cell that was TPH2 immunopositive (darker shade, left) or TPH2 immunonegative (lighter shade, right), split across DR subanatomy (Rostral and Caudal, dorsomedial DR (blue), medial DR (tan), ventromedial DR (green), dorsolateral DR (turquoise)). (F) and (G) same as D and E, except depicting cell area.
Figure 3—figure supplement 2
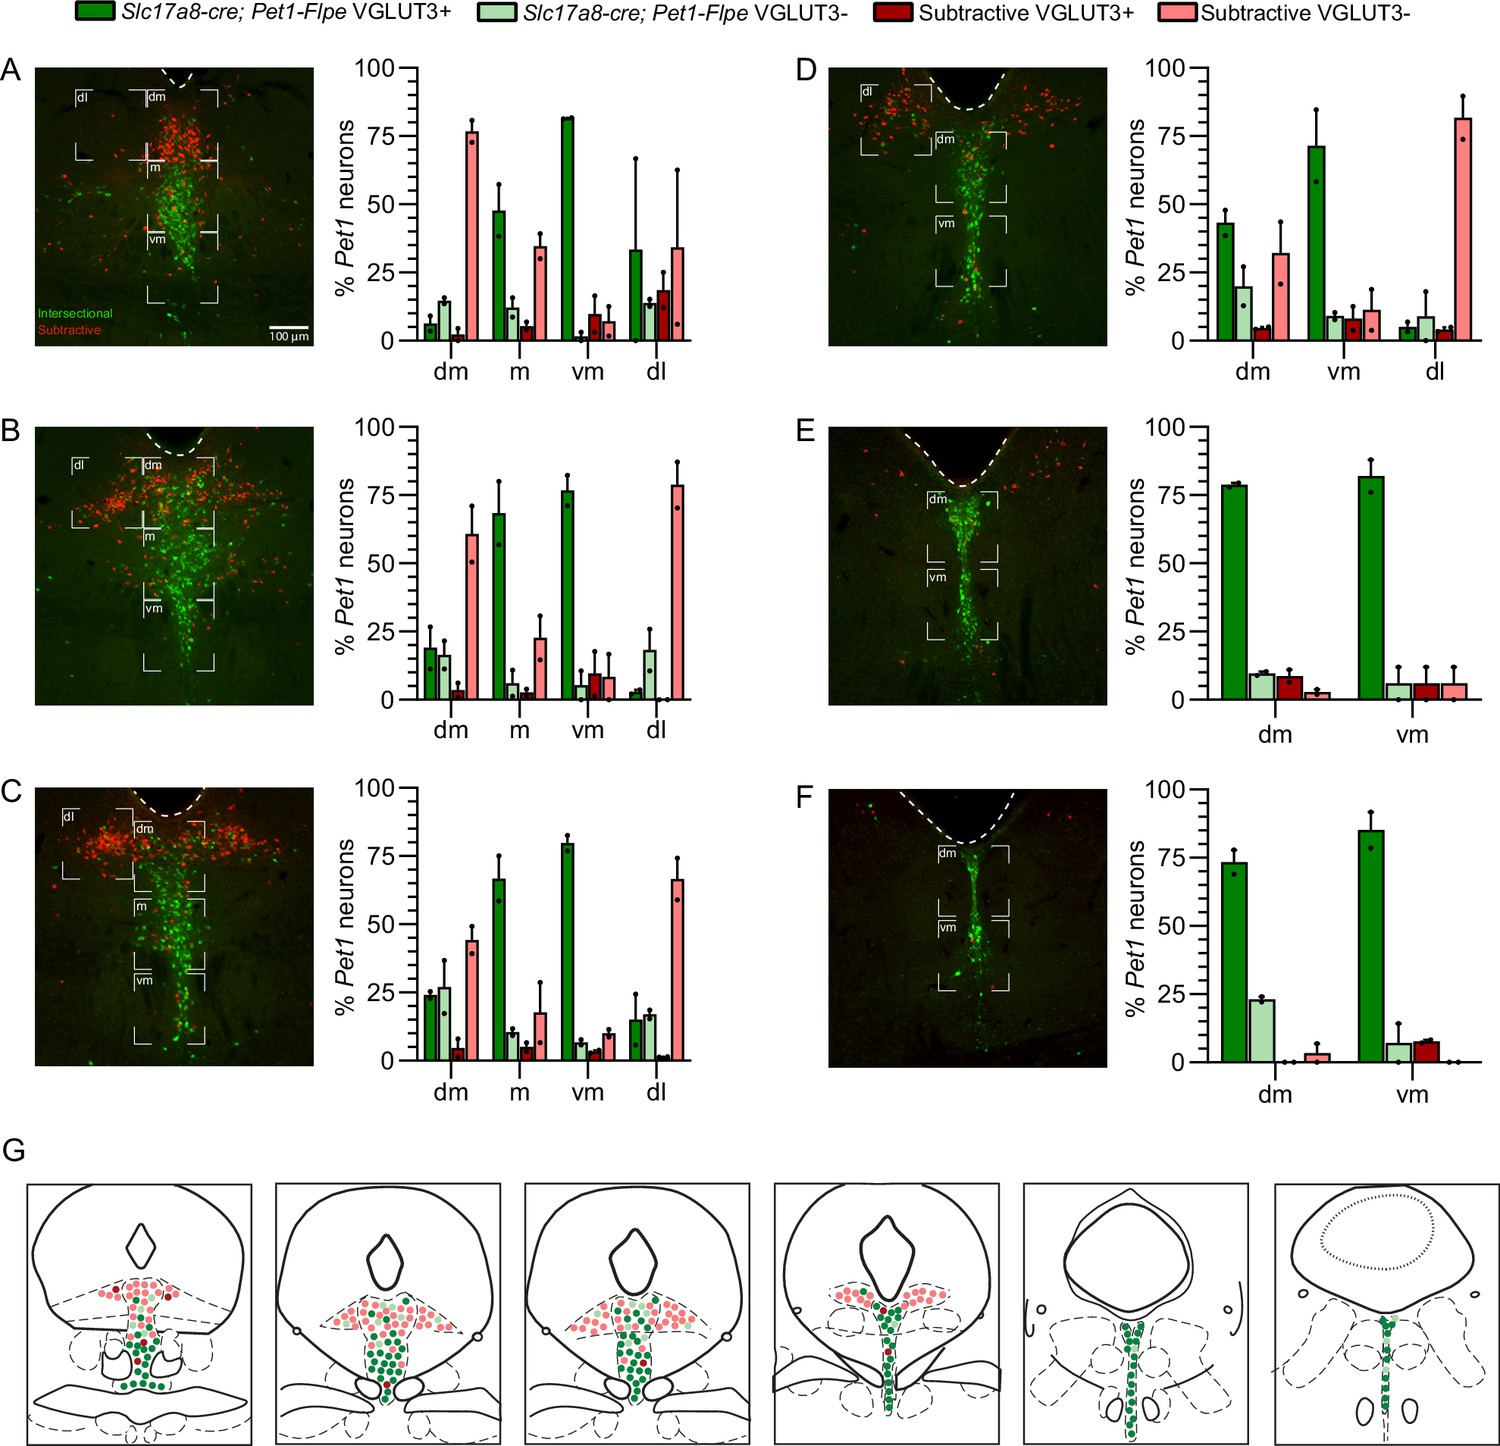
VGLUT3 antibody staining of Pet1 neurons is anatomically biased within different DR subdomains.
(A–F) Quantification of the percentage of VGLUT3 immunoreactive Slc17a8-cre; Pet1-Flpe lineage (dark green) and VGLUT3 immunoreactive subtractive Pet1 lineage cells (dark red) within anatomical subdivisions of the dorsal raphe from rostral (A) to caudal (F), in comparison to VGLUT3 immunonegative Slc17a8-cre; Pet1-Flpe and subtractive Pet1 neurons (light green and light red respectively). Low magnification images indicate representative quantified images. Anatomical subdivisions (dorsomedial (dm), medial (m), ventromedial (vm) and dorsolateral (dl)) are delineated with white brackets. Scale bar in D equals 100 µm, n = 2, bar graph depicts mean with SEM. (G) Summary coronal brainstem schematic showing the distribution of VGLUT3 immunopositive and immunonegative Slc17a8-cre; Pet1-Flpe (dark and light green) and subtractive Pet1 neurons (dark and light red) in the DR from rostral (left) to caudal (right).
Figure 4 with 2 supplements
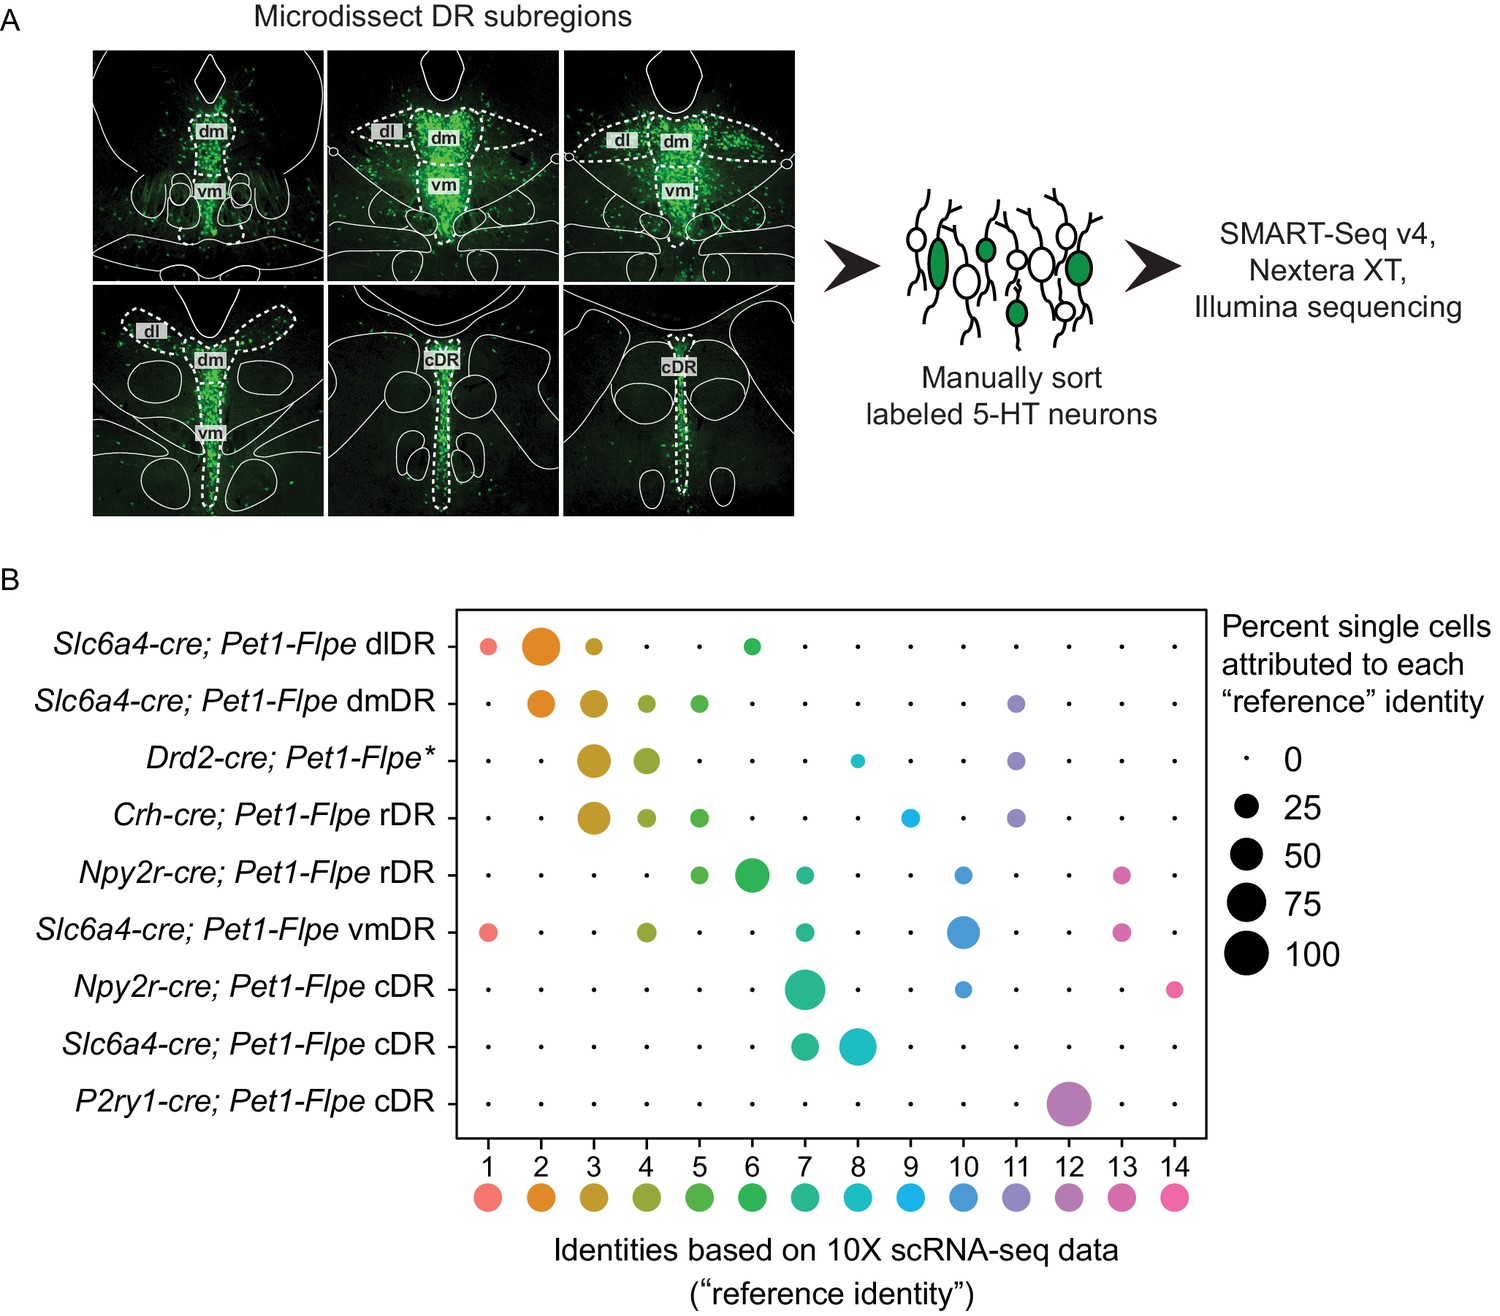
scRNA-seq of Pet1 neurons manually sorted from anatomical subdomains map onto specific 10X scRNA-seq clusters.
(A) Schematic of the pipeline used for manual sorting and sequencing, including referenced anatomical subdomains mapped onto representative images of the DR. Pet1 neurons are in green. (B) Dot plot mapping manually sorted cells from a given genotype and anatomical subdomain (Y-axis) to the fourteen 10X clusters (X-axis). The size of the dot indicates the percentage of single cells from a genotype/anatomical region attributed to a reference cluster. Note, the asterisks after Drd2-cre; Pet1-Flpe is to denote that these data come from a previously published study (Niederkofler et al., 2016), and these particular single-cell libraries were prepared using the Nugen Ovation RNA-seq System v2 kit, rather than SMART-Seq v4. The expression of a selection of highly variable and cluster marker genes is depicted in Figure 4—figure supplement 1.
Figure 4—figure supplement 1
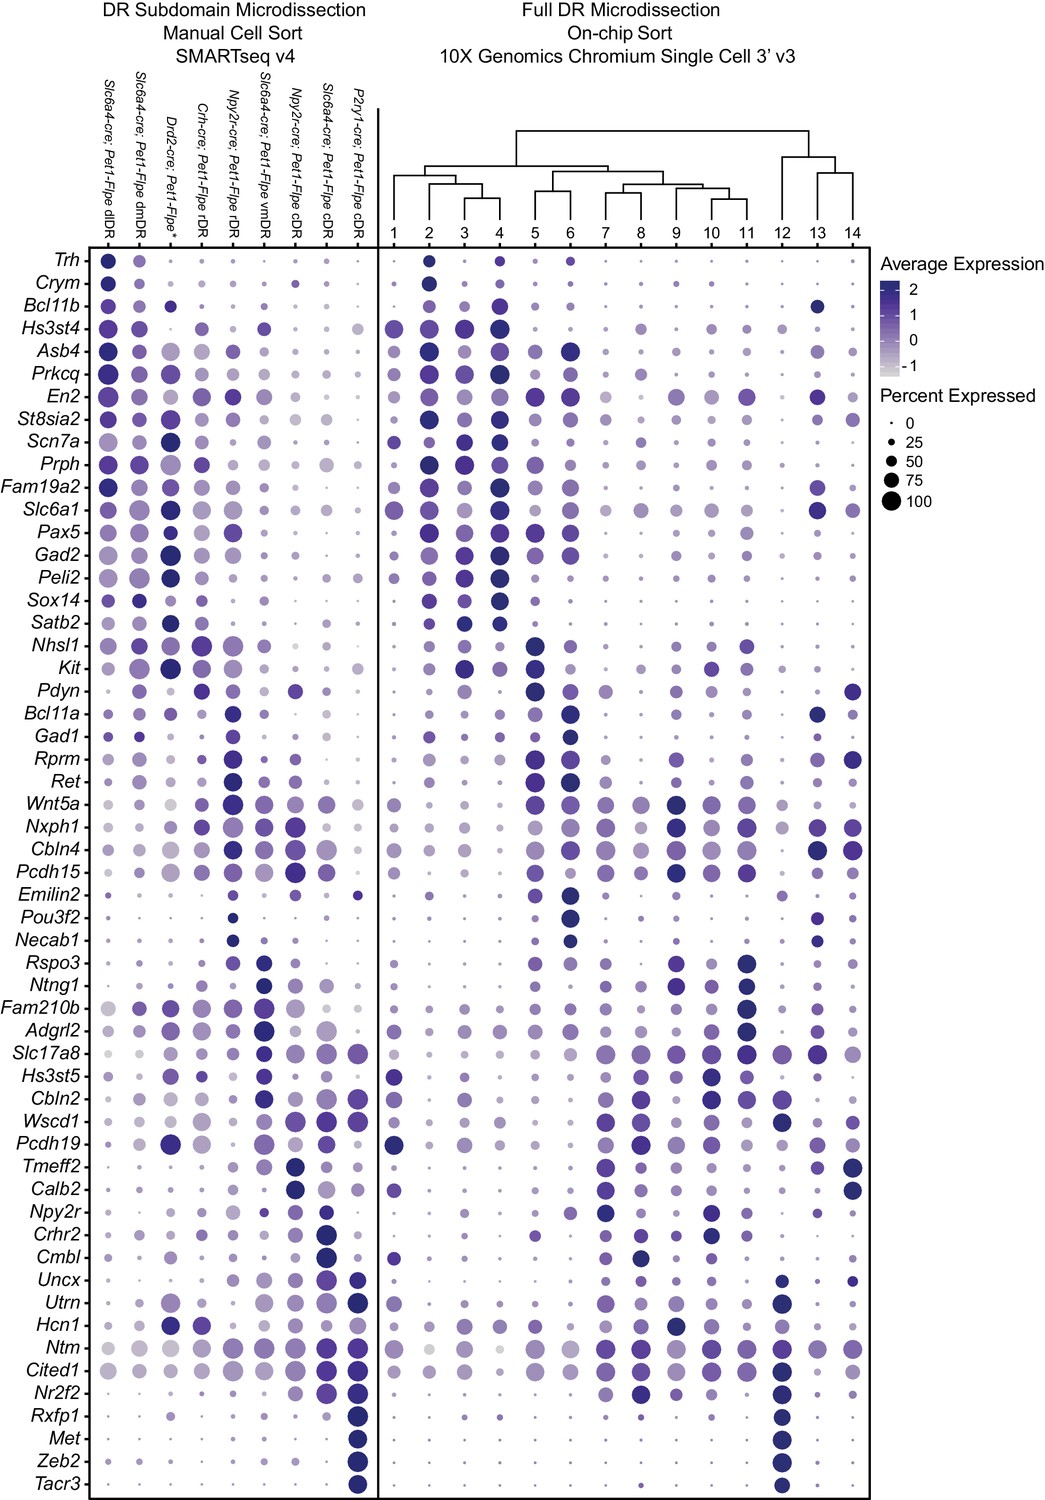
Expression patterns of a selection of highly variable and cluster marker genes that show anatomical bias.
Dot plot depicting the expression of genes (Y-axis) across manually sorted cells from a specific subdomain and genotype (left) and 10X scRNA-seq clusters (right). The size of the dot represents the percentage of cells expressing the gene and saturation of color represents the average normalized expression level. As with Figure 4, the asterisks after Drd2-cre; Pet1-Flpe denotes that these data come from a previously published study (Niederkofler et al., 2016), and these particular single-cell libraries were prepared using the Nugen Ovation RNA-seq System v2 kit, rather than SMART-Seq v4.
Figure 4—figure supplement 2

PAX5 and SATB2 are expressed predominately in rostral dorsomedial and dorsolateral Pet1 neurons while NR2F2 is expressed predominately in caudal Pet1 neurons.
(A) Representative regions of the DR used for quantification of immunostaining from rostral (left) to caudal (right). Brackets indicate anatomical subdivisions- dorsomedial (dmDR, dark blue), medial (mDR, tan), ventromedial (vmDR, green), and dorsolateral (dlDR, light blue). (B–D) (top) Distribution of normalized transcript expression of Pax5 (B), Satb2 (C) or Nr2f2 (D) within Pet1 neuron subtypes and (bottom) the percentage of counted Pet1 neurons immunoreactive for PAX5 (B), SATB2 (C) or NR2F2 (D) that are arising from Slc17a8-cre; Pet1-Flpe neurons (dark grey) in comparison to the subtractive Pet1 population (light grey). (B’–D’) Bar graph depicting the percentage of Pet1 neurons immunopositive for PAX5 (B’), SATB2 (C’) or NR2F2 (D’) in anatomical subdivisions of the DR from rostral to caudal. n = 2–4 depending on rostral to caudal section, bar graph depicting mean with SEM. (B’’–D’’) Representative coronal confocal image depicting a region of the DR with Pet1 neurons immunopositive for PAX5 (B’’), SATB2 (C’’) or NR2F2 (D’’). Slc17a8-cre; Pet1-Flpe cells are shown in green, subtractive Pet1 cells in red, and antibody of interest in blue. (E) Coronal brainstem schematics depicting the anatomical distribution of Pet1 neurons (top) expressing PAX5 and NR2F2, or (bottom) that are expressing Gad2-Tph2, Slc17a8-Tph2, or Slc17a8 only from rostral (right) to caudal (left).
Figure 5 with 1 supplement
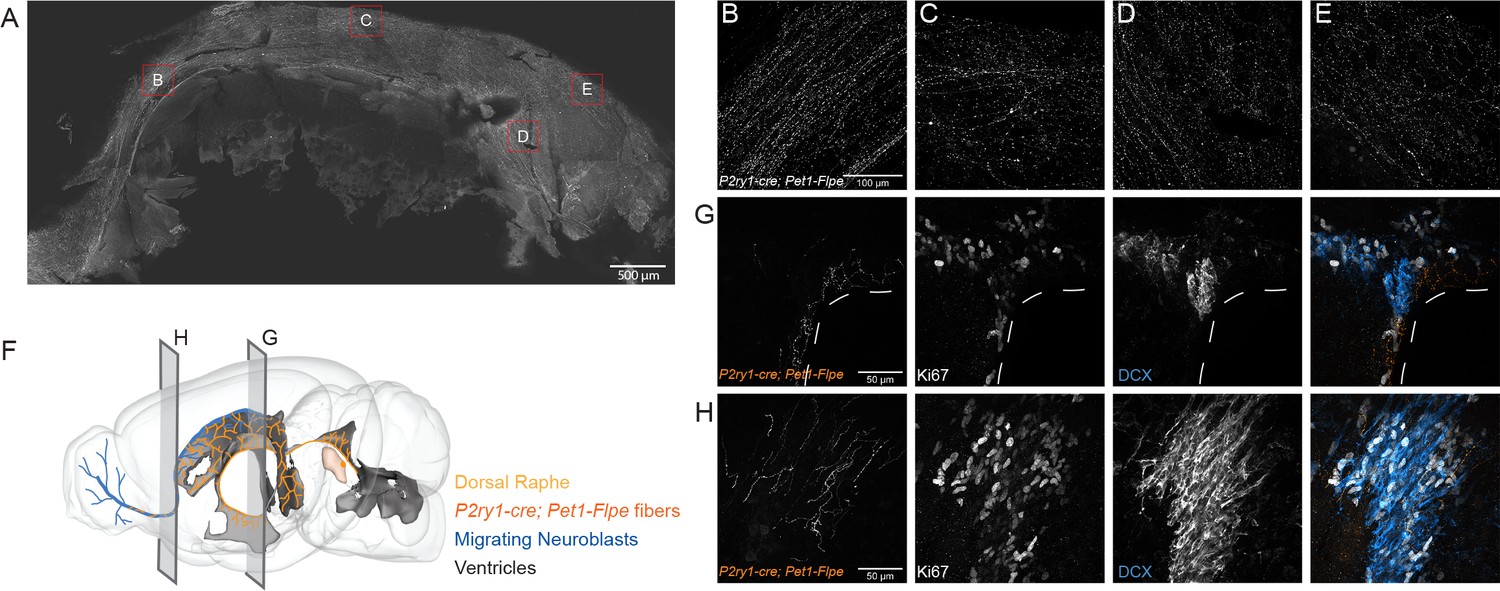
P2ry1-cre; Pet1-Flpe neurons project throughout the ventricles and their fibers are in close apposition to proliferating cells in the SVZ and RMS.
(A) Flat mount of the lateral wall of the lateral ventricle of a P2ry1-cre; Pet1-Flpe; RC-Ai65 animal, where P2ry1-cre; Pet1-Flpe fibers are in grey. Scale bar = 100 µm. (B–E) High magnification confocal images from regions of the lateral wall represented in red boxes in A. Scale bar (B) = 100 µm. (F) 3D brain schematic showing the P2ry1-cre; Pet1-Flpe cell bodies (dark orange) in the caudal part of the DR (light orange) and fibers (dark orange) projecting through the ventricles (grey) and along the migrating neuroblasts of the rostral migratory stream (RMS, blue). (G–H) Coronal confocal images depicting P2ry1-cre; Pet1-Flpe fibers (orange) from P2ry1-cre; Pet1-Flpe; RC-Ai65 animals in the SVZ (G) and RMS (H). Proliferating cells labeled with Ki67 (grey) and migrating neuroblasts labeled with doublecortin (DCX, blue). Scale bar (G, H) = 50 µm.
Figure 5—figure supplement 1
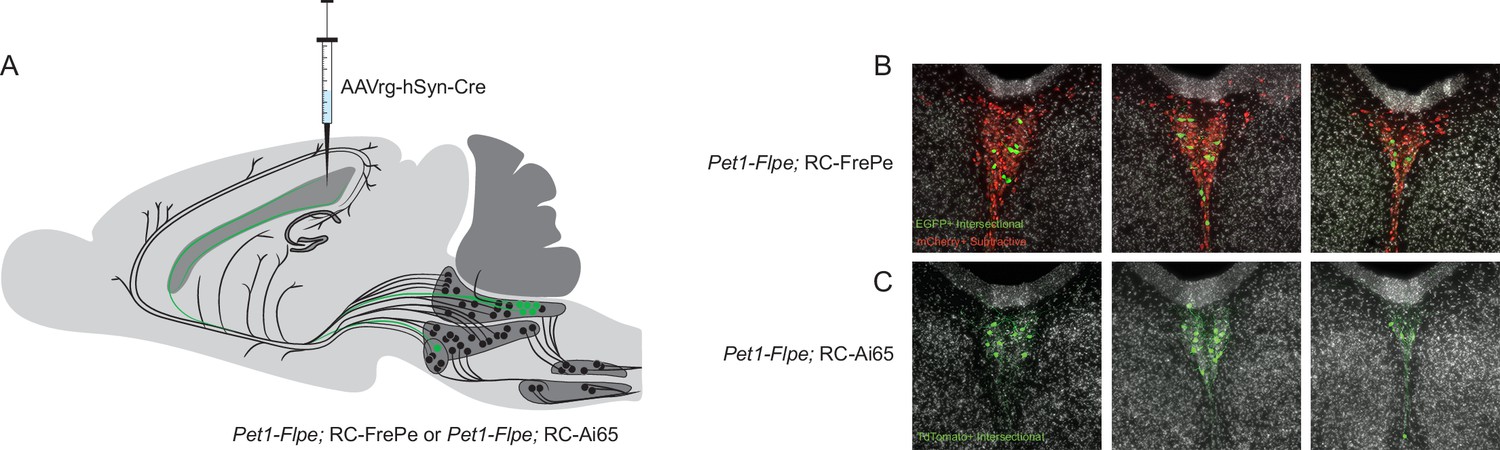
The caudal dorsal raphe is the major Pet1 neuron source of supra-ependymal fibers.
(A) Schematic depicting unilateral injection of AAVrg-hSyn-Cre into the lateral ventricle of either Pet1-Flpe; RC-FrePe (EGFP marked cells expressing both Cre and Flpe and mCherry expressing Pet1-Flpe subtractive population) or Pet1-Flpe; RC-Ai65 (TdTomato marked cells expressing both Cre and Flpe), leading to labeling of Pet1 cells in the caudal dorsal raphe predominantly, and a smaller group in the median raphe. (B–C) Coronal confocal images of the caudal dorsal raphe from rostral (left) to caudal (right) in a Pet1-Flpe; RC-FrePe (B) or Pet1-Flpe; RC-Ai65 (C) animal depicting Pet1-Flpe neurons with Cre expression after lateral ventricle injection of AAVrg-hSyn-Cre (green) and the Pet1-Flpe subtractive population (red, B only).
Figure 6 with 1 supplement

P2ry1-cre; Pet1-Flpe neurons have a distinct firing phenotype.
(A) Frequency-Current (F–I) curves show P2ry1-cre; Pet1-Flpe neurons (tdTomato+ P2ry1-cre; Pet1-Flpe; RC-Ai65, n = 12; three animals; red circles) are less excitable than nearby caudal dorsal raphe non-P2ry1-cre; Pet1-Flpe populations (EGFP+ P2ry1-cre; Pet1-Flpe; RC-FL-hM3Dq, n = 8; three animals; black squares) or neurons from the dorsomedial and dorsolateral dorsal raphe Gad2-cre; Pet1-Flpe population (tdTomato+ Gad2-cre; Pet1-Flpe; RC-Ai65, n = 12; two animals; blue circles) p<0.0001 Kruskal-Wallis test. (B) Example voltage traces from neuron patch-clamp recordings showing different firing types, specifically a neuron that started firing action potentials with (1) short latency (mean = 17.32 ms±6.61 at 200 pA), in response to 750 ms current pulses, (2) medium latency (mean = 64.18 ms±9.8 at 200 pA), (3) long latency (mean = 476.55 ms±223.64 at 200 pA), or (4) short latency (mean = 12.6 ms±5.9 at 200 pA) with spike-frequency adaptation. (C) Heat map shows the percentage of cells recorded from each genotype corresponding to each firing type, note all recorded P2ry1-cre; Pet1-Flpe neurons belong to type 3.
Figure 6—figure supplement 1
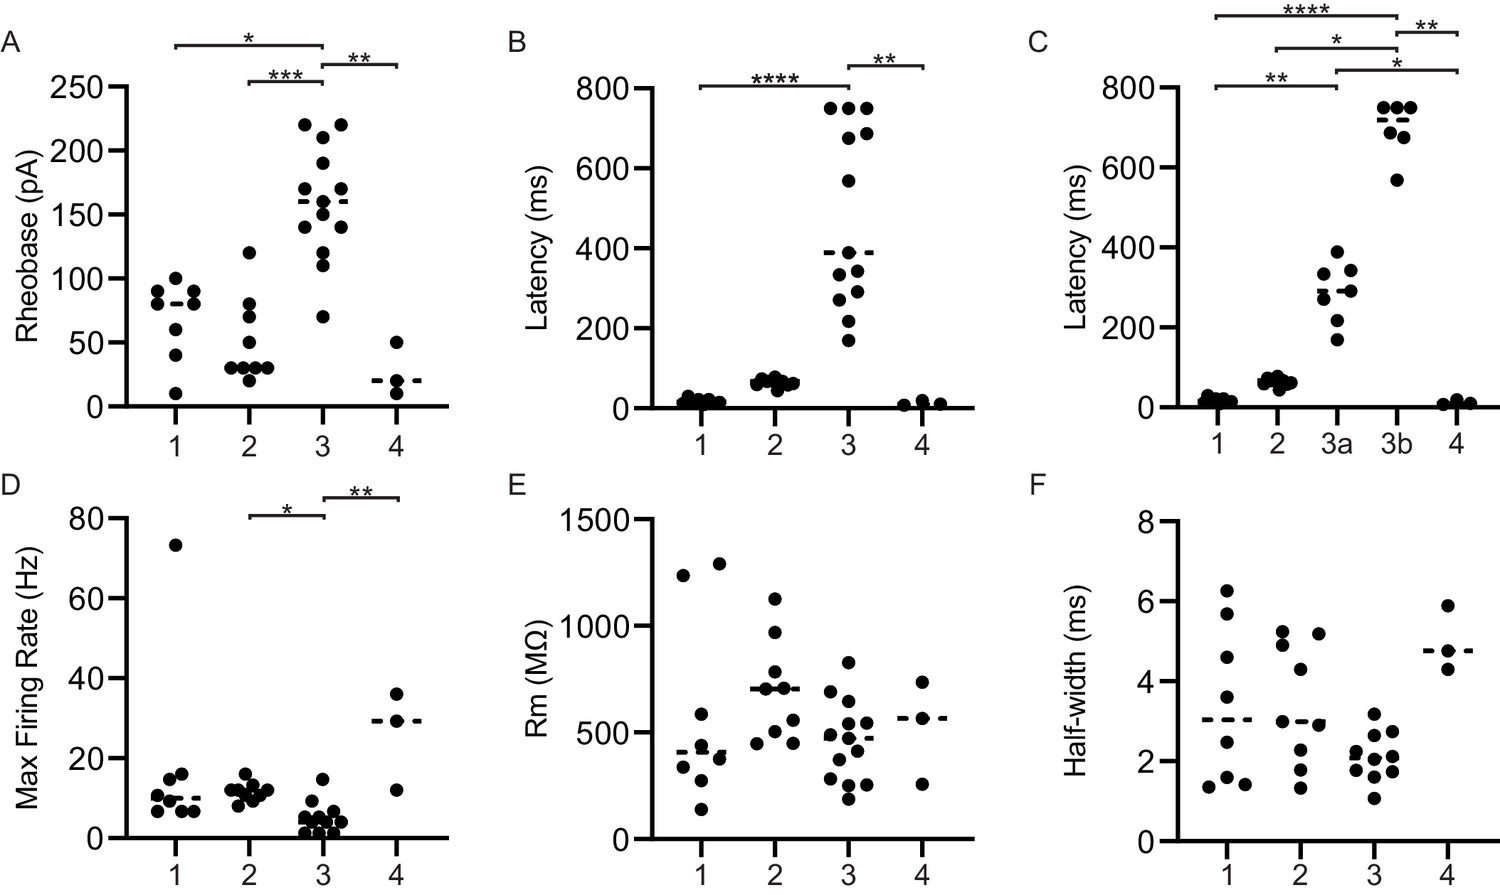
Key membrane properties distinguish serotonergic neuron firing types.
Referenced groups are the same as described in Figure 6B; all P2ry1-cre; Pet1-Flpe; RC-Ai65 neurons belong to group 3. (A) Scatterplot of rheobase (in pA) exhibited by each cell of the corresponding firing type. (B) Scatterplot of the latency of each cell to fire the first action potential after the onset of the depolarizing current pulse by the corresponding firing type. (C) Same as B except firing type three was split into subgroups 3a and 3b, based on bi-modality visible in B. (D) Scatterplot of the maximum firing frequency (in Hz) exhibited by each cell of the corresponding firing type. (E) Scatterplot of the membrane resistance (in MΩ), exhibited by each cell of the corresponding firing type. (F) Scatterplot of the average half-width of the action potential of each firing type at maximum firing rate (in ms). Dashed lines indicate the median. Asterisks indicate statistical significance, Kruskal-Wallis test *p<0.05, **p<0.01, ***p<0.001, ****p<0.0001.
Figure 7 with 1 supplement
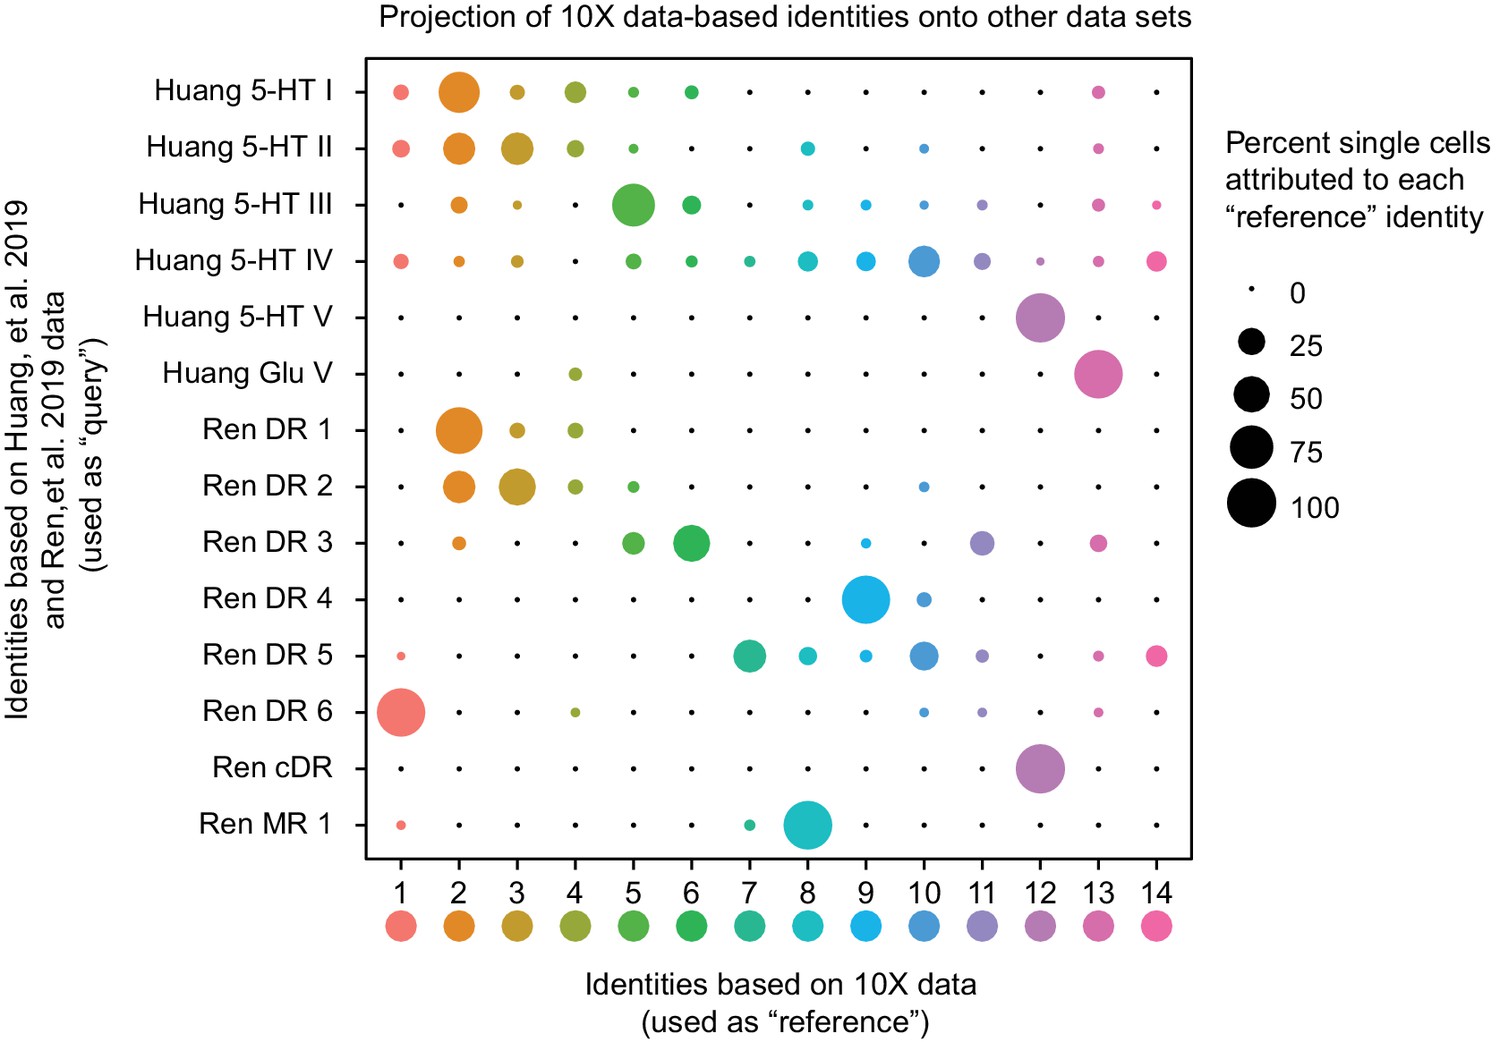
Correspondence of serotonin subtypes identified in previous studies (Y-axis) to the fourteen 10X scRNA-seq clusters identified in this study (X-axis).
The size of the dot indicates the percentage of single cells from the original cluster that are attributed to a given reference cluster.
Figure 7—figure supplement 1
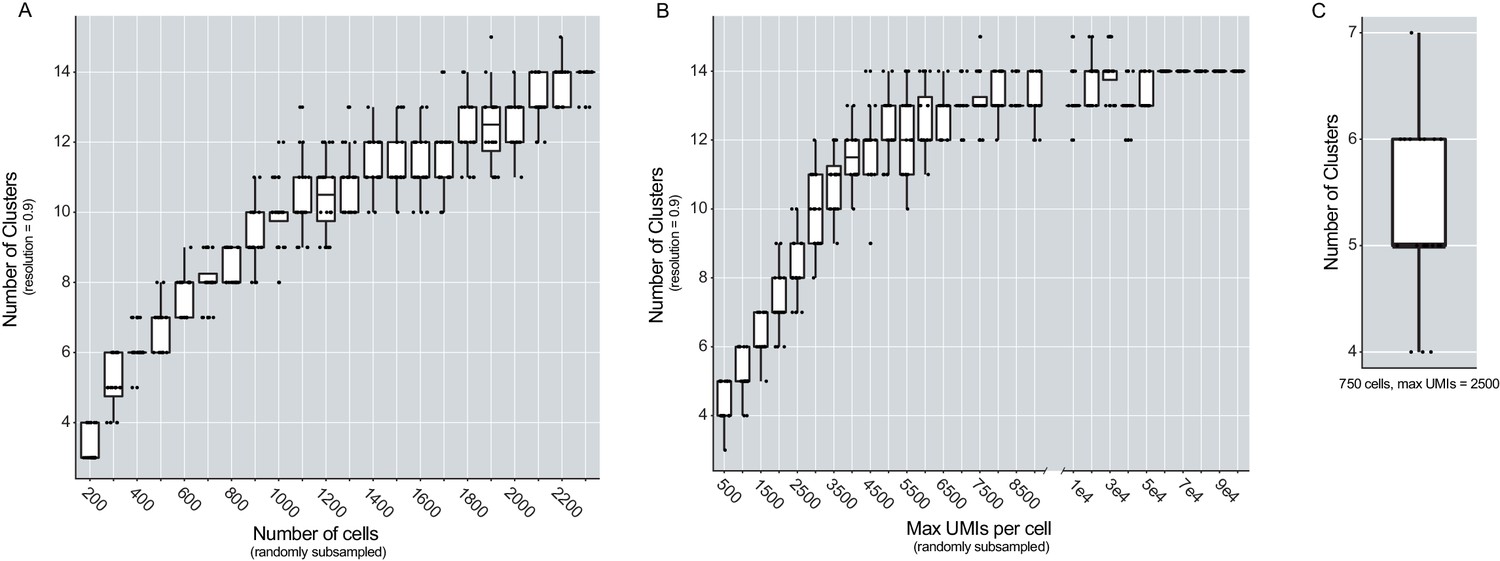
The number of cells sampled and the max UMIs per cell influence the number of clusters found in the dataset.
(A) Box plot depicting the number of clusters found at resolution 0.9 (Y-axis) when then number of cells included in the analysis was varied (X-axis). Cells were randomly sub-sampled to include 200 to 2,300 cells (in intervals of 100) and the analysis was repeated twenty times per iteration. (B) Box plots depicting the number of clusters found at resolution 0.9 (Y-axis), when the max UMIs per cell was varied. UMIs were randomly sub-sampled from 500 to 100,000, at intervals of 500, and the analysis was completed twenty times per iteration. (C) Box plot depicting the distribution of the number of clusters found when the dataset was randomly downsampled to 750 cells and 2500 UMIs per cell (analysis repeated 20 times).
Figure 8
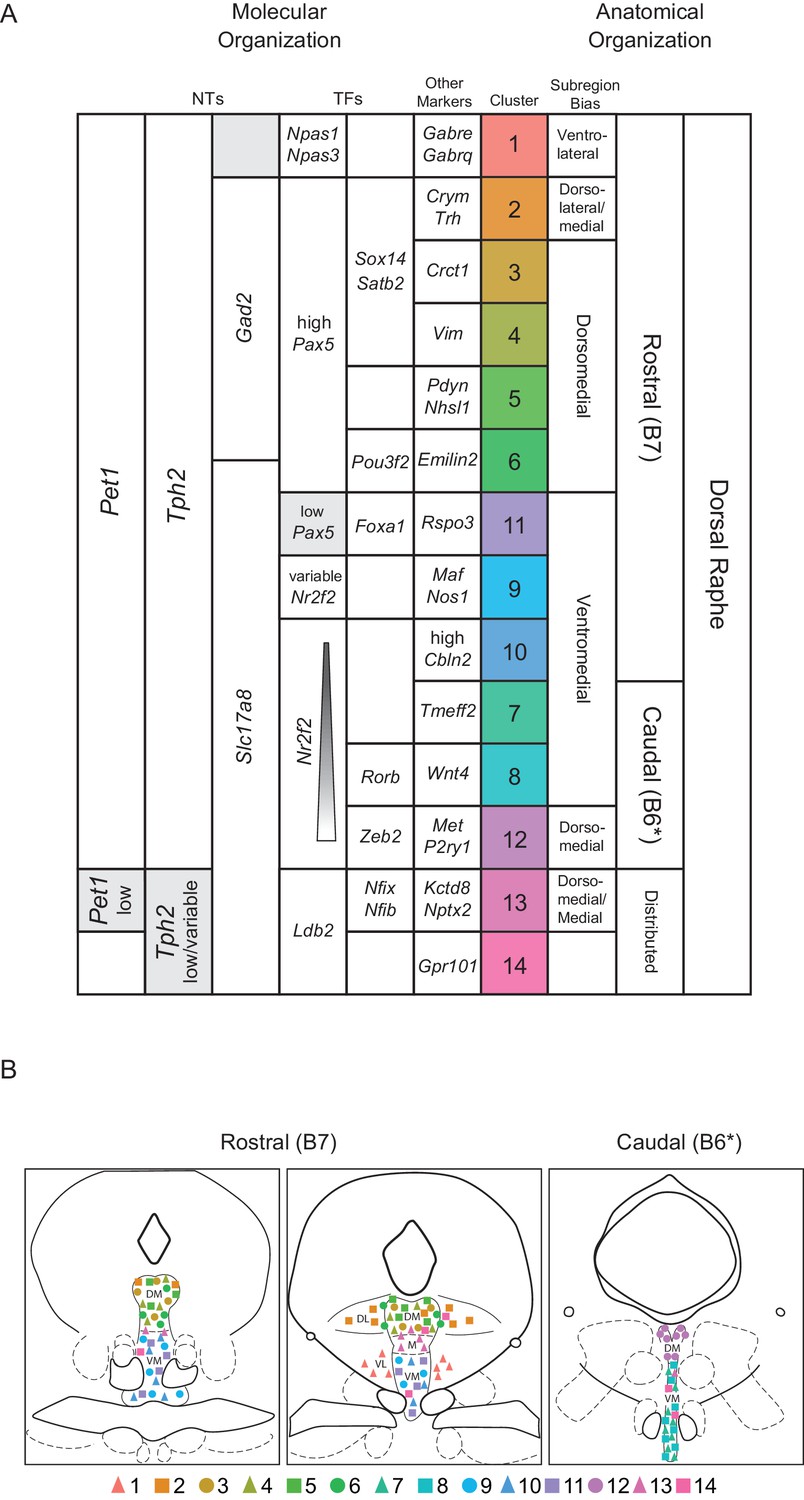
Fourteen Pet1 subtypes in the DR can be defined by the combinatorial expression of transcription factors and other markers and have distinct anatomical organization.
(A) Molecular markers (neurotransmitters (NTs), transcription factors (TFs), and other markers) on the left half of the table, with increasing specificity from left to right, that combinatorically define each identified Pet1 subtype (colored column). Anatomical biases of each cluster are described on the right, with increasing specificity from right to left. Figure 8—source data 1 outlines the combination of information used to inform the proposed anatomical bias. Note, cluster numbers have been re-ordered to highlight anatomical groupings. (B) Schematic depicting the anatomical distribution of each subtype based on the bias indicated in (A). B7 and B6 refer to the original Dahlström and Fuxe nomenclature for describing distinct anatomical clusters of 5-HT neurons. The asterisks after B6 in A and B are to indicate that some authors only consider B6 to encompass the dorsal part of what we refer to as the caudal DR.
-
Figure 8—source data 1
Anatomical bias of Pet1 DR subtypes can be inferred by a combination of histology, single cell RNAseq, data from previously published papers, and Allen Mouse Brain atlas RNA in situ hybridization data.
Table depicting each cluster (column 1) and its proposed anatomical bias (column 2) based on a combination of analysis of histology from intersectional lines and single cell RNA seq (columns 3 and 5), immunostaining and in-situ hybridization (column 4), computational mapping of our subtypes to previously published datasets (column 6), and qualitative analysis of the anatomical distribution of subtype marker genes from the Allen Brain Atlas data set (column 7). As in Figure 8, B7 and B6 here refer to the original Dahlström and Fuxe nomenclature for describing distinct anatomical clusters of 5-HT neurons, and the asterisk after B6 is to indicate that some authors only consider B6 to encompass the dorsal part of what we refer to as the caudal DR. † after ‘Npy2r-cre; Pet1-Flpe rDR scRNAseq and histology’ in row six is to indicate that, while Npy2r-cre; Pet1-Flpe histology shows EGFP positive cell bodies in both dorsal and ventral aspects of the rDR, the scRNAseq data, combined with other evidence given, suggest a more dorsal bias for cluster six DR Pet1 neurons. †† after ‘Slc6a4-cre; Pet1-Flpe vmDR’ in row 11 is to indicate that, while manually sorted Slc6a4-cre; Pet1-Flpe vmDR scRNAseq libraries did not map to cluster 11 overall, cluster 11 neurons nonetheless express several marker genes enriched in the vmDR, which together with other evidence given in the table suggests a vmDR bias.
- https://cdn.elifesciences.org/articles/55523/elife-55523-fig8-data1-v1.docx
Tables
Key resources table
| Reagent type (species) or resource | Designation | Source or reference | Identifiers | Additional information |
|---|---|---|---|---|
| Strain, strain background (Mus musculus) | C57BL/6J | The Jackson Laboratory | RRID:IMSR_JAX:000664 | |
| Genetic reagent (Mus musculus) | Tg(Fev-flpe)1Dym Referred to as Pet1-Flpe | PMID:18344997 | RRID:MGI:5004974 | |
| Genetic reagent (Mus musculus) | En1tm2(cre)Wrst Referred to as En1-cre | PMID:10837030 | RRID:IMSR_JAX:007916 | |
| Genetic reagent (Mus musculus) | Tg(Slc6a4-cre)ET33Gsat Referred to as Slc6a4-cre | PMID:17855595 | RRID:MGI:3836639 | |
| Genetic reagent (Mus musculus) | Npy2rtm1.1(cre)Lbrl Referred to as Npy2r-cre | PMID:25892222 | RRID:IMSR_JAX:029285 | Lab of Steve Liberles |
| Genetic reagent (Mus musculus) | P2ry1tm1.1(cre)Lbrl Referred to as P2ry1-cre | PMID:25892222 | RRID:IMSR_JAX:029284 | Lab of Steve Liberles |
| Genetic reagent (Mus musculus) | Tg(Crh-cre)KN282Gsat/Mmucd Referred to as Crh-cre | RRID:MMRRC_030850-UCD | ||
| Genetic reagent (Mus musculus) | Gad2tm2(cre)Zjh Referred to as Gad2-cre | PMID:21943598 | RRID:IMSR_JAX:028867 | |
| Genetic reagent (Mus musculus) | Slc17a8tm1.1(cre)Hz Referred to asSlc17a8- cre | MGI: J:146821 | RRID:IMSR_JAX:028534 | |
| Genetic reagent (Mus musculus) | Gt(ROSA)26Sortm8(CAG-mCherry,-EGFP)Dym Referred to as RC-FrePe | PMID:22151329 | RRID:IMSR_JAX:029486 | |
| Genetic reagent (Mus musculus) | Gt(ROSA)26Sortm65.1(CAG-tdTomato)Hze Referred to as RC-Ai65 | PMID:25741722 | RRID:IMSR_JAX:021875 | |
| Genetic reagent (Mus musculus) | GT(ROSA)26Sortm3.2(Cag-EGFP,CHRM3*/mCherry/Htr2a)Pjen Referred to as RC-FL-hM3Dq | PMID:27264177 | RRID:IMSR_JAX:026942 | |
| Recombinant DNA reagent | pENN.AAV.hSyn.Cre.WPRE.hGH (AAVrg Viral prep) | Addgene | Cat# 10553-AAVrg RRID:Addgene_105553 | |
| Antibody | anti-GFP (chicken polyclonal) | Aves Labs | Aves Labs Cat# GFP-1020, RRID:AB_10000240 | IHC (1:3000) |
| Antibody | anti-DsRed (rabbit polyclonal) | Takara Bio | Takara Bio Cat# 632496, RRID:AB_10013483 | IHC (1:1000) |
| Antibody | anti-PAX5 (goat polyclonal) | Santa Cruz | Santa Cruz Biotechnology Cat# sc-1974, RRID:AB_2159678 | IHC (1:1000) |
| Antibody | anti-SATB2 (guinea pig polyclonal) | Synaptic Systems | Synaptic Systems Cat# 327 004, RRID:AB_2620070 | IHC (1:1000) |
| Antibody | anti-COUP-TFII (anti-NR2F2, mouse monoclonal) | Perseus Proteomics | Perseus Proteomics Cat# PP-H7147-00, RRID:AB_2314222 | IHC (1:1000) |
| Antibody | anti-VGLUT3 (guinea pig polyclonal) | Synaptic Systems | Synaptic Systems Cat# 135 204, RRID:AB_2619825 | IHC (1:500) |
| Antibody | anti-RFP (rat monoclonal) | Chromotek | ChromoTek Cat# 5f8-100, RRID:AB_2336064 | IHC (1:500) |
| Antibody | anti-DCX (goat polyclonal) | Santa Cruz | Santa Cruz Biotechnology Cat# sc-8066, RRID:AB_2088494 | IHC (1:1000) |
| Antibody | anti-Ki67 (rat monoclonal) | Thermo Fisher Scientific | Thermo Fisher Scientific Cat# 14-5698-80, RRID:AB_10853185 | IHC (1:1000) |
| Antibody | anti-TPH2 (rabbit polyclonal) | Novus Biologicals | Novus Cat# NB100-74555, RRID:AB_1049988 | IHC (1:1000) |
| Antibody | Alexa Fluor 488 (donkey anti-chicken) | Jackson | Jackson ImmunoResearch Labs Cat# 703-545-155, RRID:AB_2340375 | IHC (1:500) |
| Antibody | Alexa Fluor 546 (donkey anti-rabbit) | Thermo Fisher Scientific | Thermo Fisher Scientific Cat# A10040, RRID:AB_2534016 | IHC (1:500) |
| Antibody | Alexa Fluor 647 (donkey anti-goat) | Thermo Fisher Scientific | Thermo Fisher Scientific Cat# A-21447, RRID:AB_2535864 | IHC (1:500) |
| Antibody | Alexa Fluor 647 (donkey anti-mouse) | Jackson | Jackson ImmunoResearch Labs Cat# 715-605-151, RRID:AB_2340863 | IHC (1:500) |
| Antibody | Alexa Fluor 647 (donkey anti-rabbit) | ThermoFisher Scientific | Thermo Fisher Scientific Cat# A-31573, RRID:AB_2536183 | IHC (1:500) |
| Antibody | Cy5 (donkey anti-guinea pig) | Jackson | Jackson ImmunoResearch Labs Cat# 706-175-148, RRID:AB_2340462 | IHC (1:500) |
| Commercial assay or kit | Tph2-C2 probe | ACDBio | ACDBio:318691-C2 | |
| Commercial assay or kit | Chromium Single Cell v3 Reagent Kits | 10X Genomics | 10X Genomics:1000092/1000074 | |
| Commercial assay or kit | SMARTseq V4 Ultra Low Input RNA Kit | Takara Bio | Takara Bio:634890 | |
| Commercial assay or kit | Nextera XT DNA Library Preparation Kit | Illumina | Illumina: FC-131–1024 | |
| Commercial assay or kit | RNAscope Fluorescent Multiplex Reagent Kit | ACDBio | ACDBio:320850 | |
| Software, algorithm | R (Version 3.5.3, 3.6.3) | R Project for Statistical Computing | R Project for Statistical Computing, RRID:SCR_001905 | https://cran.r-project.org/ |
| Software, algorithm | Seurat (Versions 3.0.2, 3.1.1, 3.1.4) | PMID:29608179 | Seurat, RRID:SCR_016341 | https://satijalab.org/seurat/ |
| Software, algorithm | Fiji (Version 2.0.0-rc-69/1.52 p) | PMID:22743772 | Fiji, RRID:SCR_002285 | https://imagej.net/Fiji |
Additional files
-
Supplementary file 1
The ‘all_subgroup_markers’ worksheet displays the output of the Seurat FindAllMarkers function.
Column one is the gene symbol, column two is the p-value given by the Wilcoxon Rank Sum test, column three is the average ‘log fold change’ (i.e. log-fold difference in transcript abundance between the in-group and out-group), where a positive value indicates that a gene is expressed at a higher level in a given cluster relative to all other clusters, and a negative value indicates that a gene is expressed at a lower level. Column four is the percent of cells within a particular cluster in which the gene was detected, column five is the percent of cells within all other clusters in which a gene was detected, column six gives the Bonferroni-corrected p-value, and column seven indicates the cluster in which the given gene is a positive or negative marker. Note, not all enriched genes are unique to only one cluster, as more similar clusters will share subsets of enriched genes. The ‘sig_var_genes’ worksheet lists the top two thousand highest ‘standardized variance’ genes, that is genes that vary significantly more than expected based on mean expression.
- https://cdn.elifesciences.org/articles/55523/elife-55523-supp1-v1.xlsx
-
Transparent reporting form
- https://cdn.elifesciences.org/articles/55523/elife-55523-transrepform-v1.pdf
Download links
A two-part list of links to download the article, or parts of the article, in various formats.
Downloads (link to download the article as PDF)
Open citations (links to open the citations from this article in various online reference manager services)
Cite this article (links to download the citations from this article in formats compatible with various reference manager tools)
A single-cell transcriptomic and anatomic atlas of mouse dorsal raphe Pet1 neurons
eLife 9:e55523.
https://doi.org/10.7554/eLife.55523


