Delineating the early transcriptional specification of the mammalian trachea and esophagus
- Program in Craniofacial Biology, University of California San Francisco, United States
- Department of Cell and Tissue Biology, University of California San Francisco, United States
- Institute for Human Genetics, University of California San Francisco, United States
- Eli and Edythe Broad Center of Regeneration Medicine and Stem Cell Research, University of California San Francisco, United States
- Developmental and Stem Cell Biology Graduate Program, University of California San Francisco, United States
- Department of Biology, San Francisco State University, United States
- MRC London Institute of Medical Sciences (LMS), United Kingdom
- Institute of Clinical Sciences (ICS), Faculty of Medicine, Imperial College London, United Kingdom
Figures
Figure 1 with 5 supplements
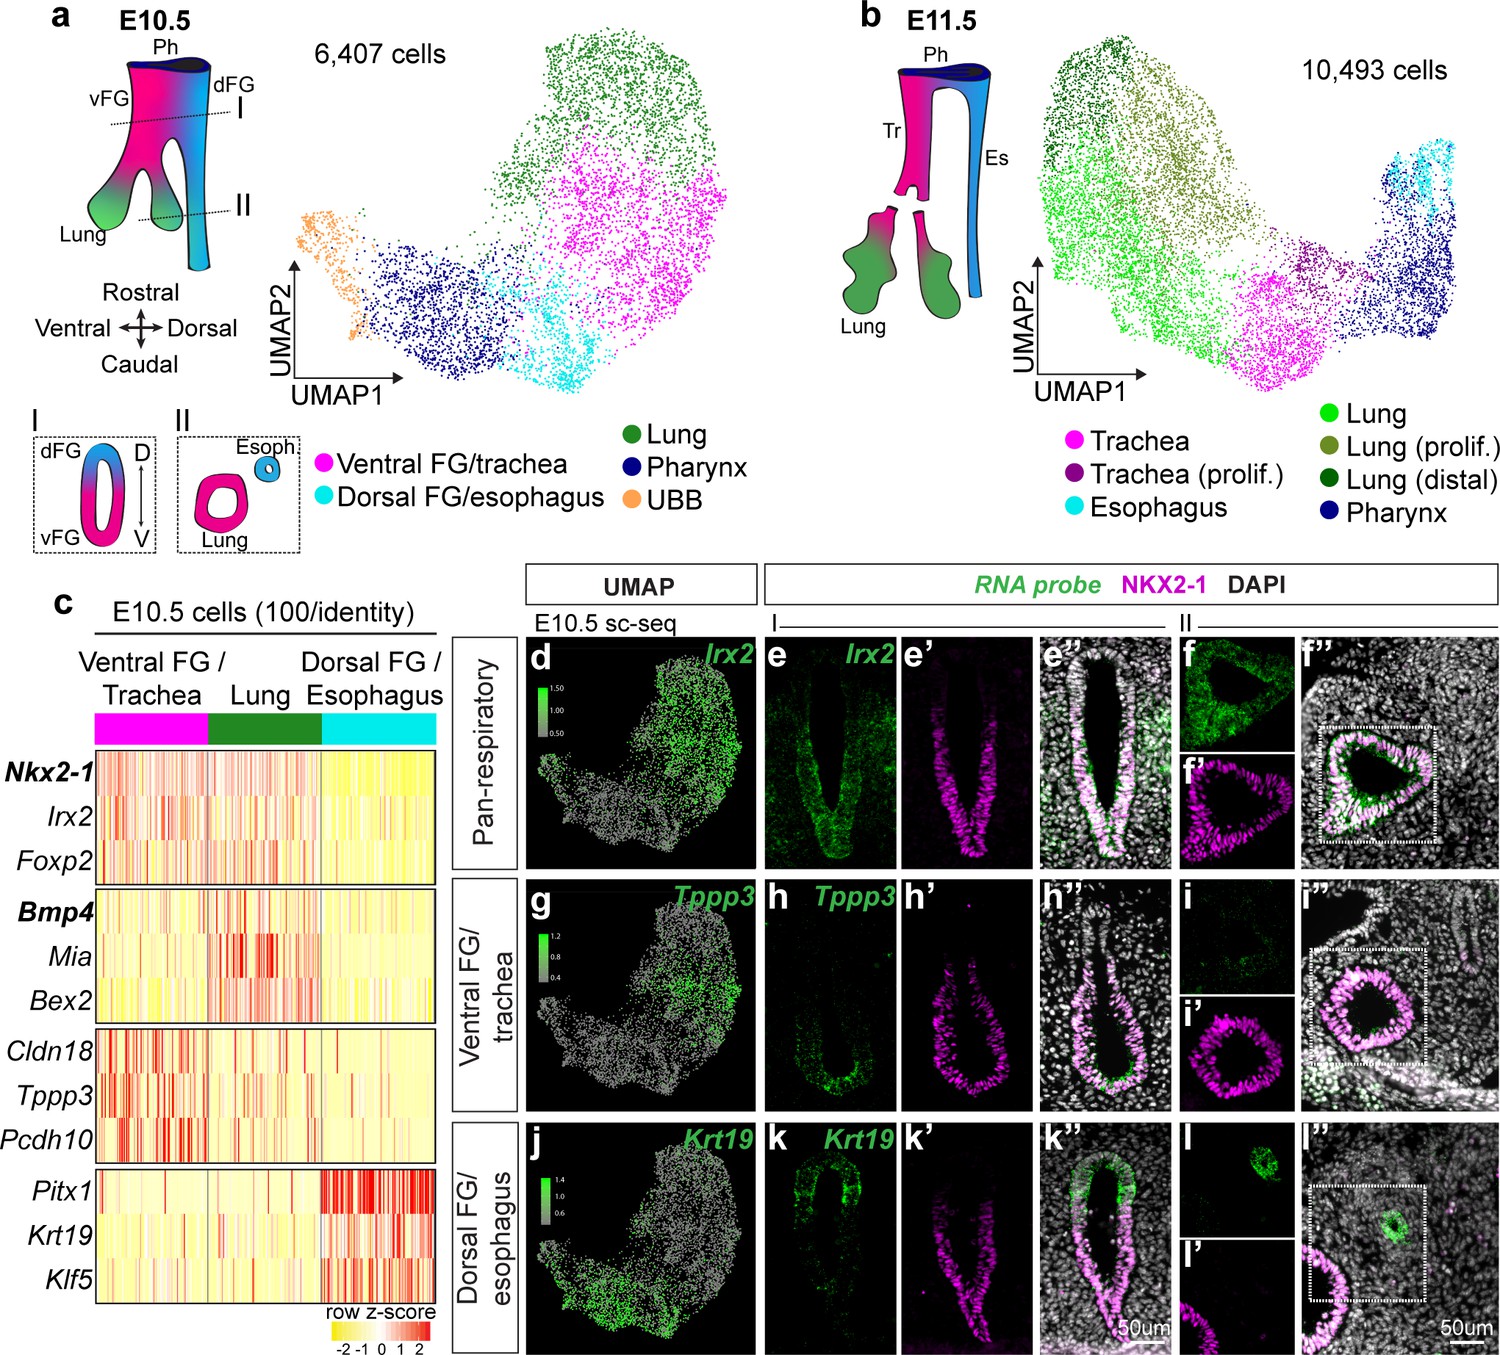
Single-cell transcriptomics of the developing foregut epithelium identifies distinct dorsoventral populations.
Dissected, FACS-purified foregut epithelial cells were subjected to droplet-based single-cell RNA sequencing at E10.5 and E11.5. (a) UMAP representation of 6,407 cells identified at E10.5 and (b) 10,493 cells identified at E11.5. Colors represent cell populations identified using shared nearest neighbor clustering. vFG: ventral foregut, dFG: dorsal foregut, Ph: pharynx, UBB: ultimobranchial body, Tr: trachea, Es: esophagus. (c) Heatmap of selected marker gene expression across 100 E10.5 cells each of ventral foregut/trachea, lung, and esophagus/dorsal foregut as identified by scRNA-seq. Selected genes are markers of respiratory, lung, ventral FG/trachea, and dorsal FG/esophagus cells (top to bottom). n = 1 biological replicate/timepoint with 20 pooled embryos at E10.5 and 28 pooled embryos at E11.5. See also: Figure 1—source data 1. (d-l) RNA localization of pan-respiratory marker gene Irx2, ventral FG/trachea marker gene Tppp3, and dorsal FG/esophagus marker gene Krt19 identified from differential expression analysis of cell populations in scRNA-seq data at E10.5. First column shows projection of RNA expression level as determined by scRNA-seq on UMAP. Second-fourth columns show RNA expression of marker gene (green) and NKX2-1 expression (magenta) in the undivided region of E10.5 embryonic foreguts (I) as indicated by the positions of the schematic in a). Last two columns show staining in the lung and distal esophagus (II) as indicated by the positions of the schematic in a). All images were captured at 20X magnification and displayed at the same scale. Scale bar = 50 um.
-
Figure 1—source data 1
Top 20 markers of foregut cell populations identified by scRNA-seq of E10.5 and E11.5 foreguts.
- https://cdn.elifesciences.org/articles/55526/elife-55526-fig1-data1-v1.xlsx
Figure 1—figure supplement 1

Quality control metrics and characterization of single-cell RNA sequencing experiments.
(a) Representative gating strategy for FACS of mouse embryonic foreguts. Top row shows gating for single cells, and bottom row shows gating for sytox-negative live cells (left) and epCAM-positive epithelial cells (right). (b) Quality control metrics of scRNA-seq experiments identified with CellRanger. (c–d) Immunofluorescent staining of NKX2-1 (magenta), SOX2 (cyan), and SOX9 (green) in c) E10.5 and d) E11.5 foregut and lung. First column shows UMAP of gene expression level of Nkx2-1, Sox2, and Sox9 as detected by scRNA-seq. Second and third columns represent regions of the foregut along the rostral-caudal axis as depicted in the schematic of Figure 1a and b). Scale bar = 50 um.
Figure 1—figure supplement 2
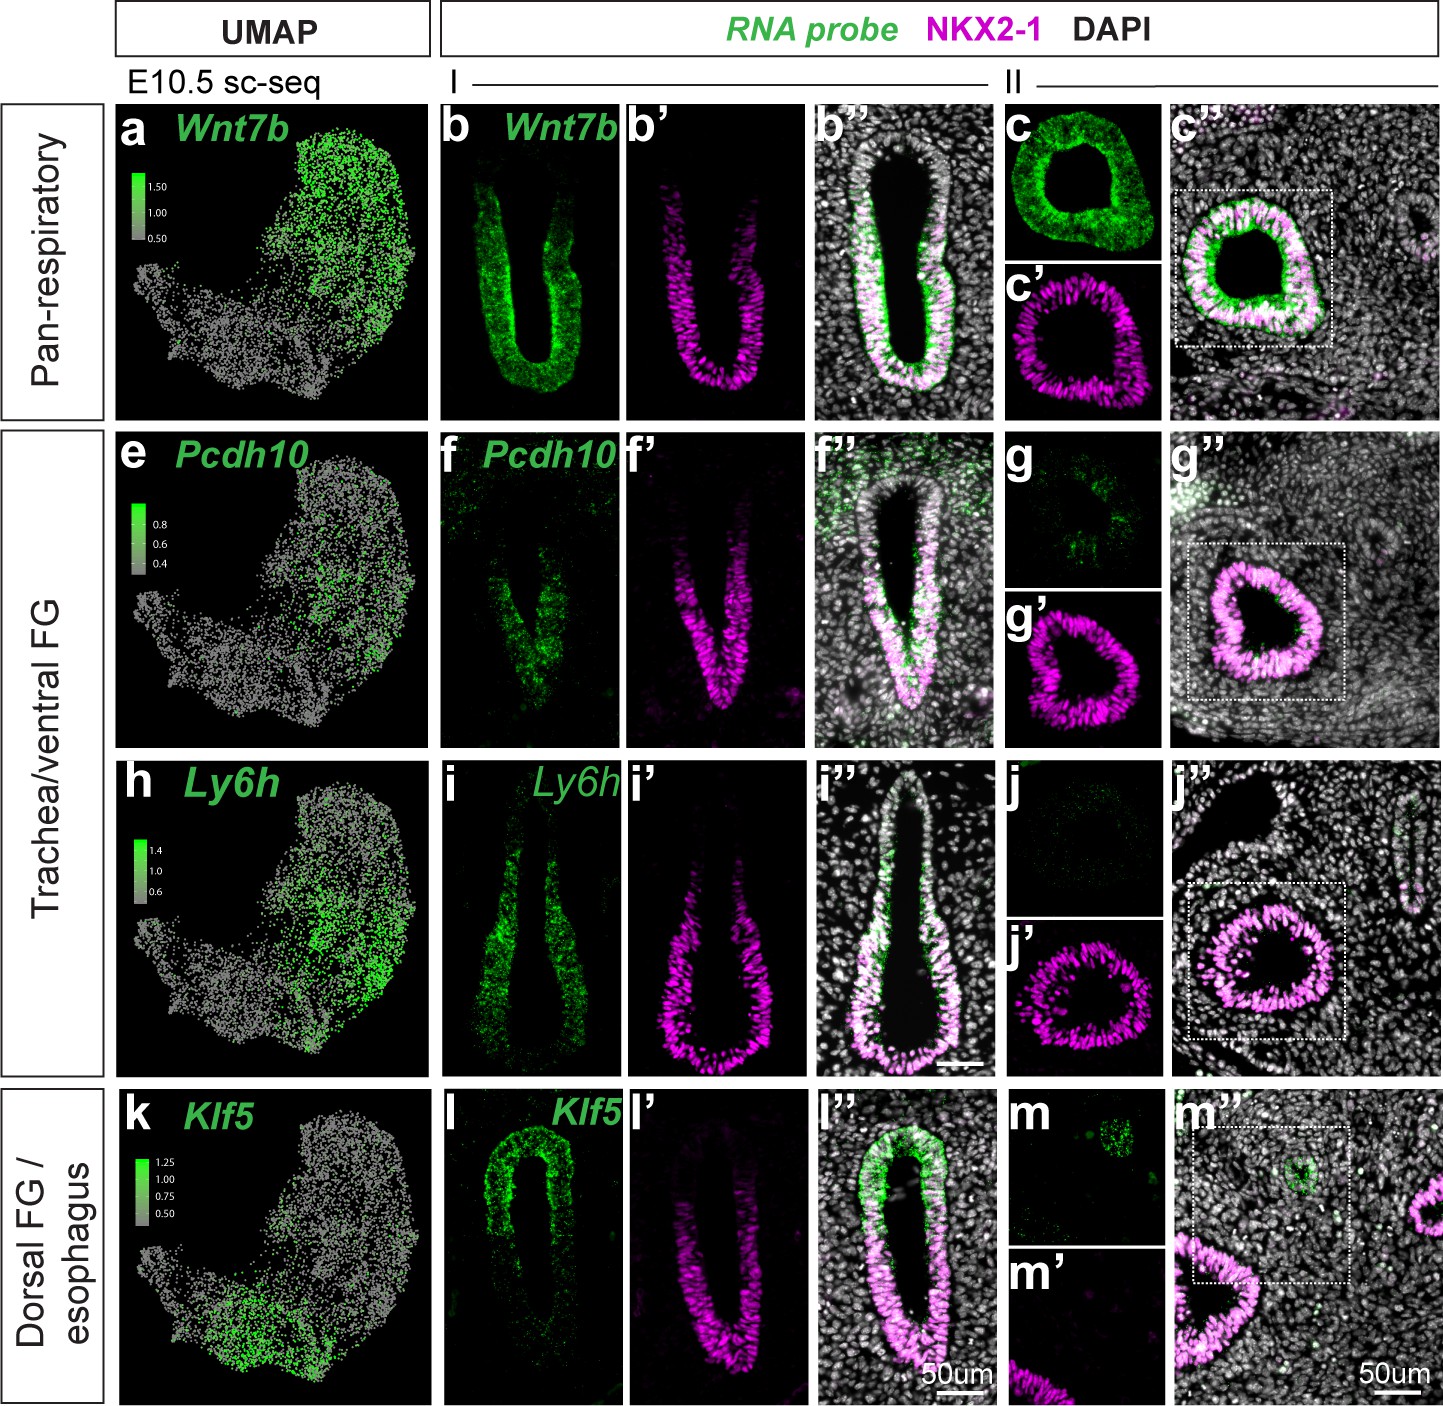
Additional cell type-specific markers of dorsoventral populations identified by scRNA-seq at E10.5.
(a-m) RNA localization of additional marker genes Wnt7b, Pcdh10, Ly6h, and Klf5 identified from differential expression analysis of cell populations in scRNA-seq data at E10.5. First column shows projection of RNA expression level as determined by E10.5 scRNA-seq on UMAP. Second-fourth show staining of marker gene RNA expression (green) and NKX2-1 immunofluorescence (magenta) in the unseparated foregut at E10.5 (position I as indicated in schematic of Figure 1a). Last two columns show staining in the lung and distal esophagus (position II as indicated in schematic of Figure 1a). Scale bar = 50um.
Figure 1—figure supplement 3
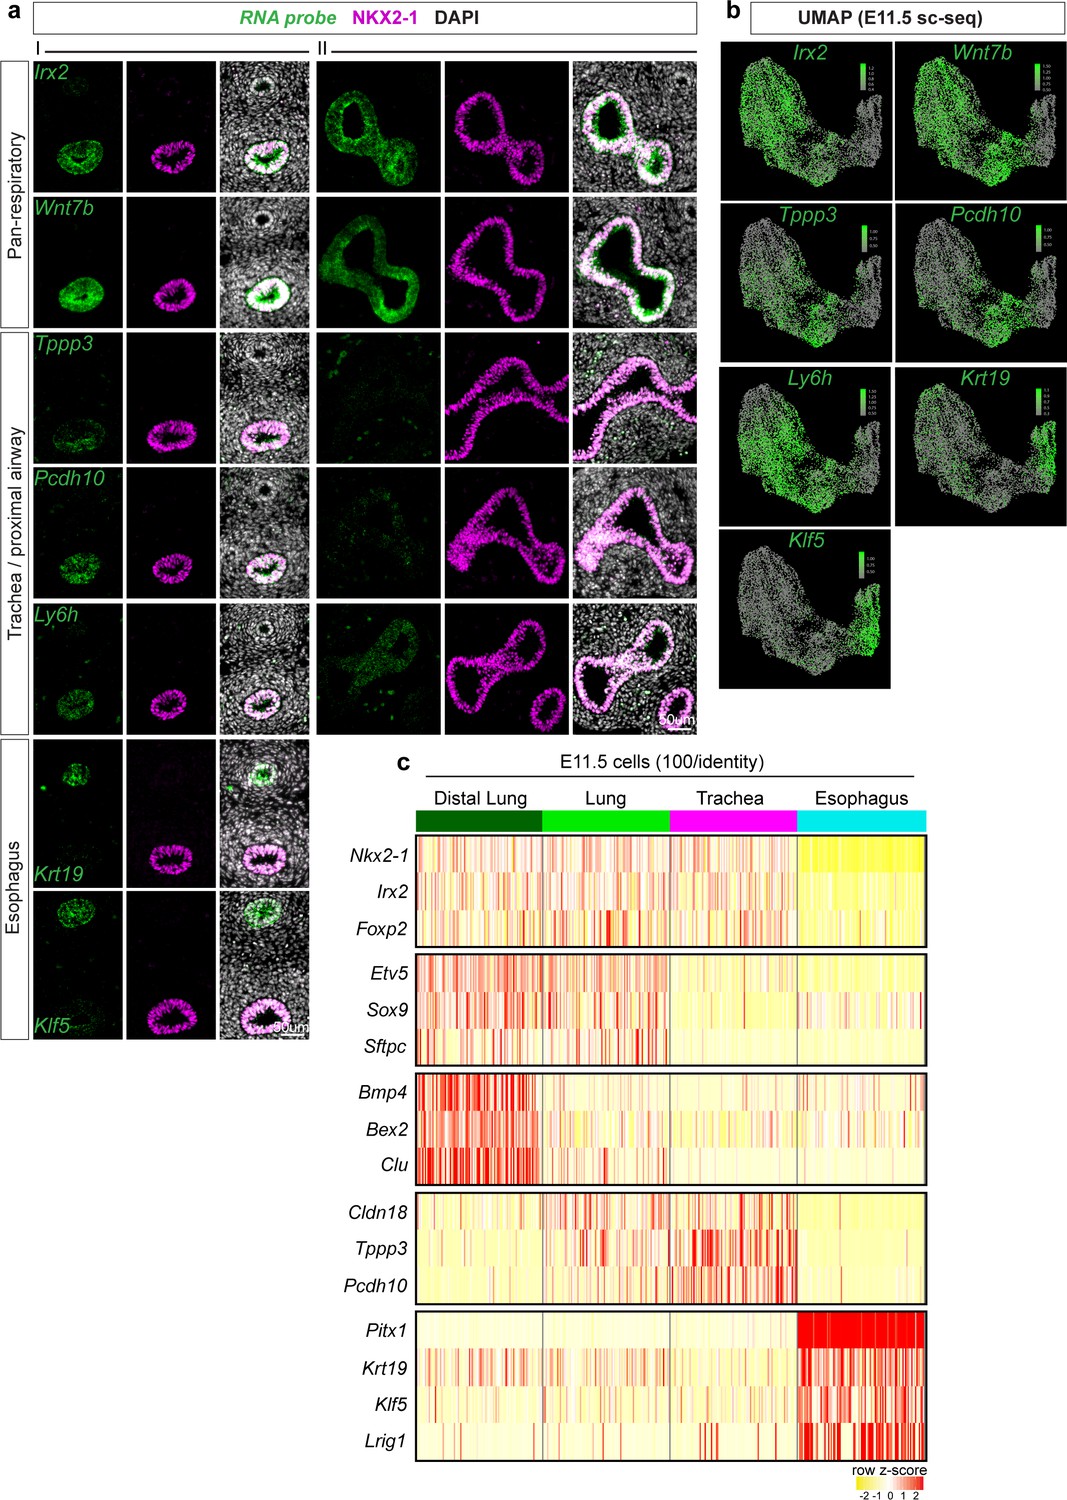
Cell type-specific markers of trachea, esophagus, and lung populations identified by scRNA-seq at E11.5.
(a) RNA localization of marker genes identified from differential expression analysis of cell populations in scRNA-seq data at E11.5 with immunofluorescent staining of NKX2-1. First three columns (I) show staining in the trachea and esophagus of an E11.5 embryonic foregut, and last three columns (II) show staining in the lung and distal esophagus. Scale bar = 50um. (b) Projection of RNA expression level as determined by E11.5 scRNA-seq on UMAP. c. Heatmap of selected marker gene expression across 100 E11.5 cells each of distal lung, lung, trachea, and esophagus as identified by scRNA-seq. Selected genes are markers of respiratory, lung, distal lung, trachea, and esophagus cells (top to bottom).
Figure 1—figure supplement 4
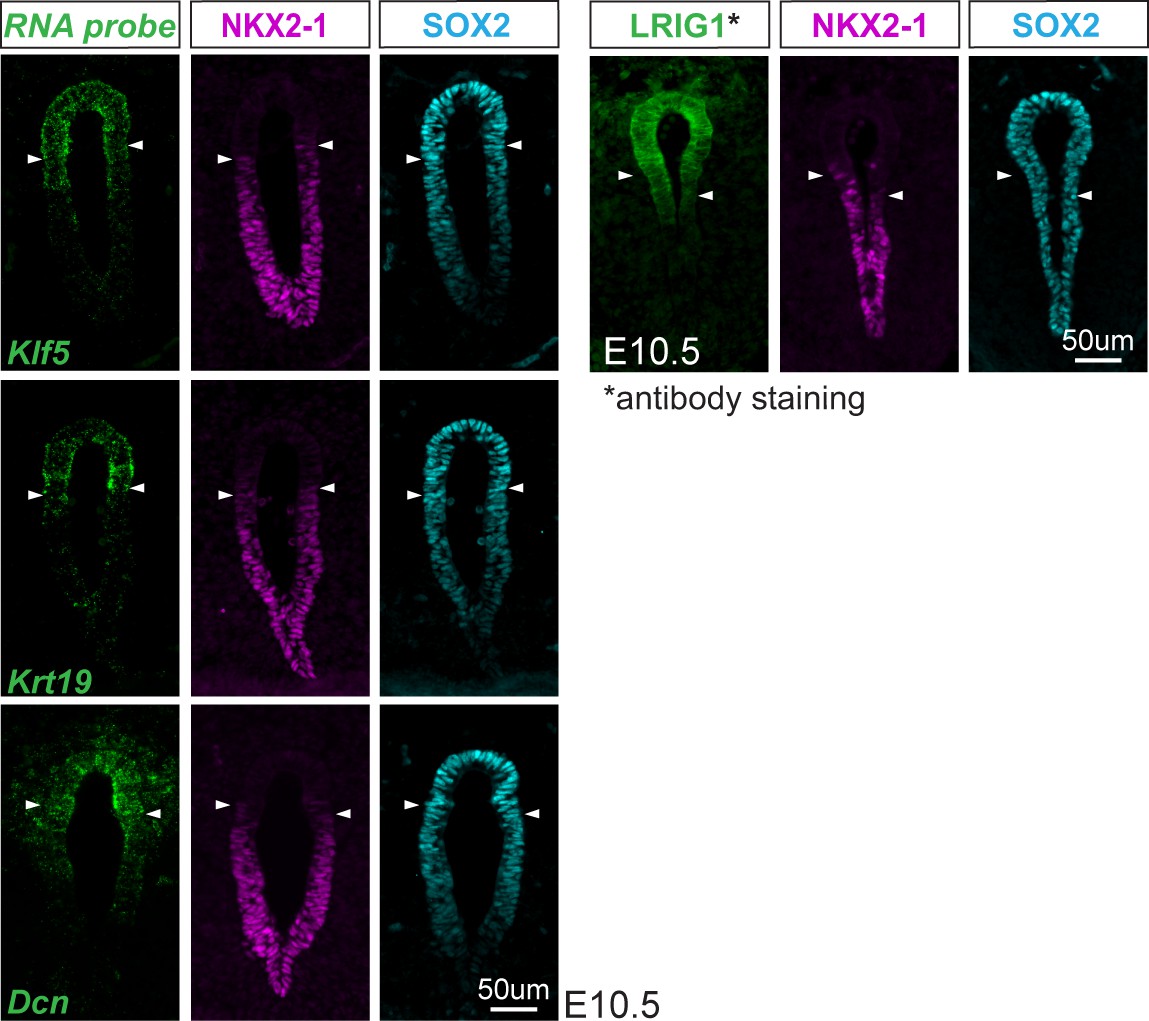
Newly identified esophageal marker genes are more dorsally restricted than SOX2.
RNA localization of esophageal markers genes Klf5, Krt19, and Dcn and protein localization of LRIG1 (green) with immunofluorescent staining of NKX2-1 (magenta) and SOX2 (cyan) in the unseparated foregut of E10.5 embryos. Arrowheads demarcate NKX2-1 expression boundary. Scale=50um.
Figure 1—figure supplement 5
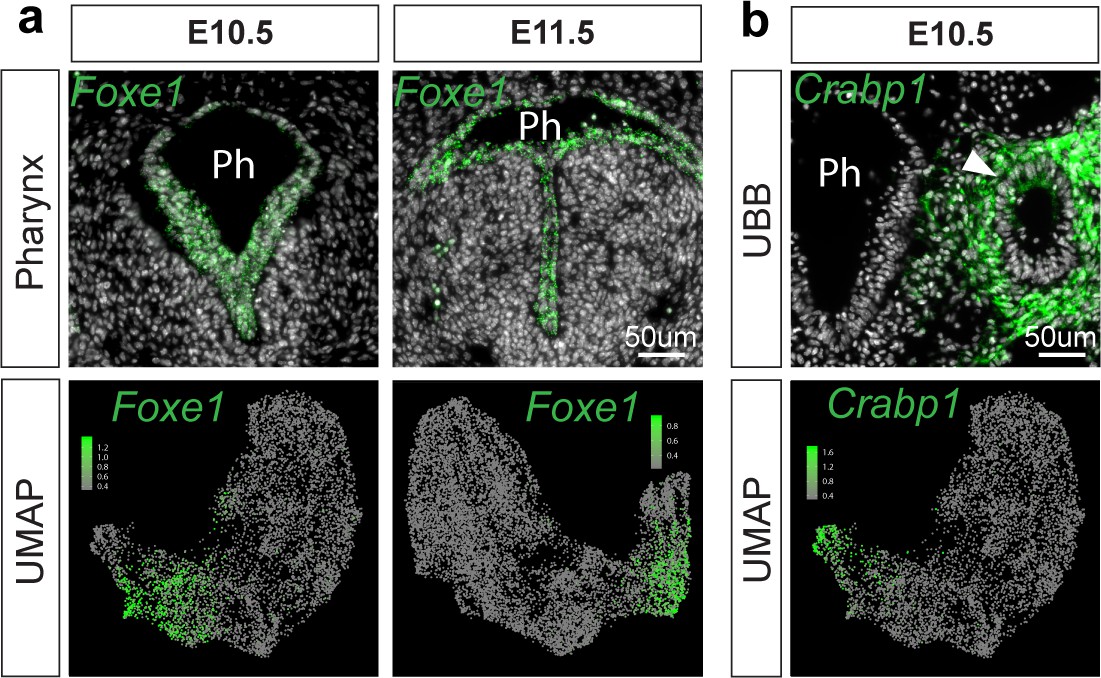
Validation of pharynx and UBB cluster identities.
(a) RNA localization of pharynx marker gene Foxe1 identified from differential expression analysis of cell populations in scRNA-seq data at E10.5 and E11.5. Top row: RNA-localization of Foxe1 (green) in E10.5 and E11.5 pharynx (Ph). Bottom row: Projection of Foxe1 RNA expression level as determined by E10.5 and E11.5 scRNA-seq on UMAP. (b) RNA localization of ultimobranchial body (UBB) marker gene Crabp1 identified from differential expression analysis of cell populations in scRNA-seq data at E10.5. Top row: RNA-localization of Crabp1 (green) in E10.5 UBB. Scale bar = 50um. Bottom row: Projection of Crabp1 RNA expression level as determined by E10.5 scRNA-seq on UMAP.
Figure 2 with 1 supplement
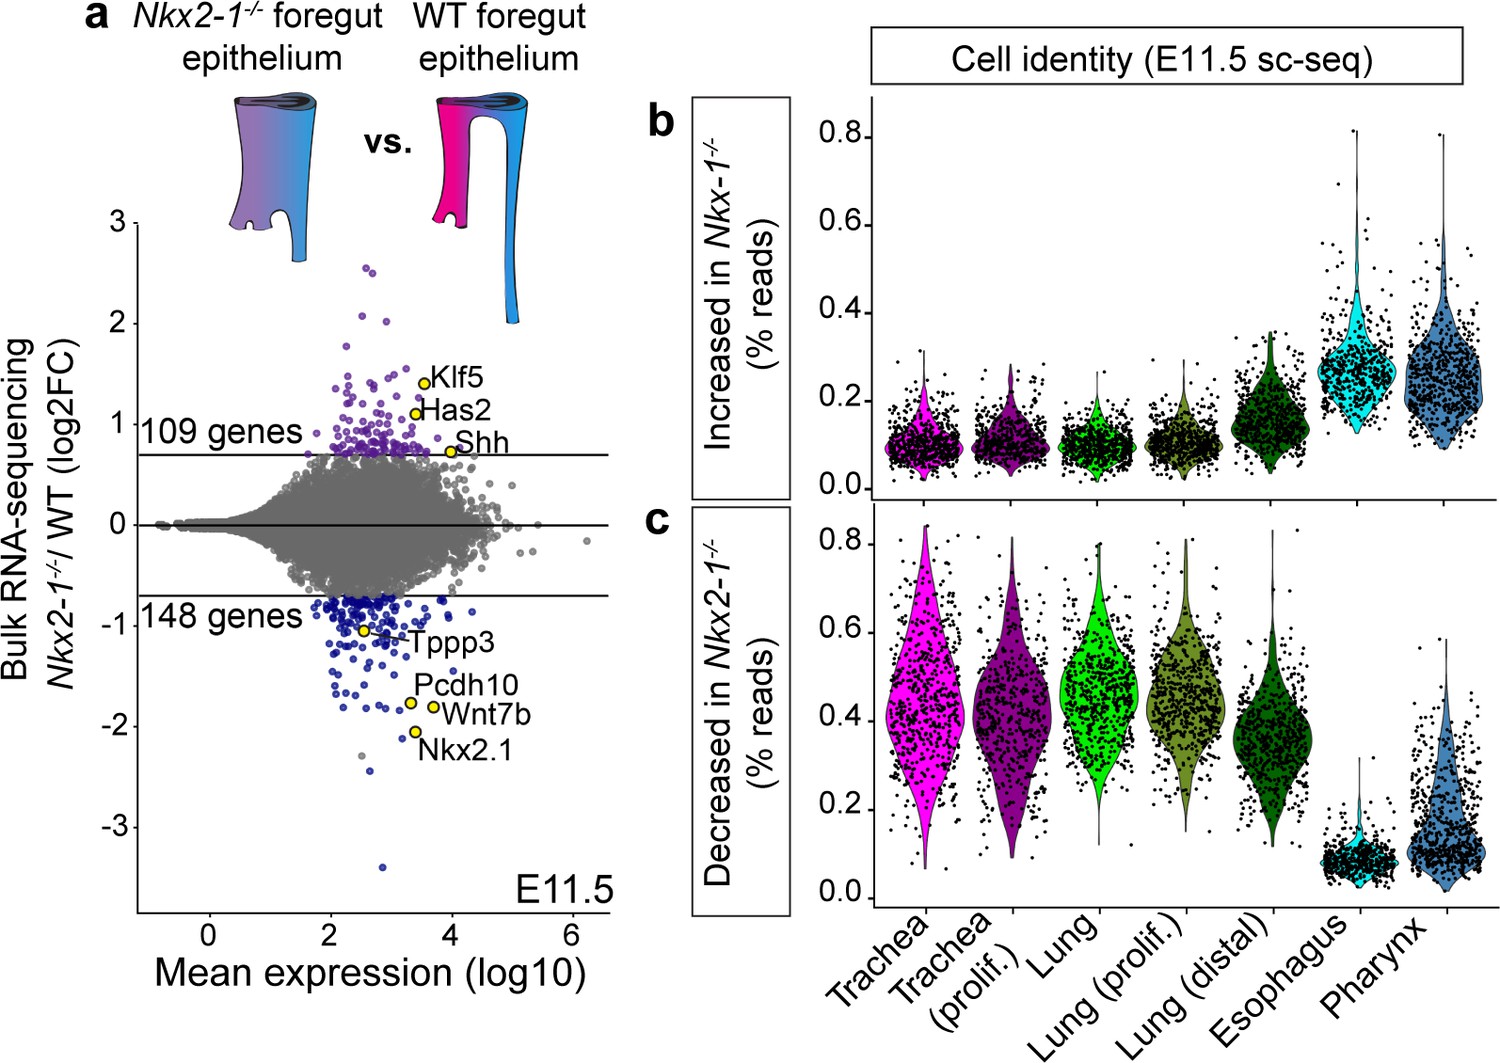
Transcriptomic analysis of Nkx2-1-/- foreguts reveals NKX2-1 regulated tracheal and esophageal transcriptional programs.
(a) Dissected, FACS-purified epithelium from E11.5 Nkx2-1-/- and WT foreguts was sequenced and analyzed for differential gene expression. 109 genes were increased and 148 genes were decreased in Nkx2-1-/- foreguts compared to WT (DESeq2, log2FC > 0.7, padj < 0.05). Labeled genes show examples of tracheal genes that decrease in Nkx2-1-/- mutants (Tppp3, Pcdh10, Wnt7b, Nkx2-1), and esophageal genes that increase in Nkx2-1-/- mutants (Klf5, Has2, Shh). n = 3 biological replicates with two pooled embryos/replicate. See also: Figure 2—source data 1. (b-c) Combined expression of all genes that increase (b) or decrease (c) in Nkx2-1-/- foreguts as a percentage of all reads in E11.5 scRNA-seq data. Cells are grouped by their assigned cluster and clusters were subsampled to 600 cells/cluster for visualization.
-
Figure 2—source data 1
Differentially expressed genes between E11.5 Nkx2-1-/- and WT foregut epithelium identified with bulk RNA-seq.
- https://cdn.elifesciences.org/articles/55526/elife-55526-fig2-data1-v1.xlsx
Figure 2—figure supplement 1
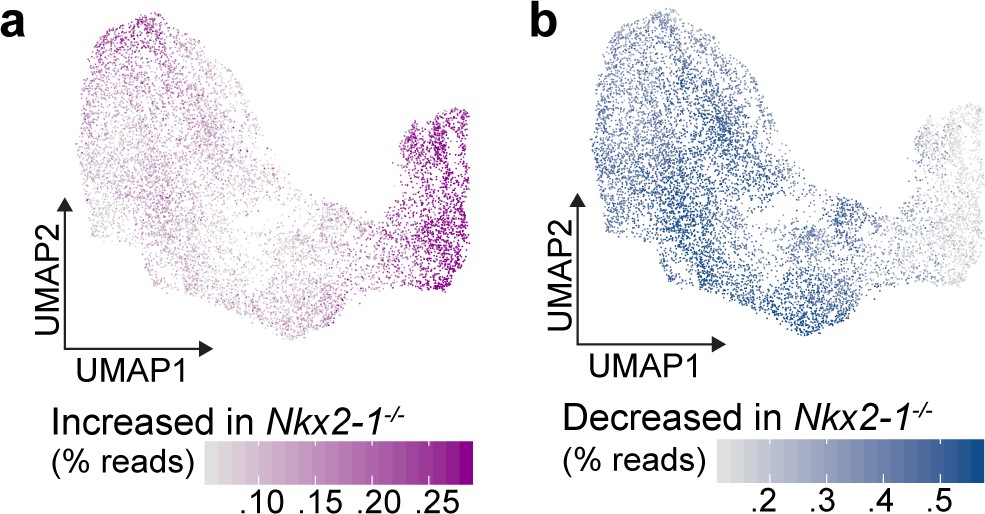
NKX2-1-dependent gene expression in E11.5 scRNA-seq.
(a-b) Combined expression of all genes that increase (a) or decrease (b) in Nkx2-1-/- foreguts as a percentage of all reads in E11.5 scRNA-seq data, projected onto the E11.5 UMAP.
Figure 3 with 1 supplement
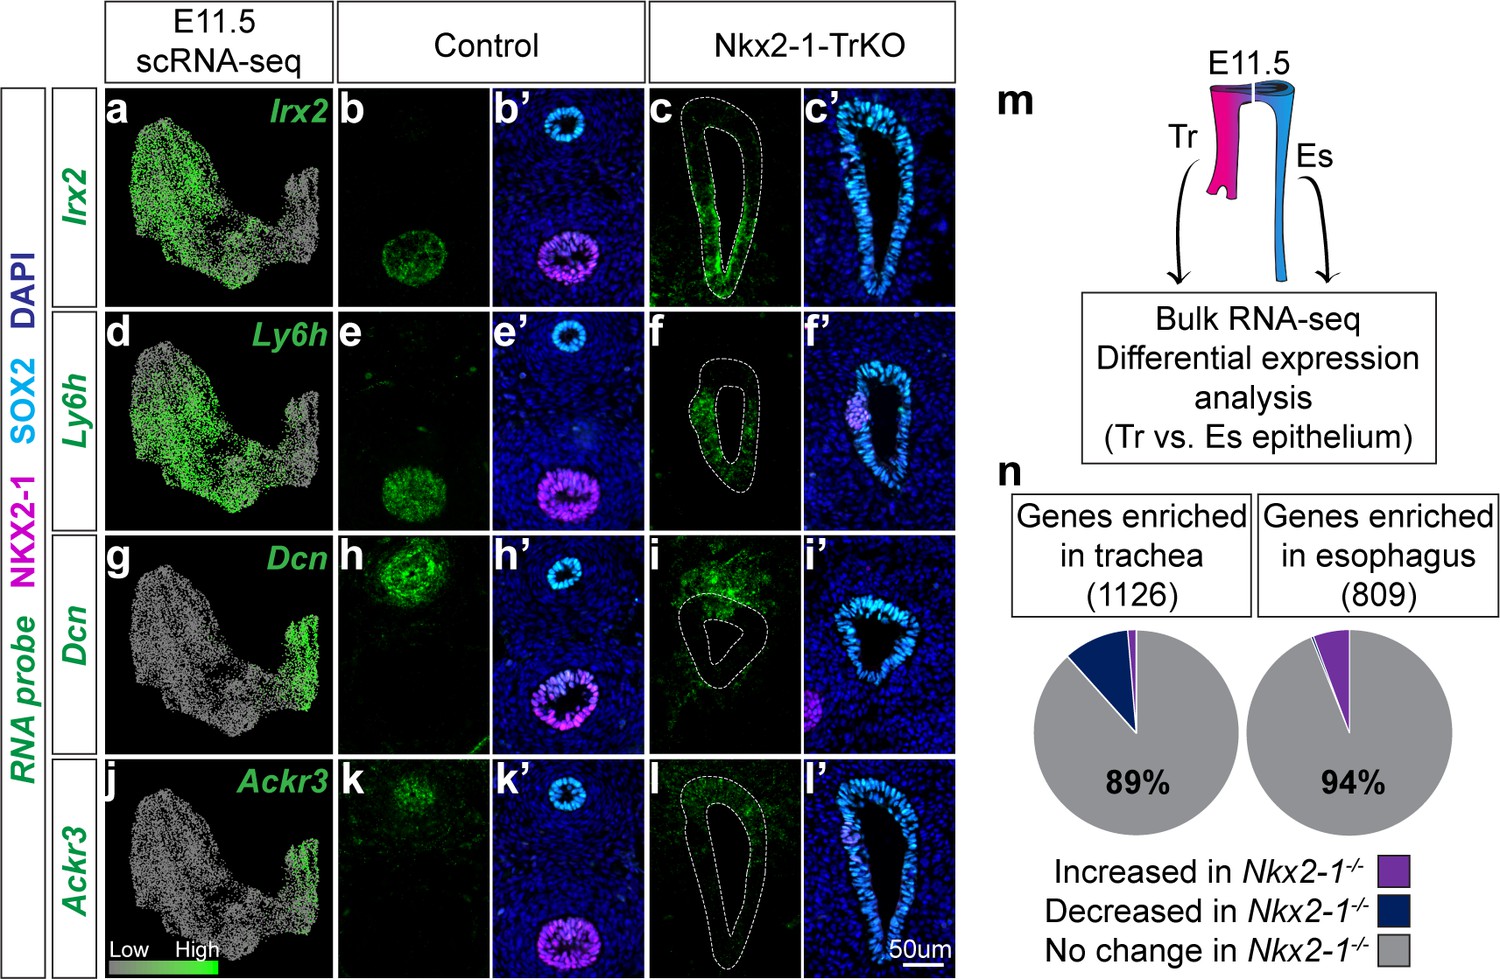
Identification of an NKX2-1-independent tracheal and esophageal program.
(a-l) RNA localization of NKX2-1-independent tracheal (Irx2, Ly6h) and esophageal (Dcn, Ackr3) makers identified by scRNA-seq and Nkx2-1-/- mutant RNA-seq data at E11.5. First column shows projection of RNA expression level as determined by scRNA-seq on UMAP. Second-fifth columns show RNA localization (green) in E11.5 control and Nkx2-1-TrKO embryos with immunofluorescent staining of NKX2-1 (magenta) and SOX2 (cyan). 8/8 Nkx2-1-TrKO embryos had TEF phenotype, n = 3 embryos/staining combination. All images were captured at 20X magnification and displayed at the same scale. Scale bar = 50 um. (m) Schematic of experimental procedures for RNA-seq and differential expression analysis of WT trachea and esophagus for comparison with Nkx2-1-/- mutant RNA-seq data. n = 3 biological replicates with four pooled embryos/replicate. See also: Figure 3—source data 1. (n). NKX2-1-dependent genes as a portion of genes enriched in WT trachea (left) and esophagus (right). NKX2-1-independent genes make up 89% of tracheal-enriched genes and 94% of esophageal enriched genes.
-
Figure 3—source data 1
Differentially expressed genes between E11.5 WT trachea and esophagus epithelium identified with bulk RNA-seq.
- https://cdn.elifesciences.org/articles/55526/elife-55526-fig3-data1-v1.xlsx
Figure 3—figure supplement 1
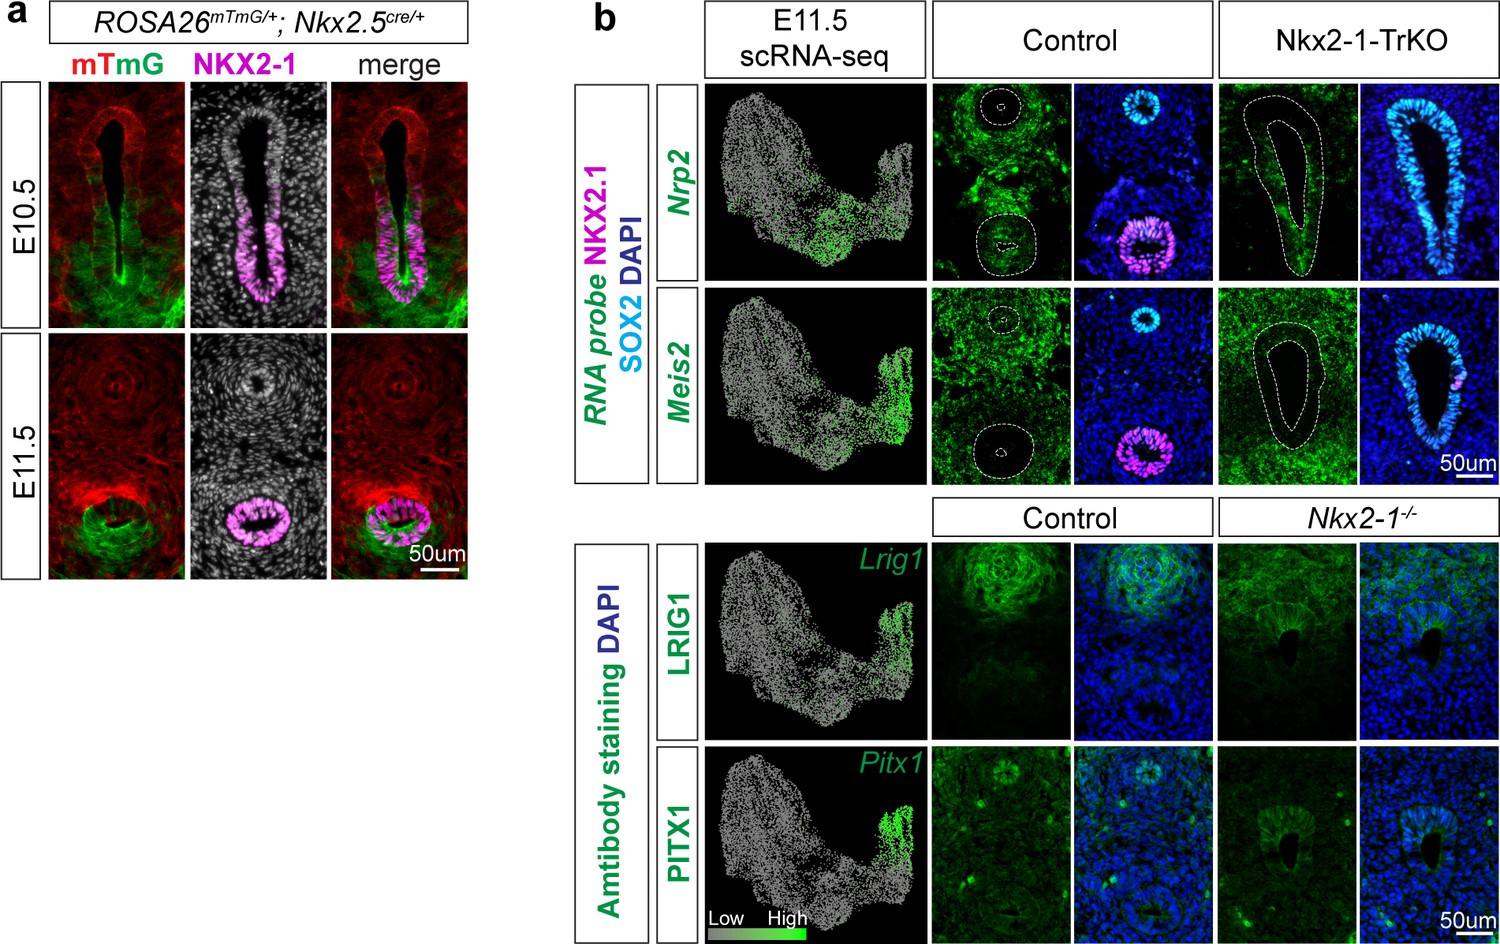
Nkx2.5-cre recombination, additional validation of NKX2-1-independent genes.
(a) Lineage trace of Nkx2.5-cre recombination pattern in E10.5 (top) and E11.5 (bottom) foreguts using the ROSA26mTmG reporter (red/green) and NKX2-1 immunofluorescent staining (magenta). (b) RNA localization (green) of additional NKX2-1-independent genes Nrp2 in the trachea (row 1) and Meis2 in the esophagus (row 2) of E11.5 scRNA-seq data (left), E11.5 control embryos (middle) and Nkx2-1-TrKO; Sox2-TrKO embryos (right) with immunofluorescent staining of NKX2-1 (magenta) and SOX2 (cyan). Bottom panel: Protein expression of NKX2-1-independent genes LRIG1 and PITX1 in E11.5 control and Nkx2-1-/- embryos. Scale bar = 50 um.
Figure 4
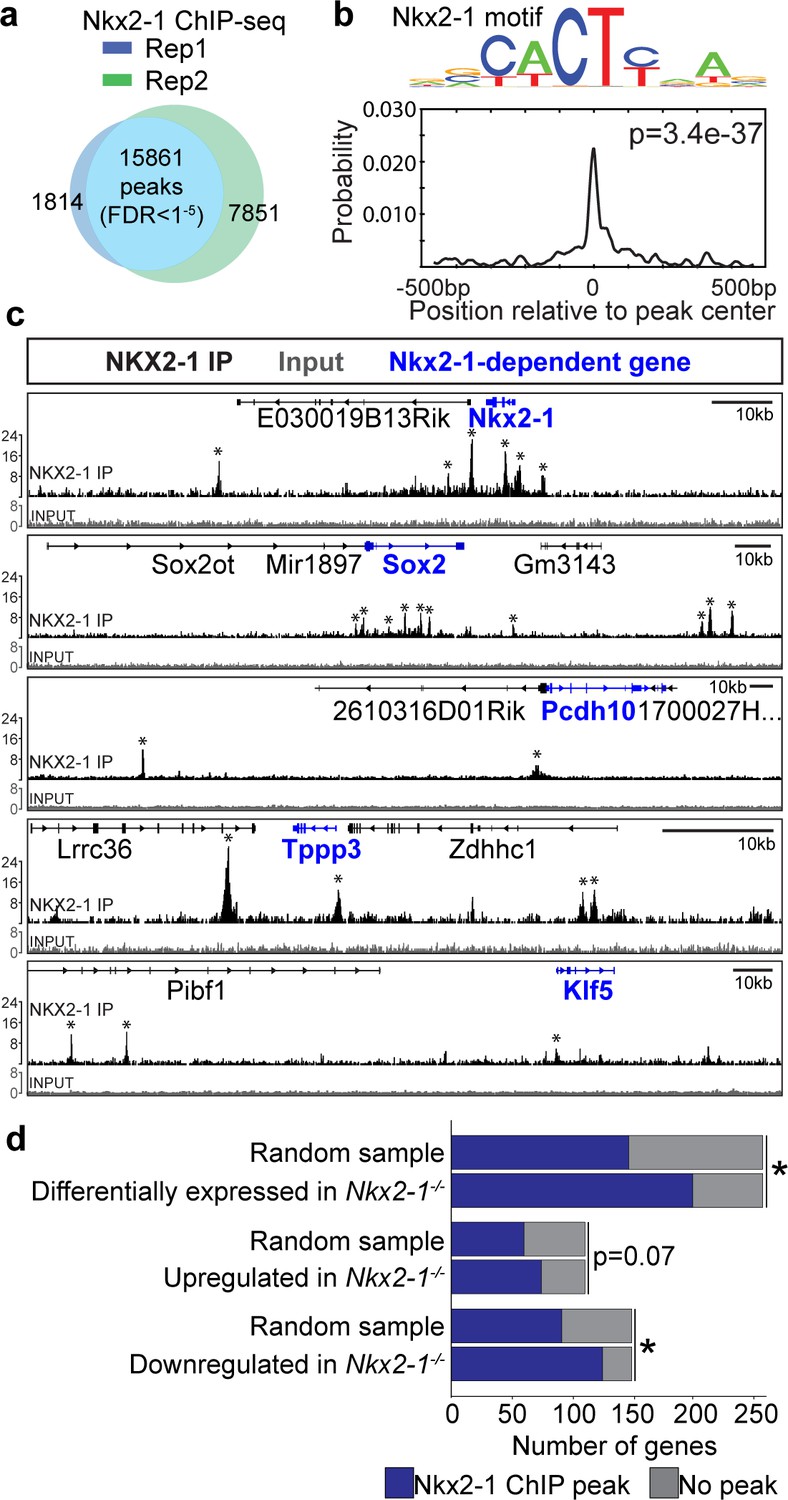
NKX2-1 binds directly to tracheoesophageal genes in the developing foregut.
(a) ChIP-seq for NKX2-1 in E11.5 foreguts identified 15,861 NKX2-1-bound genomic regions (peaks) shared between replicates (FDR < 0.00001). n = 2 biological replicates with 175 pooled embryos/replicate. (b) Motif analysis of NKX2-1 ChIP-seq data shows peaks are enriched for the NKX2-1 motif (p=3.4e-37). (c) NKX2-1 ChIP-seq (black) and input (grey) tracks near loci of select NKX2-1-dependent genes (blue) Nkx2-1, Sox2, Pcdh10, Tppp3, and Klf5 visualized in IGV. Input and NKX2-1 IP tracks are displayed at the same linear scale, as indicated by IGV Data Range on the y-axis. Horizontal scale bar = 10 kb. (d) Genome-wide comparison of NKX2-1 ChIP-seq with Nkx2-1-/- mutant RNA-seq. Overlap of NKX2-1 ChIP-seq associated genes with NKX2-1-dependent genes (top), genes increased in Nkx2-1-/- mutants (middle) and genes decreased in Nkx2-1-/- mutants (lower). *asterisk = p < 0.0001, Fisher’s exact test.
Figure 5
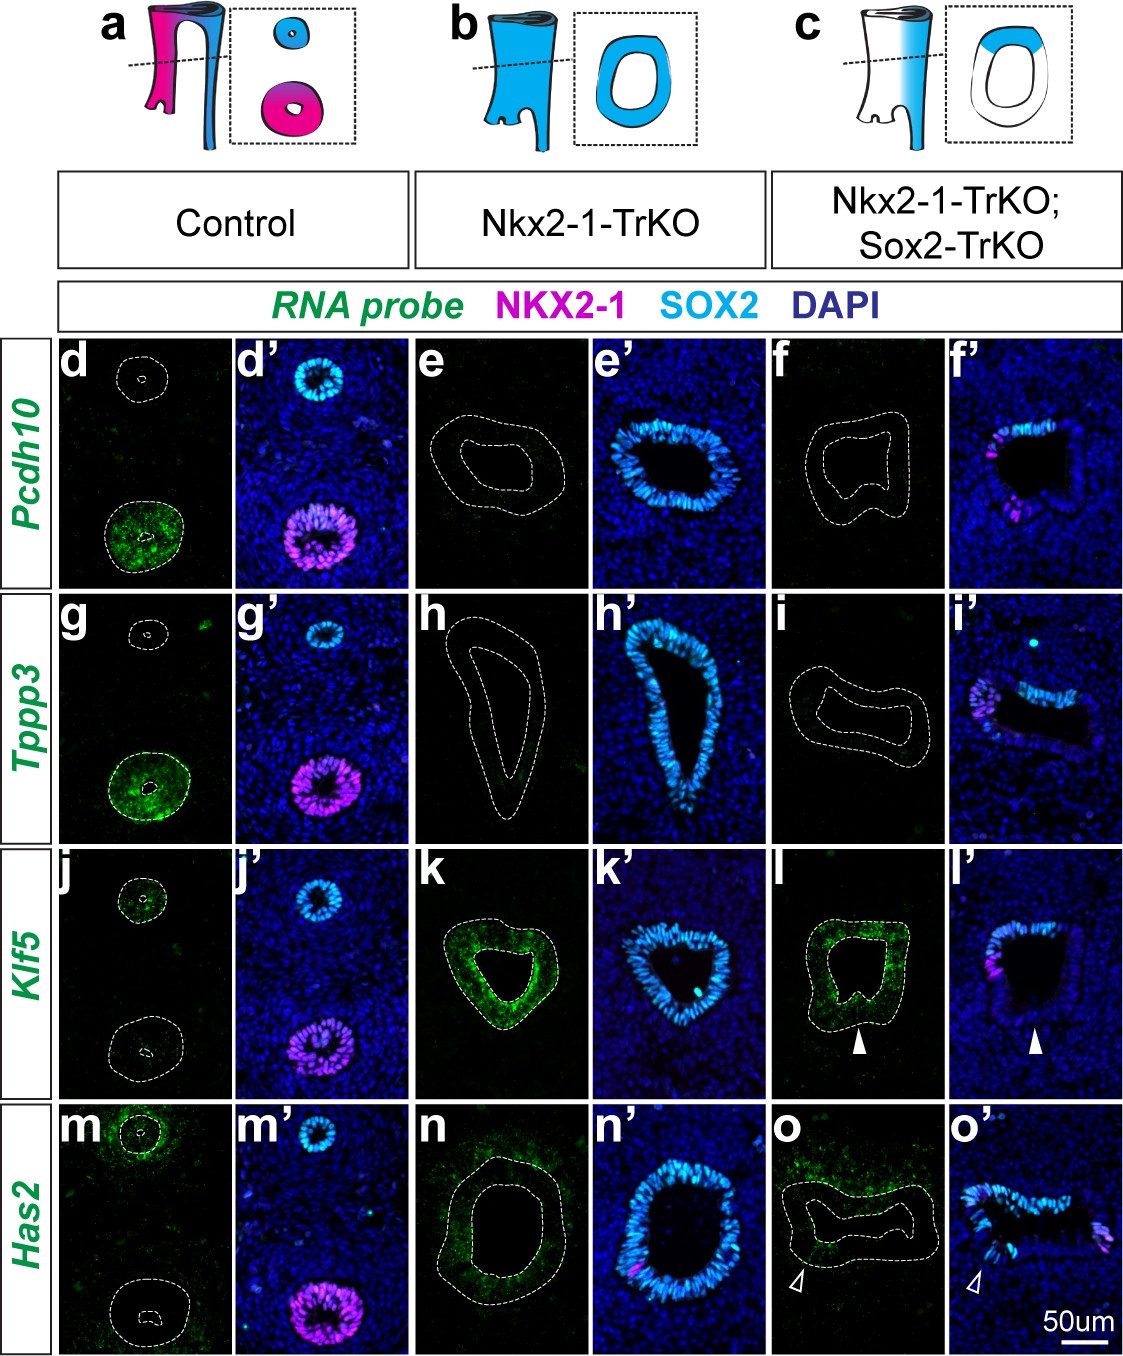
NKX2-1 regulates target genes in a SOX2-dependent and independent manner.
(a-c) Schematic of Nkx2-1; Sox2 compound mutant analysis phenotypes and resulting NKX2-1 and SOX2 expression patterns in E11.5 control embryos (a), Nkx2-1-TrKO mutants (b), Nkx2-1-TrKO; Sox2-TrKO mutants (c). 8/8 Nkx2-1-TrKO embryos and 6/6 Nkx2-1-TrKO; Sox2-TrKO embryos examined had TEF phenotype. (d-f) RNA localization of NKX2-1-dependent, SOX2-independent gene Pcdh10 in control (d), Nkx2-1-TrKO (e), and Nkx2-1-TrKO; Sox2-TrKO (f) embryos with immunofluorescent staining of NKX2-1 (magenta) and SOX2 (cyan). (g–i) Tracheal, NKX2-1-dependent, SOX2-independent gene Tppp3. (j–l) Esophageal, NKX2-1-dependent, SOX2-independent gene Klf5. Solid arrowheads indicate SOX2-negative, Klf5-positive ventral cell. (m–o) Esophageal, NKX2-1-dependent, SOX2-dependent gene Has2. Arrowheads indicate ventral SOX2-positive, Has2-positive cells. n = 3 embryos/staining combination. All images were captured at 20X magnification and displayed at the same scale. Scale = 50 um.
Figure 6 with 1 supplement

NKX2-1 regulates mesenchymal specification via Wnt7b and Shh-mediated epithelial-mesenchymal crosstalk.
(a) Alcian blue staining of tracheal cartilage in E18.5 control and Nkx2-1-/- embryos. 3/3 embryos examined exhibited similar cartilage phenotype. (b) ChIP-seq of direct NKX2-1 binding near Wnt7b and Shh loci. Input and NKX2-1 IP tracks are displayed at the same linear scale, as indicated by IGV Data Range on the y-axis. Horizontal scale bar = 10 kb. (c–h) RNA localization (green) of Wnt7b (c–e) and Shh (f–h) in control (left), Nkx2-1-TrKO (middle), and Nkx2-1-TrKO; Sox2-TrKO (right) E11.5 embryos with immunofluorescent staining of NKX2-1 (magenta) and SOX2 (cyan). (i–j) RNA localization of Wnt7b (red) and Axin2 (yellow) in WT and Nkx2-1-/- E13.5 foreguts. 3/3 embryos display phenotype. (k–l) SOX9 staining (green) of cartilage progenitors in WT and Nkx2-1-/- E13.5 foreguts. 3/3 embryos display phenotype. (m–n) RNA localization of Shh (red) and Ptch1 (yellow) in WT and Nkx2-1-/- E13.5 foreguts. 2/2 embryos display phenotype. (o–p) Smooth muscle actin (SMA) staining (cyan) of smooth muscle in WT and Nkx2-1-/- E13.5 foreguts. 3/3 embryos display phenotype. All images were captured at 20X magnification and images within each staining panel are at the same scale. Scale = 50 um.
Figure 6—figure supplement 1
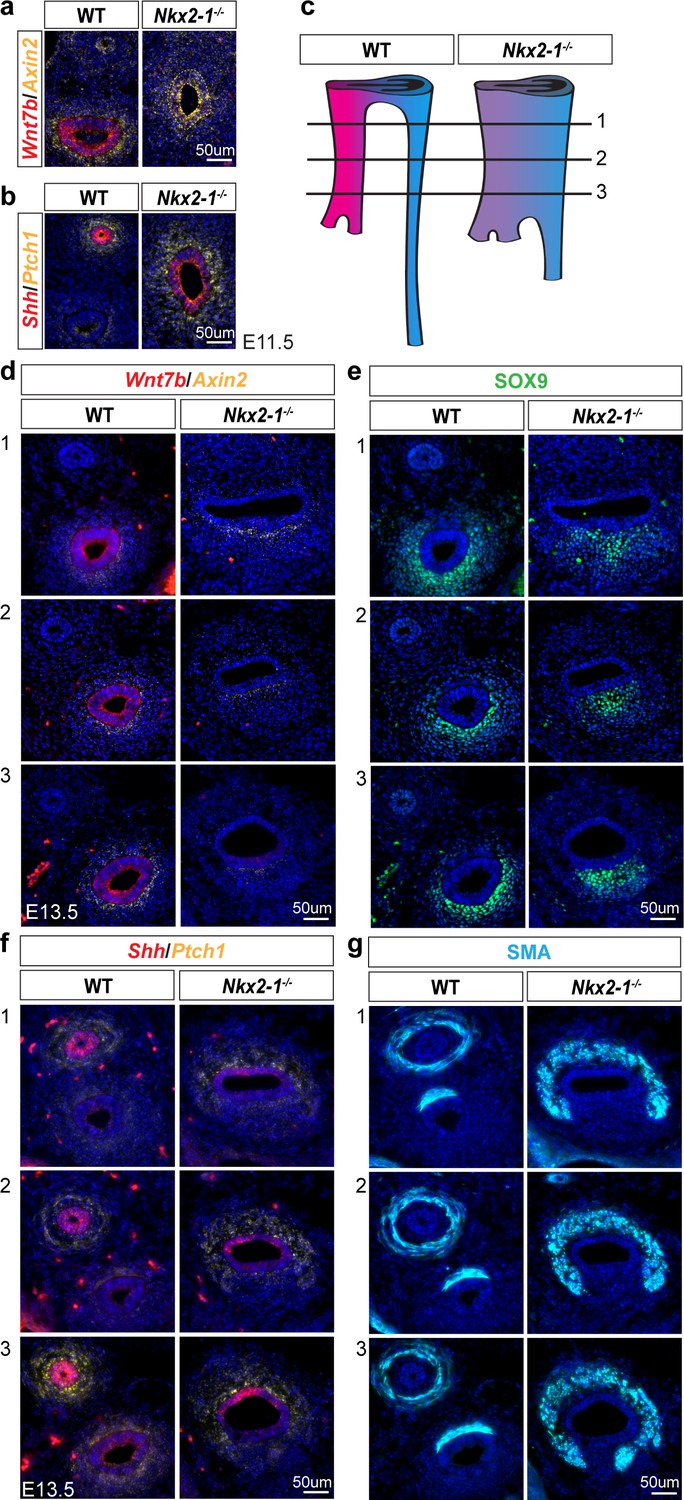
NKX2-1 regulation of epithelial-mesenchymal signaling.
(a) RNA localization of Wnt7b (red) and Axin2 (yellow), and (b) Shh (red) and Ptch1 (yellow) in WT and Nkx2-1-/- E11.5 foreguts. (c) Schematic of rostral-caudal position of images in (d-g). (d-g) RNA localization of Wnt7b and Axin2 (d), Shh and Ptch1 (f), and protein localization of SOX9 (e), and smooth muscle actin (SMA) (g) along the rostral-caudal axis of E13.5 WT and Nkx2-1-/- foreguts.
Figure 7
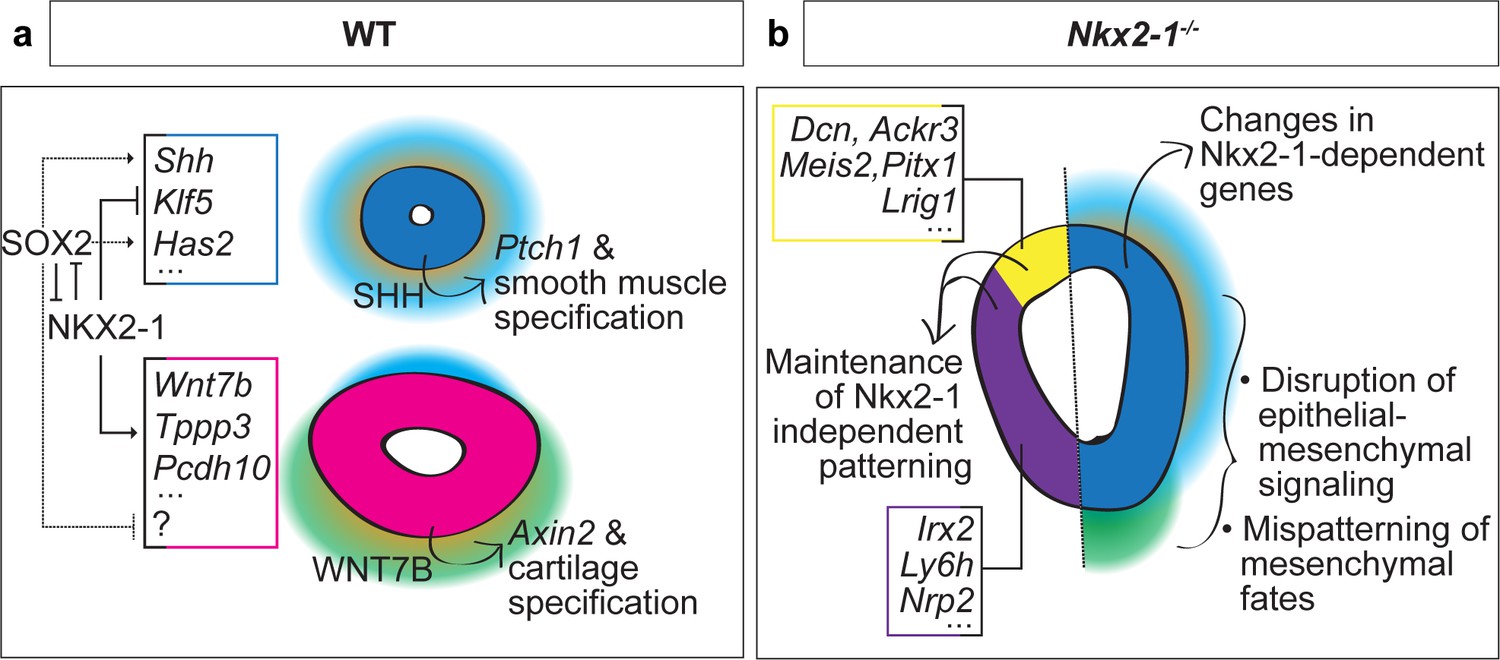
Proposed model of NKX2-1-dependent and -independent tracheoesophageal specification.
(a) Schematic of NKX2-1 and SOX2 regulation of gene expression in WT trachea and esophagus, and epithelial-mesenchymal signaling downstream of NKX2-1. NKX2-1 negatively regulates esophageal genes Shh, Klf5 and Has2, and positively regulates tracheal genes Wnt7b, Tppp3, and Pcdh10. SOX2 is required for expression of Shh and Has2. NKX2-1 regulation of Shh and Wnt7b influences mesenchymal SHH and WNT response required for smooth muscle and tracheal cartilage development. (b) Schematic of Nkx2-1-/- mutant phenotype. Maintenance of the NKX2-1-independent transcriptional program includes dorsal expression of Dcn, Ackr3, Meis2, Pitx1, and Lrig1 and ventral expression of Irx2, Ly6h, and Nrp2. NKX2-1-dependent transcriptional changes include increased expression of esophageal genes and decreased expression of tracheal genes in the ventral foregut, accompanied by changes in epithelial-mesenchymal signaling and mesenchymal differentiation.
Tables
Key resources table
| Reagent type (species) or resource | Designation | Source or reference | Identifiers | Additional information |
|---|---|---|---|---|
| Strain, strain background (mouse) | CD1 | Harlan/Envigo | Cat#: 030 | |
| Genetic reagent (mouse) | Nkx2-1fl/fl | Kusakabe et al., 2006 | MGI: 3653645 | |
| Genetic reagent (mouse) | Sox2fl/fl | Shaham et al., 2009 | MGI: 4366453 | |
| Genetic reagent (mouse) | Tmem163Tg(Actincre) | Lewandoski et al., 1997 | MGI: 2176050 | |
| Genetic reagent (mouse) | Nkx2.5cre | Stanley et al., 2004 | MGI: 2448972 | |
| Antibody | α-NKX2-1 (rabbit polyconal) | Millipore | Cat#: 07601 | 1:200 for IF, 5ug for ChIP |
| Antibody | α-SOX2 (goat polyclonal) | Neuromics | Cat#: GT15098 | 1:250 for IF |
| Antibody | α-SOX9 (Rabbit polyclonal) | Santa Cruz | Cat#: sc-20095 | 1:250 for IF |
| Antibody | α-PITX1 (Rabbit polyclonal) | NovusBio | Cat: NBP188644 | 1:200 for IF |
| Antibody | α-LRIG1 (Goat polyclonal) | R&D Systems | Cat#: AF3688 | 1:250 for IF |
| Antibody | α-SMA (Rabbit polyclonal) | Abcam | AB5694 | 1:300 for IF |
| Antibody | α-SMA-cy3 (mouse monoclonal) | Sigma | C6198 | 1:300 for IF |
| Antibody | α-EpCAM (rat polyclonal) | BioLegend | Cat#: 118219 | 1:200 for FACS |
| Sequence-based reagent | RNAscope probe mm-Irx2 | Advanced Cell Diagnostics | Cat#: 519901 | |
| Sequence-based reagent | RNAscope probe mm-Wnt7b | Advanced Cell Diagnostics | Cat#: 401131 | |
| Sequence-based reagent | RNAscope probe mm-Pcdh10 | Advanced Cell Diagnostics | Cat#: 477781-C3 | |
| Sequence-based reagent | RNAscope probe mm-Tppp3 | Advanced Cell Diagnostics | Cat#: 586631 | |
| Sequence-based reagent | RNAscope probe mm-Ly6h | Advanced Cell Diagnostics | Cat#: 587811 | |
| Sequence-based reagent | RNAscope probe mm-Krt19 | Advanced Cell Diagnostics | Cat#: 402941 | |
| Sequence-based reagent | RNAscope probe mm-Klf5 | Advanced Cell Diagnostics | Cat#: 444081 | |
| Sequence-based reagent | RNAscope probe mm-Foxe1 | Advanced Cell Diagnostics | Cat#: 509641 | |
| Sequence-based reagent | RNAscope probe mm-Crabp1 | Advanced Cell Diagnostics | Cat#: 474711-C3 | |
| Sequence-based reagent | RNAscope probe mm-Bmp4 | Advanced Cell Diagnostics | Cat#: 401301-C2 | |
| Sequence-based reagent | RNAscope probe mm-Nrp2 | Advanced Cell Diagnostics | Cat#: 500661 | |
| Sequence-based reagent | RNAscope probe mm-Dcn | Advanced Cell Diagnostics | Cat#: 413281-C3 | |
| Sequence-based reagent | RNAscope probe mm-Has2 | Advanced Cell Diagnostics | Cat#: 465171-C2 | |
| Sequence-based reagent | RNAscope probe mm-Meis2 | Advanced Cell Diagnostics | Cat#: 436371-C3 | |
| Sequence-based reagent | RNAscope probe mm-Ackr3 | Advanced Cell Diagnostics | Cat#: 482561-C2 | |
| Sequence-based reagent | RNAscope probe mm-Axin2 | Advanced Cell Diagnostics | Cat#: 400331-C3 | |
| Sequence-based reagent | RNAscope probe mm-Shh | Advanced Cell Diagnostics | Cat#: 314361 | |
| Sequence-based reagent | RNAscope probe mm-Ptch1 | Advanced Cell Diagnostics | Cat#: 402811-C2 | |
| Sequence-based reagent | Nkx2-1-geno1 | This paper | PCR primer | 5'-CTA-GGG-AGG-CTA -GGA-ACT-CGG-3' |
| Sequence-based reagent | Nkx2-1-geno2 | This paper | PCR primer | 5'-CCG-ACC-CAC-GTA-GAG-CC-3' |
| Sequence-based reagent | Nkx2-1-geno3 | This paper | PCR primer | 5'-CTC-TTA-TCT-GGG-ATC-GCC-TGA-G-3' |
| Sequence-based reagent | Sox2-flox-geno1 | Steevens et al., 2019 | PCR primer | 5'-TGG-AAT-CAG-GCT-GCC-GAG-AAT-CC-3' |
| Sequence-based reagent | Sox2-flox-geno2 | Steevens et al., 2019 | PCR primer | 5'-TCG-TTG-TGG-CAA-CAA-GTG-CTA-AAG-C-3' |
| Sequence-based reagent | Sox2-flox-geno3 | Steevens et al., 2019 | PCR primer | 5'-CTG-CCA-TAG-CCA-CTC-GAG-AAG-3' |
| Sequence-based reagent | Cre-geno1 | Liang et al., 2005; Vauclair et al., 2005 | PCR primer | 5'-GTT-CGC-AAG-AAC-CTG-ATG-GAC-A-3' |
| Sequence-based reagent | Cre-geno2 | Liang et al., 2005; Vauclair et al., 2005 | PCR primer | 5'-CTA-GAG-CCT-GTT-TTG-CAC-GTT-C-3' |
| Commercial assay or kit | MicroChIP Diapure columns | Diagenode | Cat#: C03040001 | DNA extraction (ChIP) |
| Commercial assay or kit | Microplex Library Preparation Kit v2 | Diagenode | Cat#: C05010012 | ChIP library prep |
| Commercial assay or kit | Rneasy Micro kit | Qiagen | Cat# 74004 | RNA extraction (bulk) |
| Commercial assay or kit | SMARTer Stranded Total RNAseq kit V2 | Takara | Cat#: 634411 | Bulk RNAseq library prep |
| Commercial assay or kit | RNA 6000 Pico Bioanalyzer kit | Agilent | Cat# 5067-1513 | Bioanalyzer (RNA) |
| Commercial assay or kit | High Sensitivity DNA Bioanalyzer kit | Agilent | Cat#: 5067-4626 | Bioanalyzer (DNA) |
| Commercial assay or kit | QuBit dsDNA HS Assay kit | Invitrogen | Cat#: Q32854 | DNA quantification |
| Commercial assay or kit | Chromium Single Cell ' Reagent Kit V2 | 10X Genomics | Cat#: PN-120237, PN-120236, PN-120262 | Single cell RNA-seq |
| Other | Sytox Blue nuclei acid stain | Thermo | Cat: S11348 | Live/dead stain for FACS, use at 1uM |
| Other | TSAplus Fluoresceine | Akoya Biosciences | NEL741001KT | RNAscope, 1:1500 |
| Other | TSAplus Cy3 | Akoya Biosciences | NEL744001KT | RNAscope, 1:1500 |
| Other | TSAplus Cy5 | Akoya Biosciences | NEL745001KT | RNAscope, 1:1500 |
| Other | DynaBeads, protein G | Invitrogen | Cat#: 10003D | ChIP |
| Other | AMPure XP beads | Beckman Coulter | Cat#: A63881 | Library cleanup |
| Other | TrypLE Express | Thermo | Cat# 12604013 | Tissue dissociation |
Additional files
Download links
A two-part list of links to download the article, or parts of the article, in various formats.
Downloads (link to download the article as PDF)
Open citations (links to open the citations from this article in various online reference manager services)
Cite this article (links to download the citations from this article in formats compatible with various reference manager tools)
Delineating the early transcriptional specification of the mammalian trachea and esophagus
eLife 9:e55526.
https://doi.org/10.7554/eLife.55526


