Aromatic interactions with membrane modulate human BK channel activation
- Department of Chemistry, University of Massachusetts, United States
- Department of Biomedical Engineering, Center for the Investigation of Membrane Excitability Disorders, Cardiac Bioelectricity and Arrhythmia Center, Washington University, United States
- Department of Biochemistry and Molecular Biology, University of Massachusetts, United States
Figures
Figure 1 with 5 supplements
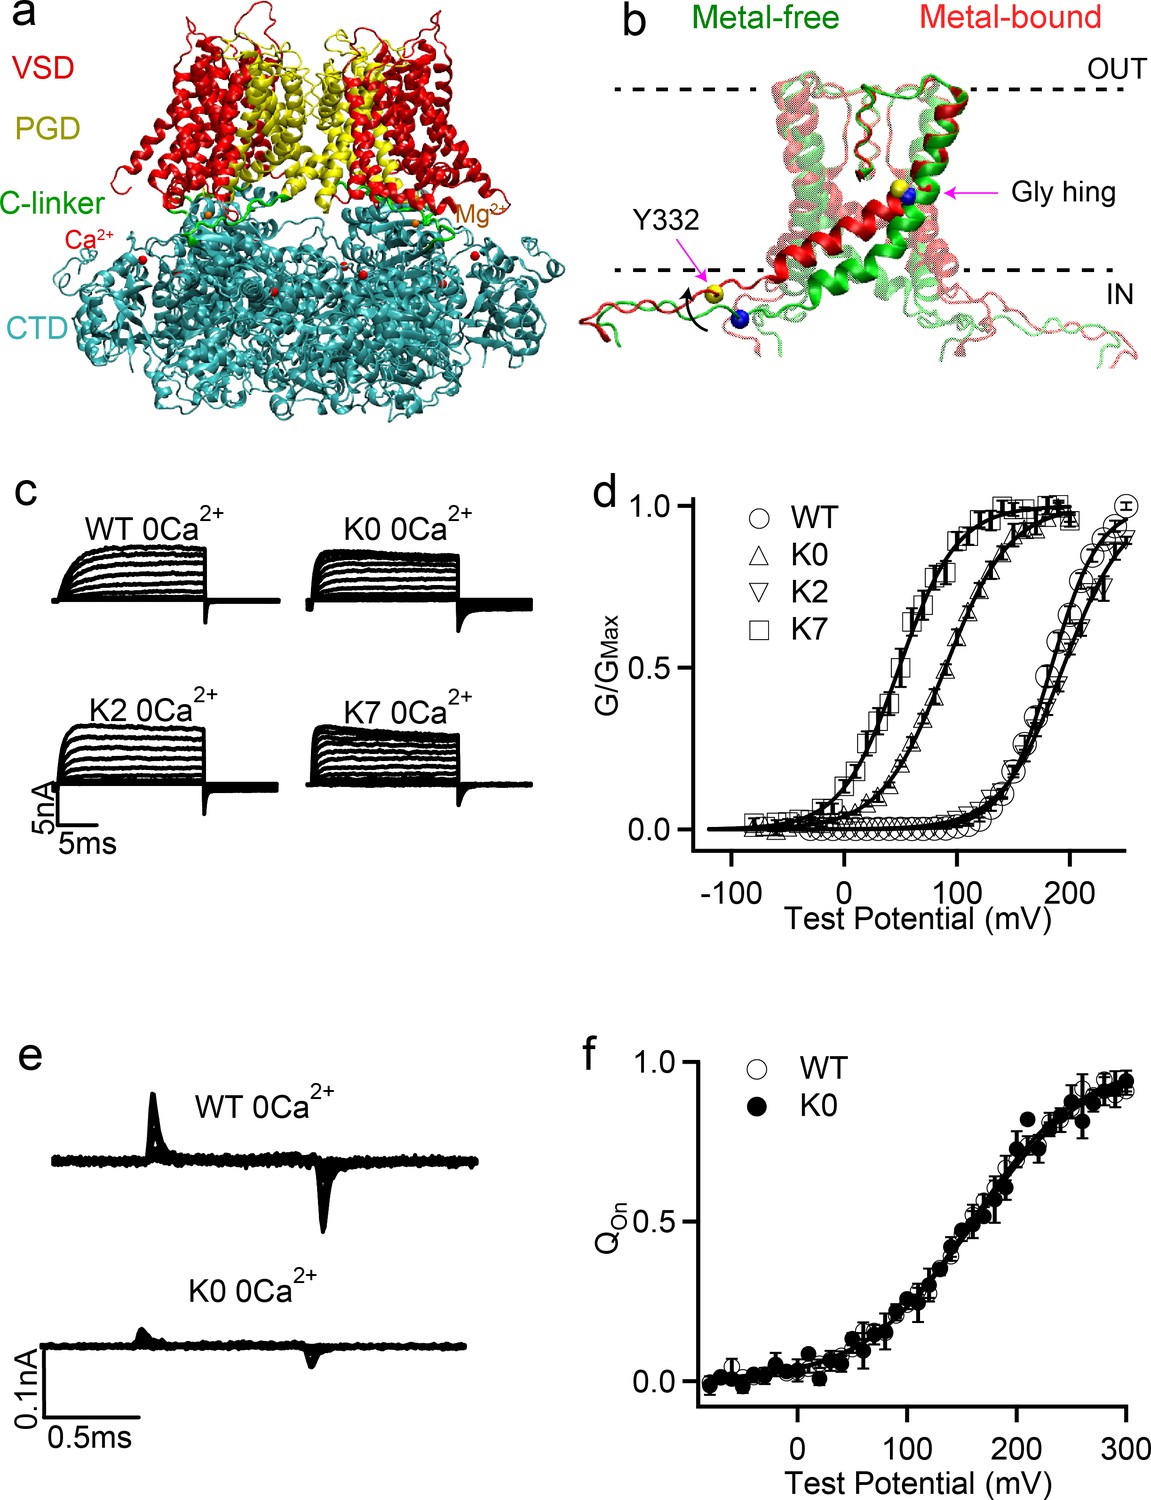
Structure of BK channels and effects of C-linker sequence scrambling on its voltage activation.
(a) Key functional domains and structural organization of the human BK channel (hSol1). See main text for definition of domains; (b) Orientation of the pore lining S6 helices and C-linkers in the metal-free (green) and metal-bound (red) states; The dash lines indicate the approximate positions of membrane interfaces. The location of Tyr 332 and Gly 310 are indicated by yellow and blue spheres in the metal-bound and metal-free states, respectively. The black arrow shows S6 movement upon metal binding. (c) Macroscopic currents of WT, K0, K2 and K7 hSlo1 channels. The currents were elicited in 0 [Ca2+]i by voltage pulses from −30 to 250 mV with 20 mV increments for WT and K2 and voltage pulses from −80 to 200 mV with 20 mV increments for K0 and K7. The voltages before and after the pulses were −50 and −80 mV, respectively. (d) Conductance-voltage (G-V) curves for WT, K0, K2 and K7 hSlo1 channels in 0 [Ca2+]i showing significant shifts in the activation voltage (V0.5); All solid lines were fit to the Boltzmann relation (see Materials and methods), with V0.5 of 183.4 ± 3.2 mV for WT; 89.6 ± 3.5 mV for K0; 195.5 ± 3.5 mV for K2; and 48.7 ± 4.7 mV for K7. (e) Gating current traces of WT and K0, Voltage pulses were from −30 to 300 mV (WT) or from −80 to 300 mV (K0) with 20 mV increments. (f) Normalized gating charge-voltage (Q-V) relation of on-gating currents. The smooth curves are fits to the Boltzmann function with a V0.5 and slope factor of 159.1 ± 6.5 mV and 49.0 ± 5.9 mV for WT, and 161.9 ± 9.2 mV and 51.6 ± 8.5 mV for K0.
-
Figure 1—source data 1
Data from electrophysiology experiments showing G-V curves for WT, K0, K2 and K7 hSlo1 channels in 0 [Ca2+] as depicted in Figure 1d.
- https://cdn.elifesciences.org/articles/55571/elife-55571-fig1-data1-v3.xlsx
-
Figure 1—source data 2
Data from electrophysiology experiments showing Q-V relation of on-gating currents for WT and K0 as depicted in Figure 1f.
- https://cdn.elifesciences.org/articles/55571/elife-55571-fig1-data2-v3.xlsx
Figure 1—figure supplement 1

Structural properties of BK channels.
(a) Domain swapping arrangement of BK channels. Shown is the structure of the human BK channels (hSlo1) with chain A colored blue and C-linker colored green. Other domains are made transparent for clarity. (b) The C-linker (green) directly connects the pore lining helix (S6, yellow) to the RCK1 N-lobe (blue) of the CTD. The bound Mg2+ is shown as an orange sphere.
Figure 1—figure supplement 2

Packing between C-linker and VSD/RCK1 N-lobe of WT hSlo1.
(a) Segments highlighted are: C-linker (residue 329–343, green); RCK1 N-lobe (dark blue, residue 344–427); VSD S0’ (yellow, residue 92–107) and S2-S3 loop (magenta, residue 171–177). The orange sphere marks the position of S337 Cα; Y332 and Y336 are shown as red Licorice. (b) Residue contact map of C-linker (blue labels) with VSD and RCK1 N-lobe (green and black labels) derived from the Cryo-EM structure of the metal-bound state of hSlo1 using the LigPlot server (https://www.ebi.ac.uk/thornton-srv/software/LIGPLOT).
Figure 1—figure supplement 3
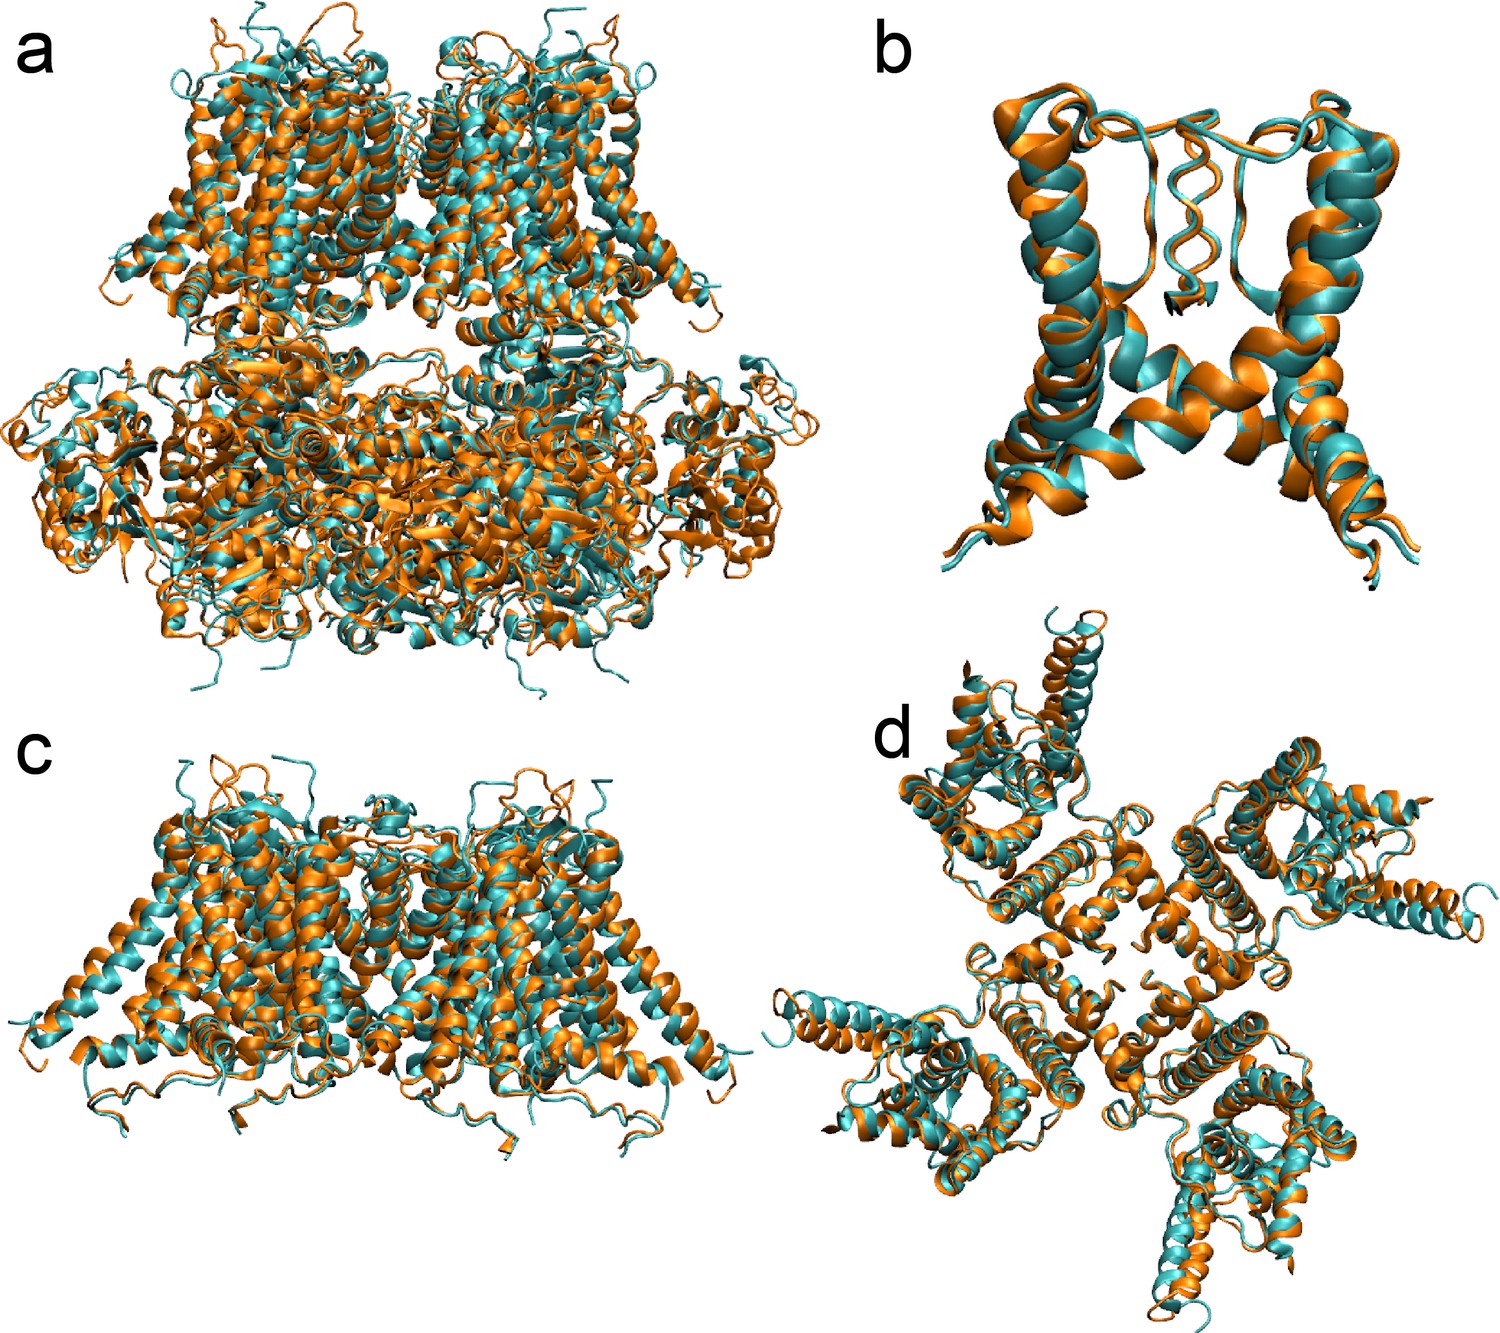
Comparison of the aSlo1-derived homology model of hBK (orange) with the new Cryo-EM structure (PDB 6V38) (cyan) in the metal-bound state.
(a) Overlay of the full-length structures aligned using core residues 100 to 600. The backbone RMSD of two structures 2.18 Å. (b) Overlay of the central pore region (including S6 helices), aligned based on residues 287 to 330. The backbone RMSD of the central pore is 0.87 Å. (c-d) Overlay of the whole TMD structures c) side view, (d) top view, aligned on residues 100 to 343. The backbone RMSD is 2.53 Å. Note that the main difference is in the relative arrangements of VSD and PGD, which is also observed in multiple Cryo-EM structures of the same aSlo1 or hSlo1 constructs and thus likely reflect inherent flexibility of the VSD/PGD packing.
Figure 1—figure supplement 4
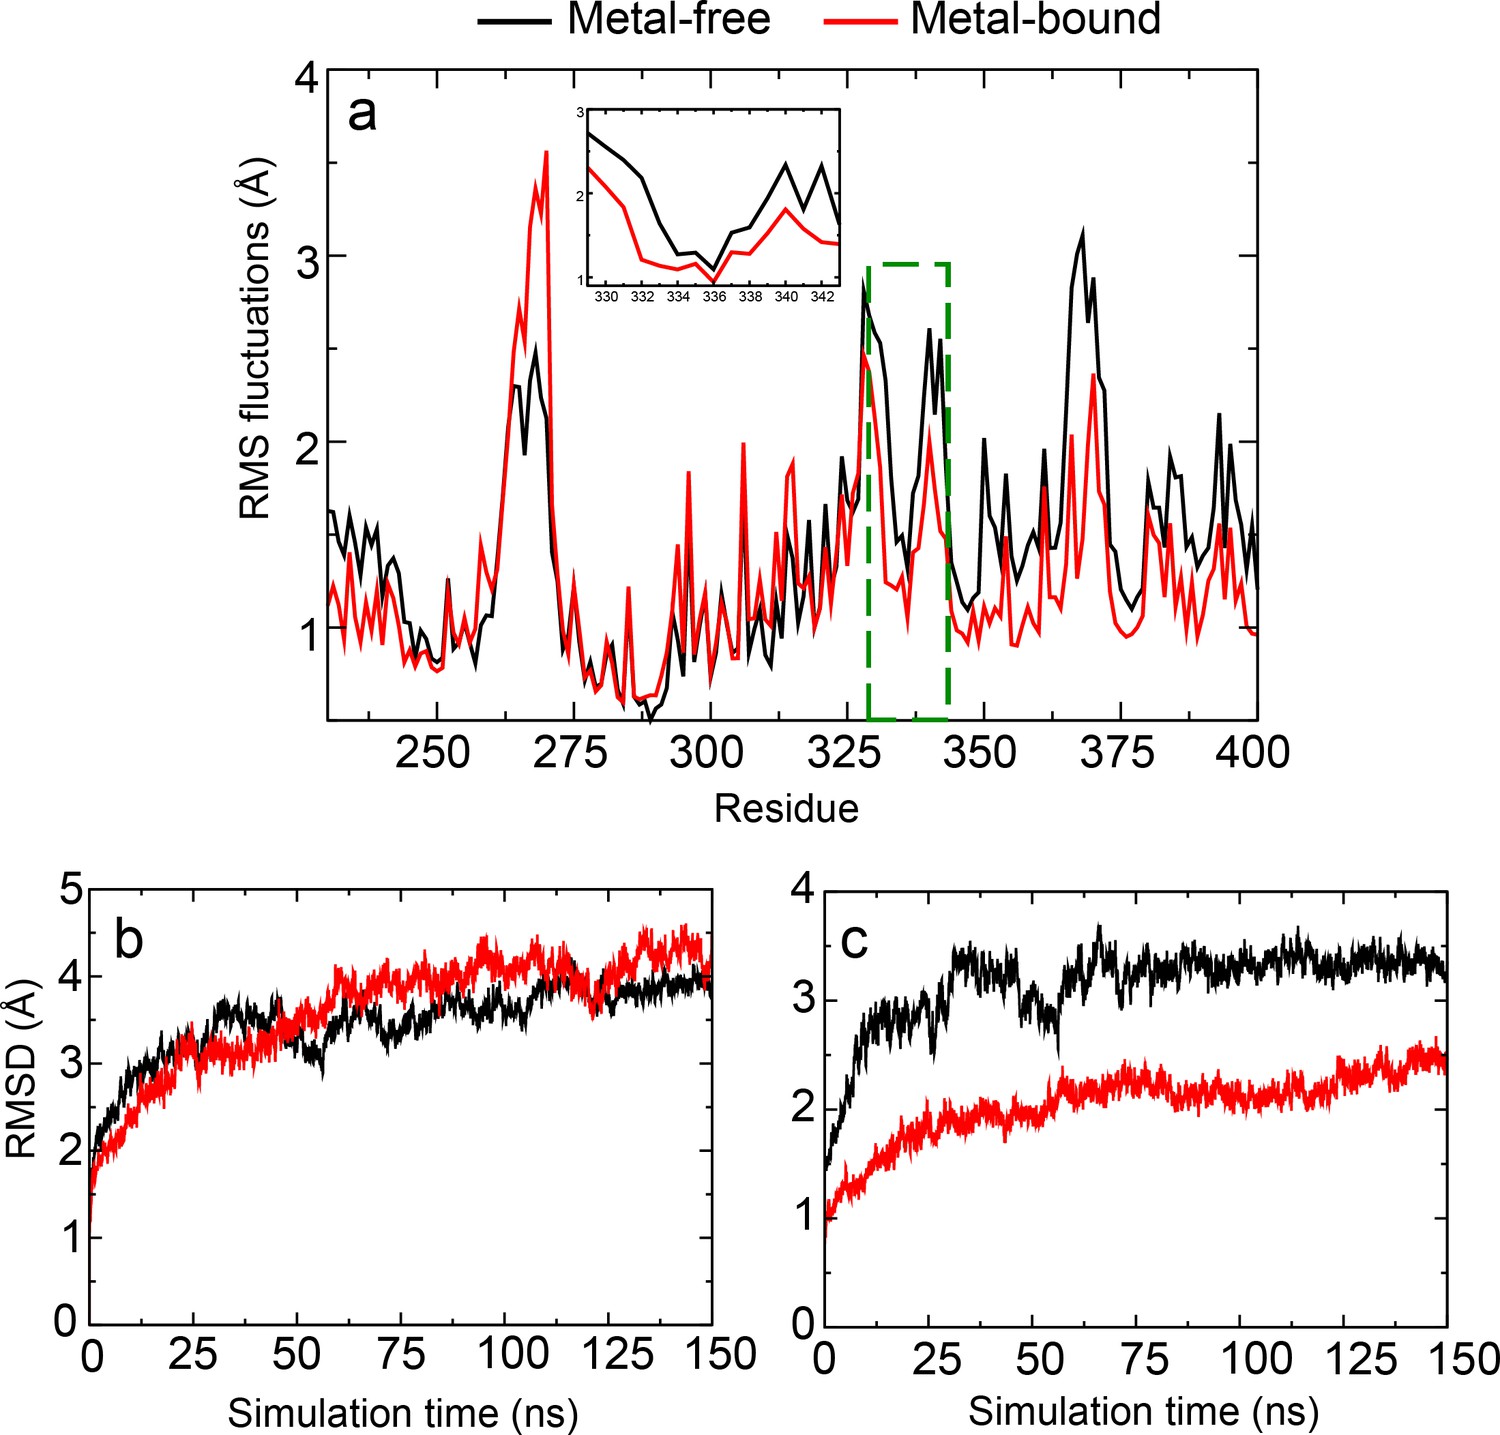
Structural and dynamic properties of hSlo1 obtained from simulations of the recently published Cryo-EM structures (PDB: 6V3G and 6V38).
(a) Root-Mean-Square Fluctuations (RMSF) profiles of residues 230–400 (PGD, C-linker and RCK1 N-lobe). C-linker RMSF is highlighted in the green dashed box and in insert. The Cα RMSD of (b) the whole channel and (c) residues 100–500 (the Core region) as a function of simulation time. RMSF and RMSD were obtained from the 150ns MD simulations with snapshots taken every 0.05 ns.
Figure 1—figure supplement 5
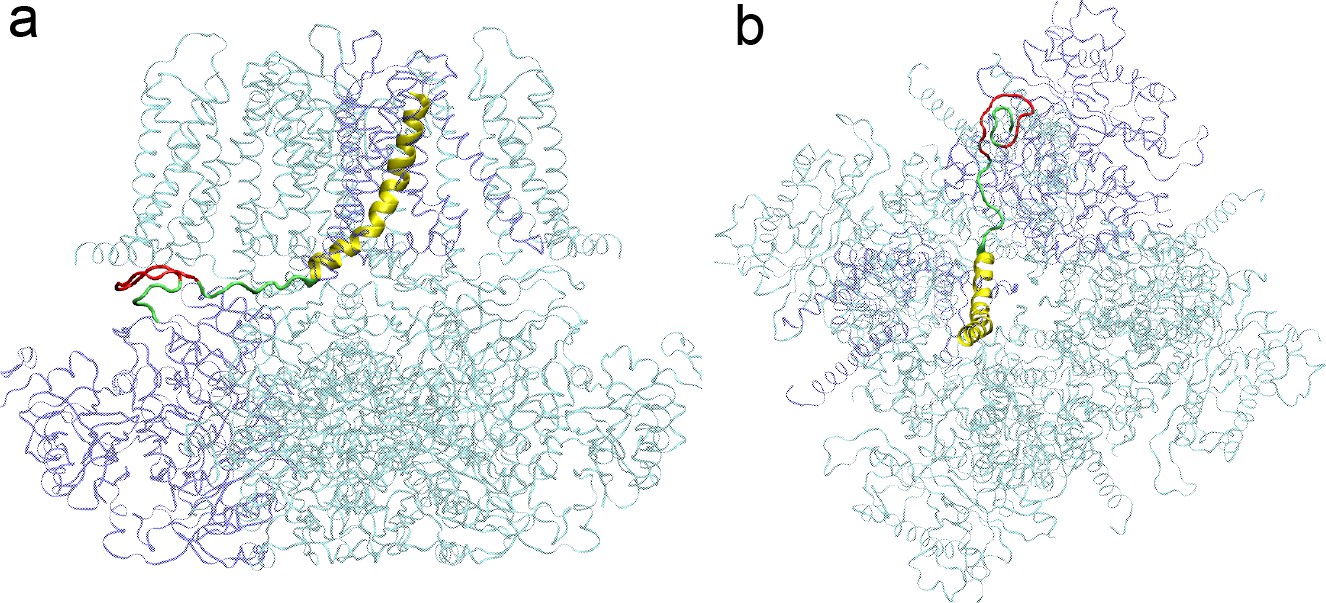
A representative structural model of hSlo1 with 12 residues (3x AAG units; colored red) inserted after S337 in the C-linker region (colored green).
(a) Side view; (b) top view. For clarity, only the C-linker and S6 helix (yellow) of chain A (colored as blue ribbon) are highlighted.
Figure 2 with 6 supplements
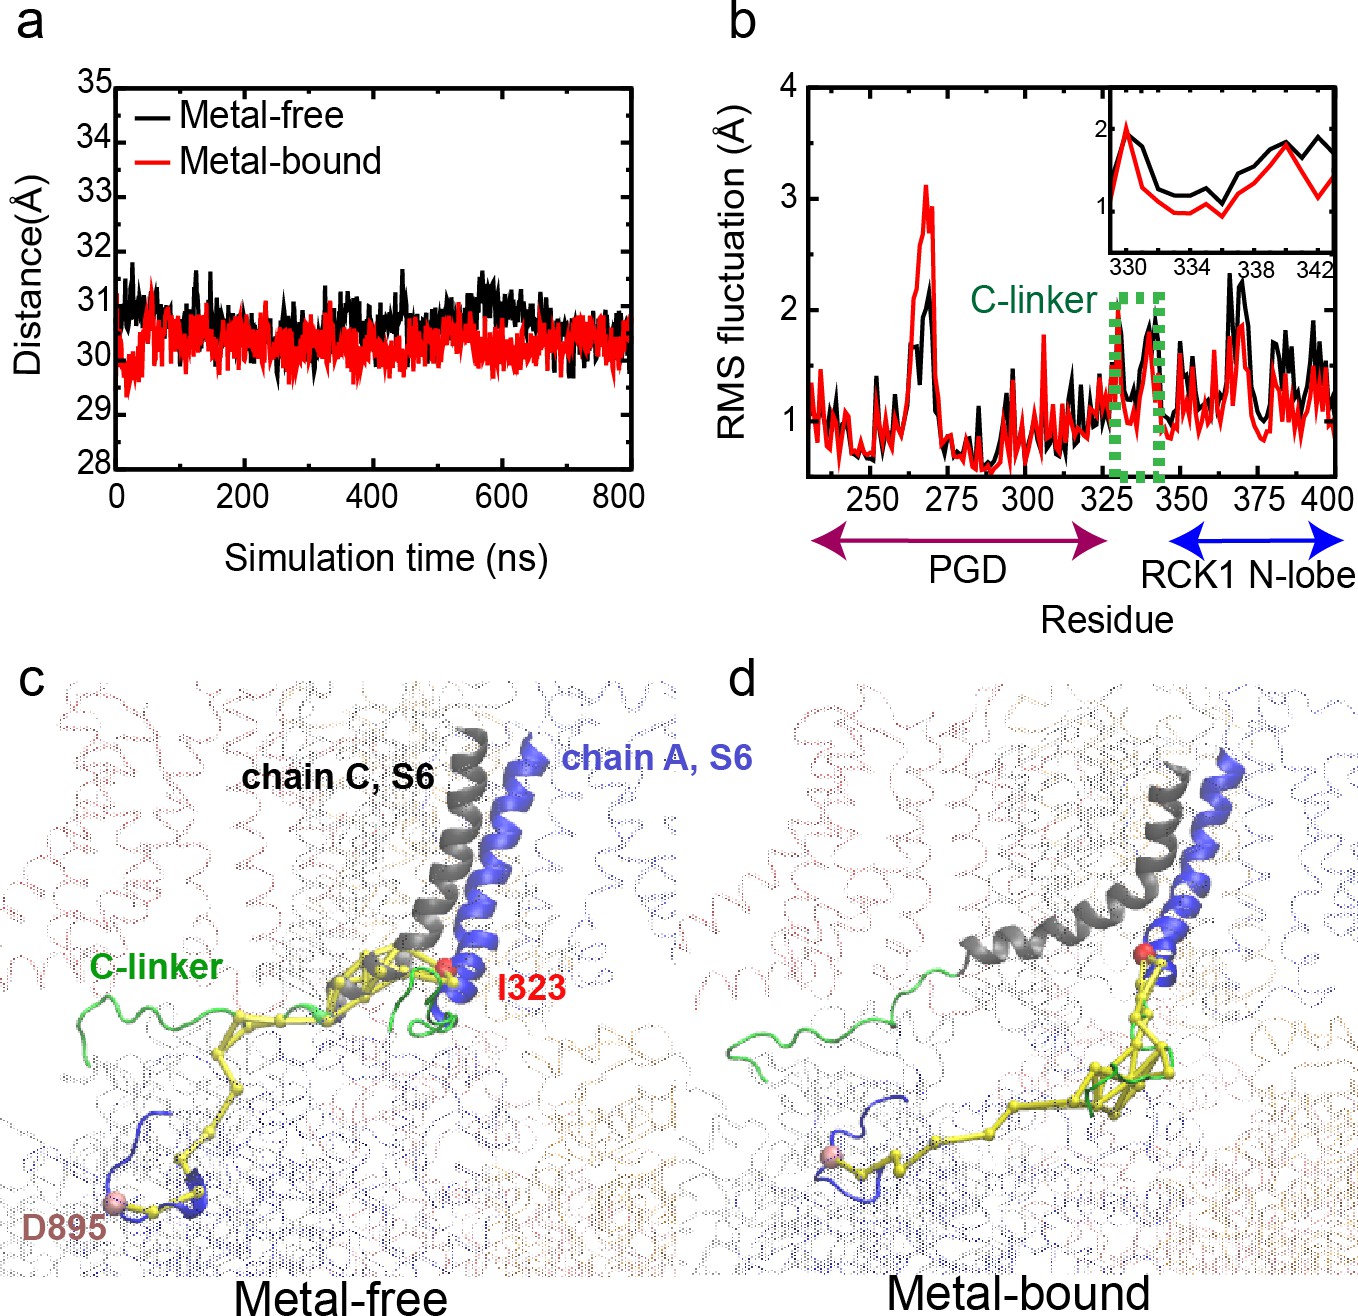
Dynamic properties of BK channels.
(a) The C-linker N-C Cα distance during a representative 800-ns MD simulations of the WT hSlo1. (b) Residue Root-Mean-Square Fluctuations (RMSF) profiles of PGD, C-linker and RCK1 N-lobe derived from the same trajectory (green dashed box and shown in the insert). (c-d) Optimal and top 10 suboptimal pathways of dynamic coupling (yellow traces) between D895 in the RCK2 Ca2+ binding site of chain A (Cα colored as pink) and I323 in PGD of chain A (Cα colored as red) in the metal-free (c) and bound (d) states. The C-linker is colored green, S6 of chain A and its neighboring chain (chain C) in blue and grey, respectively. The rest of the channel is shown as transparent ribbons. Note that the pathways in the metal-free state go through the neighboring chain (chain C).
-
Figure 2—source data 1
Data obtained from simulation studies (see Materials and method section structural and dynamic analysis) calculating C-linker N-C Cα distance for both metal-bound and metal-free states of WT hSlo1 channels as depicted in Figure 2a.
- https://cdn.elifesciences.org/articles/55571/elife-55571-fig2-data1-v3.xlsx
-
Figure 2—source data 2
Data obtained from simulation studies (see Materials and method section structural and dynamic analysis) calculating residue RMSF for both metal-bound and metal-free states of the WT hSlo1 channels as depicted in Figure 2b.
- https://cdn.elifesciences.org/articles/55571/elife-55571-fig2-data2-v3.xlsx
Figure 2—figure supplement 1
Probabilities of residue-residue contacts between the C-linker and VSD of the neighboring chains.
VSD spans residues 45–250, where residues 45 to 53 belong to S0 helix, 92–107 to S0’, 171–177 to the S2-S3 loop, and 225–230 to the S4-S5 loop. The contact probabilities were calculated from atomistic simulations. See Materials and methods for additional details.
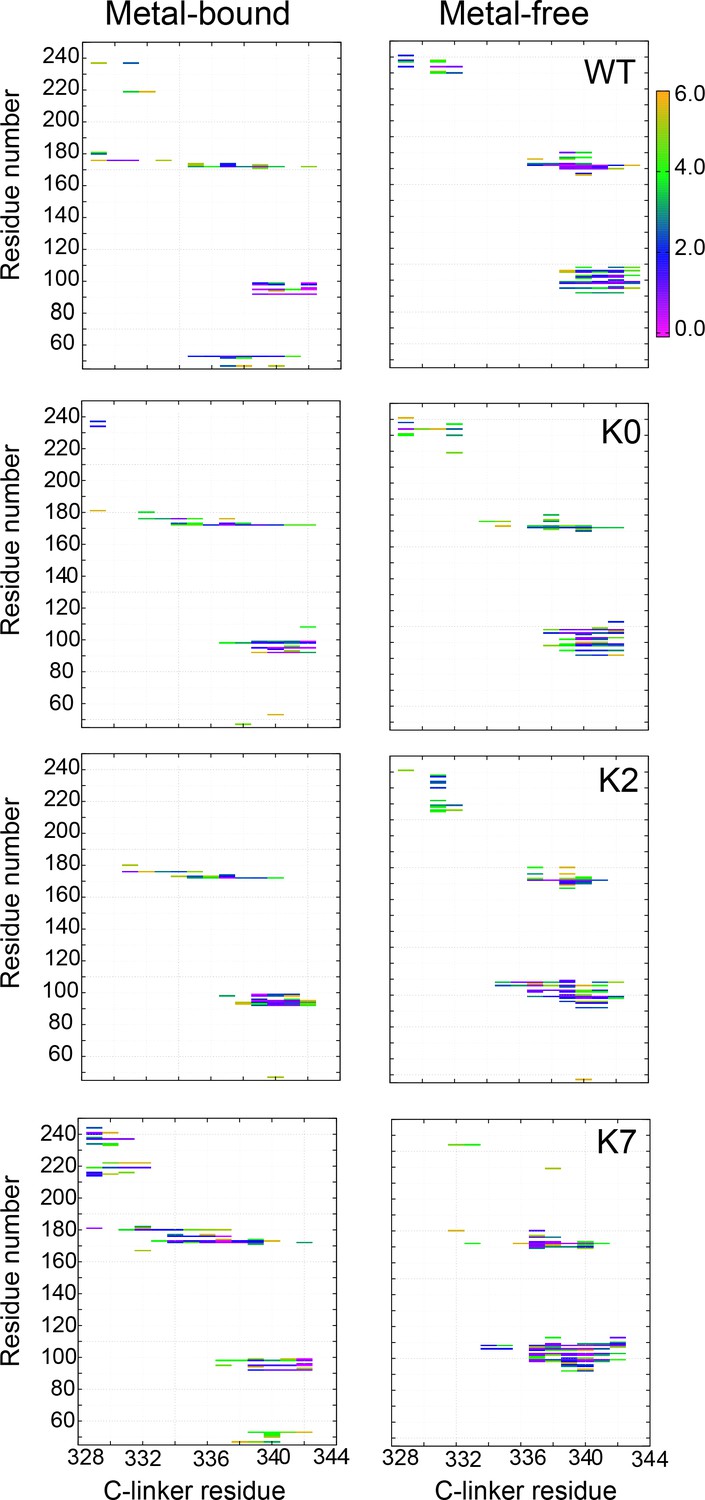
Figure 2—figure supplement 2
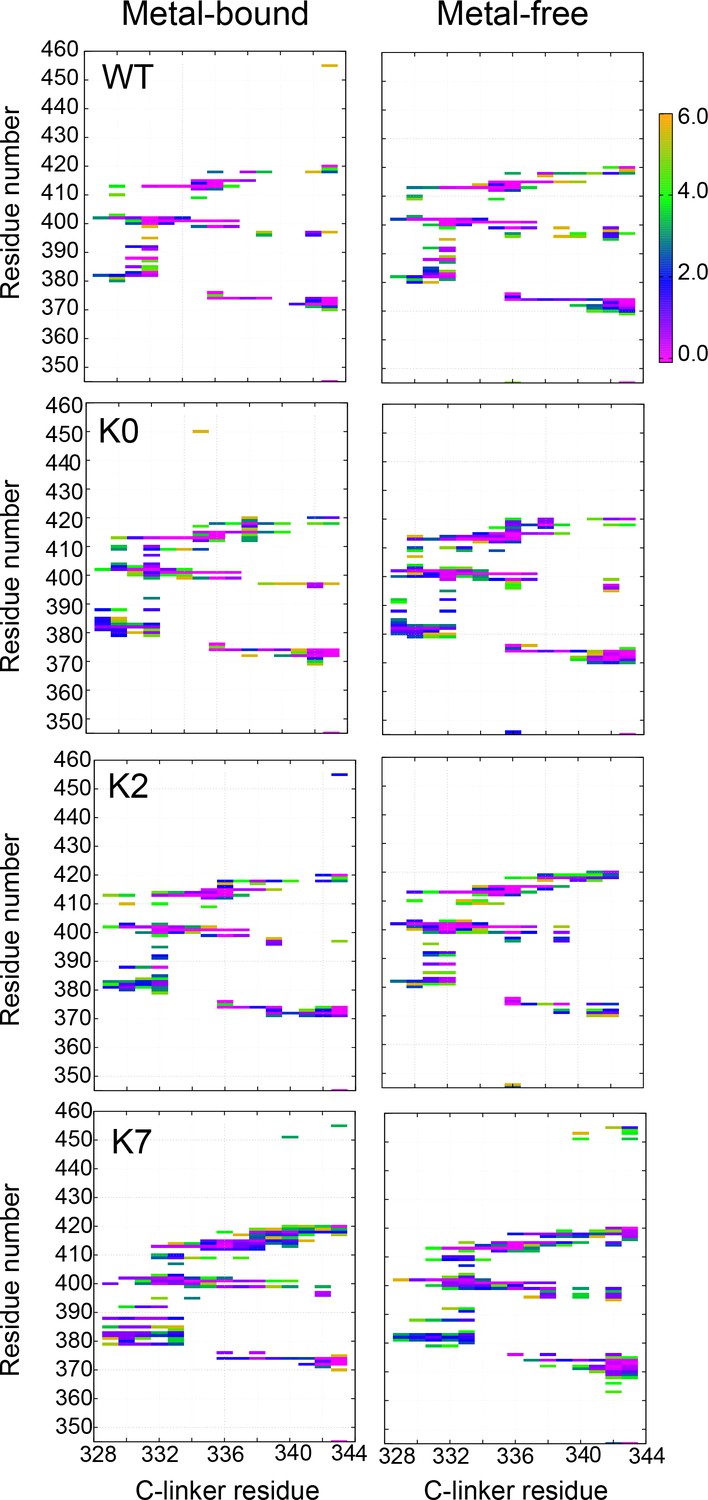
Probabilities of residue–residue contacts between the C-linker and RCK1 N-lobe of the same chain.
See Materials and methods for additional details.
Figure 2—figure supplement 3

Structural and dynamic properties of the C-linker in WT hSlo1 and mutants.
(a) The C-linker N-C distance (329–343 Cα) as a function of time during 800-ns MD simulations. (b) RMSF profiles of residues 230–400 (PGD, C-linker and RCK1 N-lobe) derived from the same MD trajectories, showing limited flexibility of the C-linker (green dashed box and in inserts). (c) Representative snapshots showing the equilibrated conformations of C-linkers in both metal-bound and free states. See Materials and methods for the details of the calculations.
Figure 2—figure supplement 4

Structural and dynamic properties of WT hSlo1 and C-linker mutants.
The Cα RMSD of (a) the whole channel and (b) residues 100–500 (the Core region) as a function of time during 800-ns MD simulations. (c) Evolution of the number of pore water, showing that all hSlo1 constructs readily undergo dewetting transitions in the metal-free state. See Materials and methods for additional details.
Figure 2—figure supplement 5
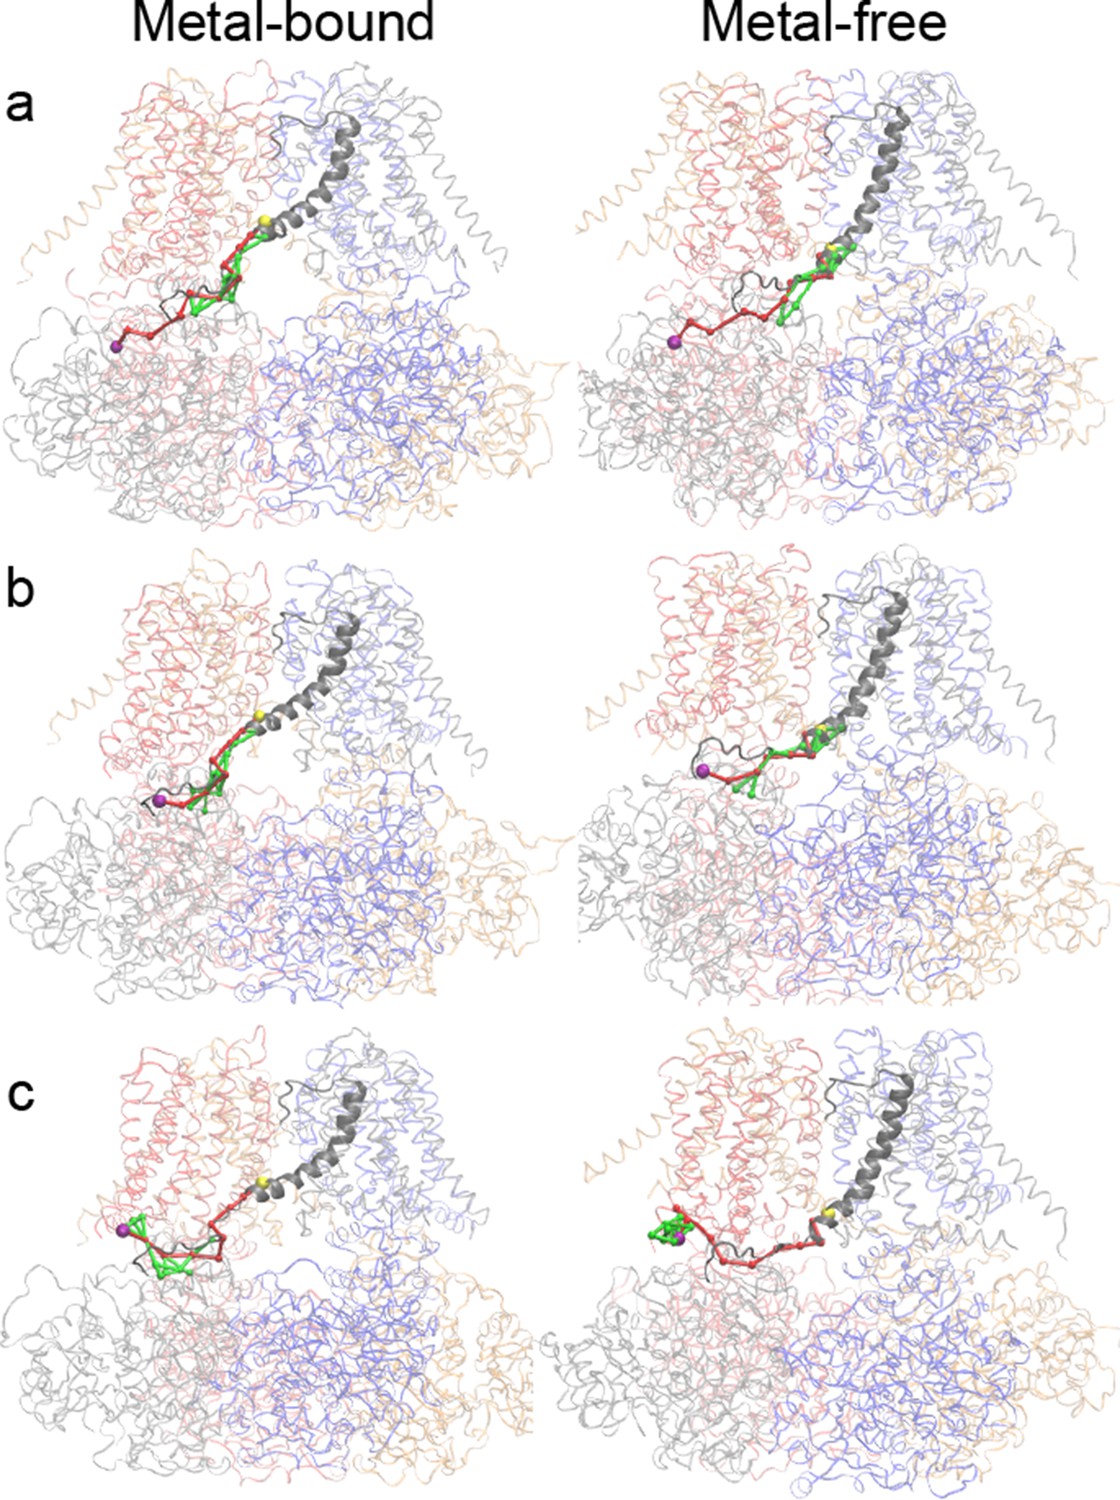
Optimal (red) and suboptimal (green) dynamic coupling pathways between the critical residues in the Ca2+ and Mg2+ binding sites (Cα colored as purple sphere) and I323 (Cα colored as yellow sphere) in PGD.
Whole channel is shown as transparent ribbon with each chain colored differently. S6 and C-linker of chain C are colored in gray and shown with a cartoon representation. (a) Path between R514 (located in RCK1 Ca2+ binding site in CTD; purple sphere) in chain C to I323 (located in S6 helix of PGD; yellow sphere) in chain C. (b) Path from E374 (located in Mg2+ binding site in CTD; purple sphere) in chain C to I323 (located in S6 helix of PGD; yellow sphere) in chain C. (c) Path from D99 (located in Mg2+ binding site in VSD; purple sphere) in chain B to I323 (located in S6 helix of PGD; yellow sphere) in chain C. See Materials and methods for additional details.
Figure 2—figure supplement 6

Correlation between the average intrinsic end-to-end distance of free C-linkers and measured V0.5 of the WT hSlo1 and mutants.
The average distances were calculated from ABSINTH simulations of isolated C-linker peptides. The red dashed line shows the linear relationship derived from the C-linker insertion/deletion study (Niu et al., 2004; also see Table S1).
Figure 3
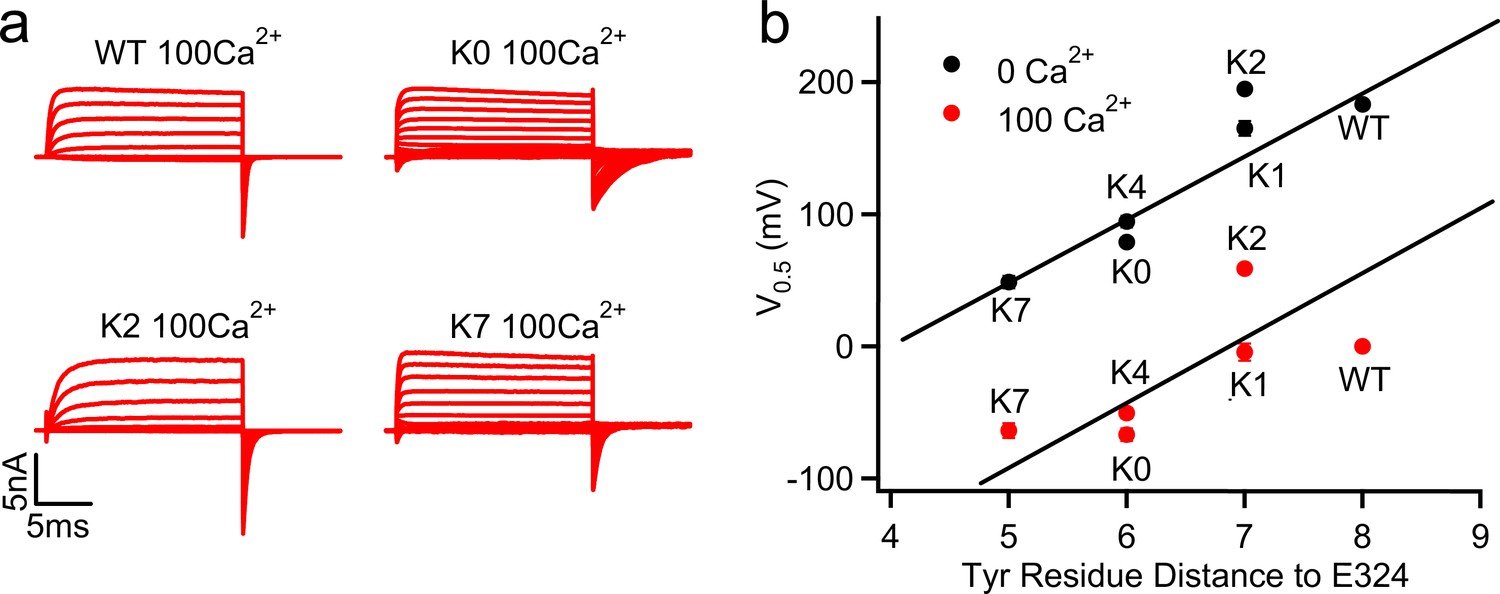
G-V shifts caused by the C-linker mutations correlated with Tyr position.
(a) Macroscopic currents of WT, K0, K2 and K7 mSlo1 channels in 100 μM [Ca2+]i. The currents were elicited by voltage pulses from −200 to 100 mV with 20 mV increments. The voltages before and after the pulses were −50 and −120 mV, respectively. (b) G-V shifts as a function of the sequential distance (residue counts) of the nearest C-linker Tyr (Y332 in WT; Y330 in K0; Y331 in K1; Y331 in K2; Y330 in K4; Y329 in K7) to the S6 C-terminal (E324). V0.5 values were obtained by fitting Boltzmann equation to G-V relations in 0 (black) (Figure 1d) and 100 µM (red) [Ca2+]i. Straight line for 0 [Ca2+]i data is a linear fit to the data to highlight the correlation, for the 100 µM [Ca2+]i data is a parallel shift of the line for 0 [Ca2+]i.
-
Figure 3—source data 1
Data from electrophysiology experiments showing the relation of the G-V curves to the position of the nearest C-linker Tyr as depicted in Figure 3b.
- https://cdn.elifesciences.org/articles/55571/elife-55571-fig3-data1-v3.xlsx
Figure 4
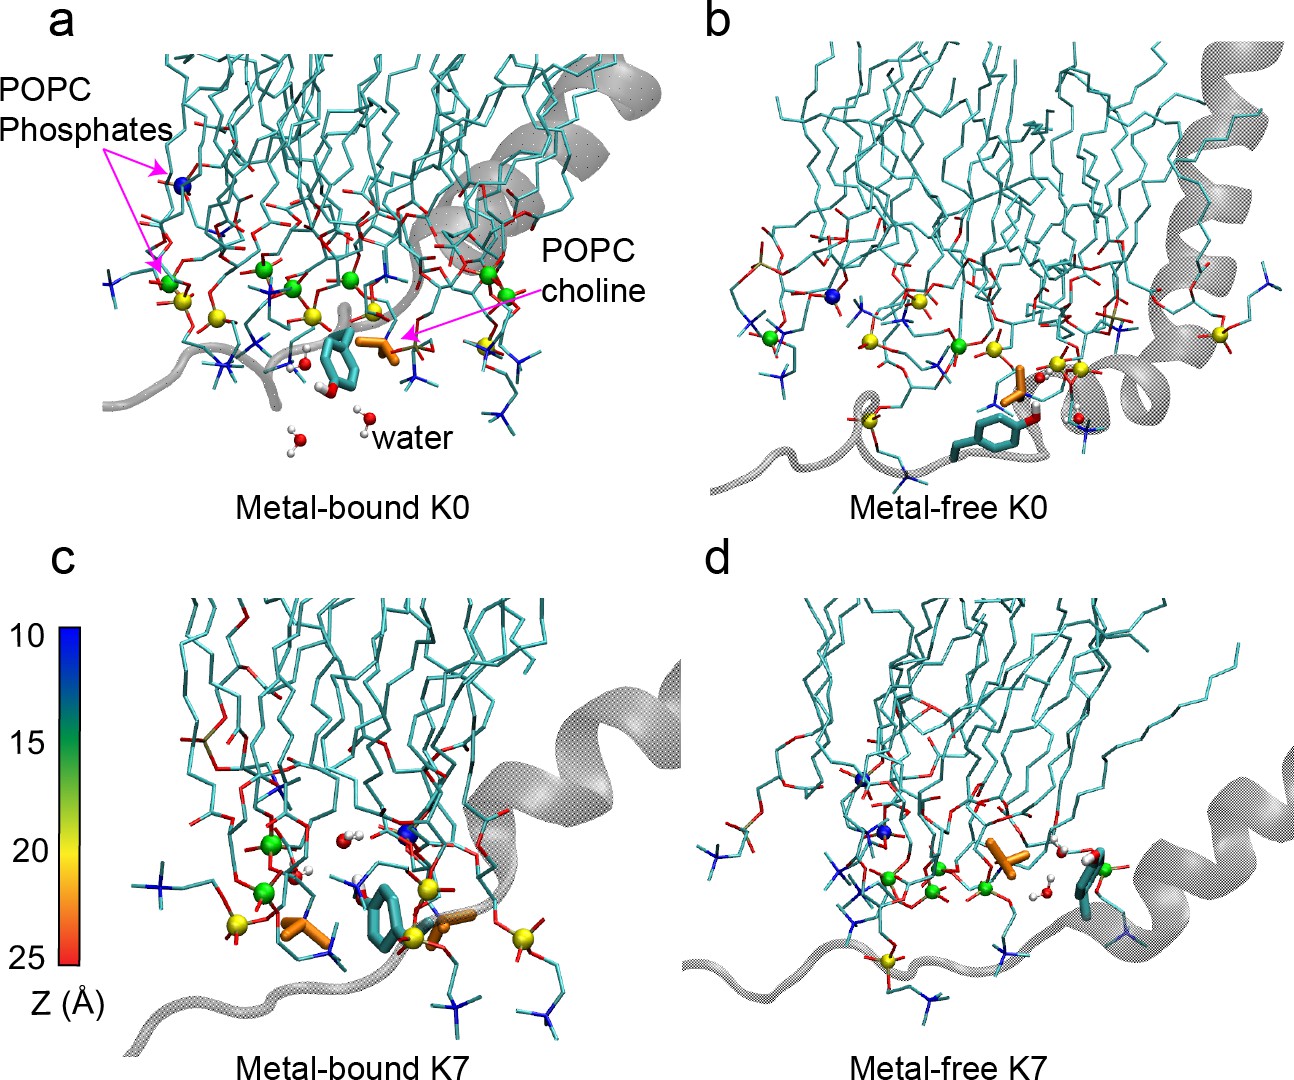
Interactions of the C-linker Tyr residue nearest to the S6 helix with the membrane interface in hSlo1 K0 (Y330, panels a, b) and K7 (Y329, panels c, d) mutants.
Only the S6 helix and C-linker from one subunit are shown for clarity. POPC molecules near the Tyr residue are shown in sticks, with the phosphorous atoms shown in spheres and colored according to their distance to the membrane center (Z). POPC choline groups (orange Licorice) and water molecule near the Tyr sidechain are also shown to illustrate the π-cation and hydrogen bonding interactions. Note that the C-linker is positioned closer to the interface and forms more extensive interactions in the metal-bound (activated) state.
Figure 5 with 2 supplements
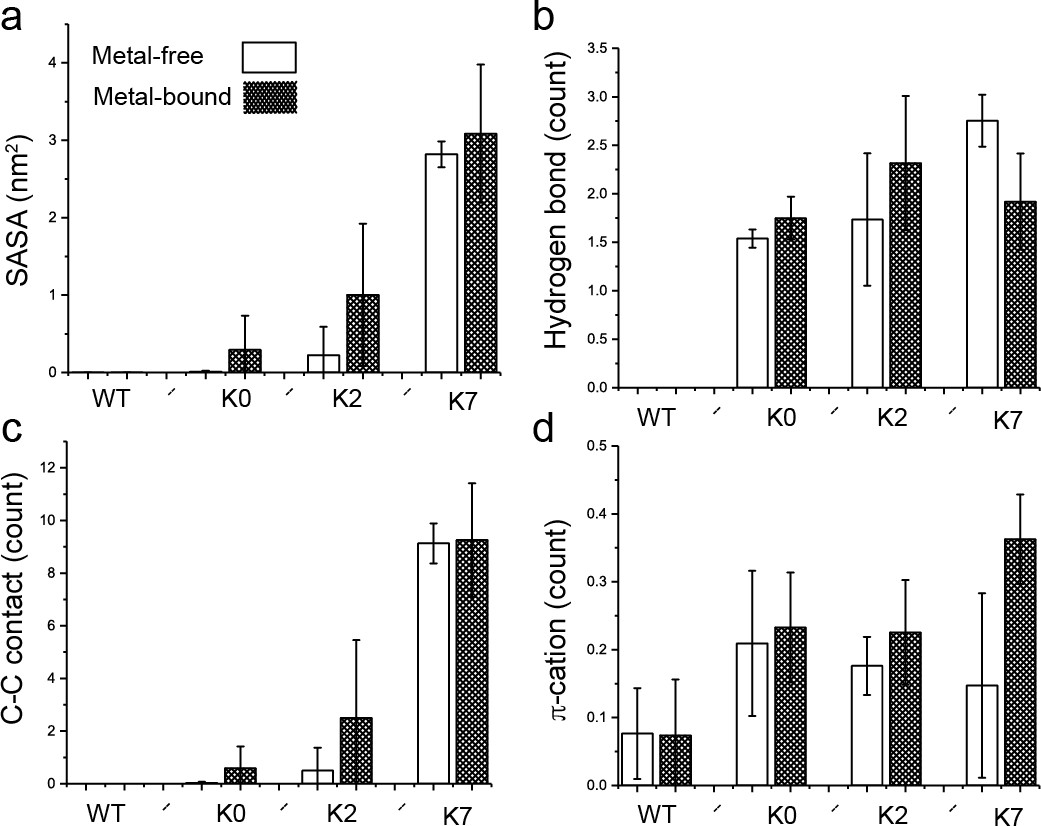
Interactions of the C-linker Tyr residue nearest to the S6 helix with the membrane interface.
(a) Average Tyr sidechain solvent accessible surface area (SASA) of burial by lipid tails, representing the level of hydrophobic contacts between the Tyr sidechain and aliphatic lipid tails. (b) Average number of hydrogen bonds between the Tyr OH group and the POPC hydrophilic head groups. (c) Average number of carbon-carbon (C-C) contacts between the Tyr aromatic ring and POPC hydrocarbon tails. (d) Average number of π-cation interactions between the Tyr aromatic ring and POPC choline group. All results are the average of three independent simulations, with the standard error shown as the error bar. No hydrophobic, hydrogen bonding, or C-C contacts as defined above were observed in the WT channel.
-
Figure 5—source data 1
Data extracted from simulation studies (see Materials and method section structural and dynamic analysis) of WT, K0, K2 and K7 comparing different interactions of Tyr with the membrane components as depicted in Figure 5a–d.
- https://cdn.elifesciences.org/articles/55571/elife-55571-fig5-data1-v3.xlsx
Figure 5—figure supplement 1
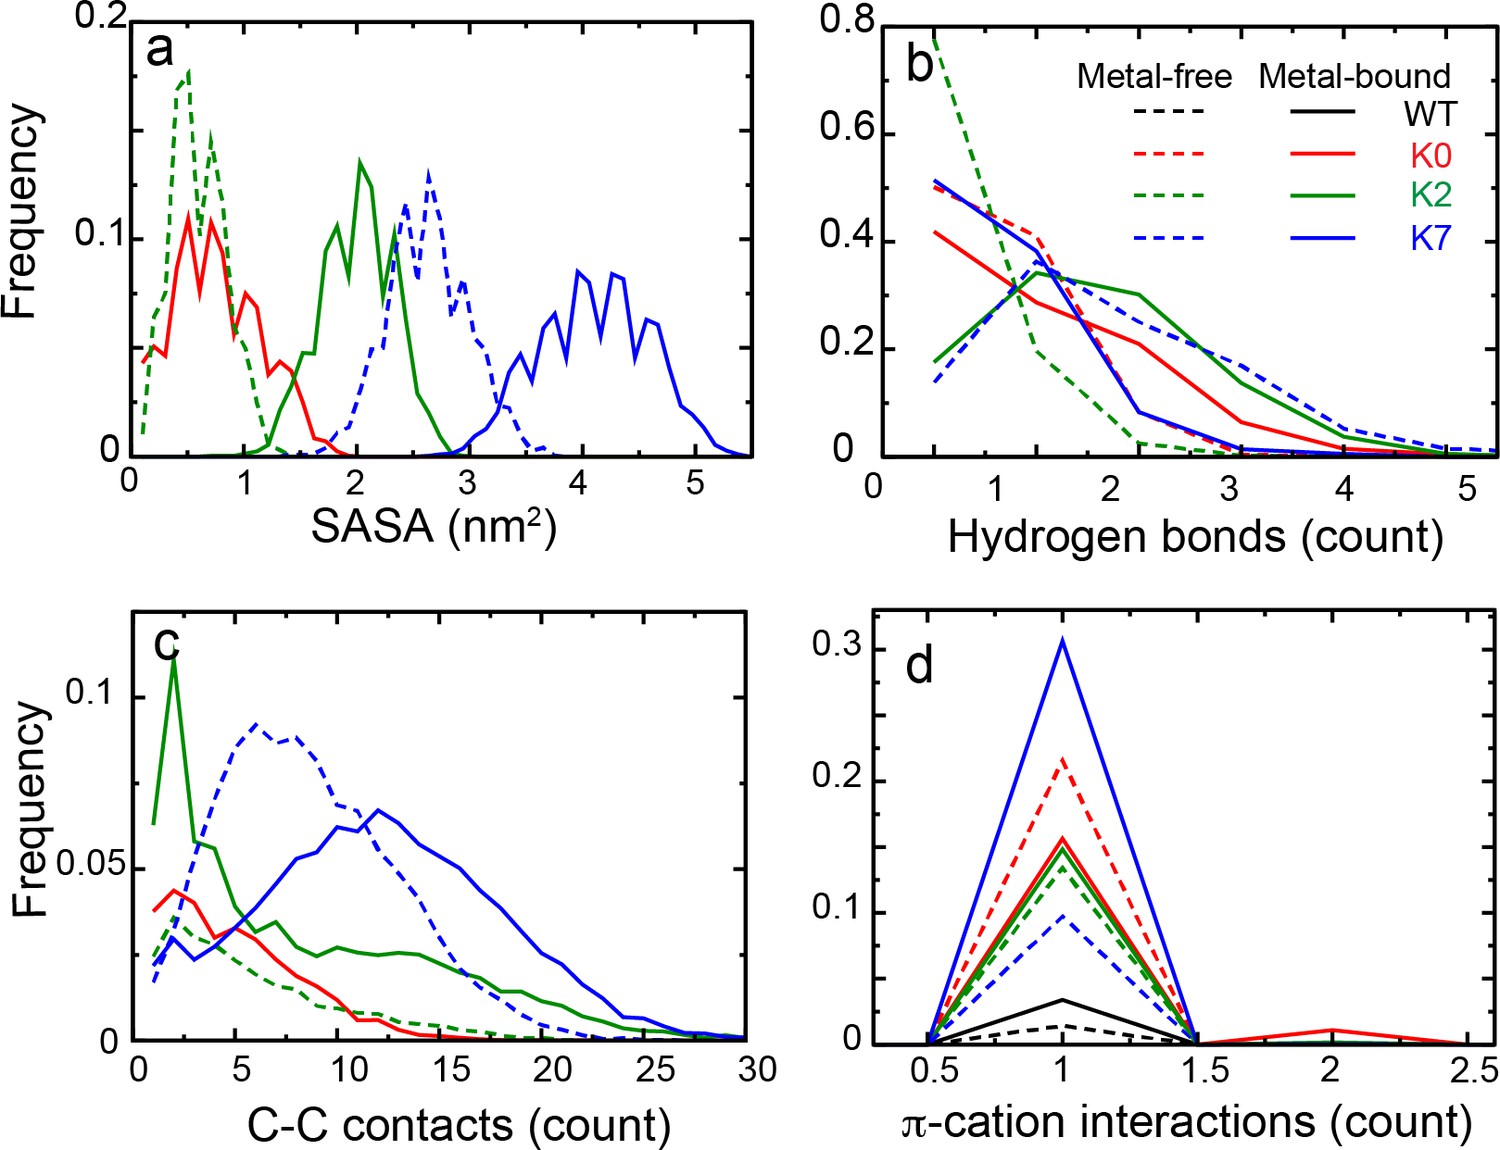
Distributions of various interactions of the C-linker Tyr residue nearest to the S6 helix, with the membrane interface for WT hSlo1 and mutants derived from simulations.
(a) Tyr side chain SASA (Solvent Accessible Surface Area) of burial by lipid tails. (b) Hydrogen bonding of Tyr OH with the lipid polar head groups. (c) Carbon-carbon contacts between the Tyr aromatic ring and lipid tails. (d) π-cation interactions between Tyr aromatic ring and POPC choline groups. Distributions derived from simulations of metal-free and bound states are shown in dashed and solid lines, respectively. No hydrophobic, hydrogen bonding, or C-C contacts as defined above were observed in the WT channel. See Materials and methods for the details of the calculations.
Figure 5—figure supplement 2

A representative snapshot of metal-bound K0 channel showing membrane distortion around the protein.
(a) Top view, (b) side view. The POPC phosphorous atoms have been colored according to their distances to the membrane center. S6 helices are colored in magenta and Tyr 330 side chains are shown as pink spheres.
Figure 6
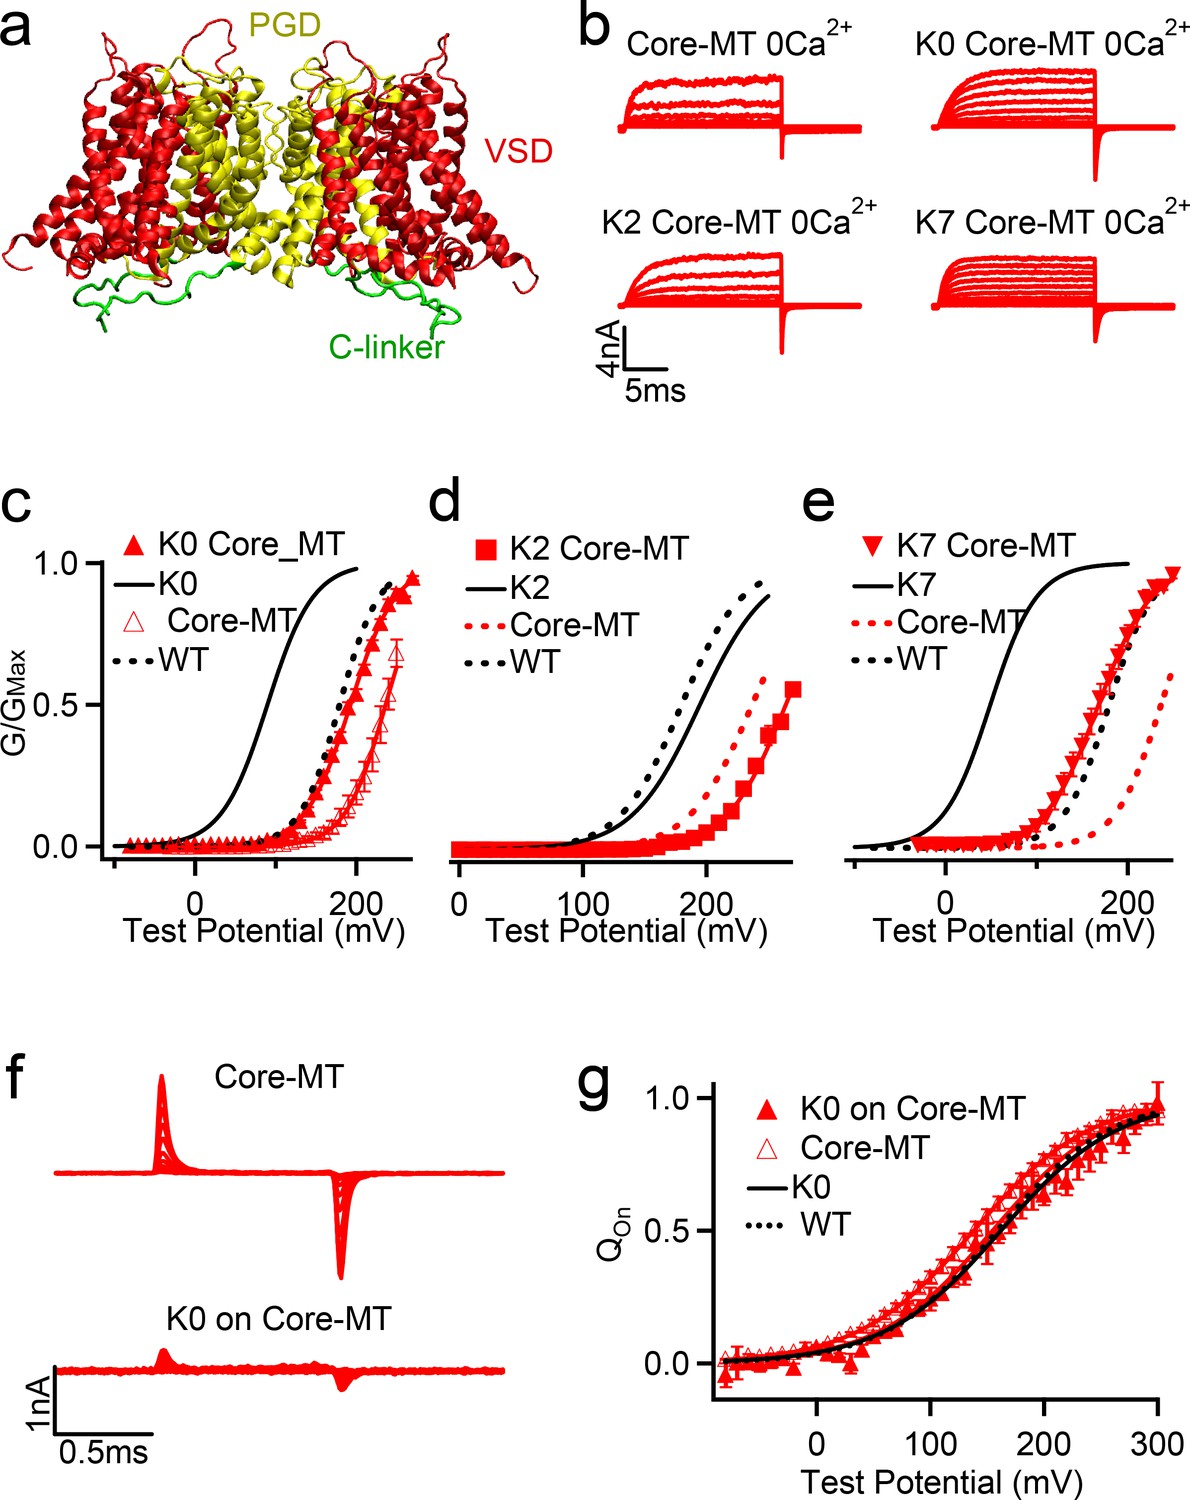
Effects of C-linker scrambling mutations of voltage activation of Core-MT BK channels.
(a) Illustration of the structure of the Core-MT BK channel, where the whole CTD is absent. The mini-tail is omitted in the illustration for clarity. (b) Macroscopic currents of the WT Core-MT construct as well as the K0, K2 and K7 C-linker scrambling mutants. The currents were elicited in 0 [Ca2+]i by voltage pulses from −30 to 250 mV with 20 mV increments. The voltages before and after the pulses were −50 and −80 mV, respectively. (c-e) G-V curves for WT Core-MT and K0, K2 and K7 mutants in 0 [Ca2+]i (red traces). The G-V curves of the Full-Length channels are also shown for reference (black traces). All lines were fit to the Boltzmann relation (see Materials and methods) with V0.5 of 235.0 ± 3.1 mV for WT Core-MT; 192.6 ± 3.8 mV for K0 Core-MT; 263.5 ± 4.0 mV for K2 Core-MT; and 167.5 ± 4.2 mV for K7 Core-MT. (f) Gating current traces of Core-MT and K0 in Core-MT mSlo1 channels. Voltage pulses were from −80 to 300 mV with 20 mV increments. (g) Normalized Q-V relation of on-gating currents. The smooth curves are fits to the Boltzmann function with a V0.5 and slope factor of 138.0 ± 3.1 mV and 51.3 ± 2.8 mV for Core-MT. and 154.7 ± 6.8 mV and 50.1 ± 5.6 mV for K0 on Core-MT.
-
Figure 6—source data 1
Data from electrophysiology experiments showing the G-V curves of the full-length and Core-MT WT, K0, K2 and K7 hSlo1 channels in 0 [Ca2+] as depicted in Figure 6c–e.
- https://cdn.elifesciences.org/articles/55571/elife-55571-fig6-data1-v3.xlsx
-
Figure 6—source data 2
Data from electrophysiology experiments showing Q-V relation of on-gating currents for full-length and Core-MT WT and K0 as depicted in Figure 6g.
- https://cdn.elifesciences.org/articles/55571/elife-55571-fig6-data2-v3.xlsx
Figure 7
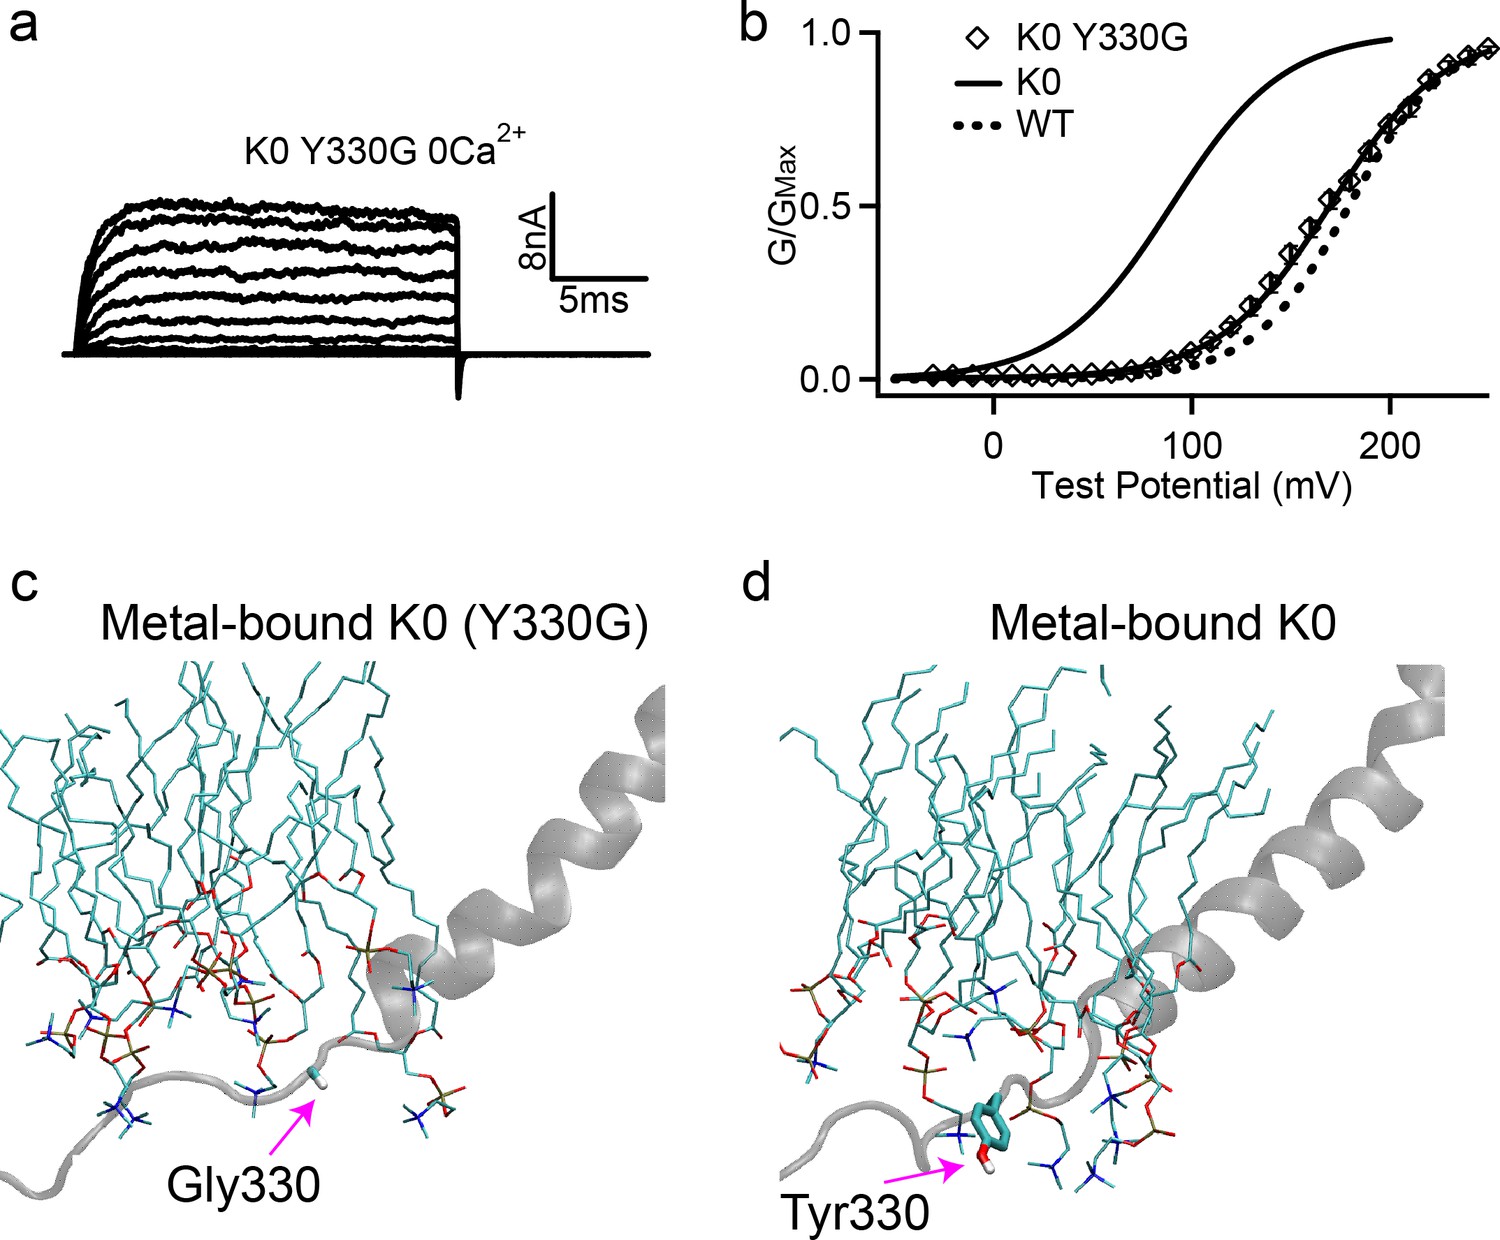
Removing Tyr sidechain in the K0 mutant full-length hSlo1 channel recovers WT-like voltage activation.
(a) Macroscopic currents of K0 (Y330G) mutant channel. The currents were elicited in 0 [Ca2+]i by voltage pulses from −30 to 250 mV with 20 mV increments. The voltages before and after the pulses were −50 and −80 mV, respectively. (b) The G-V curve in 0 [Ca2+]i, showing the recovery of activation voltage (V0.5) of the K0 (Y330G) to the WT level. The solid line was fit to the Boltzmann relation (see Materials and methods) with 169.8 ± 5.0 mV for the K0 (Y330G). The G-V curves of the full-length WT and K0 mutant channels are also shown for reference (solid and dash lines). (c-d) Representative molecular snapshots showing the effects of Y330G mutation in K0 channels. See Figure 4 caption for the details of molecular representations.
-
Figure 7—source data 1
Data from electrophysiology experiments showing G-V curves of the full-length K0 Y330G hSlo1 channels in 0 [Ca2+]i as depicted in Figure 7b.
- https://cdn.elifesciences.org/articles/55571/elife-55571-fig7-data1-v3.xlsx
Figure 8
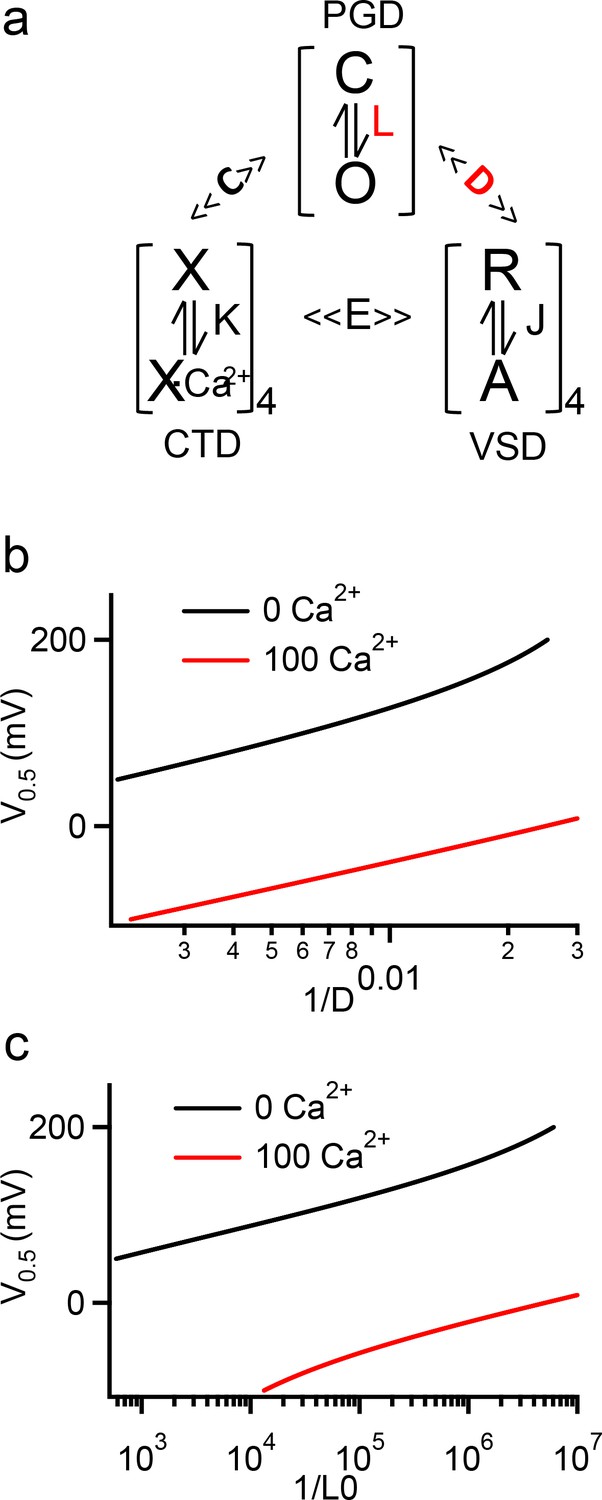
HA model simulation of V0.5 changes with D, L0 and [Ca2+]i.
(a) The HA model for BK channel activation, where L, J, and K are equilibrium constants to represent conformational changes in the PGD, VSD, and CTD domains respectively. D, C, and E are allosteric constants for coupling among the three domains. (b, c) Simulations of V0.5 vs 1/D (b) and 1/L0 (c) in 0 and 100 µM [Ca2+]i. The HA model parameters used here are from fittings to the WT BK channels (Zhang et al., 2014), with L0 = 3.5e-07, ZL = 0.18, ZJ = 0.59, VH = 159, C = 10.0, D = 48, E = 4.2 and KD = 18.0. The curves are plotted with only D (b) or L0 (c) varying, while all other parameters remain constant.
-
Figure 8—source data 1
Data for HA model simulation parameters and results as depicted in Figure 8b,c.
- https://cdn.elifesciences.org/articles/55571/elife-55571-fig8-data1-v3.xlsx
Tables
Table 1
C-linker scrambling mutations and measured V0.5 in the full-length at both 0 [Ca2+] and 100 μM [Ca2+] and Core-MT BK channels at 0 [Ca2+].
The Core-MT constructs are based on the TMD, C-linker of mSlo1, and an 11-residue tail from KV 1.4 of the mouse Shaker family (Budelli et al., 2013; Zhang et al., 2017). The location of the nearest Tyr to the S6 C-terminal is underlined. K0 (Y330G) was designed to remove the Tyr sidechain in the K0 background.
| Mutation | Sequence | V0.5 (mV) | ||
|---|---|---|---|---|
| Full-Length | Core-MT | |||
| 0 [Ca2+] | 100 [Ca2+] | 0 [Ca2+] | ||
| WT | EIIEL IGNRK KYGGS YSAVS GRK | 183.4 | 0.2 | 235.0 |
| K0 | EIIEL IGNRY GKGSK YSRAV SKG | 89.6 | −66.7 | 192.6 |
| K0(Y330G) | EIIEL IGNRG GKGSK YSRAV SKG | 169.8 | 47.5 | NM |
| K1 | EIIEL RIGNK YGGSY KSAVR KSG | 136.2 | −4.2 | NM |
| K2 | EIIEL IGRKN YKGGS YSARV SGK | 195.5 | 59.0 | 263.5 |
| K3 | EIIEL IGNYG GRSYS KAKVS RKG | NC | NC | NM |
| K4 | EIIEL IGRNY GGSYS AKKVR SKG | 94.6 | −50.4 | NM |
| K5 | EIIER LIGKK RNYKG GSYSA VSG | NC | NC | NM |
| K6 | EIIEL RKKIR KGNYG GSYSA VSG | NC | NC | NM |
| K7 | EIIEL IGNYG GSYSA VRKSK GRK | 48.7 | −63.7 | 167.5 |
| NC: no current, channel could not be expressed; NM: Mutation Not Made | ||||
Key resources table
| Reagent type (species) or resource | Designation | Source or reference | Identifiers | Additional information |
|---|---|---|---|---|
| Gene Mus musculus | mslo1 | GenBank GI: 47143 | ||
| Gene Mus musculus | Core-MT | Dr. Lawrence Salkoff | PMID:24067659 | |
| Biological sample (Xenopus laevis) | oocyte | Xenopus laevis | Xenopus laevis purchased from Nasco, Fort Atkinson, WI | |
| Commercial assay or kit | mMESSAGE T7 Transcription Kit | Thermo Fisher | AM1344 | |
| Software, algorithm | Igor Pro 4.0 | WaveMetrics | https://www.wavemetrics.com/products/igorpro | |
| Sequence-based reagent | For site-directed mutagenesis | This paper | PCR primers | PCR primers seq for mutations made in this study (each mutation utilized two primers: b and c). K0 b: gCtctGCTgTActtGgaCCCcTtgccgTaGCGGTTTCCTATTAACTC c: cCaagTAcAGCagaGcTgtctccAagggGCACATTGTAGTCTGTG K1 b: cTtGtAcgaCCCGccaTaCTTgttGccgatCcTTAACTCTATGATTTCAG c: ggCGGGtcgTaCaAgAGCGCtGTccGcaagAGcggGCACATTGTAGTCTG K2 b: gagTAGctaCCgCCcTtgTagTTcttgcgTCCTATTAACTCTATGATTTC c: gGGcGGtagCTActcCGCcagggtctcAgGAAAGCACATTGTAGTC K4 b: ctTAgcGGAGtaCgaGccTccgTaGtttcTTCCTATTAACTCTATGATTT c: gCtcGtaCTCCgcTAagaaGGTTAGgaGcAaAggGCACATTGTAGTCTGT K7 b: CTAacGGcGCtgtaGctTccCccGtaGTTTCCTATTAACTCTATG c: gCtacaGCgCCgtTAGgaaGagTaagGGAAGAAAGCACATTGTAG K0 on Core-MT b: gCtctGCTgTActtGgaCCCcTtgccgTaGCGGTTTCCTATTAACTC c: cCaagTAcAGCagaGcTgtctccAagggtGGAGTCAAGGAATCATTA K7 on Core-MT b: gaaGagTaagGGAAGAAAGGGAGTCAAG c: GAAGAAAGGGAGTCAAGGAATCAT K2 on Core-MT b: CCTTGACTCCtTTTCcTgagaccctgG c: gGAAAaGGAGTCAAGGAATCATTATG K0 Y330G b: GCCGccGCGGTTTCCTATTAACTC c: GAAACCGCggCGGCAAGGGGTCCAAG |
Additional files
-
Supplementary file 1
Effects of C-linker insertion/deletion mutations on the voltage required for half channel activation (V0.5) of hSlo1 in absence of Ca2+ and Mg2+ (data extracted from: Niu et al., 2004).
The position of insertion (S337) is colored red.
- https://cdn.elifesciences.org/articles/55571/elife-55571-supp1-v3.docx
-
Transparent reporting form
- https://cdn.elifesciences.org/articles/55571/elife-55571-transrepform-v3.docx
Download links
A two-part list of links to download the article, or parts of the article, in various formats.
Downloads (link to download the article as PDF)
Open citations (links to open the citations from this article in various online reference manager services)
Cite this article (links to download the citations from this article in formats compatible with various reference manager tools)
Aromatic interactions with membrane modulate human BK channel activation
eLife 9:e55571.
https://doi.org/10.7554/eLife.55571


